Beef January 2018 - GLOBAL MARKET SNAPSHOT - MLA

Page created by Charlie Murray
 
CONTINUE READING
Beef January 2018 - GLOBAL MARKET SNAPSHOT - MLA
GLOBAL
MARKET SNAPSHOT

Beef
January 2018
               MLA INDUSTRY INSIGHTS   i
Beef January 2018 - GLOBAL MARKET SNAPSHOT - MLA
MARKET SNAPSHOT
Beef
Contents
Australia                                                                                                                                                                 1

North America                                                                                                                                                            5

Japan                                                                                                                                                                   11

Korea                                                                                                                                                                  16

China                                                                                                                                                                 20

Taiwan                                                                                                                                                                24

Hong Kong – Red meat                                                                                                                                                  28

Indonesia                                                                                                                                                             33

South East Asia                                                                                                                                                       38

European Union                                                                                                                                                        42

MENA                                                                                                                                                                  47

© Meat & Livestock Australia, 2018. ABN 39 081 678 364. MLA makes no representations as to the accuracy of any information or advice contained in MLA’s Market
snapshot and excludes all liability, whether in contract, tort (including negligence or breach of statutory duty) or otherwise as a result of reliance by any person on such
information or advice. All use of MLA publications, reports and information is subject to MLA’s Market Report and Information Terms of Use. Please read our terms of use
carefully and ensure you are familiar with its content.

FOR FURTHER INFORMATION VISIT US ONLINE AT:
www.mla.com.au or email us at: marketinfo@mla.com.au                                        MLA INDUSTRY INSIGHTS                      January 2018            ii
Beef January 2018 - GLOBAL MARKET SNAPSHOT - MLA
MARKET SNAPSHOT                                                                       BEEF

                                                                           Australia
In recent years Australia’s economy has remained strong; however Australian consumers’ confidence is being weighed down by high household
debt and low wage growth. Disposable income has failed to grow with inflation and broadly rising living costs (electricity, childcare, rent), which
is impacting consumer purchasing behaviour around categories like fresh meat causing them to become more cautious and price sensitive.
However, overall Australians continue to be big consumers of meat, being the sixth largest per capita consumers of beef in the world (Source: OECD).
Beef consumption in Australia is facing some challenges and opportunities:
• The ‘premiumisation’ trend across both retail and foodservice           countries (where pork is the dominant protein), and an ageing
  channels highlights consumers are willing to pay more for the right      population who are avoiding red meat for health/functional/price
  offer. Fresh meat such as beef is a key category consumers are willing   reasons.
  to spend more on.                                                      •C ompetitive pressures will continue on beef with ongoing competitor
• Messaging around factors such as country of origin, environmental       marketing activity (particularly pork), aggressive pricing (chicken) and
  impact, animal welfare, health and safety, along with food integrity     the increasing profile of alternate proteins such as turkey and salmon.
  and transparency, provide opportunities to consider in consumer        •M aintaining value share will be challenging if beef’s price premium to
  communication.                                                           chicken/pork grows larger as the primary reason for consumers eating
• Australia’s changing demography provides some macro challenges          less red meat is currently due to cost and not health.
  for beef with two broad trends of increased migrations from Asian

  Population                                                                                                                                       Households earning*                                        Meat consumption
                                                                                                                                                                                                                         92.7kg per capita*2
                                                                                                                                                                                                                      total meat protein*3

                                                                                                                                                                        >US$35,000/year

                                              24.5                                                                                                        9.5                            10.5
                                                                                                                                                                                                                                                1.34
                                                                                                                                                                                                                                   1.16

                                                            in 2017                                                                                         in 2017                          in 2021
                                                                                                                                                                                                                                                       0.65 0.68
                                                                                                                                                                        >US$50,000/year                         0.58 0.63

                                                   25.7                                                                                                   7.9
                                                                                                                                                            in 2017
                                                                                                                                                                                           9.0
                                                                                                                                                                                             in 2021               Pork                Poultry                  Beef
                                                                                                                                                                                                                                                                                  0.21 0.24

                                                                                                                                                                                                                                                                              Sheepmeat
                                                            in 2021
                                                                                                                                                   In million households                                        2017            2021        In million tonnes cwt
  In million                                                                                                                                       Source: BMI Research, 2017 estimate & 2021 forecast        Source: BMI Research, OECD (2017 estimate, 2021 projection),
  Source: BMI Research, 2017 estimate & 2021 forecast                                                                                              * Disposable income                                        MLA

  Domestic utilisation                                                                                                                             Retail fresh meat share                                    Australian retail
  (share of produced volume)                                                                                                                                                                                meat price (¢/kg)
   ‘000 tonnes cwt
                                                                                                                                                                                                              2,000
                                                                                                                   1,881
                                                                                                                           1,888
                                                                                                           1,611
                                                   1,408

                                                                                                                                           1,492
                                                           1,390

                                                                                                   1,419
                                                                   1,411

                                                                                                                                   1,497
                                                                                   1,358
                                                                                           1,398
                                                                           1,370

                                                                                                                                                             2017                           2016
                                   1,357
                   1,362

                                           1,343
           1,407

                                                                                                                                                                                                               1,500
   1,329

                           1,246

                                                                                                                                                                                                               1,000
   0.58 0.63
                                                                                                                                                                                                                500
                                                   753

                                                                                   757
                                                           748

                                                                                                           736
                           720

                                                                                                   720
                                                                                           720
   705

                                           718
                                   721

                                                                           721

                                                                                                                   702
                                                                   705
                   701
           653

                                                                                                                                           652
                                                                                                                           646

                                                                                                                                                            Beef – 35%                      Beef – 36%
                                                                                                                                   614

                                                                                                                                                            Chicken – 27%                   Chicken – 26%
                                                                                                                                                            Lamb – 14%                      Lamb – 14%            0
                                                                                                                                                            Pork – 13%                      Pork – 12%
   2000
    2001
   2002
   2003
   2004
   2005
   2006
   2007
                                                                   2008
                                                                   2009
                                                                    2010
                                                                     2011
                                                                    2012
                                                                    2013
                                                                    2014
                                                                    2015
                                                                    2016
                                                                   2017e

                                                                                                                                                                                                                       Jul-01

                                                                                                                                                                                                                                       Jul-05

                                                                                                                                                                                                                                                       Jul-09

                                                                                                                                                                                                                                                                         Jul-13

                                                                                                                                                                                                                                                                                          Jul-17

                                                                                                                                                            Other – 2%                      Other – 2%
                                                                                                                                                            Seafood – 9%                    Seafood – 8%
                                                                                                                                                            Turkey – 1%                     Turkey – 1%
      Domestic consumption                                                         Exports                                                                  Veal – 0%                       Veal – 0%           Beef            Lamb            Chicken           Pork
  Source: ABS, MLA estimates                                                                                         e = estimate                 Source: Nielsen Homescan, MAT to 04/11/2017 vs year ago    Source: Source: ABARES, calculated using ABS data

  Single person households                                                                                                                         English only spoken at home                               Median age in Australia
                                                                                                                                                                                                           

                                                                                                            2.8 million                                          76.8%
                                                                                                                                                                                             72.7%
            2.1 million
                                                           2.3 million                                                                                                                                                   34                        37                             41.5
                                                                                                                                                                                                                        years                      years                          years

                   2015                                            2016                                            2026f                                         2011                        2016
                                                                                                                                                                                                                1995             2016             2050f
  Source: ABS                                                                                                                                      Source: ABS                                               Source: ABS, BMI

© Meat & Livestock Australia, 2018. ABN 39 081 678 364. MLA makes no representations as to the accuracy of any information or advice contained in MLA’s Market snapshot and excludes all liability,
whether in contract, tort (including negligence or breach of statutory duty) or otherwise as a result of reliance by any person on such information or advice. All use of MLA publications, reports and
information is subject to MLA’s Market Report and Information Terms of Use. Please read our terms of use carefully and ensure you are familiar with its content.

FOR FURTHER INFORMATION VISIT US ONLINE AT:
www.mla.com.au or email us at: marketinfo@mla.com.au                                                                                                                                            MLA INDUSTRY INSIGHTS            Australia             January 2018                  1
Beef January 2018 - GLOBAL MARKET SNAPSHOT - MLA
What things do                  What are attributes       What key strengths

  Consumers
                                                                                       consumers look for              that are important        does beef have?
                                                                                       on pack/on shelf                for Australian
                                                                                       when buying beef?               consumers?
•	
  Australian consumer demand for beef is impacted by many                                                              (all protein)
  factors, such as demographic shifts, income growth and                                                               Is my/my family’s         Is the most superior
  changes in people’s attitudes and beliefs towards food from                          Colour of meat
                                                                                                                       favourite meat            meat
  family, friends and the media.
                                                                                                                       Is easy and               Is an essential part
• O
   verall awareness of beef is high among Australians, with                           Price per kg                    convenient to             of a healthy diet for
  average consumption being around two serves a week (slightly                                                         prepare                   growing children
  less than chicken) (Source: MLA Global Consumer Tracker Australia, 2017).
                                                                                                                       Is the most superior      Can be used in many
  Protein image profiles                                                               Date packed
                                                                                                                       meat                      different meals

                                                                                                                                                 Consistent quality
                                                                                       Freshness                       Tastes delicious
                                                                                                                                                 standards
                                   Beef         Lamb   Chicken      Pork   Seafood
                                                                                                                       Consistent quality
  Easy everyday                                                                      Use by date
                                                                                                                       standards
                                                                                                                                                 Tastes delicious

                                                                                       Source: MLA Global Consumer Tracker Australia, 2016

  Goodness                                                                  
                                                                                              Australia’s increasingly diverse population
  A little bit special                                                                      High levels of immigration are driving Australia’s
                                                                                              population growth and also leading to a more
  Source: MLA Global Tracker                                                                  increasingly diverse population. In the most recent ABS
  * Tick = Area of strength vs other proteins                                                 survey it showed that more than a quarter of Australia’s
•	Beef’s strengths are around its perception of being a ‘trusted                             residents are now born overseas, and for the first time
   quality’. It is also perceived as ‘easy everyday’ when compared                            in Australia’s history, the majority of these people born
   to other proteins, such as lamb, seafood and pork, but is behind                           abroad are from Asia rather than Europe. This is leading
   chicken on this measure (Source: MLA Global Consumer Tracker Australia, 2017).             to foodservice and retailer operators looking at adjusting
                                                                                              in-store/menu space that better targets these changing
•	There is an opportunity to increase beef’s appeal by reinforcing                           demographics.
   quick, easy and convenient ways that it can be prepared for
   everyday healthy meals (Source: MLA Global Consumer Tracker Australia, 2017).
•	When consumers are shopping for beef, the key information                         •	
                                                                                       As the retail price of red meat has trended upwards since 2013,
   they look for on the pack relates to price and then freshness                       consumers claim price to be the main reason for eating less red
   (meat colour, use-by date), followed by elements such as                            meat, above health or animal welfare/environment concerns (see
   natural, hormone-free and animal welfare (Source: MLA Global Consumer               figure below).
   Tracker Australia, 2017).
                                                                                     •	
                                                                                       Despite beef’s price premium to many other proteins it remains a
•	Research by Roy Morgan into Australian Food Attitudes from                          very popular meat choice with Australians, being the sixth largest
   2006 to 2016 highlights some key trends that beef messaging                         per capita consumers of beef in the world (Source: OECD).
   can leverage with now almost three quarters of the population
   (72%) saying they enjoy food from all over the world (up from                       Main reason for eating less red meat
   65% in 2006). Food without additives in it has also become
   increasingly popular along with a preference for taste over                                                                                                           50
                                                                                       50
   ingredients. Interestingly some of the health-orientated dietary
   concerns such a low fat diet has dropped (Source: Roy Morgan).
                                                                                       40
                                                                                               34
        Rising costs of living                                                                 33
                                                                                       30
        Australian consumers are paying higher prices for
        utilities, childcare, health and education, which in turn                                                                                                        20
                                                                                       20
        is contributing to more cautious consumer spending on
                                                                                               13
        food and grocery items according to recent research
                                                                                               10
        commissioned by Coles. Coles CEO John Durkan has                               10
                                                                                                                                                                         8
                                                                                               6
        come out and said Coles customers, particularly in lower                                                                                                         7
                                                                                               2
        socio-economic areas, are shifting from buying premium                         0
        products to the supermarket giant’s own range of private                                Feb’10 Dec’10         Jun’12     Jun’13 Jun’14 Jun’15 Jun’16 Jun’17
        label products, and are spending less on fresh produce                                 (n=224) (n=313)       (n=316)    (n=175) (n=290) (n=292) (n=376) (n=437)
        and fresh meat, despite relatively low food and grocery
        price inflation over the same period.
                                                                                            Too expensive Health concerns
                                                                                            Concerned about treatment of animals             Don’t like the taste anymore
                                                                                            Environmental concerns (any) Other
                                                                                       Source: Pollinate/MLA

             2    MLA INDUSTRY INSIGHTS                Australia   January 2018
Beef January 2018 - GLOBAL MARKET SNAPSHOT - MLA
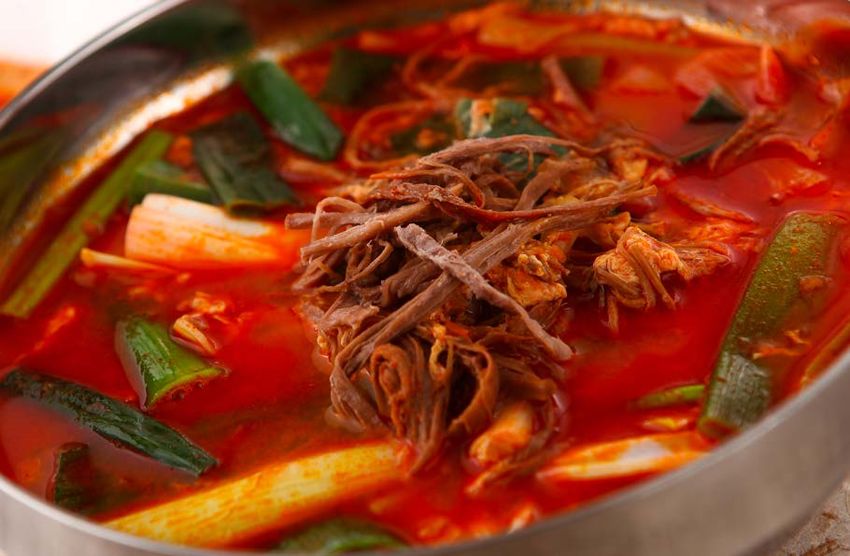
Place of fresh meat purchase by average weekly customer
                                                                                             spend and market share

  Retail                                                                                      Place of purchase                             Average
                                                                                                                                       customer spend
                                                                                                                                                                 Value market
                                                                                                                                                                     share ($)
•	
  Beef had the highest share of retail sales of any meat in 2016-                              Butcher                                                  $37                 23.5%
  17, with around 36% share of fresh meat sales (by value) (Source:
  Nielsen Homescan).                                                                           Market/Delicatessen/
                                                                                                                                                        $34                  9.4%
                                                                                               Other
• It is a critical category for retailers with the average grocery
                                                                                               Woolworths/Safeway                                       $27                 26.4%
   basket value typically worth $45, it jumps to around $80 when
   the basket includes fresh meat/seafood (Source: Nielsen).                                   Coles                                                    $25                 23.2%

  Grocery retail market shares – 2017                                                          Aldi                                                     $22                  7.6%
                                                                                               IGA                                                      $22                  5.4%
                                                                                             Source: Roy Morgan Jan-Dec 2015, quoted in press release Feb 2016
                                     Woolworths – 37%
                                     Wesfarmers (Coles) – 29%                              • T
                                                                                              he Australian grocery market is highly concentrated by global
                                     Aldi – 7%                                               standards, with the two big retailers making up over 60% of
                                     Seven & I Holdings – 3%                                 the market. Coles, Woolworths and IGA all have a broad and
                                     Other – 24%                                             significant national footprint, with Aldi currently catching up
                                                                                             through expansion into the western states and increasing store
  Source: IGD
                                                                                             counts on the East Coast.
                                                                                              Key facts about major Australian grocery retailers
  Main supermarket of purchase – beef
                                                                                           •	Strong competition has continued in the Australian grocery
                                                                                              market in 2017 with the ongoing growth of Aldi and Costco
                                                                                              placing pressure on all retailers with price emerging as a core
                                     Coles – 43%
                                     Woolworths/Safeway – 42%
                                                                                              strategy across the board.
                                     Aldi – 10%                                            •	Woolworths: Food sales experienced a strong turn-around
                                     IGA – 2%                                                 this year with revenue growing +4.5% in 2017 (Source: Woolworths).
                                     Other – 3%                                               Key developments behind this improved performance has
                                                                                              been a focus on store refurbishment and trialling new formats.
                                                                                              Woolworths has also continued to invest in price with annual
  Source: MLA Global Consumer Tracker Australia, 2017
                                                                                              deflation at 2.1% (Source IGD).
•	There is an increasing focus on convenience options with                                • Coles: Food and liquor sales were up +2.0% year-on-year in
   supermarkets expanding their ready-to-eat meal range and                                   2017 behind Woolworths for the first time in recent years. Its
   convenience stores trialling new formats (i.e. Caltex’s ‘The                               continued ‘Down Down’ price strategy has led a food and
   Foodary’) and new promotions (i.e. 7-Eleven’s Friday $2 Pie                                liquor deflation of 0.8% for 2017 (Source: Coles).
   Day). These retailers are all targeting this key shopper trend
   and seeking incremental sales that might otherwise have gone                            • IGA (Metcash): Supermarket sales continued to capture
   through the foodservice channel.                                                           low growth in 2017 up +1.3% on last year. Broadly Metcash
                                                                                              have lagged behind the growth of Coles and Woolworths in
•	Premiumisation trend is growing within retail and red meat                                 recent years as the competition, especially around price has
   is well positioned with meat as a category being Australian                                intensified (Source: IGD).
   consumers top choice when considering a higher price tag.
   Just under one-in-three consumers (30%) in Australia would                              •	Aldi: Rapid expansion has continued at Aldi and is forecast to
   consider spending more on a premium meat offering (Source:                                 operate 590 stores nationwide by 2021. It experienced the
   Nielsen Global Online Survey on Premiumisation).                                           largest growth (albeit off a smaller base) out of the four majors
                                                                                              with a +12% increase in sales year-on-year (Source: IGD). Aldi is
  Top upgradable grocery categories – Australia                                               seeking to attract new customers with a widening range and a
                                                19%                                           better fresh food offering.
                     % of consumers that would consider buying a premium offering          •	Costco: Sales grew +15% as Costco plans to continue opening
                     (spending more than the average price) in these grocery categories
                                                                                              more new stores moving forward increasing from its current
                                                                                     54%
  Meat/seafood                                                      30%             30%       nine stores to 15 by 2021 (Source: IGD). The focus is on having a
                                                                                              complete food and general merchandise offer in one place,
                                                                              28%
  Coffee and tea                                               28%                            which is often sold in bulk.
                                                                 39%
  Dairy products                                        23%         23%
                                                                                                   The changing face of food retail
                                                          28%19%
  Hair care                                     19%
                                                                                                   The retail sector in Australia is expected to undergo
  Eggs                                                        19%                                  some significant change in the near future with the rapid
                                                                                                   increase in Woolworths and Coles sales though their
                                                                                                   online channels, Amazon Marketplace’s launch and
  Source: Nielsen Homescan Grocery E-Commerce Survey
                                                                                                   anticipated entry of new retailer Kaufland (operated by
                                                                                                   the world’s fourth largest retailer, Germany’s Schwarz
         There is a growing food box meal kit trend in Australia                                   Group). We are also seeing some changes in approach
         (such as Hello Fresh, Marley Spoon and Aussie Farmers                                     from current retailers with David Jones opening a
         Direct). These generally include portioned ingredients                                    premium food hall in Bondi Junction and Costco and
         and simple recipes that allow consumers to quickly                                        Metcash both launching new services into the online
         create their meal. They now capture 0.8% of the online                                    space. Costco has introduced a B2B delivery service in
         grocery market (Source: Nielsen Homescan Grocery E-Commerce Survey).                      Melbourne and Metcash flagging a new digital portal in
                                                                                                   2018 called IndieDirect.

                                                                                                    MLA INDUSTRY INSIGHTS                 Australia      January 2018   3
Beef January 2018 - GLOBAL MARKET SNAPSHOT - MLA
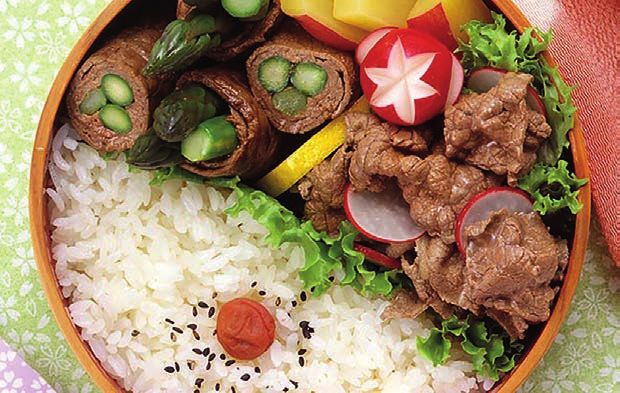
Foodservice                                                                                                Favourite international cuisine types

•	Beef is the third most popular fresh meat protein consumed
                                                                                                                 80
   through the foodservice channel after chicken and seafood
   (Source: RIRDC/Fresh Agenda).                                                                                 70

•	The Australian foodservice sector is a key channel for beef                                                   60
   and sources approximately 28% of our domestic beef and veal
                                                                                                                 50
   supply (Source: RIRDC/Fresh Agenda).
                                                                                                                 40

                                                                                                            %
•	The foodservice landscape is large, and competitive, with
   around 87,000 places to eat out, dominated by quick service                                                   30
   restaurants (QSR), cafes, and casual dining restaurants.
                                                                                                                 20
   Generally, it is highly fragmented, with many individual
   companies having small market share, exceptions include QSRs                                                  10
   and institutional channels such as hospitals and aged care.
                                                                                                                  0
•	Australians eat out an average of two to three times a week,

                                                                                                                                                                                                   Lebanese
                                                                                                                                                                       Japanese
                                                                                                                         Chinese

                                                                                                                                                             Mexican

                                                                                                                                                                                                              French
                                                                                                                                                                                          Asian*
                                                                                                                                                                                  Greek
                                                                                                                                   Italien

                                                                                                                                                    Indian
                                                                                                                                             Thai

                                                                                                                                                                                          Other
   with the foodservice market growing at a moderate pace in
   recent years averaging 2-3% growth annually. This is largely
   being driven by rising transaction prices, following the
                                                                                                                Source: Roy Morgan Single Source (Australia), Jan-Dec 2015 (n=15,367)
   ‘premiumisation’ of food offerings across most channels (Source:                                             * Other Asian includes Vietnamese, Indonesian, Malaysain, Korean, etc
   GlobalData).

    Foodservice channels: Outlets number and values (% of total)
                                                                                                                       Food delivery apps having an impact
    40
    35                                                                                                                 The four largest food delivery apps in Australia are
    30                                                                                                                 UberEATS, Deliveroo, Menulog and Foodora with an
    25                                                                                                                 estimated combined market share of 75% (Source IBIS).
    20                                                                                                                 These food delivery apps have been a contributor
%

    15                                                                                                                 to the growth in the foodservice sector and are
    10                                                                                                                 now establishing partnerships with the major QSRs
     5                                                                                                                 (McDonalds has partnered with UberEATS and KFC
     0                                                                                                                 Foodora). A Sensis eBusiness survey of 800 Australian
         Quick service     Full service   Pub, club    Coffee & tea Accomodation         Other                         consumers has found that nearly-half (47%) of shoppers
          restaurant        restaurant     & bar          shop
                                                                                                                       are now buying take-away online, up from 36% 12
        Number of outlets            Value                                                                             months ago. This is driving two key trends some
    Source: GlobalData                                                                                                 restaurants are changing to cater to this delivery channel
                                                                                                                       (specific menus and store format), while others such
•	
  Over 80% of foodservice sales in Australia will go through                                                           as fine dining restaurants, are focusing on ensuring
  either a quick service restaurants (QSR), a full service restaurant                                                  customers continue to come in for seated meals by
  (FSR) or a pub, club and bar.                                                                                        offering unique dining experiences.
•	
  Within foodservice beef has strong volume share in FSR and
  takeaway along with institutions (such as aged care & hospitals)
  and has opportunity in the event/leisure space.                                                            •	
                                                                                                               There are many factors that contribute to the choice to eat out
                                                                                                               or not, mostly occasion-based i.e. where and when the meal
•	
  A key trend for beef has been the emergence of fast casual                                                   takes place, and with whom. Having children in the household
  outlets that have forced up expectations of consumers. This                                                  indicates a higher level of eating out, as well as influencing
  trend has created a race among traditional QSR operators                                                     choice of venue and choice of meal. When it comes to where
  to “premiumise” their brands and offering – this includes the                                                to go, convenience, value and familiarity are key, which partly
  removal of additives, introduction of natural ingredients and                                                explains the rise of QSRs, supermarket meals-to-go, and other
  updated outlet decors (Source: GlobalData).                                                                  casual dining options.

          Modern Australian dinner parties
          A recent study conducted by Galaxy Research on
          behalf of MLA has highlighted some new trends for
          Australian dinner parties with 32% attending parties
          where everyone helps cook a culturally diverse meal.
          The majority of hosts (61%) also now plan their menu
          based on their guests’ dietary needs (with 20-25% of
          hosts catering to gluten and dairy intolerances).

•	Australia is often referred to as a ‘takeaway nation’ with 48%
   of consumers having eaten a takeaway in the past week. This
   number is expected to increase with the emergence and
   continued growth of numerous food delivery companies that
   open up the ability of FSR operators to outsource delivery.
    (Source: GlobalData)

          © Meat & Livestock Australia, 2018. ABN 39 081 678 364. MLA makes no representations as to the accuracy of any information or advice contained in MLA’s Market snapshot and excludes all liability,
          whether in contract, tort (including negligence or breach of statutory duty) or otherwise as a result of reliance by any person on such information or advice. All use of MLA publications, reports and
    4     information is subject to MLA’s Market Report and Information Terms of Use. Please read our terms of use carefully and ensure you are familiar with its content.
Beef January 2018 - GLOBAL MARKET SNAPSHOT - MLA
MARKET SNAPSHOT                                                                               BEEF

North America                                                                                                                                                       (US, Canada & Mexico)
                                        UNITED STATES (US) – The United States is the largest consumer of beef globally, with its total consumption up in
                2017, after a long term decline. Despite the recent decrease of Australian beef shipments to the US, it remains one of the main
                destinations for Australian beef in volume and value terms, and is also a growing market for Australian chilled grassfed beef.
Challenges and opportunities in the US for Australian beef include:
• Although frozen manufacturing accounts for a large proportion of • Australian beef exports to the US have decreased slightly in 2017
  Australian beef exports to the US, the valuable chilled sector is         (down 3%, to 234,112 tonnes swt). This drop has been driven by
  gradually taking a greater volume share of exports, representing          tight supplies of Australian cattle partnered with increased US
  27% of total exports in 2017 compared to 15% in 2012.                     beef production, and higher imports from North America Free
• Grassfed beef is a key growth area in both retail and foodservice.       Trade Agreement (NAFTA) partner’s countries – Canada and
  Its growing profile in the US has been on the back of strong              Mexico.
  demand by consumers who perceive it as better for the
  environment and the welfare of animals, along with it being more
  natural.

  Population                                                                                                             Households earning*                                                  Households earning*
                                                                                                                        >US$35,000/year                                                     >US$50,000/year

  324.5 333.8    in 2017                                                             in 2021
                                                                                                                             74.1 82.0
                                                                                                                                   in 2017                         in 2021
                                                                                                                                                                                                 51.5 59.6
                                                                                                                                                                                                       in 2017                          in 2021

  In million                                                                                                             In million households                                                In million households
                                                                                                                         Source: BMI Research, 2017 estimate & 2021 forecast                  Source: BMI Research, 2017 estimate & 2021 forecast
  Source: BMI Research, 2017 estimate & 2021 forecast
                                                                                                                         * Disposable income                                                  * Disposable income

  Australian beef exports –                                                                                              Australian beef exports –                                            Proportion of key cuts
  volume                                                                                                                value                                                               

                                                                                                                                                                                                                                Manufacturing – 63%
                                                                      Chilled grass – 25%
                                                                                                                                                                                                                                Fullset – 9%
                                                                      Chilled grain – 2%                                                                   Chilled – 35%
                                                                                                                                                                                                                                Topside/inside – 8%
                                                                      Frozen grass – 72%                                                                   Frozen – 65%
                                                                                                                                                                                                                                Thin flank – 6%
                                                                      Frozen grain – 1%
                                                                                                                                                                                                                                Other – 15%

  Total 234,112 tonnes swt                                                                                               Total A$1,660.5 million
  Source: Department of Agriculture and Water Resources (DAWR)                                                           Source: ABS/GTA. MAT (Moving Annual Total) November 2016 to          Source: DAWR, CY 2017
  CYTD 2017                                                                                                              October 2017

  Chilled grassfed beef                                                                                                  US meat consumption                                              122.1 kg per capita*
  exports to the US                                                                                                                                                                      total meat protein**
                                                                                              74,260
                                                                                     63,107

                                                                                                                                                                         19.1
                                                                                                                58,318

                                                                                                                                                          17.8                     37.1 kg per capita*
                                                                                                       53,393

                                                                                                                                                                                       12.0          12.6                                            2017
                                                                                                                             9.7          10.1
                                                                                                                                                                                                                                                     2021
                                                                            33,348
                                                                   29,812
                                   26,825
            25,229

                                                          23,744
   21,128

                                            2010 20,630

                                                                                                                                                                                                                    0.14   0.14
                     2008 21,677

                                                                                                                                   Pork                        Poultry                        Beef                   Sheepmeat
   2006

            2007

                                   2009

                                                          2011

                                                                   2012

                                                                            2013

                                                                                     2014

                                                                                              2015

                                                                                                       2016

                                                                                                                2017

  In tonnes swt                                                                                                          In million tonnes cwt
  Source: DAWR                                                                                                           Source: BMI Research, OECD                                       * 2017e per person per year    ** Excluding fish/seafood

© Meat & Livestock Australia, 2018. ABN 39 081 678 364. MLA makes no representations as to the accuracy of any information or advice contained in MLA’s Market snapshot and excludes all liability,
whether in contract, tort (including negligence or breach of statutory duty) or otherwise as a result of reliance by any person on such information or advice. All use of MLA publications, reports and
information is subject to MLA’s Market Report and Information Terms of Use. Please read our terms of use carefully and ensure you are familiar with its content.

FOR FURTHER INFORMATION VISIT US ONLINE AT:
www.mla.com.au or email us at: marketinfo@mla.com.au                                                                                                          MLA INDUSTRY INSIGHTS                  North America          January 2018             5
Beef January 2018 - GLOBAL MARKET SNAPSHOT - MLA
Consumers                                                                                Foodservice
•	
  US beef consumption has recovered slightly in 2017 after a                             • M
                                                                                             anufacturing beef for burgers and other processed beef
   period of long-term decline. This is being strongly driven by                            products make up a large proportion of Australian beef sold
   higher US beef production which is forecast to continue in                               into the foodservice sector in the US, while chilled grassfed
   2018.                                                                                    beef is largely destined for full service restaurants and retail.
•	
  The majority of US consumers would consider buying imported                              Chicken and beef drive US protein menuing
   beef and are aware of grassfed beef. Nine out of 10 would
   consider buying grassfed beef.                                                            100

•	
  Australian grassfed beef awareness and consumption is
   higher in New York, Washington DC, Boston, Florida and San                                 80
   Francisco. Purchasers of grassfed beef are interested in quality
   and ‘naturally’ raised beef, with concern for animal welfare                               60

                                                                                          %
   and environmental sustainability also majors factor considered
   when purchasing beef (Source: MLA Global Tracker, 2017).                                   40

  Awareness of types of beef                                                                  20

   Grassfed beef                                                                78%
                                                                                                0
   Organic beef                                                          66%

                                                                                                     Chicken

                                                                                                               Beef

                                                                                                                      Bacon

                                                                                                                              Prawn

                                                                                                                                      Pork

                                                                                                                                             Ham

                                                                                                                                                   Fish

                                                                                                                                                          Turkey

                                                                                                                                                                   Salmon

                                                                                                                                                                            Tuna

                                                                                                                                                                                   Seafood

                                                                                                                                                                                             Scallop

                                                                                                                                                                                                       Calamari

                                                                                                                                                                                                                  Lobster

                                                                                                                                                                                                                            Lamb

                                                                                                                                                                                                                                   Duck
   Hormone-free beef                                               59%
   Grainfed beef                                                   58%
   None of these               8%                                                           Source: Dataessential, beef and lamb menu analysis, 2017

  Source: MLA Global Consumer Tracker US, 2017                                            •	
                                                                                            Although grassfed beef is most common in casual dining and
•	
  Australia is well placed to meet the demands for quality and                              fine dining restaurants, its growth is solid across all segments,
  animal welfare with superior food safety, traceability protocols                          particularly midscale*1 and fast casual*2 restaurants (Source:
  and unique quality grading system, Meat Standard Australia                                DataEssential, beef and lamb menu analysis 2017).

  (MSA).                                                                                    Grassfed beef - penetration by restaurant segments
  Attributes important for all proteins and beef associations
                                                                                               Quick service                          0.5% (+214%)
  What attributes are important What associations do                                           restaurant
  for US consumers (all         consumers have to grassfed                                     Fast casual                                                                  1.5% (-247%)
  proteins)?                    beef?
                                                                                               Midscale                                        0.8% (-323%)
  My/my family’s favourite                       Better for the animals                       Casual dining                                                                                               2.3%             (+141 %)
  Most superior                                  Naturally raised                             Fine dining                                                                                        2.1%              (+16%)
                                                                                               All                                                                  1.4%           (+141%)
  Guaranteed safe to eat                         Better quality

  Essential part of children’s diet              Better for my health                      (Bracket percentage) = 4 year % change 2016 vs. 2012
                                                                                            Source: Dataessential, beef and lamb menu analysis, 2017
  Consistent quality standards                   Better for the environment
                                                                                          •	
                                                                                            The US foodservice segment is set to continue growing in the
  Source: MLA Global Consumer Tracker US, 2016 and 2017
                                                                                            coming years, with more transactions and consumers spending
                                                                                            driving strong growth. Outlet numbers are forecast to stagnate,
                                                                                            demonstrating the maturity of the US foodservice market (Source:
                                                                                            Global Data – US the future of foodservice 2021).

                                                                                            Outlet numbers and value channel by key foodservice
                                                                                            channel (% out of total)

                                                                                                40
                                                                                                35
                                                                                                30
                                                                                                25
                                                                                                20
                                                                                            %

                                                                                                15
                                                                                                10
                                                                                                 5
                                                                                                 0
                                                                                                               QSR             FSR           Education      Service Healthcare Pub, club                                      Other
                                                                                                                                                             station            & bar
                                                                                                                                                           foodcourt

                                                                                               Number of outlets                             Value
  Source: MLA                                                                               Source: GlobalData, 2017 estimate

                                                                                            * 1 Midscale: waiter service at a moderate price; often breakfast focused and generally no alcohol
                                                                                            * 2Fast casual: counter service with focus on higher quality, fresh ingredients and customisation

           6    MLA INDUSTRY INSIGHTS                 North America        January 2018
Beef January 2018 - GLOBAL MARKET SNAPSHOT - MLA
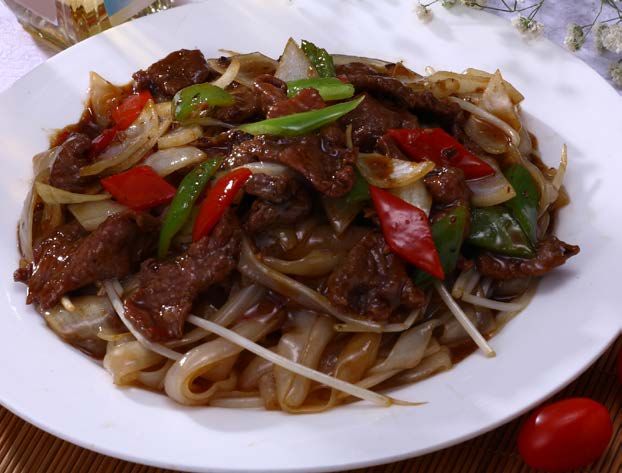
Retail                                                                                Other suppliers
• Although
          the grassfed beef retail segment in the US is relatively           •	
                                                                                 The main competitors for Australian beef in the US market are the
  small, demand for higher value chilled grassfed beef is                        US domestic beef, Canada, Mexico and New Zealand. Smaller
  increasing. Some of the most popular cuts include ground and                   suppliers include Uruguay and Nicaragua which have access to
  steak cuts like tenderloin, striploin and rib eye.                             smaller quotas.
                                                                               •	
                                                                                 Australia maintains its preferred access status to the US, only
                                                                                 behind NAFTA partners (Canada and Mexico – with no quota
                                                                                 restrictions). New Zealand has a quota of 213,402 tonnes with an
                                                                                 out-of-quota tariff of 26.4%.
                                                                               •	
                                                                                 In June 2017, the U.S. Department of Agriculture (USDA)
                                                                                 announced the immediate suspension of fresh beef imports from
                                                                                 Brazil, as shipments failed food safety tests. The decision will
                                                                                 remain in place until satisfactory corrective actions are taken.
                                                                                         US beef imports by market share – 2017*

                                                                                                                             Australia – 24%
                                                                                                                             NZ – 19%
                                                                                                                             Canada – 26%
                                                                                                                             Mexico – 22%
• In
   the retail sector, supermarkets are the main purchase
                                                                                                                             Uruguay – 3%
  channel for Australian grassfed beef. However, limited ‘country
                                                                                                                             Nicaragua – 5%
  of origin’ labelling at point of purchase is challenging for                                                               Other – 2%
  Australian product to be differentiated in the sector.
                                                                                         Source: GTA * YTD Jan-Nov
  Where do shoppers buy Australian beef – 2017
                                                                                         US beef Imports by major supplier

                                              Supermarkets – 65%                             1200                                                                           7
                                              Club warehouse – 9%
                                                                                             1000                                                                           6
                                              Butcher – 14%
                                              Online – 6%                                                                                                                   5
                                                                               ‘000 tonnes swt

                                                                                                 800
                                              Other – 6%
                                                                                                                                                                            4

                                                                                                                                                                                 US$/kg
                                                                                                 600
                                                                                                                                                                            3
  Source: MLA Global Tracker US, 2017
                                                                                                 400
                                                                                                                                                                            2
• Interestingly,
               Trader Joe’s and Whole Foods shoppers are
                                                                                                 200                                                                         1
  more likely to know the origins of their grassfed beef than the
  average supermarket shopper, representing an opportunity for                                    0                                                                         0
  Australian beef to increase origin awareness and preference.
                                                                                                       2012

                                                                                                               2013

                                                                                                                           2014

                                                                                                                                      2015

                                                                                                                                               2016

                                                                                                                                                          2016
                                                                                                                                                          YTD*

                                                                                                                                                                     2017
                                                                                                                                                                     YTD*
• Australian
                grassfed beef is seen to provide the highest quality
                                                                                                 Australia    NZ    Canada     Mexico      Uruguay               Nicaragua
  steak amongst imported product, with Costco and Whole
                                                                                                 Other          Average import price (RHS)
  Foods the most trusted sources for high quality steak (Source: MLA
  Global Tracker, 2017).                                                                 Source: GTA
                                                                                         *CYTD: calendar year to Jan-Nov

  Motivation to choose and eat beef
  Important themes ranked by relative importance

     Freshness

     Safety

     Value

     Natural                                                             1.7

     Nutrition

     Environmental

     Origin

     Recipes

     Halal

  Source: MLA Global Consumer Tracker, 2017

                                                                                         Source: MLA

                                                                                       MLA INDUSTRY INSIGHTS                      North America       January 2018    7
Beef January 2018 - GLOBAL MARKET SNAPSHOT - MLA
US – Market access overview
  Trade agreements                        Import tariffs                             Competitors                    Volume restrictions             Technical access
  Australia-United States                 Zero within quota                          Canada and Mexico              Australia to US – 423,214       E. coli and Salmonella
  Free Trade Agreement                    (17.6% above quota)                        NAFTA, no quota                tonnes swt                      sampling programs, label
  (AUSFTA)                                                                                                                                          approvals and port mark
                                                                                                                                                    compliance

Best access                                                                                                                                                    Major challenges
Source: Trade agreements DFAT, MLA

Australian beef exports to US – summary table
Volume – in tonnes swt                                                    2017        % out               2016     % out      5-year average     % out     change 2017 vs 5-yr av.
                                                                                     of total                     of total       (2012-2016)    of total
                                                                                                                                                                %    in tonnes swt

                              Total                                  234,112            100         242,013          100           298,533         100        -22        -64,421
                              Chilled                                  63,741            27              61,364       25             57,793          19        10          5,948
 Storage
                              Frozen                                  170,372            73         180,649           75            240,740          81       -29        -70,369
                              Grassfed                                227,158            97         232,242           96            289,916         97        -22        -62,758
 Meat type
                              Grainfed                                  6,954              3              9,770         4              8,617          3       -19          -1,663
                              Chilled grassfed                         58,318            25          53,393           22             50,784          17        15           7,534
                              Chilled grainfed                          5,423              2              7,971         3             7,009           2       -23          -1,586
 Storage/meat type
                              Frozen grassfed                        168,840             72         178,850           74            239,132         80        -29        -70,292
                              Frozen grainfed                            1,531              1             1,799          1            1,608            1       -5             -77
Source: DAWR

Value – in A$ 000                                                                                                                                               %       in A$ 000

                              Total                             1,660,507 *             100        1,726,972         100         1,853,385         100        -10       -192,878
                              Chilled                              584,649*              35         592,356           34            508,140         27         15         76,509
 Storage
                              Frozen                              1,075,859*             65         1,134,616         66          1,345,245         73        -20       -269,387
Source: ABS/GTA. 2017* = Moving Annual Total (MAT), November 2016 to October 2017.

Australian beef exports to US – by major cut                                                                                                                    %    in tonnes swt

Volume – in tonnes swt

 Manufacturing                                                        147,275            63         150,679           62           200,523          67         -27       -53,248
 Fullset                                                              20,835               9             6,979          3              1,397          0       1391        19,438
 Topside/inside                                                        18,065              8             18,431         8            20,105           7        -10        -2,040
 Thin flank                                                            13,905              6             19,861         8           22,629            8        -39         -8,724
 Silverside/outside                                                     8,667              4             10,728         4            13,479           5        -36         -4,813
 Other                                                                25,365               11        35,335            15            40,401          14        -37       -15,035
 Total                                                               234,112            100         242,013          100           298,533         100        -22        -64,421
Source: DAWR

Australian beef exports to Canada – by major cut                                                                                                                %    in tonnes swt

Volume – in tonnes swt

 Manufacturing                                                         13,425            67              14,247       74              19,100        74        -30         -5,675
 Silverside/outside                                                      2,811            14              1,698         9             2,732           11        3              79
 Cube roll/rib eye roll                                                 1,290              6               667          3               639           2       102             651
 Other                                                                  2,428             12             2,704         14              3,214         13       -24           -786
 Total                                                                19,954            100              19,316      100            25,684         100        -22         -5,730
Source: DAWR

Australian beef exports to Mexico – by major cut                                                                                                                %    in tonnes swt

Volume – in tonnes swt

 Thin flank                                                                122           99                 96       100                481         98        -75           -359
 Other                                                                         1            1                0          0                 9           2       -87              -8
 Total                                                                     124          100                 96       100                491        100        -75           -367
Source: DAWR

          8    MLA INDUSTRY INSIGHTS                  North America          January 2018
CANADA – Overall meat consumption is declining in Canada, driven by changing demographics (growing number of
                    immigrants) and an ageing population concerned about their health. Beef remains the second most popular protein in
                    Canada, with per capita consumption averaging 17kg/year, behind poultry (35kg/year).
    Challenges and opportunities in Canada for Australian beef include:
    • The proportion of high income households in Canada is             accounting on average for more than 50% of total imports. The
      increasing steadily and can represent a growth opportunity for     US and Mexico benefits from neither a tariff nor quota restrictions
      high quality beef through high-end retailers and foodservice.      as part of North America Free Trade Agreement (NAFTA). Imports
    • Australian beef exports to Canada is mostly comprised of frozen   from Australia, New Zealand and Uruguay declined in 2017 as
      manufacturing beef, and is currently limited by a quota and an     imports from the US increased.
      above-quota tariff.
    • The US remains the main imported beef supplier to Canada,

    Consumers
•	Most Canadian consumers already buy imported beef, and
                                                                                         Motivation to choose and eat beef
    a growing majority of grassfed beef buyers are aware of the
    country of origin (68%), and most would consider buying imported                     Important themes ranked by relative importance
    beef (82%) (MLA Global Tracker 2017).
                                                                                              Freshness
•	Compared to global consumers, Canadian beef buyers are more                               Safety
                                                                                                                                                                       1.7
    concerned about natural produce, price and no added hormones.                             Value
                                                                                              Natural
•	When purchasing beef, ‘naturalness’ is something buyers look for                          Origin
    and grassfed is seen as an authentic differentiator. However, the                         Environmental
    appeal of grassfed beef has plateaued at the same time that newer                         Nutritional
    descriptors have become more prevalent like organic, hormone-                             Halal
    free, non-GMO and antibiotic-free. It appears consumers are not                           Recipes
    fully aware of the differences between these types of beef.
                                                                                         Source: MLA Global Tracker US, 2017

    Foodservice and retail
• T
   he full service restaurant and quick service restaurant channels                    •	
                                                                                          At the retail level, Australian beef is mainly purchased from
  lead the Canadian foodservice sector, generating a combined                             supermarkets, and as the retail sector is quite fragmented in
  64% of total revenue in 2016.                                                           Canada, each city has a different leader in claimed total beef
                                                                                          sales (Source: MLA Global Tracker US, 2017).
• B
   eef is the most valuable meat category in the quick service
  segment, representing 39% of the channel’s total animal protein                         Main supermarkets for purchasing beef
  value*3 in 2016. (Source: GlobalData – Canada, The future of foodservice to 2021).
                                                                                          TORONTO                                  VANCOUVER
    Outlet number and value by key foodservice channel
    (% out of total)

    40
    35
    30
    25
    20
%

                                                                                              Loblaws – 23%                          Safeway Canada – 33%
    15                                                                                        Metro – 17%                            Fairway – 2%
    10                                                                                        WholeFoods – 1%                        Buy Low – 2%
     5                                                                                        Longos – 6%                            IGA – 6%
                                                                                              Sobeys – 6%                            Urban Fair – 1%
     0
             Full      Quick   Education Healthcare   Coffee &    Hotel &    Other            Other – 47%                            Other – 52%
           service    service                         tea shop     motel
         restaurant restaurant                                                            Source: MLA Global Tracker US, 2017

       Number of outlets            Value
    Source: GlobalData, 2017 estimates

    Canada – Market access overview
      Trade agreements                      Import tariffs                  Competitors                      Volume restrictions            Technical access
      No agreement                          Zero within quota               US and Mexico                    35,000 tonnes/year swt         E. coli and Salmonella
                                            (26.5% above quota)             NAFTA, no quota                  26.5% tariff apply over        sampling programs, label
                                                                                                             quota                          approvals and port mark
                                                                                                                                            compliance

    Best access                                                                                                                                        Major challenges
    Source: Trade agreements DFAT, MLA

    *3On-base percentage

                                                                                              MLA INDUSTRY INSIGHTS             North America   January 2018   9
MEXICO – Mexico has experienced stable economic growth over recent years, which has fuelled an expanding middle
                       class who are expected to increase their appetite for beef.

Challenges and opportunities in Mexico for Australian beef include:
• Australian beef exports to Mexico have historically consisted of      Mexican consumers have a growing appetite for premium, high
  small volumes of frozen product used for further processing. Prior     quality fresh meat.
  to March 2017, Australian beef faced tariffs which aren’t payable   • Rising incomes and an expansion of urban lifestyles have
  by larger North American beef importers.                              boosted growth prospects for products of high quality and value
• The relaxation of tariffs, which has been extended to December       in Mexico through both the foodservice and retail channels.
  2019, and the superior shelf-life of Australian chilled beef have     (Source: BMI)
  present opportunities in this market, particularly considering that

     Consumers                                                                                               Foodservice and retail
•	Mexicans are expected to consume approximately 1.86                                                    • F
                                                                                                              oodservice spending in Mexico is forecast to grow 60% in
    million tonnes cwe of beef in 2018 and demand is projected                                               the next five years, with the growing working-age population
    to rise, as the peso strengthens and the middle class grows.                                             and urbanisation lifting demand for more convenience among
     (Source: United States Department of Agriculture – USDA)                                                foodservice customers.
•	Young, wealthy consumers are driving beef consumption                                                  • F
                                                                                                              ull service restaurants’ is the largest segment within
    growth in Mexico. Younger consumers with more money to                                                   foodservice, holding a 43% share of sales in 2016. The
    spend are fuelling demand for high quality food and more                                                 channel is set to be the main beneficiary of Mexico’s positive
    formal dining experiences.                                                                               economic scenario, with rising discretionary incomes allowing
                                                                                                             families to trade up from quick service restaurants and being
•	The number of households with a higher income (above
                                                                                                             more receptive to higher value imported Australian beef.
    US$75,000/year) is expected to register notable growth by
    2021. In addition, hotel and restaurant expenditure is also                                            • In the retail sector, hypermarkets are the most prevalent outlet
    set to increase, creating new opportunities for high value                                                type in the country. Retailers will increasingly target the upper-
    products such as Australian beef and lamb.                                                                middle class segment in the coming years, through premium
                                                                                                              formats that offer popular imported produce (Source: BMI).
                                                                                                              Outlet number and value by key foodservice channel
                                                                                                              (% out of total)

                                                                                                                45
                                                                                                                40
                                                                                                                35
                                                                                                                30
                                                                                                                25
                                                                                                           %

                                                                                                               20
                                                                                                                15
                                                                                                                10
                                                                                                                 5
                                                                                                                 0
                                                                                                                        Quick       Full   Education Healthcare  Other                   Pub,        Other

     Trade access                                                                                                     service    service
                                                                                                                     restaurant restaurant
                                                                                                                                                                 mobile
                                                                                                                                                                operators
                                                                                                                                                                                        club &
                                                                                                                                                                                          bar

                                                                                                                  Number of outlets            Value
• In late 2017, the Mexican government extended the
                                                                                                              Source: GlobalData, 2017 estimates
   agreement establishing detailed provisions on unilateral tariff
   rate quotas, which allows 200,000 tonnes/year of beef to
   enter Mexico duty-free from any exporting countries until the
   end of 2019. The annual quota will be shared with other non-
   NAFTA countries.

Mexico – Market access overview
  Trade agreements                          Import tariffs                       Competitors                          Volume restrictions                    Technical access
  No agreement                              Zero within quota                    US and Canada                        200,000 tonnes/year swt                Listing restrictions on who has
  Australia is an associate                 (20-25% above quota)                 NAFTA, no quota                      shared with other non-                 approval to send to Mexico,
  member of Pacific Alliance                                                                                          NAFTA countries until                  labelling and language issues on
  and is in the early stages                                                                                          December 2019                          carton and inner packaging, sample
  of negotiating a FTA                                                                                                                                       tests on arrival for all consignments,
                                                                                                                                                             port of entry options limited

Best access                                                                                                                                                                             Major challenges
Source: Trade agreements DFAT, MLA

        © Meat & Livestock Australia, 2018. ABN 39 081 678 364. MLA makes no representations as to the accuracy of any information or advice contained in MLA’s Market snapshot and excludes all liability,
        whether in contract, tort (including negligence or breach of statutory duty) or otherwise as a result of reliance by any person on such information or advice. All use of MLA publications, reports and
10      information is subject to MLA’s Market Report and Information Terms of Use. Please read our terms of use carefully and ensure you are familiar with its content.
MARKET SNAPSHOT                                   BEEF

                                 Japan
Japan is Australia’s largest beef export market stemming from a long established trade relationship. It is the world’s third largest
economy and one of the world’s major meat importers. Despite an ageing society and a flat to declining population, its affluent and
urbanised consumer base will continue to demand high volumes of quality imported proteins, such as Australian beef.
Challenges and opportunities in Japan for Australian beef include:
• Australia’s well established trade protocols and advantageous     • Australian beef is seen as a family favourite and is consumed
  market access conditions into Japan over other beef suppliers,       most often among all imported beef in Japan, but is facing strong,
  provide a competitive advantage and strong foundation for future     increasing competition from the US.
  growth.                                                            • Maintaining high awareness and a point of difference against
• Australia’s strong presence in supermarkets and a wide range of     other import supplier competitors in the mind of Japanese
  foodservice outlets has it well positioned to take advantage of      consumers will remain crucial, as its mature market status limits
  key consumer trends, such as increasing interest in akami (leaner    opportunities for significant growth in total consumption.
  meat) and steaks.

  Population                                                           Households earning*                                                   Households earning*
                                                                      >US$35,000/year                                                      >US$50,000/year

   127.5 126.1
           in 2017                          in 2021
                                                                          25.7 32.6
                                                                                 in 2017                          in 2021
                                                                                                                                                 12.6  in 2017
                                                                                                                                                                                     17.7in 2021

  In million                                                           In million households                                                 In million households
  Source: BMI Research, 2017 estimate & 2021 forecast                  Source: BMI Research, 2017 estimate & 2021 forecast                   Source: BMI Research, 2017 estimate & 2021 forecast
                                                                       * Disposable income                                                   * Disposable income

  Australian beef exports –                                            Australian beef exports –                                             Proportion of key cuts
  volume                                                              value                                                                

                                                                                                                                                                                    Manufacturing – 39%
                                    Chilled grass – 10%                                                                                                                           riskets – 15%
                                                                                                                                                                                 B
                                    Chilled grain – 30%                                                   Chilled – 56%                                                          Loins* – 8%
                                    Frozen grass – 42%                                                    Frozen – 44%                                                            Silverside/outside
                                    Frozen grain – 18%                                                                                                                           – 7%
                                                                                                                                                                                   Other – 31%

  Total 292,364 tonnes swt                                             Total A$2,011.7 million
  Source: Department of Agriculture and Water Resources                Source: ABS/GTA, MAT (Moving Annual Total) November 2015              Source: DAWR, CY 2017. * Striploin, tenderloin and cube roll
  (DAWR), CY 2017                                                      to October 2017

  Australia’s share                                                    Meat consumption                                                     48.3kg per capita*
  of imports                                                                                                                              total meat protein**

                                                                          2.62           2.73
                                                                                                        2.39          2.51

         50%                        Australia                                                                                        9.9kg per capita*                                              2017
                                    Other countries                                                                                   1.23          1.25                                            2021
                                                                                                                                                                    0.02    0.02
                                                                                  Pork                        Poultry                        Beef                     Sheepmeat

                                                                       In million tonnes cwt
  Source: GTA, MAT December 2016 to November 2017                      Source: BMI Research, GIRA, 2017 estimate and 2021 forecast          * 2017e per person per year in cwt   ** Excluding fish/seafood

© Meat & Livestock Australia, 2018. ABN 39 081 678 364. MLA makes no representations as to the accuracy of any information or advice contained in MLA’s Market snapshot and excludes all liability,
whether in contract, tort (including negligence or breach of statutory duty) or otherwise as a result of reliance by any person on such information or advice. All use of MLA publications, reports and
information is subject to MLA’s Market Report and Information Terms of Use. Please read our terms of use carefully and ensure you are familiar with its content.

FOR FURTHER INFORMATION VISIT US ONLINE AT:
www.mla.com.au or email us at: marketinfo@mla.com.au                                                                    MLA INDUSTRY INSIGHTS                   Japan       January 2018           11
Consumers                                                                                                     Demographic comparison – Japan, China and the US

                                                                                                                    Category                                               Japan           China               US
•	
  Japanese consumers consider beef the most premium protein,
  and associate it with good taste and being a family favourite.                                                    Households with disposable
  While beef lags behind pork for versatility and convenience, its                                                                                                           17.7            7.8           59.6
                                                                                                                    income US$50,000+ (in million)
  strong emotional connection underpinned by taste means it is
  an indispensable part of the Japanese diet.                                                                       Urban population, % population                           96              62                83
   Attributes important for all proteins and beef associations
                                                                                                                    Number of the US$50,000+
                                                                                                                                                                             42              0.4               5.6
      What attributes are                                  What associations do                                     households per square km
      important for Japanese                               consumers have to beef?                                Source: BMI, the World Bank, MLA. 2017 forcast
      consumers (all proteins)?

   My/my family’s favourite                               Most superior meat

   Easy to prepare                                        Tastes delicious

   Can be used in different meals                         My/my family’s favourite

   Easy to purchase                                       Can be used in different meals

   Animal is well-cared for                               Easy to purchase
   Source: MLA Global Consumer Tracker Japan, 2017

•	
  Beef continues to be used in traditional Japanese recipes, but
  consumers are also inspired by international beef menus, both
  western and Asian. The akami* meat boom made steak one of                                                       Beef bento box
  the common items on the table, however it is often served as
  one of many sharing dishes, rather than as a main meal.
•	
  This sharing format is popular because consumers traditionally
  seek variety in foods to deliver enjoyment as well as nutritional                                               Foodservice
  balance. This means Japanese consumers tend to opt for a
  diversity of proteins, although some seafood has gradually                                                   • C onsumers appreciate highly marbled Japanese Wagyu beef
  been replaced with chicken and pork. Total beef consumption                                                     for special occasions and high-end dining, while leaner/less
  has been relatively stable, and is expected to remain so in                                                     marbled Australian beef is used across the foodservice sector.
  coming years due to an increase in per capita consumption                                                       The younger generation is a driving force of the akami trend, with
  coinciding with the declining population (Source: BMI, based on                                                 a recent survey indicating their preference for meat with less fat
  2016 consumption and 2021 forecast). Australia has opportunities to                                             (Source: MLA Global Consumer Tracker Japan, 2017). Interest in high protein diets

  enhance the per capita consumption increase into the future                                                     among middle-aged consumers is also a positive development
  by continuously reinforcing the goodness of beef through                                                        for Australian beef. Banking on these trends, there are increasing
  consumer marketing and leveraging Australia’s reputation as a                                                   numbers of steakhouses and meat-specialised bistros opening in
  safe and trusted supplier.                                                                                      the marketplace.
                                                                                                               • The Japanese foodservice market is estimated at over US$289
   Protein consumption per capita
                                                                                                                  billion, including cooked food nakashoku* sales by retail outlets
                                                                                                                  (Source: Japan Foodservice Association, 2016 data). The foodservice sector is a
                                                                                                                  core distribution channel for Australian beef, accounting for an
                                           Beef – 6%
                                                                                                                  estimated 70% of Australian exports to Japan.
                                           Pork – 12%
                                           Chicken – 13%                                                          Major outlets of Australian beef (and key cuts used):
                                           Egg – 17%
                                           Fish/seafood – 25%                                                       Hamburgers and gyudon chains (manufacturing beef, brisket)

                                                                                                                    Family and chain restaurants (manufacturing beef, various cuts)
   Source: Ministry of Agriculture, Forestry and Fisheries of Japan (MAFF) JFY16-17
                                                                                                                    High-end restaurants (loins, roast cuts)
• J apan’s population and economic growth are subdued                                                              Yakiniku – Japanese style table-top barbecue (loins, rib cuts, skirts,
   compared with many neighbouring markets in Asia. That said, a                                                    offal)
   high number of wealthy households and concentration in major
   cities, coupled with a sophisticated supply chain infrastructure,                                                Canteens – schools, hospitals, catering (manufacturing beef, various
   provides businesses with easy access to large groups of                                                          cuts)
   potential customers.                                                                                             Steakhouses (loins, shoulder cuts)
                                                                                                                  Source: MLA

* When meat is called akami or ‘leaner’ in Japan, it is in comparison to highly marbled Wagyu beef or
pork belly cut with a very high level of intermuscular fat. Most Australian beef is generally seen as akami,   * Nakashoku is a food category between retail (cooking at home) and foodservice (dining out).
as it is comparatively less marbled.

              12     MLA INDUSTRY INSIGHTS                      Japan        January 2018
Retail
                                                                                           • M
                                                                                              ore than a quarter of Japanese consumers are over 65 years
                                                                                             old, and almost 60% of all families are either one or two person
                                                                                             households (Source: BMI, 2017 data). This ‘older and smaller’ household
                                                                                             trend will continue into the future, as will the emphasis on variety,
                                                                                             convenience and maintaining a healthy lifestyle. Small portioned
                                                                                             takeaway meals, easy to read and open packaging, and menus
                                                                                             with reduced sugar or salt are some of the offerings of many
                                                                                             supermarkets to appeal to this trend.
                                                                                           • K
                                                                                              nowing where food comes from is also highly important to
                                                                                             health-conscious Japanese consumers. Country of origin labelling
                                                                                             is mandatory at Japanese retail level, and Australian beef is well
    Hamburg and steak dish (image courtesy of Sawayaka restaurant)                           positioned to take advantage of this, supported by perceived
                                                                                             advantages in quality and safety of ‘brand Australia’ (‘True Aussie’)
• F
   ull service restaurants are a clear leader in value in the                               (Source: MLA Global Consumer Tracker Japan, 2017).
  Japanese foodservice sector, while nakashoku retail and
  quick service/fast food categories compete with each other by
  offering convenient and affordable meal solutions. Beef usage
  volume and value are proportionally higher in the full service
  and fast food categories (Source: GlobalData, 2017).
• N
   akashoku retail sales are largely driven by delicatessen
  products offered by supermarkets, convenience stores and                                   Key attributes consumers           Key associations consumers
  takeaway specialists where chicken and pork are currently                                  look for on a beef pack:           have with the ‘True Aussie’ logo:
  more prevalent. Overcoming the price barrier and making
  beef more appealing to this segment will open up more                                                                         "This beef is..."
  opportunities for Australian beef, on the back of the country’s
                                                                                              ● safety
  ageing population and increasing numbers of single/two                                                                            safe to eat
  people households.                                                                          ● freshness
                                                                                                                                    guaranteed/certified
    Outlet number and value by key foodservice channel                                        ● value
    (% out of total) – 2017                                                                                                         high quality/premium
                                                                                              ● origin
    40
                                                                                                                                    delicious
    35                                                                                     •	
                                                                                             Increased imports from the US during 2017 resulted in many
    30
                                                                                             Japanese retailers running special price promotions featuring
                                                                                             US products. In most cases, Australian and US products co-exist
    25
                                                                                             in a retail space. Supermarkets often focus on the US for chilled
    20                                                                                       brisket (shortplate) slices and chuck roll steaks, and on Australia
%

    15                                                                                       for loin steaks and shaved/sliced packs from various cuts. Mixed
                                                                                             yakiniku plate (a combination pack of several pork, beef cuts
    10
                                                                                             and beef offal) is popular among variety-seeking consumers.
     5
     0
         Pub, Club   Full Service   Retail     Other    Quick Service   Accom-     other
           & Bar     Restaurant     eat-in   Restaurant Restaurant &    modation
                                                         Fast Food

      Number of outlets             Value
    Source: GlobalData

    Japanese style yakiniku BBQ

                                                                                                MLA INDUSTRY INSIGHTS         Japan    January 2018    13
• In
                                                                                                                                          terms of Japanese domestic production, 326,394 tonnes
                                                                                                                                         cwt of beef was produced during November 2016 to October
                                                                                                                                         2017, down 6% in comparison to the five-calender year average
       Other suppliers                                                                                                                  (346,398 tonnes cwt) . Key influencing factors for the decline
                                                                                                                                         include Japan's ageing farming population, high calf prices, and
• Australia is the dominant imported beef supplier to Japan, but is                                                                     diversification of consumer preferences.
   facing strong and increasing competition from the US. Imports
                                                                                                                                            Japanese beef production by breed type
   from the US surged in 2017, supported by the rise in US domestic
   production and subsequent decline in prices. As a result, the tariff                                                                                    400
   increasing safeguard mechanism was triggered from August 2017.                                                                                          350

• Due to the safeguard, the frozen beef tariff for all supplying                                                                                          300

                                                                                                                                         ‘000 tonnes cwt
   countries without an Economic Partnership Agreement (EPA) was                                                                                           250
   raised to 50% from 38.5%, from 1 August 2017 until 31 March 2018.                                                                                       200
   Australia is exempt from this increase under its Japan-Australia
                                                                                                                                                           150
   EPA, and maintains an advantageous tariff rate of 29.9% for chilled
   beef, and 27.2% for frozen (as of January 2018).                                                                                                        100

                                                                                                                                                           50
• Despite the tarrif snapback, demand for US beef remained
                                                                                                                                                             0
   strong, supported by highly competitive brisket/plate
                                                                                                                                                                 JFY10-11     11-12   12-13    13-14      14-15     15-16      16-17     MAT
   (shortplate) prices. Subsequently, imports from the US between                                                                                                                                                                      (Nov 16 to
   January to October 2017 totalled 203,387 tonnes swt, up 28%                                                                                                                                                                           Oct 17)
   from the same period in the previous year.                                                                                                              Wagyu            Dairy     Other

• Other
       suppliers include New Zealand, Canada and Mexico but                                                                               Source: Agriculture and Livestock Industries Corporation of Japan (ALIC)
                                                                                                                                            JFY = Japan Fiscal Year, April to March
  their share in the market collectively remains under 10%. Brazil
  is working on safety assessment and import protocols with the                                                                             Japan beef consumption by supplier
  Japanese government, with no fresh beef (chilled and frozen)
  currently imported into Japan from Brazil. India does not have                                                                                                                          Domestic – 36%
  access due to animal health concerns.                                                                                                                                                   Australia – 32%
                                                                                                                                                                                          US – 26%
       Japan beef imports by supplier
                                                                                                                                                                                          Other imports – 6%
                      60
                                                                                                                                                                                       Total – 895, 101 tonnes
                                                                                                                                       other                                           (product weight, MAT Nov 2016 to Oct 2017)
                      50
                                                                                                                                       NZ
                                                                                                                                            Source: ALIC, Ministry of Finance (Japan), MLA estimate
    ‘000 tonnes swt

                      40
                                                                                                                                       Canada
                      30
                                                                                                                                       Australia
                      20                                                                                                               US
                       10

                          0
                              2007

                                       2008

                                              2009

                                                     2010

                                                            2011

                                                                     2012

                                                                            2013

                                                                                    2014

                                                                                           2015

                                                                                                  2016

                                                                                                         2016

                                                                                                                2017

                                                                                                         YTD (Jan to Oct)
                                                                                                           comparison

                      US             Australia       Canada            NZ          Other
       Source: GTA

       US frozen brisket imports into Japan
                   20
                                                                                                                   6.0
                                                                                                                                     Average
                                                                                                                                        Importvalue US from US
                                                                                                                                               volume
                   15                                                                                                                Average value AUSis largely used for Gyudon beef rice bowl.
                                                                                                                                         US shortplate
                                                                                                                   5.5
 ‘000 tonnes swt

                                                                                                                       A$ per kilo

                   10
                                                                                                                   5.0

                                                                                                                                        Australia
                      5
                                                                                                                   4.5

                   0
                          O N D J F M A M J J A S O N D J F M A M J J A S O 4.0
                          2015            2016                 2017

                      Import volume from US
                        Average value US                           Average value AUS
       Source: GTA

                               14      MLA INDUSTRY INSIGHTS                       Japan      January 2018
Market access overview
  Trade agreements                          Import tariffs                            Competitors                                Volume restrictions                     Technical access
  Japan-Australia Economic                  Until 31 March 2018 –                     US                                         Safeguard                               No major hurdles
  Partnership agreement                     29.9% for chilled beef,                   The US has no FTA/EPA                      Tariff bounces back to
  (JAEPA)                                   27.2% for frozen.                         with Japan and is applied a                38.5% if Australian imports
                                            From 1 April 2018 – 29.3%                 38.5% tariff (50% for frozen               exceed trigger level***
                                            for chilled, 26.9% for                    until 31 March 2018)**
                                            frozen*

Best access                                                                                                                                                                           Major challenges
Source: Trade agreements, DFAT, MLA
* Japan Australia Economic Partnership Agreement
** as at February 2017
*** Trigger level for chilled: 133,300 tonnes swt for Japan Fiscal Year (JFY) 2016 (until March 2017), 135,000 tonnes swt for JFY2017 (April 2017 to March 2018).
For frozen: 198,300 tonnes swt and 200,000 tonnes swt, respectively.

Australian beef exports to Japan – summary table
Volume – in tonnes swt                                                       2017      % out                        2016       % out           5-year average         % out     change 2017 vs 5-yr av.
                                                                                      of total                                of total            (2012-2016)        of total
                                                                                                                                                                                       %    in tonnes swt

                               Total                                  292,364             100                 264,325             100                  288,133          100            1            4,231
                               Chilled                                   117,382           40                   116,657            44                  123,255           43           -5           -5,873
 Storage
                               Frozen                                   174,982            60                   147,668            56                  164,878           57            6            10,104
                               Grassfed                                 150,308             51                 135,320              51                  160,169          56           -6            -9,861
 Meat type
                               Grainfed                                 142,057            49                  129,005             49                   127,964          44            11          14,092
                               Chilled grassfed                          28,474             10                   31,994             12                    37,110          13        -23            -8,636
                               Chilled grainfed                          88,908            30                   84,663             32                    86,145          30            3            2,763
 Storage/meat type
                               Frozen grassfed                           121,833           42                  103,326             39                  123,059           43            -1           -1,225
                               Frozen grainfed                            53,149            18                   44,342             17                   41,820           15         27             11,329
Source: DAWR

Value – in A$ 000                                                                                                                                                                      %        in A$ 000

                               Total                                2,011,654*            100               1,809,672             100                1,658,192          100           21        353,462
                               Chilled                                1,125,313*           56                1,097,255              61                 938,916           57          20          186,396
 Storage
                               Frozen                                 886,342*              44                   712,417           39                   719,275          43          23          167,066
Source: ABS/GTA. 2017* = Moving Annual Total (MAT), November 2016 to October 2017.

Volume – by major cut (in tonnes swt)                                                                                                                                                  %    in tonnes swt

 Manufacturing                                                           115,376           39                    97,500            37                   101,952          35           13           13,424
 Brisket                                                                  43,301            15                   42,381             16                  49,505            17         -13           -6,204
 Silverside/outside                                                      20,297              7                    16,614             6                   15,554            5         30             4,743
 Blade                                                                   16,800              6                    16,271             6                   18,073            6          -7            -1,273
 Chuck roll                                                              15,956              5                    13,831             5                   14,259            5          12             1,697
 Topside/inside                                                           15,241             5                   14,084              5                    17,339           6         -12           -2,098
 Striploin                                                               13,025              4                    12,148             5                   10,925            4          19            2,100
 Fullset                                                                   7,497             3                    6,828              3                    6,527            2          15              970
 Other                                                                    44,871            15                  44,668              17                  54,000            19         -17            -9,128
 Total                                                                292,364             100                 264,325             100                  288,133          100             1           4,231
Source: DAWR

Australian BEEF OFFAL exports to Japan – by major cut (in tonnes swt)                                                                                                                  %    in tonnes swt

 Tongues                                                                   7,666           33                      7,866           35                     8,789          35          -13             -1,123
 Skirt                                                                     7,289           32                       7,170          32                       7,741         31          -6             -453
 Intestines                                                                2,874            13                     2,774            12                       3,111        12          -8             -238
 Other                                                                     5,156           22                     4,939            22                     5,693          22           -9             -536
 Total                                                                  22,985            100                   22,748            100                   25,334          100           -9          -2,349
Source: DAWR

Value – in A$ 000                                                                                                                                                                      %        in A$ 000

 Total                                                                216,322*                                236,785                                  187,002                        16          29,320
Source: ABS/GTA. 2017* = Moving Annual Total (MAT), November 2016 to October 2017.

      © Meat & Livestock Australia, 2018. ABN 39 081 678 364. MLA makes no representations as to the accuracy of any information or advice contained in MLA’s Market snapshot and excludes all liability,
      whether in contract, tort (including negligence or breach of statutory duty) or otherwise as a result of reliance by any person on such information or advice. All use of MLA publications, reports and
15    information is subject to MLA’s Market Report and Information Terms of Use. Please read our terms of use carefully and ensure you are familiar with its content.
You can also read