MRF and Recycling Markets Evaluation - Prepared for: December 2019 - Volume Title Here - SWALCO
←
→
Page content transcription
If your browser does not render page correctly, please read the page content below
Volume Title Here

MRF and Recycling Markets Evaluation

Prepared for:

December 2019
TABLE OF CONTENTS

SECTION                                                                                                                        PAGE

1.0 INTRODUCTION ........................................................................................................ 1
    Assumptions and Limitations ..................................................................................... 2

2.0 BACKGROUND ......................................................................................................... 4
    Terminology ............................................................................................................... 4
    SWANCC’s Program/Contract ................................................................................... 5
    SWALCO’s Program/Contract ................................................................................... 7

3.0 MRF Capacity ......................................................................................................... 10
    Regional MRF Infrastructure .................................................................................... 10
    Outbound Shipments ............................................................................................... 12
    MRF Capacity .......................................................................................................... 13

4.0 RECYCLABLE COMMODITY PRICES ................................................................... 17
    Paper ....................................................................................................................... 17
    Aluminum ................................................................................................................. 18
    Tin/Bimetal ............................................................................................................... 19
    Plastics .................................................................................................................... 19
    Glass ........................................................................................................................ 20
    Average Commodity Values and Comparisons ....................................................... 21
    Future Market Conditions......................................................................................... 25

5.0 PROCESSING COSTS ............................................................................................ 33
    Processing Fee and Tipping Fees: Chicago-Metro Area ......................................... 33
    Transload Costs ....................................................................................................... 35
    Processing Fee and Tipping Fees: Other U.S. Regions .......................................... 37
    Future Trends in Processing Costs.......................................................................... 39

6.0 CASE STUDIES ....................................................................................................... 41
    Case Study #1: Tri-County MRF (Outagamie County, Wisconsin) .......................... 41
    Case Study #2: Kent County MRF (Kent County, Wisconsin) ................................. 46
    Case Study #3: SOCRRA MRF (Oakland County, Michigan).................................. 51
    Summary of Public MRFs ........................................................................................ 53
    Case Study #4: Emterra MRF (East Lansing, Michigan) ......................................... 53
    Case Study #5: Private MRFs.................................................................................. 54

7.0 CONTAMINATION ................................................................................................... 62
    Contamination Quantities and Rates ....................................................................... 62
    Contamination Composition ..................................................................................... 64
    Contamination Over Time ........................................................................................ 67
    Cost Impacts of Contamination ................................................................................ 72

                                                                  i         SWANCC/SWALCO Recycling Market Study
                                                                                                December, 2019
TABLE OF CONTENTS (cont’d.)

SECTION                                                                                                               PAGE

8.0 HOUSEHOLD COST IMPACTS .............................................................................. 74
    Baseline Curbside Recycling Costs ......................................................................... 74
    Curbside Recycling Quantities ................................................................................. 76
    Household Cost Impacts of Recent Trends ............................................................. 76
    Components of Cost Increases................................................................................ 77

9.0 CONCLUSION ......................................................................................................... 81
    Summary Findings ................................................................................................... 81
    Preliminary Options ................................................................................................. 83

APPENDICES

Appendix A               Tri-County MRF (Outagamie County, WI): Financial Data

                                                             ii       SWANCC/SWALCO Recycling Market Study
                                                                                          December, 2019
1.0 INTRODUCTION
The Solid Waste Agency of Northern Cook County (SWANCC) and the Solid Waste Agency
of Lake County (SWALCO) commissioned this study of Material Recovery Facilities (MRF1)
and recycling markets to research and evaluate the impact of on-going trends that are
challenging the recycling industry. These trends, which have been widely reported
nationally as well as within the region, include the following:
A pronounced decline in the value of recyclables commodities, primarily in paper
markets and stemming from import restrictions implemented by China in early 2018.
Commodity material revenues offset the cost of processing recyclables and, in
stronger commodity markets, actually return revenue to the Agencies. Commodity
prices have declined to such an extent that they no longer cover the cost of
processing the recyclables, which has led to the implementation of tipping fees (i.e.,
charges to customers of MRFs) to make up for the lost material revenue.
Reported increases in contamination levels in the single-stream recyclable materials
collected curbside. Higher contamination levels increase the cost of processing
recyclables because additional effort must be expended to remove the contaminants
and produce marketable commodities.
Changes in the underlying composition of single stream recyclable materials. For
instance, newspaper has declined as a proportion of the overall material stream due
to increased use of digital media for news. Cardboard has increased proportionately
due to greater use of on-line shopping. Plastic containers and aluminum containers
continue to drop in weight (called “light weighting”) which, while an overall
environmental benefit, requires more containers to be sorted and processed in order
to produce a bale of marketable material.
Both SWANCC and SWALCO had entered into contracts under which participating
members of each Agency direct their recyclables to a contracted MRF for processing.
SWANCC’s contract extends until 2031 and has terms that are comparatively favorable
under current market conditions. SWALCO’s contract expires at the end of 2019 and
therefore current market conditions will likely impact the terms and pricing of a replacement
contract. In both Agencies, there are some communities that do not participate in the joint
processing programs, and both SWANCC and SWALCO were interested in the potential
impact on those communities that independently contract for recyclables processing under
their municipal hauling contracts.
This report is organized into the following sections:
Section 2.0 defines some industry terms and presents background information on
the SWANCC and SWALCO processing contracts.
Section 3.0 provides an overview of regional MRFs in the Chicago-metro area and
an analysis of MRF capacity.
1 A Material Recovery Facility is a facility in which recyclables are processed in order to separate
commingled materials into distinct commodity streams (e.g., cardboard, aluminum, glass, etc.)
and then process the individual materials (e.g, baling of the commodities) prior to shipment to
end user markets.
1 SWANCC/SWALCO Recycling Market Study
December, 2019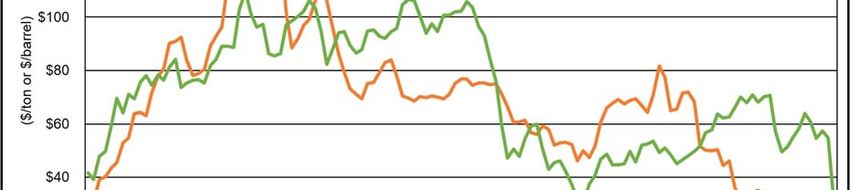
Section 4.0 presents information on historical and recent trends in commodity
market pricing, and a discussion of planned expansions in U.S. paper mills to
replace capacity lost in the export market.
Section 5.0 summarizes a survey of processing costs at MRFs both regionally and,
for further context, across the U.S. These are generally contract rates for
municipalities or other government agencies that contract with private MRFs for
processing, but also include some publicly-owned and operated MRFs. This
information provides a broad overview of current processing costs.
Section 6.0 provides a more detailed analysis of capital and operating costs for
three case studies of publicly-owned and operated MRFs. Supplemental information
is also provided for two case studies of privately-owned facilities.
Section 7.0 provides an analysis of contamination issues (quantities, composition
and cost).
Section 8.0 evaluates the economic impact of recent trends at the household level.
Section 9.0 summarizes the research findings of this study, and presents a
preliminary analysis of options for communities to consider in order to continue to
provide recycling service in the face of challenging market conditions.
Assumptions and Limitations
In conducting the research for this study, APTIM relied on publicly-available documents
(principally MRF processing contracts and budget documents) to obtain pricing and other
performance data. We also attempted, where possible, to obtain information from multiple
sources. Through this research, we were able to corroborate general cost parameters and
identify some overall similarities in the recyclables processing market. This also allowed us
to estimate the relative cost impacts of different market trends (i.e., declining commodity
values, increased contamination) at the household level. We note the following factors,
however, which influence this study and any evaluation of processing costs:
MRFs are unique facilities, employing varying levels of technology and labor and
operating at different throughput levels. Processing costs vary based on these
parameters.
MRFs also vary based on age. Many of the MRFs in the Chicago market, for
instance, date back to the early and mid-1990s, but have already undergone a
major equipment replacement to upgrade to single-stream capabilities. Some MRFs
were developed in existing buildings, so that the major capital investment was for
processing equipment. These differences can also impact costs at the facility-level.
Most MRFs in the U.S. are privately-owned, and in the Chicago market all are
privately-owned. According to data in the most recent nationwide survey of MRFs2,
75 percent of facilities are privately-owned and operated, 12 percent are publicly-
owned and privately-operated, and 13 percent are publicly-owned and operated (the
latter group tend to be smaller facilities). While total processing fee information at
2 Governmental Advisory Associates, Inc., 2016-2017 Database on Material Recovery Facilities
and Mixed Waste Processing Facilities in the U.S.
2 SWANCC/SWALCO Recycling Market Study
December, 2019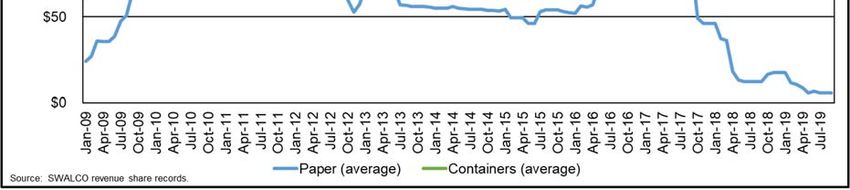
privately-owned or privately-operated facilities can be obtained through analysis of
processing contracts, component cost data (e.g., labor, capital costs) is generally
not available because it is proprietary.
Market conditions remain in flux as the entire industry attempts to address the
negative market trends. On the revenue side, average commodity prices have
continued to decline during 2019, and although a number of new or expanded
domestic paper mill projects have been announced (as discussed in Section 4), they
will take time to develop.
On the cost side, recycling service providers are also in the process of implementing
new contract terms to assure that processing costs are being covered. According to
transcripts of quarterly earnings conferences with securities analysts, the major
publicly-traded waste companies intend to pass on higher processing costs to
customers. However, this plan will be accomplished in phases, with “pure”
processing contracts addressed first, whereas municipal recycling contracts (which
include both curbside collection and processing) addressed over a longer period of
time (because the municipal contracts have a 3-5 year term). Although processing
fees are starting to become clearer, cost impacts are still being negotiated,
particularly with municipal recycling contracts.
3 SWANCC/SWALCO Recycling Market Study
December, 2019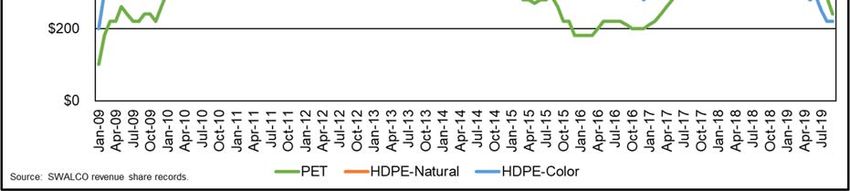
2.0 BACKGROUND
Terminology
In discussing MRF’s, processing contracts and processing economics, it is important to
define some industry terms and concepts:
Average Commodity Revenue (ACR) is the weighted average value of the materials
contained in one ton of single stream recyclables as delivered to the MRF, based on
current market prices for the commodities. ACR varies from month to month based
on changes in commodity prices, and may also change as the result of periodic
audits of the composition of single stream recyclables. Commodity prices are
determined by reference to published indices that track selling prices, which is why
processing contracts that employ ACR are referred to as “index pricing models”.
Some commodities, however, may be valued at the actual price that the MRF sells
them for. ACR includes a deduction for the cost to dispose of non-recyclable
residue, and for the cost to manage glass (in most markets, glass has a negative
commodity value)3. ACR is always stated on an “incoming” ton basis as received by
the MRF.
Adjusted ACR is the same as ACR, except that negative value materials (residue
and glass) are excluded from the calculation of blended material value. For this
reason, Adjusted ACR will have a higher value than ACR. All of the publicly-owned
MRFs discussed in this report (see case studies in Section 6.0) treat residue and
glass management costs as facility expenses, and their reported commodity
revenues do not include a deduction for the negative value of the residue and glass.
The only reason for defining Adjusted ACR is to provide an “apples-to-apples”
comparison of commodity revenues under the SWANCC and SWALCO programs
versus these publicly-owned MRFs. Adjusted ACR is also stated on an incoming ton
basis.
The “as-sold” price of materials is the actual selling price of processed commodities.
The “as-sold” price is stated per outgoing, shipped ton of a specific commodity after
processing through the MRF.
The processing fee for a MRF is the per-ton cost to receive inbound single-stream
(i.e., commingled) recyclables and separate and process the individual
commodities. The processing fee includes both the capital and operating costs of
the MRF. When commodity prices are high enough, ACR will exceed processing
costs and the MRF will generate a profit4.
3 SWALCO staff have indicated that the formulas used by the operator of the Grayslake MRF to
compute residue disposal costs and glass management costs are complex and not always
transparent. Telephone communication with Peter Adrian, December 9, 2019.
4 For privately-owned MRFs, the processing fee itself may include some profit margin, and when
ACR exceeds the processing fee, the MRF will earn additional profits. Publicly-owned facilities
also generate “profit” when commodity prices are high. Evidence to support this is presented in
Section 6.0.
4 SWANCC/SWALCO Recycling Market Study
December, 2019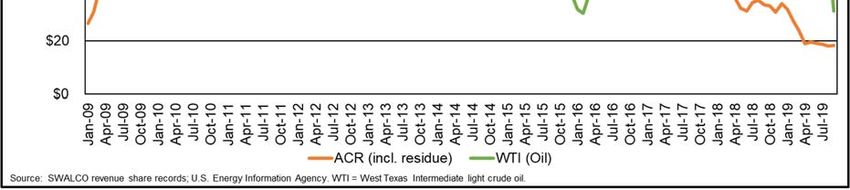
When commodity prices are lower than ACR, the MRF will typically5 charge a
“tipping fee” to make up the difference. In equation form, the tipping fee is
expressed as:
Tipping Fee ($/ton) = Processing Fee ($/ton) – ACR ($/ton)
During our research for this study, we found the term “processing fee” used
interchangeably with “tipping fee”, and although they are related by the above
equation, the terms refer to two different things. The processing fee is usually
specified as a fixed number in the processing contract (e.g., $75.00/ton), subject
only to annual escalation. The “tipping fee” is the fee actually paid by the MRF
customer, and although a contractual requirement, the tipping fee will vary based on
changing commodity values. Most MRF processing contracts include some form of
the above equation.
Recently, some MRFs have also begun to charge “contamination fees” on a load-
by-load basis if the incoming load of recyclables is judged to contain excessive
contamination. The contamination fee is charged in addition to the tipping fee.
Waste Management has acknowledged on quarterly earnings calls that it has
implemented contamination fees. SWALCO staff have also indicated (based on
discussions with area haulers) that the Grayslake MRF is assessing contamination
fees ($45/ton or more) on some customers. Other MRFs have taken a different
approach and charge differential tipping fees based on the level of contamination in
the customer’s recyclables (refer to discussion in Section 7.0).
SWANCC’s Program/Contract
In 2008, SWANCC initiated a voluntary program (the “Recycling Incentive Program”) with its
membership with the aim of allowing participating member communities to receive a share
of commodity revenues from the curbside recycling materials collected in each community.
As a condition of participating in the program, participating member communities were
required to direct their contracted municipal waste hauler to deliver curbside recyclables to
the Agency’s designated processor, Groot Industries (Groot). Groot owns and operates a
MRF in Elk Grove Village.
The processing element was “rebid” in 2014 as part of the Agency’s procurement of a new
operating and disposal contract for the Glenview Transfer Station6. Processing fees and
revenues are specified on an “index” or “market basket” model as shown in Table 1. As
noted previously, this is a standard pricing model used in recyclables processing contracts.
Commodity values are updated monthly based on published pricing indices or, in the case
5 This wasn’t always the case historically. When commodity values were higher, some processing
contracts included a “zero-floor” provision which stated that the customer would not pay a tipping
fee. Presumably, at the time such contracts were executed, it was not foreseen that commodity
prices would have a large and prolonged decline in value. When the magnitude and duration of
the on-going decline in commodity values became more apparent, however, private companies
began to insist that tipping fee provisions be included in processing contracts. Even publicly-
owned MRFs have adopted this policy.
6 It should be noted that the recyclables processing element is not a separate, stand-alone
contract, but is included in the transfer station operating agreement. Although separate pricing
terms for recyclables are quoted in the agreement, the large value of the overall transfer station
contract likely allowed SWANCC to secure more favorable terms for recyclables processing
compared to a stand-alone recycling agreement.
5 SWANCC/SWALCO Recycling Market Study
December, 2019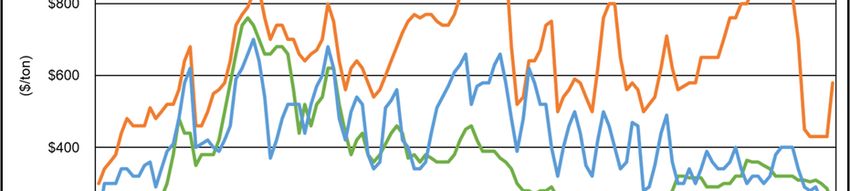
of residue, on actual disposal costs. Glass, as shown in the table, has a negative market
value.

                     TABLE 1. SWANCC RECYCLING AGREEMENT (AUGUST, 2019)

                                                                         Market Value      Wtd. Avg.
          Material              Pricing Index           Composition        ($/ton)        Value ($/ton)
    Newspaper #8           PPI Chicago HS                     45.00%            $20.00           $9.00
    OCC #11                PPI Chicago HS                      8.50%            $30.00           $2.55
    Mixed Paper #2         PPI Chicago HS                     13.00%             $0.00           $0.00
    Three-Mix Glass        Recyclingmarkets.net               15.00%          ($12.50)          ($1.88)
    Tin/Bi-metals          Recyclingmarkets.net                1.75%          $140.00            $2.45
    Aluminum               Recyclingmarkets.net                1.00%        $1,120.00           $11.20
    PET                    Recyclingmarkets.net                1.50%          $277.60            $4.16
    HDPE Natural           Recyclingmarkets.net                0.75%          $415.00            $3.11
    HDPE Colored           Recyclingmarkets.net                1.00%          $210.00            $2.10
    Mixed Plastics (3-7)   Recyclingmarkets.net                1.00%            $20.00           $0.20
    Residue                Actual                             11.50%          ($52.54)          ($6.04)
                                      Blended Average Commodity Revenue (ACR)                   $26.86
                                                                       Processing Fee           $78.90
                                                       Net Value (after processing fee)        ($52.04)
                                                Rebate (50% if ACR > Processing Fee)             $0.00

If average commodity revenues (ACR) exceed the processing fee, SWANCC receives a
rebate of 50 percent of the overage, which it shares with participating member
communities. In FY2012, when commodity values were high, SWANCC and its member
communities received nearly $1.2 million in revenue share7.

SWANCC’s agreement is somewhat unique in that if average commodity revenues are less
than the processing fee (i.e., the marketable value of the materials does not cover
processing costs), then no penalty is incurred and SWANCC and/or the participating
members do not have to pay the difference ($52.04/ton in the August, 2019 data shown in
Table 1). This is termed a “zero-floor” contract in the industry, because at worst SWANCC
receives no material revenue share but in no case pays a fee to help cover processing
costs.

As was noted previously (refer to Footnote 5), although zero-floor contracts were more
prevalent earlier in the century, the industry began to move away from them as commodity
markets began to decline. In today’s market and absent some other significant
consideration (refer to Footnote 6), a zero-floor provision could not be secured.

7     We note that at the time (2012), the revenue share was tied to the price of newspaper and not
      the average of all single-stream materials as specified in the current contract. Further, the
      contract guaranteed a minimum floor payment of $5/ton, independent of the market price for
      newspaper.

                                                   6      SWANCC/SWALCO Recycling Market Study
                                                                               December, 2019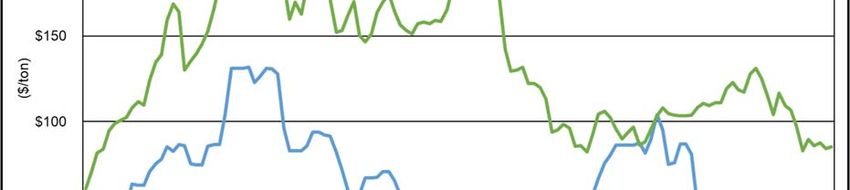
The value of the zero-floor provision to SWANCC and participating members under current
market conditions is significant. Based on an estimated 42,500 tons of recyclables expected
to be delivered in FY2020, participating members are avoiding approximately $2.2 million in
annual processing costs (= 42,500 tons x $52.04/ton) that would have to be paid under a
more typical processing agreement. SWANCC’s contract is effective through 2031, offering
long-term protection to participating member communities.
SWALCO’s Program/Contract
SWALCO initiated its own joint recycling program in 1996. A significant amendment to its
MRF capacity agreement with Waste Management was executed in 2008, which has
subsequently been amended four times and will expire at the end of 2019. Currently, most
member communities of SWALCO participate in the program (36 of 43 municipalities), plus
two townships that are not members of SWALCO. Under this program, participating
members are required to direct their contracted waste hauler to deliver recyclables to the
Waste Management MRF located in Grayslake. In 2018, participating member communities
delivered approximately 46,000 tons of recyclables. Waste Management has
communicated to SWALCO that it intends to convert the Grayslake facility from a MRF to a
transload facility8; the company is developing a new regional MRF in Hodgkins, Illinois as a
replacement processing facility.
The SWALCO agreement employs an index pricing model which is summarized in Table 2
(using commodity values for August, 2019). Initially, this appears similar to the SWANCC
index model, but there are important differences between the two contracts and programs:
Under the SWALCO program, participating members commit to deliver their
recyclables to the WM-Grayslake MRF, but their contracted waste haulers must pay
any tipping fees assessed by Waste Management, which the company may set
independent of its agreement with SWALCO. Unlike the SWANCC program,
SWALCO’s program is not backed by a “zero-floor” contract provision. Based on
average single-stream MRF processing costs reported by Waste Management of
$85/ton9, and given current commodity values of approximately $20/ton, it is
estimated that haulers are currently charged a “tipping fee” of approximately $65/ton
(the tipping fee is intended to bridge the gap between processing costs and
commodity revenues). This rate was confirmed by a survey SWALCO performed as
reported in the 2019 update to its solid waste management plan10.
The SWALCO index models include a “revenue share threshold” set at $60/ton (i.e.,
in order for SWALCO to receive a revenue share, ACR must exceed $60/ton). The
threshold is presumably tied in some way to the MRF’s processing fee, but as noted
above, Waste Management has indicated that processing costs are closer to
$85/ton. The SWALCO agreement is perhaps more appropriately viewed as a
“revenue share” agreement as opposed to a “processing” agreement.
8 At a transload facility, incoming loads of recyclables (in collection vehicles) are consolidated into
larger, semi-transfer loads for transport to a MRF.
9 Susan Robinson, Waste Management, State of MRFs in 2016: Current Trends and Conditions,
October 17, 2016.
10 SWALCO/Lake County, 2019 Sold Waste Management Plan Update, November, 2019, p. 2-14.
7 SWANCC/SWALCO Recycling Market Study
December, 2019 Waste Management ceased sorting newspaper as a paper grade in January 2017.
The Grayslake MRF has only produced a mixed paper grade since then. Some
MRFs have also made this decision, although others (including the Groot MRF)
continue to produce a newspaper grade. Newspaper has historically commanded a
premium price over mixed paper. In some months of 2011, the differential was as
high as $40-$65/ton, although typically the spread was much narrower and in 2016,
for instance, the premium was only $5-$15/ton. Presumably, Waste Management
determined that the lower price differential did not cover the cost of separating
newspaper from the mixed paper. Some MRFs have also indicated that declining
amounts of newspaper makes it less worthwhile to sort the material11.
TABLE 2. SWALCO RECYCLING AGREEMENT (AUGUST, 2019)
Market Value Wtd. Avg.
Material Pricing Index Composition ($/ton) Value ($/ton)
Newspaper #8 PPI Chicago HS - - -
OCC #11 PPI Chicago HS 10.96% $30.00 $3.29
Mixed Paper #54 PPI Chicago HS 47.09% $0.00 $0.00
Three-Mix Glass Actual 18.84% ($19.81) ($3.73)
Tin/Bi-metals Recyclingmarkets.net 2.09% $35.00 $0.73
Aluminum Recyclingmarkets.net 1.03% $1,120.00 $11.56
PET Recyclingmarkets.net 2.73% $285.00 $7.77
HDPE Natural Recyclingmarkets.net 0.98% $430.00 $4.21
HDPE Colored Recyclingmarkets.net 0.90% $220.00 $1.99
Tubs and Lids Recyclingmarkets.net 0.09% $60.00 $0.06
Large Rigid Plastic Recyclingmarkets.net 0.58% $60.00 $0.35
Mixed Plastic Film Actual 0.17% ($55.99) ($0.10)
Residue Actual 14.54% ($55.99) ($8.14)
Blended Average Commodity Revenue (ACR) $17.98
Revenue Share Threshold $60.00
Net Value ($42.02)
Rebate (50% if ACR > Threshold) $0.00
Notes:
1. Prices from Recyclingmarkets.net are all specified as Midwest-High Side (HS) values except
for aluminum, which is specified as Midwest Average.
11 King County, Washington, Responsible Recycling Task Force Meeting #4, July 18, 2018. The
comment on newspaper sorting was made by Recology, a private MRF operator.
8 SWANCC/SWALCO Recycling Market Study
December, 2019 Comparison of Table 1 and Table 2 also shows that the material compositions of the
single stream material are different under both programs. Cardboard percentages
are somewhat higher in the SWALCO program, but so are glass and residue, which
are negative value commodities. SWALCO’s material composition has been subject
to periodic adjustment based on composition audits, whereas SWANCC’s
composition has been held fixed12. Periodic audits are increasingly being written into
processing contracts, and in some cases “caps” are being placed on the amount of
allowable contamination in incoming loads.
12 Under SWANCC’s processing agreement, Groot can request a composition audit subject to
SWANCC’s consent.
9 SWANCC/SWALCO Recycling Market Study
December, 20193.0 MRF CAPACITY
Regional MRF Infrastructure
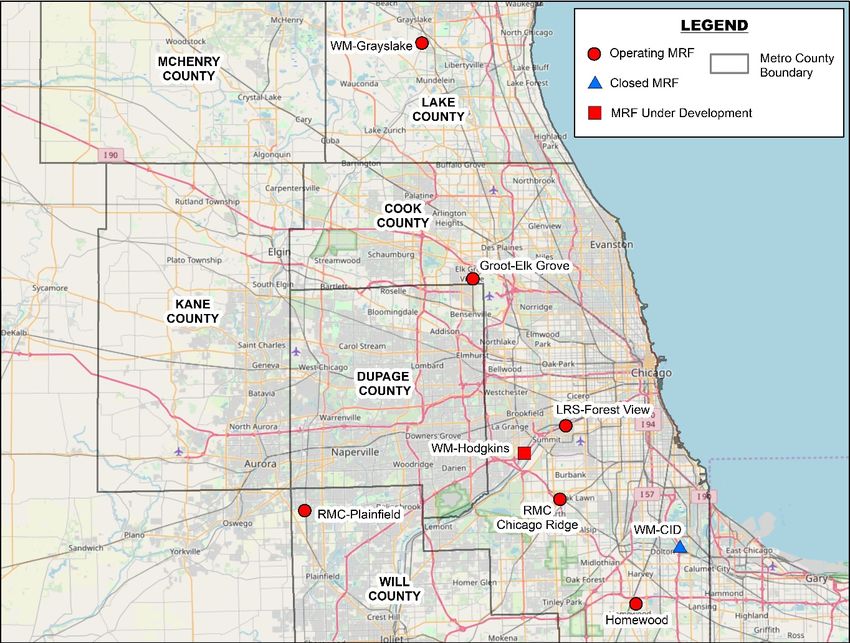
There are currently six operating single-stream MRFs in the Chicago metropolitan area
(refer to Figure 1): WM-Grayslake, Groot-Elk Grove, Lakeshore-Forest View, Resource
Management-Chicago Ridge, Resource Management-Plainfield, and Diversified-
Homewood. Waste Management (WM), Groot (now owned by Waste Connections),
Lakeshore, and Homewood are all solid waste haulers that have developed MRFs to further
integrate their solid waste businesses. Resource Management does not typically provide
solid waste collection services and is more a “pure play” recyclables processing company13.
Notably, the two other national waste companies that compete in the Chicago market
(Advanced Disposal and Republic Services) have not developed their own single-stream
MRFs in this market, although they own other solid waste assets such as transfer stations
and landfills and have developed single-stream MRFs elsewhere in the U.S. This would
tend to suggest that, historically, the market for processing services in the Chicago metro-
area has been competitive, because some haulers (even large, vertically integrated
companies) have not felt compelled to develop their own MRFs.
FIGURE 1. CHICAGO-AREA SINGLE-STREAM MRFs
13 For many years, Resource Management did provide curbside collection services to the City of
Naperville, however it no longer holds that contract.
10 SWANCC/SWALCO Recycling Market Study
December, 2019As was previously noted, WM has informed SWALCO that it intends to repurpose the
Grayslake MRF as a transload facility. WM also operated a MRF in south Chicago (WM-
CID), but that facility was heavily damaged in a fire in May, 2018 and operations were not
resumed. The company had developed a new MRF in Hodgkins, Illinois, which it has
deemed its “MRF of the future”. The facility is projected to start operating prior to the close
of 2019. This new MRF is intended to replace the former CID MRF and the Grayslake MRF.
Few details are available on this new facility, other than it will be highly automated.
As discussed later in this section, Chicago-area MRFs routinely make the list of the largest
MRFs in the U.S. The fact that the region hosts 6 such MRFs (at a given time) indicates
that there is demand for processing services, and also that there is competition for
processing services. However, most of the MRFs are located in the southern portion of the
region, and once the WM-Grayslake MRF ceases processing operations, there will be only
one MRF in the northern suburbs. SWALCO communities will face greater transport
distances to access existing regional MRF capacity.
General operating parameters for the Chicago-area MRFs are summarized in Table 3. Most
of the MRFs were developed in the 1990s, although all of those older facilities were
upgraded to single-stream capabilities in the 2000s. Lakeshore, a more recent entrant to
the Chicago hauling market, developed its single-stream MRF in 2015.
TABLE 3. CHICAGO AREA SINGLE-STREAM MRFs
Year Single-Stream Bldg Size
Facility/Location Notes
Opened Upgrade (sq. ft)
Customer Mix: 60/40 resid/comm
Groot
1997 2013 66,000 Residue: 11.5%
(Elk Grove)
SS Equip. Costs: $8,000,000
Customer Mix: 50/50 resid/comm
Lakeshore
2015 2015 44,000 Residue: 17%
(Forest View)
SS Equip. Costs: $8,500,000
Customer Mix: 60/40 resid/comm
Diversified
2000 2010 N/A Residue: 12.5%
(Homewood)
SS Equip. Costs: $3,500,000+
Customer Mix: 80/20 resid/comm
Resource Mgt.
1996 2001 250,000 Residue: 13%
(Chicago Ridge)
SS Equip. Costs: N/A
Customer Mix: 80/20 resid/comm
Resource Mgt.
1991 2007 N/A Residue: 10%
(Plainfield)
SS Equip. Costs: N/A
Customer Mix: 80/20 resid/comm
Waste Mgt.
1997 2004 32,000 Residue: 14.7%
(Grayslake)
SS Equip. Costs: $4,300,000
Customer Mix: 80/20 resid/comm
Waste Mgt. Residue: 9.5%
1995 2005 150,000
(CID) SS Equip. Costs: N/A
Shuttered after fire in May, 2018.
Source:
1. Governmental Advisory Associates, Inc. (GAA), 2016-2017 Database on Material Recovery
Facilities and Mixed Waste Processing Facilities in the U.S.
2. All data (including contamination rates) are as reported to GAA. SWALCO staff belief the WM-
Grayslake MRF was converted to single-stream capability in 2002.
11 SWANCC/SWALCO Recycling Market Study
December, 2019Outbound Shipments
Table 4 shows historical tonnage throughput at Chicago-area single-stream facilities based
on survey data reported by the MRFs to Recycling Today, an industry trade magazine14.
The purpose of Recycling Today’s survey is to identify the largest MRFs in the U.S.; the fact
that all Chicago-area facilities make this list is evidence that region has strong demand for
processing capacity, and also that the local market for processing services is competitive.
It should be noted that the data reflect outbound tons (i.e., processed tons that are sold) as
opposed to inbound tons (which include residue). Further, because at least one facility did
not report tonnage in each of the years included in the table, care must be used in
interpreting the grand totals (which are provided for convenience only).
TABLE 4. HISTORICAL OUTBOUND TONNAGE AT CHICAGO AREA SINGLE-STREAM MRFs
Facility Change
2009 (tons) 2011 (tons) 2014 (tons) 2016 (tons) 2018 (tons)
(Location) (2014-2018)
Groot (29,668)
100,000 103,300 151,909 127,600 122,241
(Elk Grove) (19.5%)
Resource Mgt. (54,925)
337,402 344,907 258,232 222,433 203,307
(Chicago Rdg) (21.3%)
Resource Mgt. (62,269)
Not Reported 110,000 125,513 84,433 63,244
(Plainfield) (49.6%)
Waste Mgt. (22,222)
121,796 112,557 128,520 115,012 106,298
(Grayslake) (17.3%)
(169.084)
Subtotal N/A 670,764 664.174 549.478 495.090
(25.5%)
Lakeshore
Not Open Not Open Not Open Not Reported 84,518 N/A
(Forest View)
Diversified
98,000 86,722 94,500 156,000 Not Reported N/A
(Homewood)
Waste Mgt.
106,962 100,469 112,744 98,732 Not Reported N/A
(CID)
Grand Total 764,160 857,955 871,418 804,210 579,698 N/A
Source:
1. Recycling Today magazine, various issues.
Note:
1. The WM-CID MRF experienced a major fire in May, 2018 and did not resume operations.
2. Totals are reported for convenience. Since all facilities did not report in each year, care must be used in
interpreting totals.
14 Unlike landfills, MRFs are not required to report capacity or throughput information to the Illinois
Environmental Protection Agency.
12 SWANCC/SWALCO Recycling Market Study
December, 2019From these data, we make the following observations:
It generally appears that 2014 was a peak year for outbound shipments. This
observation is confirmed by considering the four facilities (Groot-Elk Grove, RM-
Chicago Ridge, RM-Plainfield, and WM-Grayslake) that all reported tonnage data in
2014 and 2018. Each of those four facilities reported a decline in outbound
shipments between 2014 and 2018. On a combined basis, outbound shipments
declined by approximately 169,000 tons (= 664,000 tons – 495,000 tons), or
26 percent.
Some of the tonnage lost by the four facilities may have been due to competitive
reasons. Lakeshore opened its single-stream MRF in 2015, and shipped
approximately 85,000 tons of processed recyclables in 2018. Thus, of the 169,000
tons lost by the four facilities, approximately 50 percent could potentially be
attributed to the opening of the Lakeshore MRF.
Although Diversified-Homewood did not report data in 2018, they did report an
increase in outbound shipments of 61,500 tons between 2014 and 2016. If it is
assumed that this tonnage was also competitively drawn away, the four facilities still
experienced a decline of 22,500 tons between 2014 and 2018 (= 169,000 tons –
85,000 tons – 61,500 tons).
The WM-CID MRF did operate for 5 months in 2018, until a major fire shuttered the
facility. Although the facility did not provide data in the 2018 survey, using 2016 data
it can be reasonably estimated that for the first five months of 2018, WM-CID
shipped approximately 41,000 of processed recyclables. This would leave, however,
approximately 58,000 tons of material for the last seven months of the year. It is not
known where this material was diverted to: certainly not the four facilities initially
identified (at least on a net regional basis), because those facilities experienced a
tonnage loss; and probably not Lakeshore or Diversified either (again, on a net
regional basis), because those facilities absorbed only a portion of the tonnage lost
by the four facilities initially identified15. SWALCO staff indicated that much of the
material following the WM-CID fire may have been shipped to a Waste Management
MRF in Germantown, Wisconsin and possibly another MRF in Indiana16.
MRF Capacity
There have been anecdotal reports that MRF processing capacity in the Chicago-metro
region may be constrained due to higher contamination rates and the need to slow
processing lines to remove the contamination17. As will be discussed further in Section 7.0,
increased contamination has been widely reported and some MRF operators have
indicated that they have had to add labor and slow down processing lines.
15 Unless Diversified significantly increased tonnage again in 2018.
16 Telephone communication with Peter Adrian, December 9, 2019.
17 Following the fire at the WM-CID MRF in May, 2018, Waste Management sent a notification
letter to the Village of Hillside (and presumably other municipal customers) stating that the
company was having difficulty diverting the material to another MRF due to limited capacity at
recycling facilities (which the letter attributed to changes in global commodity markets stemming
from import restrictions imposed by China). That, however, is a unique situation in that the WM-
CID facility was processing approximately 100,000 to 110,000 tons per year of recyclables, and
diverting that quantity of material to a single MRF would be a challenge in any circumstance.
13 SWANCC/SWALCO Recycling Market Study
December, 2019Processing capacity is challenging to assess because, unlike landfills, MRFs are not
required to report capacity to the Illinois EPA. MRFs also operate on shifts, and a facility
can increase its capacity by adding an additional shift.
Table 5 presents incoming tonnage data for the WM-Grayslake facility and the two
Resource Management MRFs. SWALCO receives monthly tonnage reports from the WM-
Grayslake facility which identify incoming tons, residue tons, and outgoing “sold” tons.
Incoming tonnages at the Resource Management facilities were estimated using the
outbound tonnages reported to Recycling Today, and residual percentages that the
company has reported in public presentations (see Section 7.0).
TABLE 5. HISTORICAL INBOUND TONNAGE AT SELECT CHICAGO-AREA SINGLE STREAM MRFs
Change
Facility 2014 2015 2016 2017 2018 (2014-
2018)
WM-Grayslake
(14,329)
Incoming Tonnage 146,558 138,330 128,298 134,003 132,229
(9.8%)
Residual (%) 12.67% 13.14% 9.87% 12.58% 20.20%
8,147
Residual (Tons) 18,563 18,178 12,665 16,853 26,710
43.9%
(17,807)
Outbound Tonnage 123,081 120,027 113,154 114,779 105,275
(14.5%)
Resource Mgt. (2 MRFs)
(97,201)
Incoming Tonnage 456,676 387,555 359,475
(21.3%)
Residuals (%) 16.0% 20.8% 25.9%
19,993
Residuals (Tons) 72,931 80,689 92,924
27.4%
(117,194)
Outbound Tonnage 383,745 306,866 266,551
(30.5%)
Source:
1. WM-Grayslake date from facility tonnage reports provided to SWALCO.
2. Resource Management outbound tonnage data from Recycling Today magazine. Residual percentages
from Resource Management’s Residential Curbside Recycling presentation to the Village of LaGrange
Environmental Commission, June 13, 2019. Incoming tonnage calculated by dividing the reported
outbound commodity tonnages by (1 – residual %).
Based on the date in Table 5, the following observations are made:
Although residue percentage increased markedly in 2018 for the WM-Grayslake
facility, incoming tonnage was down only modestly from 2017 and actually
increased from 2016, when contamination levels were much lower. This suggests
that Waste Management did not turn away tonnage in 2018 to address higher
contamination.
14 SWANCC/SWALCO Recycling Market Study
December, 2019 Further, contamination at the WM-Grayslake MRF was relative stable between 2014
and 2017, ranging from approximately 10 percent to 13 percent. Incoming tonnage
during that time period, however, generally shows a downward trend. This suggests
that the loss in tonnage was due to other factors, such as competition, as opposed
to a deliberate reduction in tonnage to better address material contamination.
In addition to residential single-stream recyclables, the WM-Grayslake MRF also
accepts source separated commercial fiber material, including office paper and
cardboard. Although not evident from the summary tonnage data shown in Table 5,
incoming commercial paper declined from 43,000 tons in 2014 to 12,700 tons in
2018, which was partially offset by larger amounts of residential single-stream
recyclables. Commercial paper streams are typically cleaner than residential single-
stream materials, and therefore the drop in overall facility tonnage again appears to
be related to competitive factors more than a slowing down of process lines.
SWALCO staff indicated, for instance, that some area haulers may be taking
commercial cardboard to Alan Josephsen and C&M Recycling, two local recycling
companies18.
Resource Management reported higher overall contamination rates, with residuals
growing from 16 percent in 2014 to 26 percent in 2018. However, as was noted in
the discussion on regional outbound tonnages, the decline in tonnage at the
Resource Management MRFs as well as the WM-Grayslake and Groot-Elk Grove
facilities can in large measure be attributed to the opening of the Lakeshore MRF
and increased throughput at the Diversified-Homewood MRF.
Both Resource Management and Waste Management were interviewed by Recycling
Today magazine as part of the 2018 survey of MRFs. Both companies indicated that low
commodity prices and contamination are the primary challenges facing recycling, and those
are being addressed through tipping fees charged to customers. Neither company cited a
shortage in MRF capacity as being a market challenge; in fact, Waste Management
reported that it had lost some major customers as the result of fee increases.
Resource Management (interview with Cal Tigchelaar, President): He says that the
two biggest challenges facing MRF operators today are low commodity prices along
with increasing inbound material contamination levels. Tigchelaar says,
“Unfortunately both of these factors have forced the processing industry to impose
significant tip fees in order to remain viable. Materials arriving at our facility, which in
the past have produced revenue for our suppliers, have now become a cost to them.
Current tip fees for single-stream material arriving at MRFs in our area exceed tip
fees for trash being delivered to area landfills, and it is unlikely that this trend will
reverse anytime soon. As tip fees at MRFs continue to increase, decision-makers at
the municipal level will need to make decisions regarding the ongoing economic
viability of their recycling programs. (Recycling Today, Seismic Shifts, September
17, 2019)
Waste Management (interview with Brent Bell, Vice President of Recycling): “We’ve
seen tonnage down slightly from 2017 to 2019, although roughly half of our facilities
have a positive volume swing from those time periods,” Bell says. He adds where
MRFs saw a decrease in tonnage, the shift was driven by Waste Management’s
new recycling pricing model. “Since 2017, we’ve come out with a new recycling
18 Telephone communication with Peter Adrian, December 9, 2019.
15 SWANCC/SWALCO Recycling Market Study
December, 2019pricing model to make sure we can continue our investments in recycling,” Bell says.
“In order to do that, we had to recover our processing costs.” He adds, “Our goal is
to make sure we can offer this service to customers. Some of these cities just can’t
afford to pay for recycling like they’ve seen in the last year, so we’re trying to create
a model that works long-term, economically and environmentally.” The new pricing
strategy has caused “us to lose some major customer contracts”, Bell says.
(Recycling Today, Seismic Shifts, September 17, 2019)
As was noted previously, Waste Management has developed a new MRF in Hodgkins,
Illinois, which it intends as a replacement for the capacity at both the WM-Grayslake facility
and its fire-damaged CID-MRF. Although operating parameters such as throughput and
capacity have not been disclosed, presumably it will be a large facility since the Grayslake
and CID facilities have historically shipped in excess of 240,000 tons per year of processed
recyclables. The WM-Hodgkins MRF is planned to be operational by the end of 2019.
16 SWANCC/SWALCO Recycling Market Study
December, 20194.0 RECYCLABLE COMMODITY PRICES
Recyclable commodity prices were very strong in 2011, but have since declined, particularly
over the past 2 years since China imposed import restrictions. In this Section, prices for
individual commodities as well as the blended average value (ACR) will be assessed.
Paper
Historical trends in paper prices over the last 10 years are shown in Figure 219. Note that
these are “as-sold” prices (i.e., the price received for each ton of the specified paper grade).
FIGURE 2. HISTORICAL PAPER PRICES
Based on these data, the following observations are made:
Paper prices are at 10-year lows. Some industry participants have indicated that
paper prices have declined to 25-year lows.
Although paper prices were at similar depressed levels in 2009 (i.e., following the
Great Recession), they rapidly recovered. Paper prices were generally high during
the years 2010-2011, largely driven by strong export demand from China20.
Prices then receded to more modest levels before peaking again in 2017. In that
year, cardboard prices rose to the levels seen in 2010-2011. Newspaper and mixed
paper also rose, though not to the prior peak.
19 For simplicity and unless otherwise noted, SWALCO’s historical commodity prices are presented
in this Section.
20 Wall Street Journal, Scrappy Collectors Profit from China’s Paper Needs, March 30, 2011.
17 SWANCC/SWALCO Recycling Market Study
December, 2019 In 2017, concerned about the level of contaminants in imported recyclables, China
announced that as of January, 2018, it would ban the import of 24 types of scrap
materials (including mixed paper). Effective March 1, 2018, allowable contamination
in imported paper and plastics was reduced from 1.5% to 0.5%, a standard which
many industry observers have said cannot be attained by MRFs in the U.S. This
“National Sword” policy triggered the subsequent precipitous drop in paper prices.
Although clean (largely preconsumer) materials are still exported to China, they are
subject to tariffs under the on-going trade dispute between the U.S.
Since 2017, cardboard prices have dropped from $165/ton to $30/ton, newspaper
prices have declined from $100/ton to $20/ton, and mixed paper prices have
decreased from $80/ton to $0/ton. In some markets, the value of mixed paper is
negative (i.e., a fee must be paid to an end user to accept it).
As will be discussed at the end of this Section, a number of new or expanded
domestic mill projects in the U.S. have been announced. However, it will take time
for those projects to come on-line. Most industry experts expect that paper prices
will remain depressed for at least several years.
Aluminum
Aluminum has generally followed a similar trend as paper (see Figure 3). Although the trend
line appears flatter than for paper, the actual spread between the peak in early 2011 and
current prices in 2019 is nearly $1,000/ton. Though only accounting for about 1 percent of
the weight of single stream recyclables, aluminum contributes over $20 to the average per
ton value (ACR) of recyclables in strong markets, and over $11 in poor markets.
FIGURE 3. HISTORICAL ALUMINUM PRICES
18 SWANCC/SWALCO Recycling Market Study
December, 2019Tin/Bimetal
The price for tin and bimetal cans tends to move in step-wise fashion, with less variability in
month-to-month changes than other commodities. Current prices for this material are also
at 10-year lows.
FIGURE 4. HISTORICAL TIN/BIMETAL PRICES
Plastics
Plastics tend to exhibit greater short-term variability than other commodities (refer to
Figure 5). The overall trend for PET and HDPE (colored) has been downward since 2011,
and current prices for those resins are near 10-year lows. Natural HDPE (i.e., milk jugs)
prices have fared better, fluctuating between $600 and $800 per ton since 2011, with a brief
peak above $1,100 per ton in the autumn of 2014. Similar to aluminum, plastic containers
are light weight and account for only about 4.5 percent of the weight of single stream
recyclables. Despite their relatively light weight (as well as criticism from some groups that
increasing amounts of plastics are a sign of a “throwaway” society), HDPE and PET plastic
containers contribute over $28 to the average per ton value (ACR) of recyclables in strong
markets, and nearly $14 in poor markets. Under the current poor market conditions,
aluminum and plastic containers account for 85 percent of positive commodity values in
single-stream recyclables.
Although China’s National Sword policy also placed restrictions on imports of mixed plastic
materials, commodity prices for plastics have not been impacted as dramatically as paper
prices. Waste Management has adopted a policy that it will not export the plastics it collects
on residential routes and processes through the company’s single-stream MRFs.
19 SWANCC/SWALCO Recycling Market Study
December, 2019FIGURE 5. HISTORICAL PRICES FOR PLASTIC RESINS
Glass
Glass has had a negative commodity value throughout the period 2009 - 2019 (see
Figure 6), meaning that there is a cost to market the material. Most MRFs do not separate
incoming glass by color, and instead send a 3-mix glass stream to secondary processors
for further clean-up21. Some of the double-processed glass is marketed to container
manufacturers, but significant amounts are used for fiberglass and sand blasting material.
Glass is considered to be a challenging material for MRFs, increasing wear and tear on
equipment. Glass is also problematic as a contaminant in paper and other commodity
streams.
21 Resource Management is an exception, having invested in glass beneficiation equipment at its
MRF.
20 SWANCC/SWALCO Recycling Market Study
December, 2019FIGURE 6. HISTORICAL PRICES FOR GLASS (MIXED)
AVERAGE COMMODITY VALUES AND COMPARISONS
It was noted previously that in both good and poor commodity markets, aluminum and
plastic containers contribute significantly to the blended average value of single-stream
recyclables. Figure 7 sheds some additional light on the relative values of the paper and
container streams.
In this figure, the historical average “as-sold” prices of paper and containers (plastic,
aluminum, and glass) are compared. The “as-sold” prices are based on outbound tons and
do not include the impacts of residue; however, the “as-sold” price for containers does
include the negative value of glass. Residue costs were excluded in this comparison in
order to compare the ultimate value of clean, processed materials.
The ratio of paper to containers in the “as-sold” stream is approximately 70 percent to
30 percent in the SWALCO program, and 75 percent to 25 percent in the SWANCC
program22.
Figure 7 indicates that throughout the period 2009 - 2019, the average value of a ton of
processed containers exceeded the average value of a ton of processed paper. Paper
prices are currently so low that nearly all of the value of single-stream recyclables is
attributable to containers.
22 As was noted in Section 2, the composition of SWALCO’s recyclables had been periodically
audited. In 2009, SWALCO’s single-stream recyclables were approximately 73 percent paper
and 27 percent containers.
21 SWANCC/SWALCO Recycling Market Study
December, 2019FIGURE 7. COMPARISON OF PAPER AND CONTAINER COMMODITY VALUES
Although containers have higher value than paper, they are also more expensive to process
on a per ton basis due to their lighter weight. For instance, Resource Management reports
that up to 30 sequential sorts are required to fully segregate plastic containers into their
specific resins23. In good commodity markets, paper will bring in more total revenue than
containers. In 2011, for instance, paper materials would have accounted for 62 percent of
total commodity revenues (versus only 12 percent in 2019).
Figure 8 shows a comparison of ACR (which includes the negative value of residue and
glass) to Adjusted ACR (which excludes those negative value materials). ACR is the more
important metric to SWALCO and SWANCC, because that is the benchmark value used in
their respective contracts for the purpose of computing revenue share. However, as was
discussed in Section 2.0, Adjusted ACR values were calculated in order to make
commodity pricing data for SWANCC and SWALCO more comparable to the commodity
prices reported by the publicly-owned MRFs evaluated as case studies.
The spread between ACR and Adjusted ACR began to widen in 2015, and then again in
2017. This corresponds to years in which the composition of SWALCO’s single-stream
material was adjusted following a material audit. Residue increased in both of those years.
As of 2019, negative value materials (glass and residue) amounted to 33.6 percent, or one
third of all material placed into recycling carts. When commodity prices are low, there is less
revenue from other materials to subsidize the cost of managing glass and residue.
23 Greg Maxwell, Resource Management, Residential Curbside Recycling presentation to the
Village of LaGrange Environmental Commission, June 13, 2019.
22 SWANCC/SWALCO Recycling Market Study
December, 2019FIGURE 8. IMPACT OF GLASS/RESIDUE ON AVERAGE COMMODITY REVENUES
One question that is often raised is what factors drive commodity prices? Clearly,
international trade is a factor -- when China was buying U.S. recyclables, paper prices were
driven higher, and when China restricted imports, prices fell.
Oil prices (and energy costs generally) are also cited as a factor that impact the waste and
recycling industry. Figure 9 shows a comparison of the historical trend in recyclable
commodity values versus oil prices (as measured by the monthly average price for West
Texas Intermediate light crude). The two time-series trends show some overall similarity. A
regression analysis of ACRs versus oil prices (Figure 10) indicates that the correlation is
statistically significant at the 95 percent confidence level, and that changes in oil prices
account for approximately 37 percent of the change in recyclable commodity prices.
23 SWANCC/SWALCO Recycling Market Study
December, 2019FIGURE 9. HISTORICAL TRENDS IN RECYCLABLE COMMODITY AND OIL PRICES
FIGURE 10. CORRELATION BETWEEN RECYCLABLE COMMODITY AND OIL PRICES
24 SWANCC/SWALCO Recycling Market Study
December, 2019Future Market Conditions
Given the significant decline in commodity prices since 2017 (and the even larger drop from
peak values in 2011), a logical question is, when will markets improve? Is this a temporary
market downturn or a longer-term shift in market conditions?
It is difficult if not impossible to forecast future commodity markets. China’s National Sword
policy, for instance, was not anticipated until it was announced, even though China had
begun to impose tighter import restrictions years earlier.
In our research for this study, no industry participant indicated that a bottom in prices had
been reached. Instead, the expectation is that commodity prices, particularly for paper, will
remain depressed for several years.
For instance, on its 2019-Q2 earnings call, Waste Management’s CEO stated24:
“Look, we’re at 25-year lows on OCC pricing. We’re getting zero for mixed paper, and
this business has really fallen off a cliff.” That -- those are real facts that we’re bringing
to the negotiating table with some groups that have pretty big purchasing power. As
opposed to just coming in and saying, “Look, these are the normal ebbs and flows of a
business. And we’re in kind of a down cycle right now, but we think it will come back.” I
wish I was as optimistic as that.
Speaking at WasteCon (an industry trade show) in October, 2019, Republic Services’
President stated25:
“We’re not in a cyclical change for this business, we’re in a structural change.”
Paper industry expert Bill Moore, speaking at Waste Expo (another industry trade show) in
May, 2019, commented26:
“It’s going to be many years before we get back to a decent market, a robust market.”
In its most recent annual report, Casella Waste Systems states27:
“We expect markets to remain depressed into the foreseeable future.”
24 Thomson Reuters Streetevents, Edited Transcript, Q2-2019 Waste Management Inc. Earnings
Call, July 25, 2019.
25 Waste Dive, Republic’s Vander Ark: Recycling Challenges Structural, not Cyclical, Oct. 28, 2019.
26 Resource Recycling, Not Much Light at End of Mixed-Paper Tunnel, June 25, 2019.
27 Casella Waste Systems, 10-K Annual Report, 2018.
25 SWANCC/SWALCO Recycling Market Study
December, 2019You can also read