Sustainable Logistics for Europe - The Role of Ports - Port of Rotterdam
←
→
Page content transcription
If your browser does not render page correctly, please read the page content below
Sustainable Logistics for Europe
The Role of Ports
Rob de Leeuw van Weenen, Menno Menist,
Wouter van der Geest, Sean Newton, Olaf Lagerwerf

Zoetermeer, May 24, 2016

The responsibility for the contents of this report lies with Panteia. Quoting numbers or text in
papers, essays and books is permitted only when the source is clearly mentioned. No part of
this publication may be copied and/or published in any form or by any means, or stored in a
retrieval system, without the prior written permission of Panteia. Panteia does not accept
responsibility for printing errors and/or other imperfections.

This study is commissioned by the Port of Rotterdam Authority and Deltalinqs
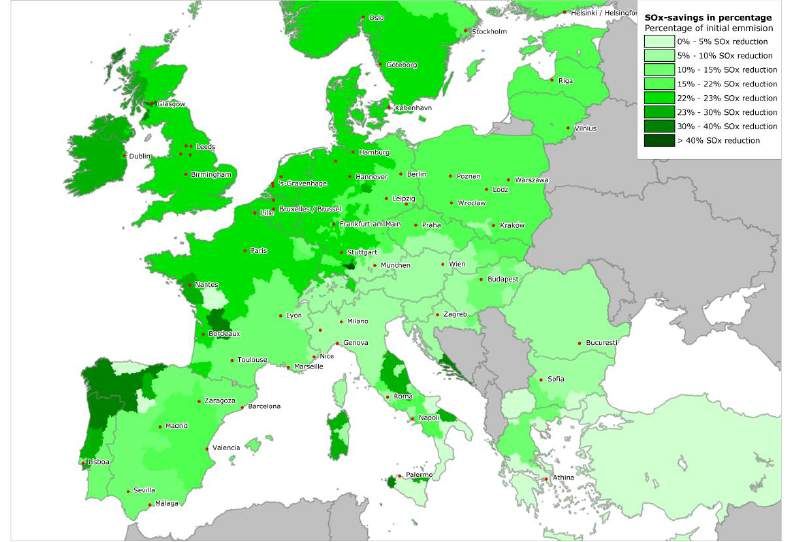
Table of contents

         Executive summary                                                         5

         1     Background                                                         13
         1.1   Introduction                                                       13
         1.2   Sustainability: current legal context                              15
         1.3   Contents of this report                                            17

         2     Scope of this study                                                19
         2.1   Geographical scope, cargo sector and time horizon                  19
         2.2   Focus on climate change and air pollution                          19

         3     External factors that influence the transport market               21
         3.1   Macro-economic environment                                         21
         3.2   Global trade relations                                             22
         3.3   Price of fuels                                                     23

         4     The logistics chain                                                27
         4.1   Maritime transport                                                 27
         4.2   Activities in the ports                                            32
         4.3   Hinterland transport                                               35

         5     Perspective of market parties                                      39
         5.1   Characteristics of cargo owners and operators consulted             39
         5.2   Market parties’ view on reduction of climate change and air pollution
               in the transport chain                                              40

         6     European impact of sustainable logistics                           47
         6.1   Set-up of the model                                                47
         6.2   Impact of drivers on a European scale                              51
         6.3   Scenario analysis                                                  58
         6.4   Conclusions European impact                                        65

         7     Main findings                                                      67
         7.1   How cargo owners and operators view sustainability                 67
         7.2   General                                                            67
         7.3   Maritime transport                                                 68
         7.4   Activities in the port                                             68
         7.5   Hinterland transport                                               69
         7.6   Impact of scenarios on a European scale                            70

         Tables                                                                   73

         Figures                                                                  75

         Bibliography                                                             77

         Appendix 1: Model description                                            87

                                                                                        3
C11627
Executive summary
Sustainability and the role of ports
Sustainability is becoming an increasingly important objective for the entire
production chain, including transport, a sector in which there are still substantial gains
to be realised in reducing environmental impacts. In this 2016 study, Panteia were
commissioned by the Port of Rotterdam Authority and Deltalinqs (Rotterdam Port and
Industry association) to carry out an independent investigation into the role that can
be played by seaports in stimulating higher levels of environmental efficiency. The
study involved an interview programme with key players in the market, and a
modelling exercise to analyse the environmental impacts of container transport
between the Far East and Europe.
Commercial Factors are still decisive in transport
Transport is traditionally a sector in which commercial factors are decisive, but
consumers increasingly value sustainability, and increasing pressure is being placed
on consumer goods manufacturers to produce in a more sustainable way. From the
interviews it emerged that measures to reduce CO₂ emissions are considered the most
important. However, transport services are still chosen largely on the basis of cost s
and service quality. Therefore the most successful initiatives are likely to be those
fostering lower costs and, simultaneously, lower emissions. Key drivers for achieving
lower rates of emissions through fuel efficiency include:
Mode substitution
Scale of transport
Reduction of empty running and overcapacity
Fleet modernisation
Maritime transport is a green mode of transport, but more can
be done
Numerous studies agree that rates of greenhouse gas emissions per tonne -kilometre
are substantially lower for maritime transport than for land transport. Our models
show that CO₂ emissions in 2016 for a large container vessel on the Europe-Far East
trade lane are around ten times lower per tonne-km than road transport. In recent
years this gap has increased due to the use of larger ships with more modern engines.
However, the rate of increase in CO₂ efficiency is slowing down, and gains are being
eroded by overcapacity in the maritime sector. So, while maritime transport remains
the greenest transport mode, more can be done to reduce the high absolute levels of
emissions arising from intercontinental transport.
Levels of emissions on Europe-Far East services vary
significantly
By analysing ship deployment across a range of Far East - Europe container services it
is possible to see that levels of emissions (kg of CO 2 per TEU per day) differ greatly
depending upon the size and age of the vessel. The figure below shows how the use of
larger vessels with more modern engines reduces average rates of CO 2 emission.
5
C11627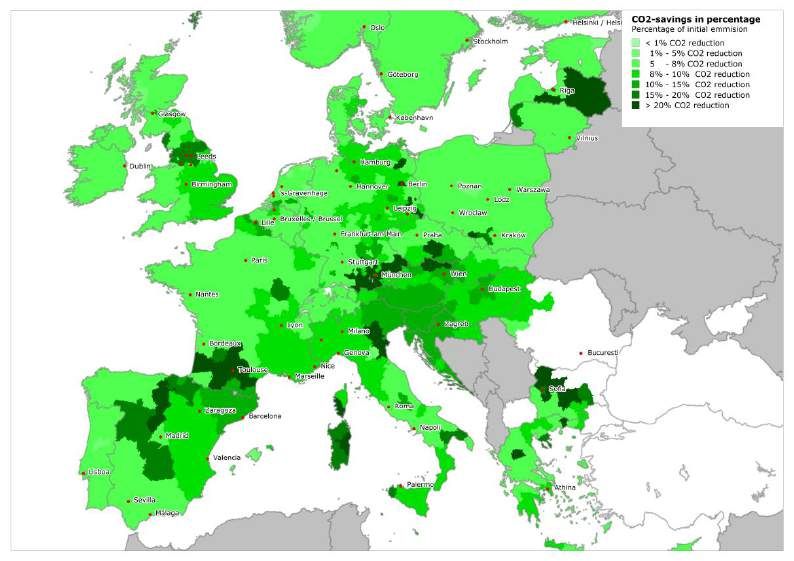
140

      CO₂-emission in kg/TEU/day   120

                                   100

                                   80

                                   60

                                   40

                                   20

                                    0
                                    5000           7500        10000         12500        15000       17500         20000
                                                                              TEU

                                         2015                          2014                         2013
                                         2012                          2011                         2010
                                         2005 - 2010                   2000 - 2005                  1995 - 2000
                                         Linear (2015)                 Linear (2005 - 2010)

    The most efficient vessels may achieve levels of CO 2 emission close to 30 kg per TEU
    per day given high load factors, whereas at the other end of the scale, levels of over
    120 kg per TEU per day are found. For a 30 day voyage, these differences result in
    substantianlly differing levels of environmental impact per unit shipped. It is
    noticeable that the majority of European gateway ports can now receive vessels
    capable of achieving levels of emissions close to the best standards available. Severe
    commercial pressures to reduce fuel costs through economies of scale have stimulated
    rapid progress in this area. For a number of large seaports in Europe the level of CO 2
    emission for ships calling is shown in the figure below.

             Venice (#1)
            Trieste (#2)
             Rijeka (#2)
              Koper (#2)
        Barcelona (#7)
                Fos (#5)
             Genoa (#7)
           Valencia (#7)
       Marsaxlokk (#7)
            Piraeus (#8)
         La Spezia (#5)
       Gioia Tauro (#2)
           Istanbul (#3)
          Le Havre (#7)
       Antwerpen (#8)
        Constanta (#1)
        Hamburg (#14)
     Southampton (#6)
      Rotterdam (#16)
          Algeciras (#3)
      Felixstowe (#10)
         Goteborg (#2)
            Aarhus (#1)
            Gdansk (#2)
     Bremerhaven (#4)
                                                  0       20     40         60       80       100    120      140    160
                                                                         kg CO2 per TEU per day

6
                                                                                                                            C11627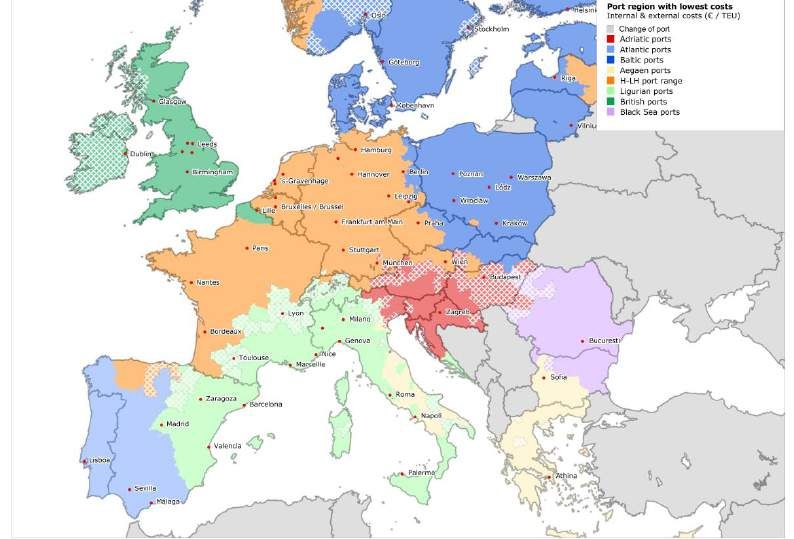
These figures depend upon the shipping lines achieving high load factors, so smaller
         vessels, with higher rates of CO₂ emissions per TEU per day, may still be optimal for
         specific trades.

         Sustainability needs to be tackled by analysing whole transport
         chains.
         Maritime and inland transport are often regarded as completely separate distribu tion
         systems, but to be able to manage environmental impacts effectively it is necessary to
         analyse whole transport chains. Port choices made by shipping lines dictate the entry
         and exit points into the hinterland networks. Often these choices are linked t o
         agreements and relationships between shipping lines and container terminals, and
         they are not necessarily optimised to minimise overall transport distances. The model
         analysis shows that a typical TEU imported from the Far East to Central Europe on a
         modern, large containership will generate 800-1 000 kg of CO 2 emissions on the
         maritime leg, around 25 kg in the port itself, and up to 700 kg in the hinterland,
         depending on the inland distance and the choice of inland mode. Some margin of
         savings are possible at the European end of the maritime leg, but the hinter land
         portion can be reduced substantially by landing the container close to point of final
         consumption at a port with short-sea, rail and/or inland waterway connections. Port
         choice is therefore the crucial factor in optimising transport chains.

         Ports are the link between maritime and inland transport legs
         Emissions of greenhouse gases arising from port activity are minimal in comparison
         with those arising from transport operations (around 1-3% for Europe- Fareast
         container transport). However, interviewees identified a key role for ports as
         facilitators and stimulators for initiatives which have broader environmental impacts.
         Such    initiatives    include    providing     multimodal      connections,      application     of   ICT,
         platooning, and developing pilot projects for sustainable fuels. By playing a pro-active
         role, ports can bring cargo owners, transport companies, and other service providers
         together to develop innovative solutions.

         Optimised Transport Chains – Far East - Europe
         A model was constructed to analyse the routeing of containers on the Far East Europe
         trade lane from the perspective of internal and external costs, including CO 2, SO 2,
         NOx , and particulate matter (PM). This trade lane was selected because it accounts for
         54% of total laden containers imported to or exported from Europe. The aim was to
         use the model to select routes which minimise internal and external costs for all
         European NUTS3 regions 1. Thus, it selects a maritime service, a main port, a feeder
         port (if required) and a sequence of inland modes in optimal combination. The analysis
         was based upon current ship deployment and current inland freight services (short -
         sea, road, rail, and inland waterway) available at specific European seaports.

         Hinterland versus maritime costs
         A typical container from China to central Europe travels around 15 000 to 18 000 km
         by sea and up to 900 km by land, a ratio of approximately 20 to 1. However, because
         of the efficiency of modern container vessels, the ratio of maritime to inland external
         costs is approximately 70 to 30%. Examples of these ratios for a selection of routeings
         involving different port choices, across a range of different emissions is shown below.

         1
              For    more     detailed   information    on     the   geographical      NUTS-2013       regions,   see:
         http://ec.europa.eu/eurostat/web/nuts/overview. This nomenclature of territorial units comprises 1342 regions
         on a European level.

                                                                                                                         7
C11627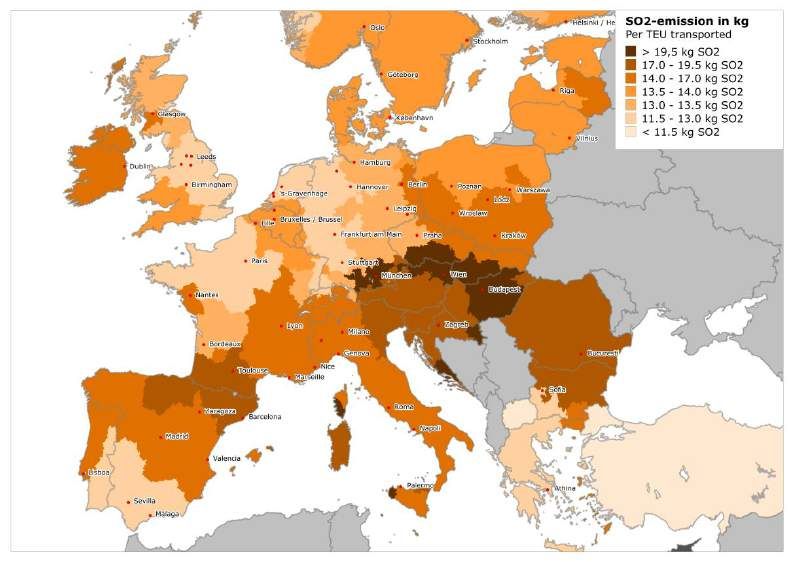
Emissions on a voyage China - Munich via different European seaports
1400 40
Air pollutants emission (kg/TEU)
CO2-emission (kg/TEU)
1200 35
1000 30
25
800
20
600
15
400 10
200 5
0 0
Rotterdam
Rotterdam
Rotterdam
Rotterdam
Antwerpen
Antwerpen
Antwerpen
Antwerpen
Hamburg
Hamburg
Hamburg
Hamburg
Koper
Koper
Koper
Koper
CO2 SOx NOx PM
Maritime Port Hinterland
Port choice determines:
The maximum size of intercontinental vessel that can be used for the Asia to
Europe leg, and therefore the rate of emissions at sea.
The distance to the hinterland, and the range and attractiveness of inland
modes which can be used for the hinterland leg.
The model calculates the most efficient route, using (1) internal costs only, and (2) a
combination of internal and external costs. The shaded areas in the maps below show
the effect of internalising external costs in terms of hinterland that is lost and won by
the various port clusters.
Hinterland lost by port clusters as a result of internalisation of external costs
8
C11627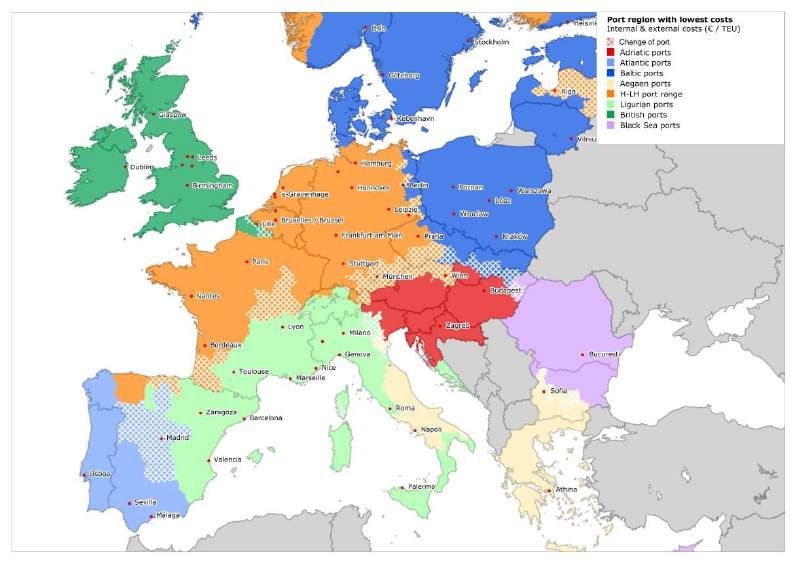
Hinterland won by port clusters as a result of internalisation of external costs
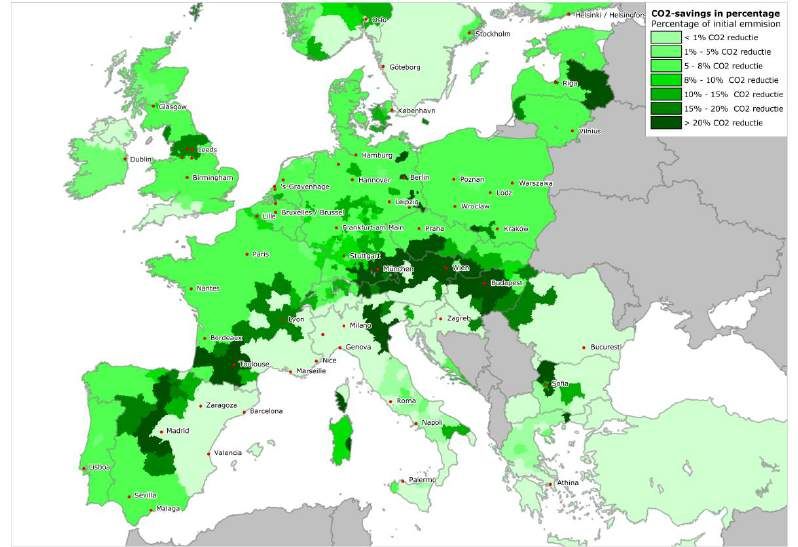
The maps show that internalising external costs across the whole chain makes
relatively little difference to port choice. In general the optimal route choice is the one
which lands the containers close to their final point of consumption, for all European
regions. This is explained by the fact that the high volumes, the deployment of large
vessels and the presence of sulphur emission control areas help to compensate the
routes involving more distant ports (e.g. North Sea and Baltic) for the extra few days
sailing around the coastline. Therefore the hinterland costs which are significantly
higher per unit per kilometre than maritime costs are still the decisive factor, for
determining the optimum port choice for each region.
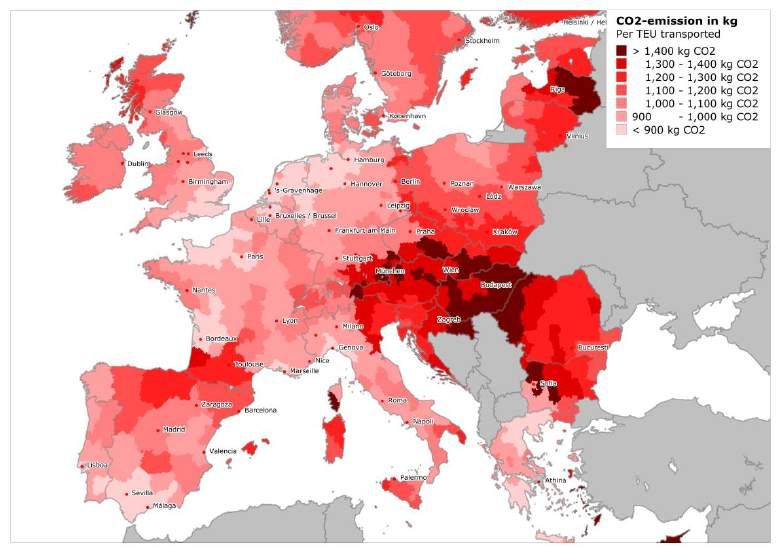
CO 2 and SO 2 emissions
The maps below indicate the sum of maritime and hinterland emissions (CO 2 and SO 2)
for a container imported from China to every EU NUTS3 region, based on optimised
routeings.
9
C11627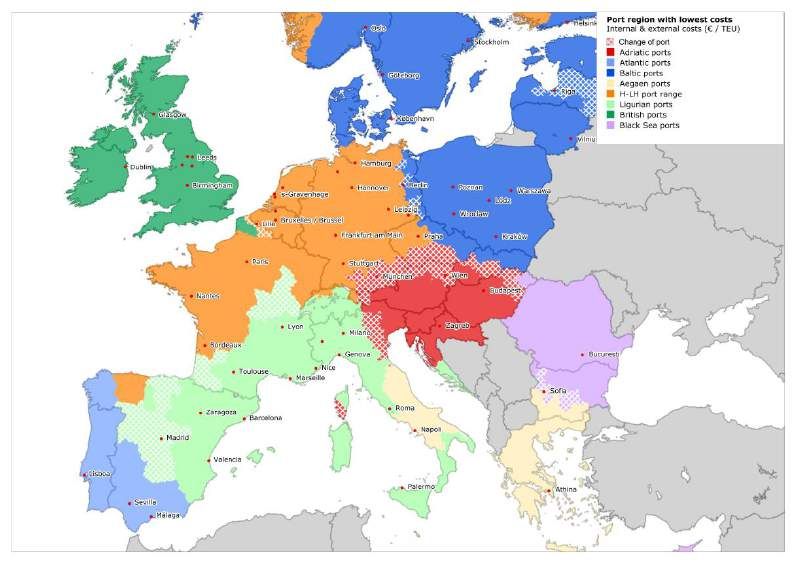
CO 2 emission of the entire transport chain, mapped onto destination-regions

     SO 2 emission of the entire transport chain, mapped onto destination-regions

     Lowest emissions are generally found in regions close to the ports where the most fuel
     efficient vessels are calling. Greece, southern Italy, southern Spain, southeast
     England and the northern coastline of continental Europe are good examples. Where
     there are dense networks of inland waterway and rail services attached to the
     gateway ports e.g. Belgium, Netherlands and Germany, the emission levels for inland

10
                                                                                              C11627
regions may also be below average. Highest emission levels are found for shipments
to land-locked regions or otherwise less accessible regions such as Hun gary, the Baltic
States, northern Spain and Scotland. An optimal routeing to Hungary would involve
the use of an Adriatic service and inland transport by road. The challenges faced differ
by geographical region. In southeast Europe, large gains can be real ised within the
maritime leg of the chain, and by developing intermodal inland transport to a greater
extent. Regions like Scotland, northern Spain, Ireland and the Baltic States which are
more distant from the main intercontinental hubs can benefit by the use of greener
short-sea services to avoid long overland hauls. Regions such as Benelux, northern
France and northern Germany, which already enjoy access to efficient maritime
services and multimodal inland connections, can benefit most from elimination o f
empty running, greater operational efficiency through digitalisation, and measures to
introduce cleaner fuels.
Conclusions
Interviewees indicated that they face renewed pressure to improve the sustainability
of their operations. Profitability demands sustainability. It is apparent that by 2016,
many quick-wins have been deployed, so in future it will be necessary for industry to
tackle more complex areas, including logistics, where cargo -owners have less direct
control and where end-consumers and policy-makers have less market or regulatory
leverage. Complexity arises due to the need to optimise the performance of long -
distance multimodal chains, and because open, global markets, such as inter -
continental shipping, operate according to commercial logic. Ports have a key role to
play as facilitators through the provision of infrastructure to enable the operation of
efficient deep-sea, short-sea and hinterland transport services. Now, this role also
extends to the deployment of ICT, alternative fuels such as LNG and biofuels, and
other forms of technical innovation.
11
C116271 Background
The Port of Rotterdam Authority and Deltalinqs (Rotterdam Port and Industry
association) have commissioned policy research company Panteia to carry out an
independent investigation of the role of ports in sustainable logistics for freight
transport via seaports.
In our approach, we first describe the transport chain, market developments and
relevant environmental legislation. Next, the results are presented of a consultation of
cargo owners and operators that were asked about their views on how sustainability
can be improved and the possible role European seaports can play. A model was then
used to determine if more sustainable transport will induce changes in the pattern of
the supply chains. In particular freight flows may shift from one seaport to another
and/or use different hinterland transport modalities. Finally, we conclude how the
seaports’ efforts could best be focused.
1.1 Introduction
Within the European Union (EU), including domestic transport, maritime transport
accounts for around 20% of transported goods 2. Five main markets can be
distinguished: the container market, the ro-ro market, the market for conventional
general cargo, the liquid bulk market, and the dry bulk market.
The EU is highly dependent on seaports for trade with the rest of the world and within
its internal market. The EU coastline extends to 66 000 km 3, bordering the Atlantic
Ocean, Mediterranean Sea, Black Sea and Baltic Sea. Measured in tonnes, 74% of
goods are imported from and exported to the rest of the world and 37% of the intra-
EU trade transit is through seaports 4. Ports guarantee territorial continuity of the EU
by servicing regional and local maritime traffic to link peripheral and island areas.
They are the nodes that facilitate multimodal logistic flows of the trans-European
network, using short-sea shipping, rail, roads and inland waterways links.
An important sector is the Asia-Europe container market, which has grown to become
the dominant European trade relation as a result of a specific form of globalisation, in
which a high proportion of new manufacturing investment has shifted to China since
the early nineties. All Asia - Europe-related freight traffic is directed via the Suez
Canal5.
The challenge here is to let the freight transport take place with minimal impact on
the environment and beneficial to a sustainable economic growth.
Paris climate conference
Currently, there is a growing worldwide concern for the environment and a crucial
event was the Paris Climate Conference in December 2015, where 195 countries
adopted the first-ever universal, legally binding global climate deal. The agreement
sets out a global action plan to put the world on track to avoid dangerous climate
2
Modal share of freight transport to and from EU ports. European parliament, 2015.
3
The World Factbook. CIA, 2016.
4
Modal share of freight transport to and from EU ports. European parliament, 2015.
5
For the outbound services, all but one service take the route to Asia via the Suez Canal. The FAL 8 Europe of
CMA/CGM however is directed via Cape Good Hope, taking a detour of about 2 000 nautical miles. In order to
re-attract vessels flows being redirected (mainly on the Asia – America services), the Suez Canal authority has
lowered the canal dues by 30%.
13
C11627change by limiting global warming to well below 2°C. World leaders acknowledged the
urgency for decarbonising our energy supplies and to undertake a radical
transformation of the global economy in order to reduce the emission of greenhouse
gases (GHG) - the main cause of global warming. The agreement is due to enter into
force in 2020.
Figure 1.1: EU28 greenhouse gas emissions by sector and mode of transport, 2012
EU GHG emissions by sector EU GHG emissions from transport by mode
Transport
Industry (17,7%) Railways (0,15%)
Energy Industries (29,2%) Road Transport (17,47%)
Residential and Commercial (12,5%) Total Civil Aviation (3,11%)
Agriculture (11,3%) Total Navigation (3,38%)
Other (5%) Other transport (0,19%)
Source: European Commission. Transport in figures. Statistical pocketbook 2014
Transportation is a major contributor to the Europe’s greenhouse gas emissions (see
Figure 1.1). More sustainable logistic transport chains could be a part of the solution.
However, although shipping and aviation were referred to in the world’s previous
climate change deal, the Kyoto Protocol, the Paris agreement does not include these
sectors. This means that the international bodies responsible for the sectors — the
International Maritime Organisation (IMO) and the International Civil Aviation
Organisation (ICAO) — are not obliged to develop emissions policies to meet the Paris
targets.
Initiatives of market parties in the logistic transport chain
However, there are many market parties in the logistic transport chain that actively
try to move to a higher level of sustainability. Within the context of this study,
interviews have been performed with cargo owners and transport operators that put a
high value on sustainability. This is also demonstrates by initiatives such as for
instance the Clean Cargo Working Group (CCWG) 6, Lean & Green 7 and BICEPS 8. The
Clean Cargo Working Group (CCWG) is a global, business -to-business initiative
dedicated to improving the environmental performance of marine container transport.
Lean and Green is a stimulation programme for every company or governmental body
6
See: http://www.bsr.org/en/collaboration/groups/clean-cargo-working-group
7
See: http://lean-green.nl/
8
BICEPS: Boosting Initiatives for Collaborative Emission-reduction with the Power of Shippers. See:
http://www.purebirds.nl/../biceps-network
14
C11627with the intention to move to a higher level of sustainability, by optimizing their
mobility processes. BICEPS is a network in which five major companies have joined
forces to develop a common and concurrent approach to sustainability in their
procurement of ocean freight and selection of carriers.
World Ports Climate Initiative
Due to their central role in the logistics chain, seaports are key to reducing the
environmental footprint of freight transport in the port itself, but are also important
on the maritime and hinterland leg of the logistics chain. The world’s key ports have
committed themselves to reducing greenhouse gas (GHG) emissions through the
World Ports Climate Initiative 9 (WPCI). They do this through influencing the
sustainability of supply chains, taking into account local circumstances and varying
port management structures.
1.2 Sustainability: current legal context
Achieving energy efficiency and controlling and minimising greenhouse gas emissions
are examples of IMO efforts to make international shipping sustainable. Another
example is the Sulphur Emission Control Areas (SECAs) or Emission Control Areas
(ECAs). These are sea areas in which stricter controls were established to minimi se
airborne emissions from ships that entered into effect in May 2005. It contains
provisions for two sets of emission and fuel quality requirements: a global
requirement and more stringent controls in special Emission Control Areas (ECA). By
2010 a revised stricter annex was enforced with significantly tightened emissions
limits. As of 2011 there are four existing ECAs: the Baltic Sea, the North Sea, the
North American ECA, including most of US and Canadian coast and the US Caribbean
ECA. The stricter standards have not only helped to bring down sulphur emissions at
sea but they also have sharply decreased in the port area of EU ports.
Further, IMO has introduced regulations on energy efficiency for ships to make the
Energy Efficiency Design Index (EEDI), for new ships, and the Ship Energy Efficiency
Management Plan (SEEMP) for all ships of 400 gross tonnage mandatory. The EEDI is
a non-prescriptive, performance-based mechanism that leaves the choice of
technologies to be used in a specific ship design to the industry, as long as the
required energy-efficiency level is attained. The SEEMP establishes a mechanism for
operators to improve the energy efficiency of ships.
The European Commission also aims to move transport further towards sustainability.
The 2011 White Paper on Transport takes on the challenge of seeking a deep
transformation of the transport system, promoting independence from oil, the creation
of modern infrastructure and multimodal mobility assisted by smart management and
information systems. It is put forward together with the provision of a roadmap
towards a low-carbon economy by 2050. Directives that are relevant in this context,
concern:
Promotion of the use of energy from renewable sources 10
Emissions from heavy duty vehicles 11
The Non-Road Mobile Machinery Directive12
Deployment of alternative fuels recharging and refuelling infrastructure 13
Port Reception Facilities 14
9
For the 55 members of the WPCI, see: http://wpci.iaphworldports.org/about-us/members.html
10
Directive 2009/28/EC
11
Regulation (EC) No 595/2009
12
Directive 97/68/EC
13
Directive 2014/94/EU
15
C11627Also relevant is the EC announcement in the Energy Union strategy to come up with a
revision of the Eurovignette directive on internalisation of external costs and with a
communication on decarbonisation of transport 15.
The Directive on the deployment of alternative fuels recharging and refuelling
infrastructure aims to facilitate the development of a single market for alternative
fuels for transport in Europe. It requires Member States to develop national policy
frameworks for the market development of alternative fuels such as Liquid Natural
Gas (LNG) and their infrastructure. Common technical specifications for recharging
and refuelling stations are foreseen. For developments that are relevant for the freight
transport chain, the required coverage and the timing by which this coverage must be
put in place is shown in Table 1.1:
Table 1.1: Coverage and the timing alternative fuels recharging and refuelling infrastructure
Measures regarding alternative fuels Coverage Timing
Electricity at shore-side Ports of the TEN-T core network and other ports 2025
LNG at maritime ports Ports of the TEN-T core network 2025
LNG at inland ports Ports of the TEN-T core network 2030
LNG for heavy-duty vehicles Appropriate number of points along the TEN-T 2025
core network
Source: Directive 2014/94/EU
Further, the Regulation for the Trans-European Network for Transport 16 (TEN-T) states
that all the Member States of the European Union must contribute to the development
of Trans-European Networks. The regulation divides the Trans-European network into
two ‘layers’, a comprehensive network and a core network. Maritime ports on the core
network must be connected with railways and roads and, where possible, the inland
waterway transport infrastructure of the Trans-European transport network. According
to the Regulation, this should be realised in 2030.
Last, the Regulation on the monitoring, reporting and verification of carbon dioxide
emissions from maritime transport 17 (MRV) creates a legal framework for the
monitoring, reporting and verification of CO₂ emissions from maritime transport. It
also helps the EU generate momentum for the best possible outcome in the
international discussions. The Regulation requires large ships (over 5 000 gross
tonnes) calling at EU ports starting from January 2018, to monitor and report CO₂
emitted on journeys to, from and between EU ports and also when in a EU port, as
well as parameters, such as distance, time at sea and cargo carried, to determine the
ships' average energy efficiency.
The MRV system is estimated to cut CO₂ emissions from the journeys covered by up to
2% compared with a 'business as usual' situation, according to the Commission's
impact assessment. In addition, the system would also reduce net costs to owners by
up to €1.2 billion per year by 2030 18.
14
Directive 2000/59/EC
15
See: http://eur-lex.europa.eu/../updated roadmap for the energy union
16
Regulation (EU) 1315/2013
17
Regulation (EU) 2015/757
18
Impact Assessment MRV Regulation: http://ec.europa.eu/../swd_2013_0237_en.pdf
16
C116271.3 Contents of this report
The contents of this report are as follows:
Chapter 2 describes the scope of this study.
Chapter 3 describes the macro-economic developments, as well as the global trade
relations. In addition, the prices of oil products will be highlighted, as they have a
strong influence on the transport market.
Chapter 4 describes the transport and logistic chain itself. For the purpose of the
analysis, we have split this chain into three parts: maritime transport, activities in
the ports and hinterland transport. For hinterland transport, the following
modalities have been taken into account: roads, rail, waterways and short sea
shipping/feeders.
Chapter 5 contains the results of an interview programme of cargo owners and
operators. Various important drivers to combat climate change and air pollution
have been identified, based on the opinion of the interviewees. Subsequently,
suggestions for the role of seaports are provided.
Chapter 6 presents a modelling exercise to determine the environmental effects
along the logistics supply chain for transport via various seaports in the European
hinterland.
Chapter 7 presents the conclusions and recommendations where the seaports’
efforts could best be focused.
17
C116272 Scope of this study
2.1 Geographical scope, cargo sector and time horizon
In this study we look at container transport and more particularly, at the Asian trade
lanes as these represent the EU’s dominant trade relation.
The analysis is focused on the medium-term; until 2025.
2.2 Focus on climate change and air pollution
In general, the concept of sustainability can be expressed in three aspects: people,
planet and profit:
‘People’ pertains to fair and beneficial business practices towards labour and the
community and region in which a corporation conducts its business;
‘Planet’ refers to sustainable environmental and climate related practices;
‘Profit’ is the economic value created by the organisation after deducting the cost
of all inputs, including the cost of the capital tied up.
In this report, we will concentrate on the environmental (including GHGs) aspect of
sustainability. In freight transport via seaports, there are many ways in which
environmental sustainability can be affected 19,20:
Climate change due to Greenhouse gases, such as carbon dioxide, help to trap heat
in the Earth's atmosphere as a part of the greenhouse effect. The main effect of
atmospheric greenhouse gas concentrations is global warming. In turn, this may
result in sea level rise and extreme weather.
Air pollution due to emission of pollutants, such as sulphur dioxide (SO₂), nitrogen
oxides (NOₓ) and particle matter (PM) makes asthma worse and exacerbates heart
disease and respiratory illness. Therefore, addressing the emission levels is aimed
at significantly reducing premature deaths caused by air pollution, whilst
simultaneously resolving environmental impacts, such as acidification and
associated losses in biodiversity.
Water pollution on the maritime part of the logistic chain, on the hinterla nd part —
when using inland waterways — and in the seaport itself. Water pollution may
consist of solid wastes, sewage, sludge and oil spills.
Species introduction by the discharge of ballast water that disrupt the marine
ecosystem.
Noise caused by ships at sea, activities in the ports and by hinterland transport .
This investigation focuses on greenhouse gases impacting climate change and air
pollution.
19
Environmental impacts of international shipping. OECD, 2011.
20
Greening of port operations. Swiftly Green, 2015.
19
C116273 External factors that influence the
transport market
This chapter examines external factors that determine market trends in the
international transport of containers between the Far East and Europe through
seaports. The macro-economic environment and global trade relations are discussed
first, followed by a concise analysis of fuel prices.
3.1 Macro-economic environment
Freight flows in the world depend strongly on international trade, which in turn
depends on global economic activity. In 2015, global economic activity remained
subdued. Growth in emerging markets and developing economies — while still
accounting for over 70 percent of global growth — declined for the fifth consecutive
year, while a modest recovery continued in advanced economies 21.
The volume of world merchandise trade has grown at a slow, steady pace in recent
years, but this consistency belies changes in the contributions of WTO geographic
regions to trade volume growth over time (see Figure 3.1).
Figure 3.1: Contribution to world trade volume growth by region, 2011-2015, annual % change
Source: WTO secretariat, 2016
Asia contributed more than any other region to the recovery of world trade after the
financial crisis of 2008-2009. However, the region's impact on world import volume
growth declined last year as the Chinese and other Asian economies cooled. Asia
contributed 1.6 percentage points to the 2.3% rise in the volume of world
merchandise imports in 2013, or 73% of world import growth, but in 2015 the region
contributed just 0.6 percentage points to the global increase of 2.6%, or 23% of world
import growth.
In contrast, Europe has mostly weighed down world trade since the financial crisis, by
actually reducing global import demand growth in 2012 (-0.7%) and 2013 (-0.1%).
However, in 2015 Europe once again was making a large positive contribution,
21
Trade statistics and outlook. WTO, 2016.
21
C11627accounting for 1.5 percentage points of the 2.6% increase in world import volume, or
59% of the global trade growth. The gradual recovery of intra-EU trade in 2014 and
2015 was responsible for much of the rebound in Europe, as the drag exerted by the
European sovereign debt crisis faded.
3.2 Global trade relations
Figure 3.2 shows the size of import and export flows of containers to and from Europe
in relation to other trade areas in the world. Generally, it can be noted that the flows
vary in size considerably. The following can be concluded that:
The most important European trade relations are with the Far East. Annually, more
than 15 million laden TEU are imported from the Far East (Japan, China, South
Korea and Singapore). With 7 million TEU on a yearly basis, the export flows have
a considerably smaller size.
Second to the Far East is the trade relation with North America (Transatlantic
market). The European export to North America is nearly 3 million TEU on a yearly
basis. The export is nearly 4 million TEU.
The trade relations with the Middle East are also considerable. The import flows are
somewhat greater than 2 million TEU, while the export is close to 3 million TEU.
The trade relations with Africa, Latin America and Australia (including New
Zealand) are relatively limited. The export to Africa and Australia are larger than
the imports. For Latin America the export and import are more in balance.
In summary, Europe imported 22.8 million TEU on a yearly basis, against an export
of 17.8 million TEU.
Figure 3.2: Size of import and export flows (laden TEU) between Europe and other parts of the world.
Latin America
Africa
Middle East
Australia
Trans Atlantic
Far East
0 2.000 4.000 6.000 8.000 10.000 12.000 14.000 16.000
(1000 laden TEU)
Export Import
Source: Dynaliners Weekly 46/2014.
22
C116273.3 Price of fuels
Oil prices have declined markedly since September 2015, reflecting expectations of
sustained increases in production by the Organisation of the Petroleum Exporting
Countries (OPEC) members, amidst continued global oil production in excess of oil
consumption. Future markets suggest only modest increases in prices in 2016 and
2017.
Marine gasoil/diesel and fuel oil
In the marine bunker fuel market there are two dominant fuels: marine gasoil/diesel
and fuel oil. Fuel oil is the cheapest and in most cases the preferred fuel for shipping
companies. As a result, fuel oil has a larger market share than gasoil/diesel. However,
in certain Emission Control Areas (ECA’s), in the North-Sea, Baltic Sea and the North-
American coastline legislation has been imposed that limits use of fuel oil. Gasoil is
less polluting than fuel oil and therefore these ECA shipping companies can switch
over to this cleaner fuel. Starting from January 2015, new ECA legislation has come
into effect which limits sulphur content in marine fuels to 0.1% in the ECA-zones.
Prior to this date, using LSHFO with a sulphur content less than 1.0% was sufficient.
This means that unless a vessel has a scrubber 22 it must switch to gasoil when passing
through the ECA zone. Because the North-Sea and Baltic Sea are ECAs, this new
legislation will influence consumption volumes of marine fuels.
Other than that, consumption volumes of marine fuels are related to interna tional
trade. Consumption volumes of marine fuels have been in a downward trend due to
advances in fuel efficiency and slow steaming policies. Slow steaming policies adopted
by shipping companies are practices to reduce cruise speed which reduces fuel
consumption per distance travelled. This however, is at the expense of the duration of
the voyage. In essence, this is a trade-off between reducing variable fuel costs at the
expense of fixed capital costs. After the collapse of the oil price fuel costs are le ss
significant in this trade-off and one might expect a recalibration of the slow steaming
policy. This would support consumption rates. How large this effect would be is hard
to determine, but the assumption of a stable outlook for consumption volumes
implicitly adopts the view that the downward trend caused by advances in fuel
efficiency is countered by the positive effect of recalibration of slow steaming policies.
Figure 3.3 shows the forecasted consumption volumes for marine gasoil/diesel (MGO),
for the marine fuel segment. The effect of the introduced ECA legislation is estimated
by looking at how consumption volumes have changed in 2015 compared to the same
periods in 2014. This difference is taken as the initial effect of the introduction of ECA
legislation. However, because gasoil is considerably more expensive than fuel, oil
shipping companies have an incentive to invest in scrubbers that enab le vessels to
clean exhaust fumes while burning fuel oil and at the same time adhering to ECA
legislation. So after some time it is likely that market share gains of gasoil will be
reduced and fuel oil market share losses will also be reduced.
22
A scrubber is a pollution control device that is used to remove unwanted pollutants, in this case SO 2 from an
exhaust gas stream.
23
C11627Figure 3.3: forecasted consumption volumes for marine gasoil/diesel (MGO), marine fuel segment
35.000
30.000
Volume (kton / year)
25.000
20.000
15.000
10.000
5.000
0
1994 1996 1998 2000 2002 2004 2006 2008 2010 2012 2014 2016 2018 2020
Heavy Fuel Oil Maritime Gas Oil
Source: Panteia and PJK, 2016
LNG
Alternatively, ships may also run on Liquefied Natural Gas (LNG), which is
environmentally friendly, safe, and widely available. The feasibility of an LNG
propelled vessel compared to traditional heavy oil fuels and marine fuel oil depends on
a business case where the price of MGO/HFO on the one hand, and the price of LNG on
the other, is a crucial input parameter for the financial assessment. Figure 5 shows
the LNG and ship fuel prices. It must be remarked, however, that many new vessels
are equipped with a dual fuel engine that may use natural gas and bunker fuel. Also,
in that case there is space reserved for an LNG tank.
Figure 3.4: Historical fuel prices on marine fuels and natural gas
Source: Clarkson, Worldbank
24
C11627Biofuel
Biofuel is a liquid or gaseous fuel used for transport and is produced from biomass.
The EU is strongly dependent on fossil fuels for its energy consumption. To reduce this
dependence, biofuels have become an important substitute for fossil fuels particularly
the road transport markets. In addition to this economical and geopolitical aspect,
biofuels have an environmental aspect and that is to reduce global greenhouse gas
emissions if the production of the refined biomass is subject to stringent sustainabil ity
criteria.
The biofuel industry has shown significant growth in production, consumption and
trade during the last decade. In a short period of time the industry turned global with
production and consumption markets all over the world. Ports are excellent locations
for biofuel refineries and as such spurring the transition toward a bio based economy.
Still, the application of biofuels is more expensive than fossil fuels. With current
prices, there is no incentive to apply biofuels. Legislation may help here. The
Renewable Energy Directive 23 requires that in all EU countries at least 10% of their
fuels for inland road, rail and waterway transport come from renewable sources by
2020.
23
Directive 2009/28/EC about the Promotion of the use of energy from renewable sources.
25
C116274 The logistics chain
This chapter describes the elements of the logistics chain between Asian seaports and
the European hinterland. The total chain is split into three parts:
the maritime leg,
the activities in the seaports and
the hinterland leg.
Figure 4.1 gives an impression of the importance of these three parts as far as their
share in the emissions of CO 2 is concerned.
figure 4.1: Indicative share of CO2 emissions in the transport chain from Asia to Central Europe.
30%
Maritime
Port
Hinterland
68%
2%
Source: Panteia (2016)
These will be discussed hereafter.
4.1 Maritime transport
Developments in the maritime part of the container transport chain can be
characterised by:
a gradual increase in the scale of the container ships, to a different extent in
different parts of the world and
a situation of overcapacity, with slow steaming as an initial answer to overcapacity
and technological developments that save fuel and costs.
These characteristics are further treated below. Port characteristics and ranking in the
rotation scheme of container liners need to be taken into account in order to
determine the environmental performance of a ship.
Scale increase
Figure 4.2 shows the composition of the newly built container vessels from 2016 to
2020 in terms of size. It can be seen that the largest growth occurs in the range
where the ships have the biggest size. In fact, this process will be ongoing for a
number of years, which will lead to an overall growth of the average vessel size.
27
C11627Figure 4.2: Overview of container vessel fleet from 2016 to 2020, newly built ships
25
Million TEU capacity
20
15
10
5
0
2016 2017 2018 2019 2020
100 - 499 TEU 500 - 999 TEU 1000 - 1499 TEU 1500 - 1999 TEU
2000 - 2099 TEU 3000 - 3999 TEU 4000 - 5099 TEU 5100 - 7499 TEU
7500 - 9999 TEU 10000 - 13299 TEU 13300 - 17999 TEU > 18000 TEU
Source: Alphaliner, fleet forecast as of 1 st of January 2016.
Figure 4.3 shows that on the most important trade routes from the Far East to the
rest of the world, the average size of ships has steadily increased. The slowest growth
can be seen on the route to the East Coast of the United Sates. This is caused by the
restrictions of the Panama canal. The fastest growth can be seen on the routes to the
Mediterranean and to Northern Europe, of which the route to Northern Europe
increased the fastest.
Figure 4.3: Average size of ships deployed on mail East-Wast routes: 2005-2015.
Average capacity as at August of each year (peak season deployment)
Source: Alphaliner
28
C11627Figure 4.4 shows the number of calls per vessel size class for Mediterranean ports and
Hamburg – Le Havre range ports in more detail. It can be seen that on average, the
call size is smaller for the Mediterranean ports and the distribution is less peaked.
Figure 4.4: Number of calls per vessel size class for Mediterranean ports and Hamburg – Le Havre range ports.
90
80
70
60
50
40
30
20
10
0
4,000 - 5,099 5,100 - 7,499 7,500 - 9,999 10,000 - 13,300 - > 18,000 TEU
TEU TEU TEU 13,299 TEU 17,999 TEU TEU
Asia - HLH Asia - Med
Source: Alphaliner service profiles, as of March 2016. Graph by Panteia (2016).
Overcapacity and slow steaming
However, despite the growth in size of the vessels, international trade is growing
slower than the deadweight tonnage capacity, in particular, since the pre-crisis year
2007. This resulted in oversupply of capacity and consequently, in lower utilisation of
individual ships on average.
Fuel consumption and, consequently, bunker costs depend mainly on a ship’s speed,
but, for instance, also on a ship’s design and hull condition, bunker fuel grade and
weather conditions. However, bunker costs significantly depend also on bunker prices,
which are an external factor and therefore out of the control of ship operators. Slow
steaming is mainly applied in container shipping and indicates a reduction of the
operating speed of long-distance liner ships. Slow steaming can help the economic
performance of shipping carriers in two ways: it can artificially decrease the supply in
maritime transportation, so shipping carriers can benefit from lower fuel consumption,
as well as from higher freight rates, due to a better relation between supply and
demand.
Fuel consumption is closely related to the emission of greenhouse gases and air
pollutants. Although maritime transportation is a relatively clean and energy-efficient
mode of transport, emissions from the growing maritime transport sector represent a
significant and increasing source of air pollution (see Figure 4.5).
29
C11627Figure 4.5: Range of typical CO₂ efficiencies for various cargo carriers
Source: IMO, 2009 (Prevention of air pollution from ships. Second GHG study)
From the economic point of view of a shipping carrier, it is therefore, necessary to find
an optimal speed in order to reduce costs. However, it may be that as the economy
and markets pick up and excess capacity is brought back into service, speeds will once
again increase to meet the growing demand.
There are other entities besides shipping carriers involved in the supply chain. For
example, longer transit times can actually increase shippers’ costs because they need
more inventory to feed this longer supply chain. Longer ocean transit times can also
impact shippers’ cash flow, as the time from production to sale is extended. However,
for many manufacturers, retailers, importers and exporters, sup ply chain reliability is
more important than transit time or rates, and slow steaming gives better time
flexibility than regular steaming, as there is still room for speed increase if the ship is
delayed. The use of new ICT-based and internet technologies can provide a higher
service level toward ship and cargo planning.
Figure 4.6 shows that over time, there is a decrease in CO₂ emissions per TEU per day
of transport time. The declining lines show the relation with ship size. The shift
between both lines indicates the effect of technological development and slow
steaming.
The use of larger vessels with more modern engines has decreased and will decrease
the CO 2 emissions emitted per container per day. For example, a 10 000 TEU vessel
built in 2015 still emits almost twice as much CO 2 per TEU per day as a 20 000 TEU
unit of the same building year. The difference in CO 2 emissions between bigger and
smaller vessels is, however, diminishing.
30
C11627Figure 4.6: Scatter plot of CO₂ emission per TEU per day for vessels according to size and year of built
140
120
CO2-emission in kg/TEU/day
100
80
60
40
20
0
5000 7500 10000 12500 15000 17500 20000
TEU
2015 2014 2013
2012 2011 2010
2005 - 2010 2000 - 2005 1995 - 2000
Linear (2015) Linear (2005 - 2010)
Source: Panteia, 2016. Based upon ALPHALINER data.
Figure 4.7 shows the relation between CO₂ emission per TEU per day and the vessel
size class for all vessels calling at the seaports of Rotterdam, Genova and Koper. It
can be seen that: for Rotterdam, the CO₂ emissions per TEU per day are lower
because of the larger size of the ships travelling to that region.
Figure 4.7: Scatter plot of CO₂ emission per TEU per day and the vessel size class, for all vessels calling at the
seaports of Rotterdam, Genova and Koper
120
CO₂-emmission per TEU per day
100
80
60 Rotterdam
Genova
40
Koper
20
0
5000 7500 10000 12500 15000 17500 20000
TEU-capacity ship
Source: Panteia, 2016. Based upon ALPHALINER data.
31
C11627Figure 4.8 shows a boxplot for all large seaports in Europa. Also indicated is the
number of weekly loops of the Far East – Europe services.
Figure 4.8: Boxplot of kg CO₂ per TEU per day for all large seaports in Europa
Venice (#1)
Trieste (#2)
Rijeka (#2)
Koper (#2)
Barcelona (#7)
Fos (#5)
Genoa (#7)
Valencia (#7)
Marsaxlokk (#7)
Piraeus (#8)
La Spezia (#5)
Gioia Tauro (#2)
Istanbul (#3)
Le Havre (#7)
Antwerpen (#8)
Constanta (#1)
Hamburg (#14)
Southampton (#6)
Rotterdam (#16)
Algeciras (#3)
Felixstowe (#10)
Goteborg (#2)
Aarhus (#1)
Gdansk (#2)
Bremerhaven (#4)
0 20 40 60 80 100 120 140 160
kg CO2 per TEU per day
Source: Panteia, 2016. Based upon ALPHALINER data.
Figure 4.8 indicates the range of CO 2 emissions per TEU per day for containers
brought by deep-sea vessel. The figure does not necessarily reflect the sustainability
of a port, but it provides an overview of the carbon-intensity of the vessels that call at
these ports.
The figure illustrates the fact that a port that is able to attract low carbon intense
vessels will decrease the CO 2 emission in the supply chain that is running through its
port. This indicates the importance of incentives or other measures that seaports can
offer to ship-owners, in order to decrease the carbon-intensity of vessels calling in
these ports.
4.2 Activities in the ports
Figure 4.9 shows the size of EU-based ports and their growth. The base ports form the
most important entrance and exit points to Europe from overseas.
32
C11627Figure 4.9: Size and growth of ports in the EU
Rotterdam 12,23 (-0,5%)
Antwerp 9,65 (+7,5%)
Hamburg 8,87 (-9,3%)
Bremerhaven 5,55 (-4,3%)
Valencia 4,62 (+3,9%)
Algeciras 4,51 (-1,2%)
Felixtowe 3,98 (-2,3%)
Piraeus 3,33 (-7,2%)
Marsaxlokk 3,1 (+8,0%)
Istanbul 3,08 (-10,6%)
Le Havre 2,56 (0,1%)
Gioia Tauro 2,55 (0,1%)
Genua 2,24 (+3,2%)
Southampton 2,02 (+6,6%)
Barcelona 1,97 (+3,8%)
Zeebrugge 1,56 (-23,8%)
La Spezia 1,39 (+6,7%)
Sines 1,33 (+8,5%)
Marseille Fos 1,22 (+3,5%)
Koper 0,79 (+17,3%)
Trieste 0,61 (-0,9%)
Willemshafen 0,61 (+566,7%)
Venice 0,49 (+21%)
0 2 4 6 8 10 12 14
(Size of port in million TEU)
Non-transhipment Transhipment
Source: Eurostat
In order to connect the maritime leg and the hinterland leg of the transport chain
adequately, the capacity of the seaports on the waterside has to match the capac ity
on the landside. This concerns the port entrance channel, berthing places and terminal
handling capacity on the waterside. On the landside, this also concerns terminal
capacity, as well as access infrastructure. Not all seaports feature all modalities for
hinterland transport. In fact, only a limited amount of seaports, possess a connection
to the hinterland via inland waterways. Investments in transport infrastructure, in
particular rail, create sustainable connections with the hinterland. In that respect, and
partly within the context of the TEN-T corridor development 24, many European ports
have benefited greatly from investmentments in their hinterland infrastructure or will
do so in the near future. Examples in this respect are the Port of Antwerp (railway line
between Brussels and Luxemburg), and Hamburg and Bremen (electrification of the
line Hof-Regensburg in order to relieve the main North-South rail axis). Connecting
rail infrastructure for ports in the Liguria and Adriatic part of the Mediterranean Sea
will also provide a better link to the hinterland 25.
24
Investeringen in TEN-T Corridors (Investments in TEN-T Corridors), Panteia 2015.
25
Part of the improved infrastructure are also the base tunnels under the Alps.
33
C11627The following transport related activities in the seaports cause air pollution and
release of GHGs :
Ships manoeuvring and at berth,
Unloading, loading and storage of containers at terminals,
Loading and unloading of containers on hinterland transport units and
Port related services other than loading and unloading.
Ships at berth
Although a ship at berth does not move, it uses energy to remain operational.
Electricity that is needed for this can be generated by the ship’s own aggregates that
are connected to the ship’s engines. The pollution that is caused by this, can be
avoided by making use of shore power, that connects the ship to the grid or a mobile
device. Local pollution can be avoided by this. Reefers consume additional energy
needed for cooling. Onshore power supply (OPS) provides sustainability benefits as
opposed to the use of on-board diesel aggregates. However, the operational costs may
be higher, especially in the case of ships that need additional investments in order to
be able to use shore-side electricity. See Figure 4.10 for a comparison based on a
calculation tool by CE Delft (2015) 26. It must be remarked that nowadays, for some
new ships the on-board equipment for OPS is already built-in, so that for new ships
this is not relevant anymore in comparison with on-board diesel aggregates 27.
Figure 4.10: Annual costs for a container ship (6 500 TEU, 500 reefers) of onshore power supply versus diesel
(including external costs)
€4.000.000
€3.000.000 Noise
Pollutants
€2.000.000
CO2
€1.000.000 Investment ships
Investment terminal
€0 Operational costs
OPS Diesel
OPS vs Diesel
Source: CE Delft, 2016
Unloading ships, loading ships and storage of containers at terminals
Port equipment that is needed for loading and unloading ships requires substantial
energy to lift containers. For electric equipment however, as soon as the hoisting is
slowed down or the container is lowered, the hoisting motor factually changes into a
generator which then produces energy. This can then be used for the other engines on
the crane or fed back into the electricity grid. This may decrease energy consumption
at the terminals by more than a factor of two. Alternatively, container handling
equipment may be sustainably powered by climate-neutral wind-generated electricity,
which also eliminates the noise and harmful emissions associated with conventional
diesel engine-powered operations. For horizontal transport over the terminal area,
yard trucks or AGV’s may be powered by a hybrid or a fully electric drive system.
26
Cost benefit calculation tool onshore power supply. Methodological note. CE Delft, 2016
27
According to the vessel register of Der Norse Veritas, it comprises the 13 latest new-built vessels from UASC.
This number may however be higher, as shipping lines are not obliged to register at DNV GL but can also use
other vessel registers.
34
C11627Loading and unloading of hinterland transport units
Efficient loading and unloading of hinterland transport units provide benefits in terms
of operations, but there are also environmental benefits, as it may incur energy
savings as well. Here, adequate information systems may help in minimising waiting
time and in particular, for rail transport and inland navigation, the number of stops in
the port.
Time and energy may also be saved by avoiding congestion at the terminals in the
seaports by moving containers out of the port as soon as possible when they are
unloaded from maritime vessels. They can be transported to an ‘extended terminal
gate’ in selected hinterland locations. This allows for the movement of containers into
those locations without prior involvement of the shipping company or the
shipper/receiver. Extended gates extend the delivery point from the perspective of the
shipper/receiver from seaport terminal along a corridor to an inland multimodal
terminal. Transportation to and from the extended gate can mostly be done by
intermodal transportation. Essentially, the gate of the sea terminal is now placed at
the inland terminal.
Port related services other than loading and unloading
Port authorities manage, operate, inspect, maintain and develop ports. They are
responsible for a safe and smooth handling of all shipping. Other services provided by
port authorities or private port operators may comprise waste management, pilotage,
towage and mooring services. In order to perform these tasks sustainable
procurement of equipment, vessels, (lease)cars, alternative fuels eand and energy
consumed can limit the producuction of greenhouse gases and air pollutants.
4.3 Hinterland transport
The assumed definition of a port’s ‘hinterland’ is the area inland from the port to
which imports are distributed and from which exports are collected. Hinterland
transport may take place via:
Short-sea shipping
Road transport
Rail transport
Inland waterways transport
Pipelines
Or a combination thereof.
As this study focuses on containers, we will leave out pipelines as a hinterland
transport modality. In the following sections, the other transport modes will be briefly
discussed.
4.3.1 S h or t -s ea sh ip p in g
Deep sea shipping (DSS) refers to the maritime transport of goods on intercontinental
routes, crossing oceans. By contrast, short-sea shipping (SSS) involves relatively
short distances, for instance, within the EU. Intercontinental sea trade of containers is
the most concentrated sector characterised by transhipment according to a hub and
spoke pattern. SSS can be seen as a way of transport to the hinterland for ports with
a hub function where cargo is allocated to other ports via feedering . In this case, ports
have an indirect connection with the European hinterland. Examples are Marsaxlokk,
Gioa Tauro, etc. Figure 15 presents the respective share of DSS and SSS for the most
important ports for containers.
35
C11627Figure 4.11: Short sea shipping share in ten main ports for containers (2012)
Rotterdam
Antwerp
Hamburg
Bremerhaven
Gioia Tauro
Algeciras
Ambarli
Valencia
Felixstowe
Piraeus
Genova
Le Havre
Mersin
Southampton
London
Las Palmas
Barcelona
Gdynia
Izmit
Sines
Cagliari
Liverpool
Göteborg
Gdansk
Koper
Marseille
Dublin
0 1 2 3 4
Incoming laden TEU in (in millions)
Shortsea Deepsea
Source: Eurostat
4 .3 .2 I n la n d t ra ns po rt
The inland connections of ports vary greatly, depending on the characteristics of the
port in question and in particular on the port activities (type and quantity of goods
handled).
Overall, roads are the most frequently used mode of transport for moving goods
from port to inland destinations. However, as better highlighted in the following
sections, other modes are also shown to frequently be used.
The extent to which different countries in the EU use rail to transport freight is
very mixed. The reasons for this are, amongst other things:
geographical: island countries generally use rail to a lesser extent; landlocked
countries in the centre of Europe, which are used as transit countries to the
major ports, use rail to a greater extent;
economical/political: countries whose development has included heavy
industries generally use rail to a greater extent;
environmental: countries with a long–term policy on the environment generally
use rail to a greater extent. For sustainability reasons, a modal switch to rail is
viewed as beneficial; in EU Member States, particularly in Austria and Belgium,
rail has increased its modal share thanks to stronger incentivising policies.
36
C11627You can also read