Waiheke Island Health Needs Assessment - Auckland District Health Board July 2009
←
→
Page content transcription
If your browser does not render page correctly, please read the page content below
Auckland District Health Board

Waiheke Island
Health Needs
Assessment

July 2009
Foreword

This report represents a milestone for Auckland District Health Board as it is the first time
a locality based HNA has been attempted, and completed, in partnership with the local
PHO.

DHBs have a legislated responsibility to protect and promote the health of their
populations and good relationships with care providers and the community are essential
to achieving this. One of the strengths of this HNA is the level of community participation
that went into it and it is great that so many members of the Waiheke community engaged
so willingly in the process.

The report acknowledges and highlights that, although we are all one DHB, there are
significant differences within our population that we need to understand if we are to
promote health and deliver appropriate health services for all. As we move to a more
neighbourhood based approach to healthcare delivery, the need to understand health need
at the local level becomes more important and this work paves the way for future locality
based assessments.

We’d like to thank all the local healthcare providers and members of the community who
gave their time and expertise to this work as it will provide a useful basis for the planning
of health services for Waiheke Island in the future.

Denis Jury                                      Barbara Stevens
Chief Planning & Funding Officer                Chief Executive Officer
Auckland District Health Board                  Auckland PHO

ii     Waiheke Island Health Needs Assessment

This document has been written primarily to inform the Auckland District Health Board
(ADHB) in the planning and funding of services for Waiheke Island. It will also be
available to other health providers, community groups and Government agencies as a
reference tool.

Waiheke is the third most populated island of New Zealand, after the North and South
Islands, and is the fifth largest in size. It is part of the Auckland District Health Board and
its two main health providers, (Piritahi Hau Ora Trust and Waiheke Health Trust), have
recently come under the umbrella of Auckland PHO following the demise of the island
based primary health organisation (PHO), Tikapa Moana. The geographic isolation of
Waiheke, coupled with a fluctuating population at weekends and over summer months,
poses some unique challenges in delivering care to both residents and visitors, and is part
of the impetus for this Health Needs Assessment (HNA).

If the reader is interested in further specific information about health on Waiheke, there
are two other projects currently underway. The first is a Youth Needs Assessment that is
being conducted by Youth Access to Alcohol (YATA) - Waiheke. The other is a research
project being conducted by the University of Auckland focused on the elderly around
"Ageing in Place". Contact details for these two projects can be obtained from the author
(details below).

For more information on health need in ADHB more generally, or for an electronic copy of
this report, the reader is referred to the electronic health needs assessment available on
the ADHB website: http://www.adhb.govt.nz/healthneeds/.

Any comments on this document can be sent to:

Dr Andrew Old
Public Health Physician
Planning & Funding
Auckland District Health Board
PO Box 92189
Auckland Mail Centre
Auckland 1142

aold@adhb.govt.nz.

                                                  Waiheke Island Health Needs Assessment          iii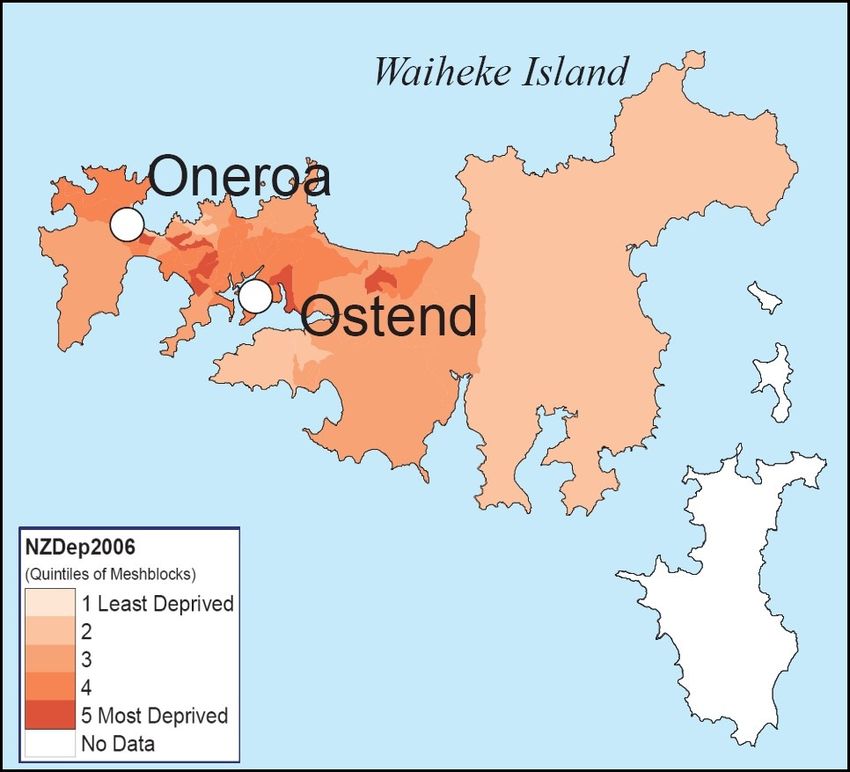
Acknowledgements

The author would like to acknowledge and thank all of the people who have contributed
their time and expertise to this work.

Special mention must be made of the willing contribution made by the major healthcare
providers on Waiheke Island, Piritahi Hau Ora Trust and Waiheke Health Trust, and to all
of the individuals who made time to be interviewed – often more than once. Without your
support and patience this work would not have been possible. A full list of interviewees
and contributors can be found in Appendix 3: Contributors List.

Thanks also to Dr Mazin Ghafel, Population Health Analyst at ADHB for extracting the
available health data and to Dr Celia Palmer for supervision and peer review. To Alex
Woodley (Point Research) for assistance with the community consultation and to Glenys
Stillwell, Robyn Wilson and Marg Scott for their repeated assistance.

Final thanks must go to Judy Davis of Piritahi Hau Ora who, in addition to making
significant time available for interviews, coordination and review, provided the following
whakatauki for the project:

Nau te rourou, naku te rourou ka ora ai te iwi
With your contribution and my contribution the people with thrive.

iv    Waiheke Island Health Needs Assessment
Health Needs Assessment (HNA)

Health needs assessment (HNA) is defined by the Ministry of Health as the “assessment of
the population’s capacity to benefit from health care services prioritised according to
effectiveness, including cost-effectiveness, and funded within available resources”. This
definition does not refer to individual health and disability care needs, but uses a
population-based approach.

Health needs assessment is mandated by the Health and Disability Services Act (2000)
Clause 18, Functions of DHBs (1f): “to regularly investigate, assess, and monitor the health
status, of its resident population”.

Health needs assessment is important for governments, health funders, health service
providers and the community, so that the need for health services can be identified, health
service provision prioritised according to the available resources, and services
implemented for the benefit of the community and the people within that community.

The various approaches to health needs assessment include global, community-based,
epidemiologically-based, comparative and corporate approaches.

The epidemiologically based approach to needs assessment is based on incidence and
prevalence of health conditions on the one hand, and the effectiveness of health care on
the other. The comparative approach contrasts the services received by one population
with those elsewhere while the corporate approach is based on the demands, wishes and
alternative perspectives of interested parties, including professional, political and public
views.

Methodology

This HNA takes a mixed approach, drawing on elements of epidemiological, comparative,
community-based and corporate approaches.

In planning for this HNA, three high level objectives were identified:
   1. Provide an information base for the DHB and their contracted health service
      providers;
   2. Make recommendations to the DHB about the accessibility of health services on
      the island and the interface with DHB services; and
   3. Provide recommendations around future development of health services.
To achieve these objectives, the HNA has been undertaken in two parts:
   1. Epidemiological analysis of demographic and health data; and
   2. Stakeholder and community input.
The epidemiological analysis was conducted using data from the 2006 Census, the
National Minimum Dataset (NMDS), laboratory and pharmaceutical datasets, and
practice registers.

Stakeholder and community input involved:
   •   Formation of a Project Reference Group involving representatives from the main
       health providers, the local PHO and the DHB;
   •   Interviews with 41 key stakeholders
           o 40 face to face and one telephone interview (see Appendix 3 for details)

                                                 Waiheke Island Health Needs Assessment        v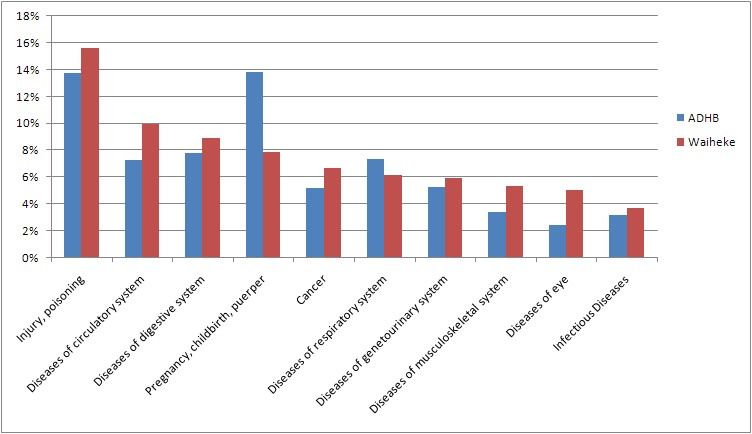
•   Two focus groups aimed at priority populations:
            o The elderly (22 participants) held at Waiheke Health Trust
            o Māori (17 participants) held at Piritahi marae
     •   An online community survey that received 142 responses
Further stakeholder consultation was undertaken on previous versions of this report.

vi       Waiheke Island Health Needs Assessment
Notes on Data in this Report

The latest data has been used, wherever possible.

Figures have been calculated for the usually resident population of Waiheke Island
presenting to services provided by Auckland DHB.

All rates are per 1,000 population and are age standardised using the 2001 New Zealand
population, unless otherwise stated. Standardised rates allow comparisons across DHBs.

Hospital admission rates are based on public hospital data only, no private hospital data
has been used in this report. Overseas residents are excluded.

Rates for procedures and conditions within hospitals, unless otherwise indicated, are for
discharges rather than individuals.

While it would have been preferable to use prioritised ethnicity, this was not available for
Waiheke Island and so grouped total response ethnicity has been substituted.

Much of the data that is available at a district level is not available at island level meaning
some comparisons and analyses were unable to be conducted.

It is important to note that mortality and hospitalisation data may be under-representing
the situation due to an “unhealthy emigration” effect. That is, that anecdotally more
unwell people, and people nearing the end of their lives, are forced to move off the island
for care leaving a relatively healthier population behind.

Finally, the small number of events on Waiheke means that some rates are unstable and
therefore any trends or differences should be viewed with caution.

                                                  Waiheke Island Health Needs Assessment      vii
Table of Contents
Foreword ............................................................................................................................... ii
Acknowledgements ............................................................................................................. iii
Health Needs Assessment (HNA) ........................................................................................ v
Methodology.................................................................................................................. v
Notes on Data in this Report ............................................................................................. vii
Executive Summary .......................................................................................................... xiv
Introduction ................................................................................................................ xiv
Community Demographic Profile ................................................................................ xiv
Health Services .......................................................................................................... xiv
Health Risk Factors.......................................................................................... xv
Mortality ........................................................................................................... xv
Utilisation of Health Services ....................................................................................... xv
Primary Care.................................................................................................... xv
Hospital Services ............................................................................................. xv
Emergency Transport ..................................................................................... xvi
Community Consultation ............................................................................................ xvi
Recommendations ........................................................................................................... xvii
1 ADHB Planning and Funding Team ........................................................................... 1
1.1 Who we are and what we do .............................................................................. 1
2 Our Vision, Outcomes and Current Priorities ........................................................... 2
2.1 Outcomes we are seeking for our population ..................................................... 2
2.2 Our vision .......................................................................................................... 2
2.3 Our three goals .................................................................................................. 2
2.4 Organisational values ........................................................................................ 3
2.5 Our current priorities .......................................................................................... 3
PART I ................................................................................................................................... 4
3 Waiheke Island – the People and the Place ............................................................... 5
3.1 Community Demographic Profile........................................................................ 5
3.1.1 Number of people ................................................................................... 5
3.1.2 Population by gender .............................................................................. 5
3.1.3 Population by ethnicity* .......................................................................... 5
3.1.4 Age structure .......................................................................................... 6
3.1.5 Life Expectancy ...................................................................................... 7
3.1.6 Households & Families ........................................................................... 8
3.1.7 Seasonal Variation ............................................................................... 10
3.1.8 Other interesting facts .......................................................................... 10
viii Waiheke Island Health Needs Assessment3.2 Health Services ............................................................................................... 11
3.2.1 Oneroa Accident & Medical Centre (OAMC) ........................................ 11
3.2.2 Piritahi Hau Ora Health Services .......................................................... 12
3.2.3 Waiheke Health Trust Services ............................................................ 14
3.2.4 Ostend Medical Centre (OMC) ............................................................. 16
3.2.5 Maternity Services ............................................................................... 16
3.3 Health Workforce............................................................................................. 17
3.3.1 Medical Workforce ............................................................................... 17
3.3.2 Nursing Workforce ............................................................................... 17
3.3.3 Midwifery Workforce............................................................................. 18
4 Social Determinants of Health ................................................................................. 19
4.1 Income & Poverty ............................................................................................ 19
4.2 Employment & Occupation .............................................................................. 21
4.3 Education ........................................................................................................ 21
4.4 Social Cohesion and Social Support................................................................ 22
5 Environmental Risks to Health ................................................................................ 23
5.1 Rapid urban growth and poor urban design ..................................................... 23
5.2 Exposure to poor air quality ............................................................................. 23
5.3 Access to safe drinking water .......................................................................... 24
5.4 Inadequate wastewater disposal in rural areas ................................................ 24
5.5 Clandestine drug labs ...................................................................................... 25
5.6 Biosecurity and quarantine .............................................................................. 25
6 Health Risk Factors .................................................................................................. 26
6.1 Smoking .......................................................................................................... 26
6.1.1 Smoking prevalence ............................................................................ 26
6.2 Drugs & Alcohol............................................................................................... 27
7 Mortality .................................................................................................................... 28
7.1 Population Mortality Profile .............................................................................. 28
7.2 Inequalities in mortality .................................................................................... 29
7.2.1 Age and gender ................................................................................... 29
7.2.2 Ethnicity ............................................................................................... 30
7.3 Main Causes of Death ..................................................................................... 30
7.4 Infant Mortality ................................................................................................. 32
8 Utilisation of Health Services................................................................................... 33
8.1 General Practitioners ....................................................................................... 33
8.1.1 Practice Profiles ................................................................................... 33
8.1.2 Utilisation of Primary Care ................................................................... 35
8.2 Hospital Services & Morbidity .......................................................................... 36
8.2.1 Hospital Use ........................................................................................ 36
8.2.2 Type of hospitalisation ......................................................................... 37
8.2.3 Avoidable Hospitalisations ................................................................... 38
8.2.4 Variation by Age................................................................................... 40
Waiheke Island Health Needs Assessment ix8.2.5 Hospitalisations by Cause .................................................................... 42
8.3 Laboratory Usage ............................................................................................ 45
8.4 Pharmaceutical Usage ..................................................................................... 47
8.5 Emergency Transport ...................................................................................... 48
8.5.1 St John Ambulance .............................................................................. 48
8.5.2 Auckland Rescue Helicopter ................................................................. 50
8.5.3 Police & Coastguard ............................................................................. 50
8.5.4 Fullers Passenger Ferries..................................................................... 51
9 Land Transport Crashes ........................................................................................... 52
9.1 The Social Costs of Road Crashes .................................................................. 55
PART II ................................................................................................................................ 56
10 Results of Stakeholder Interviews ........................................................................... 57
10.1 Key Issues, Gaps & Opportunities ................................................................... 57
10.2 Services ........................................................................................................... 58
10.2.1 Those working well ............................................................................... 58
10.2.2 Those not working so well .................................................................... 58
10.3 Vulnerable Groups ........................................................................................... 59
11 Community Survey Results ...................................................................................... 60
11.1 Demography of respondents ............................................................................ 60
11.1.1 Note on representativeness .................................................................. 61
11.2 Results............................................................................................................. 61
11.2.1 Health on Waiheke ............................................................................... 62
11.2.3 Health services on Waiheke ................................................................. 62
11.2.4 Perceived gaps in health services ........................................................ 63
11.2.5 Vulnerable groups ................................................................................ 63
11.2.6 Priorities for increased support ............................................................. 63
11.2.7 A selection of general comments .......................................................... 64
11.2.8 A final call to action............................................................................... 64
12 Focus Group Results – Piritahi Marae ..................................................................... 65
12.1 Key Priorities.................................................................................................... 65
12.1.1 Framing of the health needs assessment ............................................. 65
12.2 Determinants of Health .................................................................................... 65
12.3 Specific Health Issues...................................................................................... 67
12.4 Services ........................................................................................................... 69
13 Focus Group Results - Elderly (‘Older & Bolder’) ................................................... 70
13.1 Advantages of living on Waiheke ..................................................................... 70
13.2 Disadvantages of living on Waiheke ................................................................ 70
13.3 Key priorities for improvement ......................................................................... 70
14 Summary .................................................................................................................... 71
x Waiheke Island Health Needs AssessmentAppendix 1: Missions flown by the Auckland Rescue Helicopter to
Waiheke Island in the six months to 31 August 2008............................................. 73
Appendix 2: Waiheke HNA Semi-structured interview prompts ........................ 78
Appendix 3: Contributors List.............................................................................. 79
Formally Interviewed Stakeholders ............................................................................. 79
Other people who have provided information and support to the process ................... 80
Auckland District Health Board Staff who have provided assistance ........................... 80
Appendix 4: A local GP’s “wish-list” ................................................................... 81
References ......................................................................................................................... 82
Waiheke Island Health Needs Assessment xiList of Tables Table 1: Census Ethnicity Data – Numbers of people ........................................................ 6 Table 2: Census Age Structure 1996 - 2006 ...................................................................... 7 Table 3: Auckland DHB, Life Expectancy at Birth .............................................................. 8 Table 4: Workforce by locality (main work site) 2007 [7] .................................................. 17 Table 5: Midwifery workforce by locality (2007) [8] .......................................................... 18 Table 6: Waiheke Island Adult (15 years+) percent of population 'regular smokers' versus ADHB and New Zealand ................................................................................................. 26 Table 7: Numbers of deaths and rates, 1996 - 2006 (Waiheke, ADHB and NZ) .............. 28 Table 8: Number of Waiheke Island residents attending National Women’s Hospital for delivery............................................................................................................................ 32 Table 9: Enrolled vs Casual Consultations (12 months to 30 June 2008) ........................ 35 Table 10: Proportion of hospital discharges and case-weights, ADHB v Waiheke (2007) 42 Table 11: Average social cost per crash and per injury, by cost component [24] ............. 55 xii Waiheke Island Health Needs Assessment
List of Figures
Figure 1: Population by ethnicity (grouped total responses) .............................................. 6
Figure 2: Population 1996 - 2011 by age group ................................................................ 7
Figure 3: Family Types (Census 2006) ............................................................................. 8
Figure 4: Tenure of Households ........................................................................................ 9
Figure 5: Usual Residence in 2001 compared with 2006 .................................................. 9
Figure 6: Waiheke estimated summer population based on daily net passenger
movements (07/08) ..........................................................................................................10
Figure 7: Public Healthcare Providers on Waiheke Island ................................................11
Figure 8: The Major Determinants of Health [10]..............................................................19
Figure 9: Population income distribution (Waiheke) .........................................................20
Figure 10: Waiheke Island Deprivation Map (NZDep2006) ..............................................20
Figure 11: Labour Force Status .......................................................................................21
Figure 12: Highest Education Achievement (Waiheke Usual Residents aged over 15) ....22
Figure 13: Census, Cigarette Smoking Behaviour, for the Census Usually Resident
Population Count Aged 15 Years and Over - Waiheke Island ..........................................27
Figure 14: Age-standardised mortality rates (1996 - 2005) ..............................................29
Figure 15: Deaths by age-group 1996-2006 (Waiheke)....................................................30
Figure 16: Top 15 causes of death on Waiheke Island (1996-2004) ................................31
Figure 17: Top causes of death - Waiheke v ADHB (1996-2004) ....................................31
Figure 18: Top causes of death on Waiheke by ethnicity (1996-2004) .............................32
Figure 19: Proportion of enrolees by age-group and practice (July 2008) ........................33
Figure 20: Proportion of practice enrolled population by ethnicity (July 2008) ..................34
Figure 21: Proportion of enrolees by NZDep01 quintile and practice (July 2008) .............34
Figure 22: Proportion of island enrolled population by ethnicity and practice (July 2008) .35
Figure 23: Hospital Discharges (Age standardised) .........................................................36
Figure 24: Case-weighted discharges (Age standardised) ...............................................37
Figure 25: Acute versus Elective Admissions (Age standardised) ....................................37
Figure 26: Age-standardised Avoidable Hospitalisation Rates .........................................38
Figure 27: Age-standardised Avoidable Hospitalisation Rates - Waiheke ........................39
Figure 28: Avoidable Hospitalisations by Age & Ethnicity (Waiheke, 2007) ......................39
Figure 29: Avoidable Hospitalisations by cause and ethnicity (2001 - 2007) ....................40
Figure 30: Age distribution of hospitalisations (Waiheke) .................................................41
Figure 31: Age distribution of hospitalisations (ADHB) .....................................................41
Figure 32: Hospital Discharges by Age-group and Ethnicity – Waiheke (2007) ................42
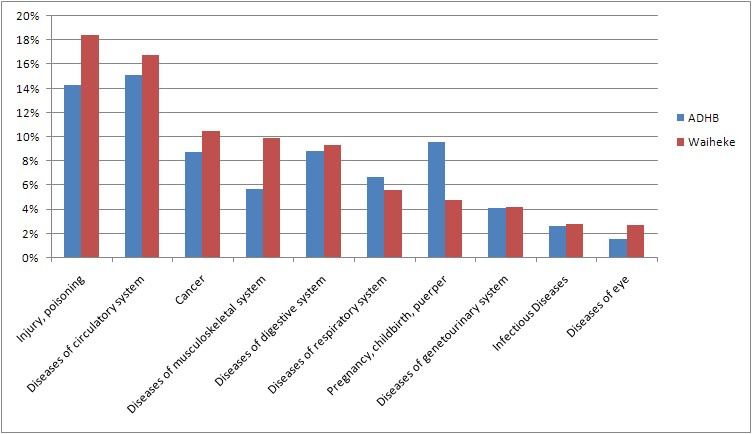
Figure 33: Hospitalisations by cause (discharges, 2007) .................................................43
Figure 34: Hospitalisations by cause (case-weights, 2007) ..............................................44
Figure 35: Hospital discharges by ethnicity – Waiheke (2007) .........................................44
Figure 36: Waiheke Laboratory Spending by Age & Gender (2007) .................................45
Figure 37: Waiheke versus ADHB Laboratory Spending per Person by Age (2007) ........45
Figure 38: Proportion of Laboratory Costs Claimed by Age & Ethnicity (2007) .................46
Figure 39: Waiheke Pharmaceutical Spending by Age and Gender (2007) ......................47
Figure 40: Waiheke versus ADHB Pharmaceutical Spending per Person by Age (2007) .47
Figure 41: Proportion of Pharmaceutical Costs Claimed by Age & Ethnicity (2007) .........48
Figure 42: Medical versus Accident Callouts, St Johns Waiheke .....................................49
Figure 43: Auckland Rescue Helicopter Missions by destination......................................50
Figure 44: Number of crashes per month, 2003-2007 .....................................................52
Figure 45: Crash Data for Waiheke Island, 2003-2007.....................................................53
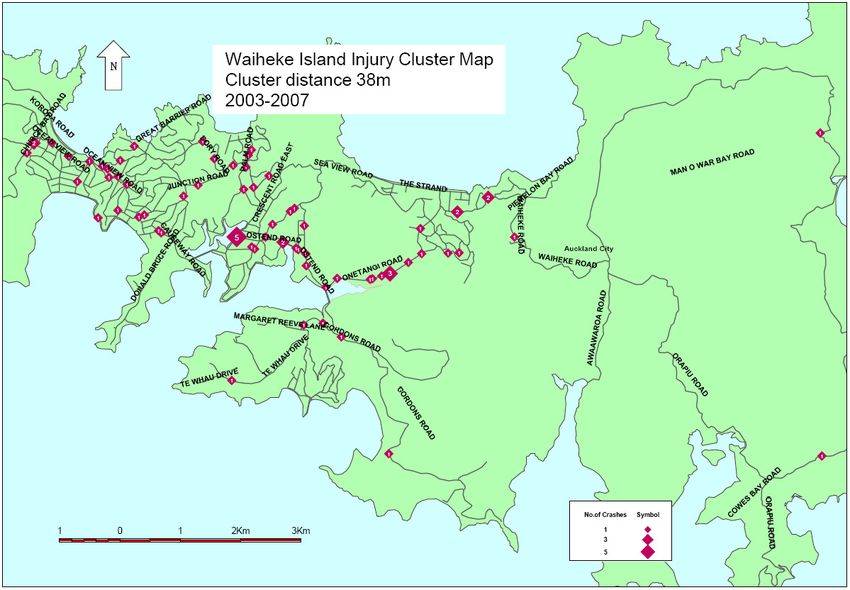
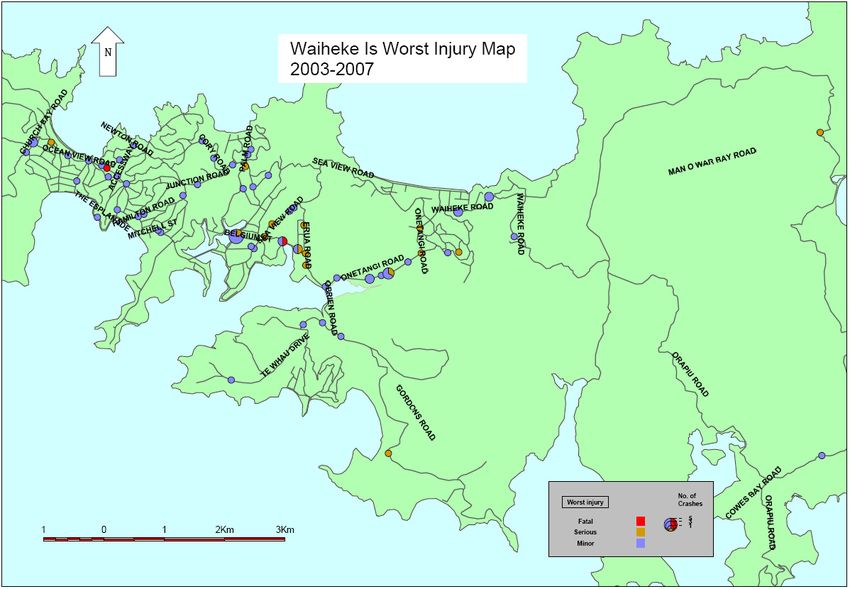
Figure 46: Geomap of crash severity, 2003-2007 ............................................................53
Figure 47: Geomap of injury crashes, 2003-2007 ............................................................54
Figure 48: Geomap of non-injury crashes, 2003-2007 .....................................................54
Figure 49: Age Distribution of Respondents .....................................................................60
Waiheke Island Health Needs Assessment xiiiExecutive Summary
Introduction
Waiheke Island is located approximately 17.7km (35min by ferry) from downtown
Auckland. It is the third most populated island in New Zealand and is the fifth largest in
size.
At the 2006 census, 7,689 people were usually resident on Waiheke Island representing
about 2% of the Auckland District Health Board (ADHB) population.
Significant and/or interesting findings from the needs assessment are presented below.
Community Demographic Profile
• There are proportionately more Māori living on Waiheke than in ADHB at 12.3
percent compared with 7.8 percent of the population
• The population is older than ADHB with 13 percent of the population aged over 65
years, compared with 9.4 percent for ADHB overall
• Single person households are more of a feature on Waiheke than the mainland
with 33 percent of residents living in them (24 percent in ADHB)
• There are relatively more couples without children and less couples with children
when compared to ADHB
• Almost two thirds of Waiheke residents own their homes, compared with 42
percent in ADHB
• Seasonal variation is a significant challenge with population levels peaking over
summer and year round weekend spikes
• Overall, the population is becoming wealthier, experiencing an 82 percent rise in
the median personal income in the ten years to 2006, compared with a 53 percent
rise for ADHB in the same time period. The median income remains below ADHB
however and NZDep2006 level for Waiheke is 7 with pockets of more significant
deprivation
Health Services
There are no hospitals on the island and publically funded primary and community health
services are predominantly provided by two organisations: Waiheke Health Trust and
Piritahi Hau Ora Trust. Between them, the two health trusts operate three general
practice clinics and a wide range of other primary and community health services.
Compared with ADHB, and nationally, the numbers of GPs, primary care nurses and
midwives compares favourably, but population fluctuations and geographic isolation make
the comparison simplistic.
xiv Waiheke Island Health Needs AssessmentHealth Risk Factors
Apart from smoking, information on specific health risk factors is not available for
Waiheke. Further, the only smoking data available is from the census making
comparisons difficult.
At the 2006 census, Waiheke residents reported higher rates of smoking than ADHB
overall (21.6 percent compared with 16.5 percent).
Although no data are available, drug and alcohol use was cited by 77 percent of
respondents to the community survey as being of key concern – the highest of any health
issue.
Mortality
Within the limitations of the data, there are no discernible differences in overall mortality
rates between Waiheke and ADHB.
Ischaemic heart disease was the biggest killer of Waiheke residents between 1996 and
2004, followed by ‘other heart diseases’ and cerebrovascular diseases (including stroke).
Waiheke appears to have lower rates of death from strokes and from ‘mental disorder’
than ADHB, but higher rates of death from leukaemia and lymphoma, head & neck
cancers, and oral & oesophageal cancers. The higher rates of head & neck and oral &
oesophageal cancers may be related to the higher rate of smoking.
Utilisation of Health Services
Primary Care
A significant issue for primary care services on Waiheke Island is the high number of
casual attendances, particularly for the two practices at the western end of the island.
Nineteen percent of all attendances at Oneroa Accident & Medical Centre, and 25 percent
of attendances at Piritahi Hau Ora were recorded as casual in the 12 months to 30 June
2008. This is particularly an issue for Piritahi who, with their kaupapa of providing a free
service, therefore receive no funding for one quarter of their general practice work.
Hospital Services
Given Waiheke’s relative isolation, access to services on the mainland is a constant
concern. Pleasingly, analysis of admissions data showed that Waiheke residents are
admitted for elective procedures at the same rate as their mainland counterparts, while
acute/unplanned admissions and ‘avoidable hospitalisations’ are at a significantly lower
rate.
While the causes of the lower acute admission and avoidable hospitalisation rates are
likely to be multi-factorial, the isolation of Waiheke anecdotally leads to greater
management in primary care as the geographic barriers for transfer to hospital are that
much higher than on the mainland. Within these data it is interesting to note that the rate
of avoidable hospitalisation in the over 65 age group is actually higher on Waiheke, but
this is compensated for by lower rates in other age groups. This may reflect a trend to
admit more elderly residents earlier due to time delays and difficulties involved in
transferring to hospital if their conditions progress.
Waiheke Island Health Needs Assessment xvEmergency Transport
Emergency transportation is more varied for Waiheke residents due to the stretch of sea
between them and hospital services. While St Johns provides an ambulance service on the
island, off-island transport can be via one of four methods: the Auckland Rescue
Helicopter; the police launch (Deodar III), the coastguard and scheduled ferries.
The Auckland Rescue Helicopter provides a vital emergency service and about one-third of
their missions are to Waiheke. The vast majority of those (93%) are for medical reasons as
opposed to accidents. For less urgent transfers the police launch or coastguard can be
used, although both options require the provision of an Auckland based paramedic crew
which introduces delays. More stable patients are transported via scheduled ferry sailings,
however, as with the police launch or coastguard, if the patient requires an escort then
they have to come across from Auckland as there is only one crew on Waiheke at any given
time.
Local St Johns Ambulance data estimates that approximately one quarter of all hospital
transfers could have been avoided if they had access to a short-stay facility on the island.
Community Consultation
Community input was sought via 41 direct interviews, two focus groups (39 participants)
and an online survey that garnered 142 responses. There was a large degree of
concordance between the different groups in terms of the key themes to emerge.
Common themes were identified under the headings: Key Issues, Gaps & Opportunities;
Services; and Vulnerable Groups with some of the key themes being around:
• Issues
o Access to services
o Specific health issues including drug & alcohol use, mental health and
sexual health, with a particular focus on child & youth health
o Communication
• Gaps
o Respite and residential care
o Emergency housing
o Health infrastructure (to support extended services)
o Under-resourced and fragmented social services
• Opportunities
o Development of a ‘super-clinic’ on the island
o Improved scheduling of hospital appointments
o Increased numbers of visiting specialists
o Improve communication between local services and between hospital and
island-based services
xvi Waiheke Island Health Needs AssessmentRecommendations
1. The DHB undertake a review of booking & scheduling practices to ensure that,
where possible, Waiheke residents are not given early morning or late evening
appointments at Greenlane Clinical Centre
2. The DHB works with local providers and Auckland PHO on data sharing
arrangements to enhance communication and facilitate safer after hours care
3. The DHB gives specific consideration, including cost-effectiveness analysis, to the
expansion of healthcare (including maternity), services and facilities on the island
including:
a. Investigation of models of acute care from similar communities both in
New Zealand and internationally (e.g. Golden Bay, Opotiki, and Kangaroo
Island, Australia)
b. Consideration of the number and type of specialist outpatient clinics and
services that could be provided locally
4. The DHB enters dialogue with St Johns Ambulance to clarify their patient charging
practices and negotiate ways for transport from Waiheke to Auckland City Hospital
to be consistently treated as a single trip
5. The DHB gives specific consideration to the range and funding of drug and alcohol
services available on the island, including preventative strategies, to ensure
appropriate coverage for the whole population
6. The DHB gives specific consideration to the range and availability of mental health
services, including primary mental health services on the island
7. The DHB works with Piritahi Hau Ora and Auckland PHO to ensure safe and
appropriate access to General Practice services for the Piritahi Hau Ora enrolled
population
8. The DHB works with local providers and Auckland PHO on a local tobacco control
strategy
9. The DHB engages with its own secondary care providers to:
a. encourage improved discharge planning for Waiheke residents; and
b. explore opportunities for increased telephone/telemedicine support
10. The DHB gives support to the local campaign to lower the speed limit on the
Onetangi straight
11. The DHB enters dialogue with the Auckland Regional Transport Authority (in the
first instance) around the issue of ferry to bus connections and timetables
12. The DHB considers Waiheke Island as a ‘locality’ for trialling a ‘neighbourhood
approach’ to delivery of healthcare (as outlined in the ADHB Primary Care Plan)
Waiheke Island Health Needs Assessment xvii1 ADHB Planning and Funding Team
1.1 Who we are and what we do
The ADHB planning and funding (P&F) team works with providers to achieve the best
possible health and independence for the people of Auckland. The team’s role is:
Planning for health services for the Auckland district: Includes co-ordination of
accountability documents including the Strategic Plan, Statement of Intent and Annual
Plan as well as key areas of service planning and development, for example our health
improvement areas. This includes the development of health needs assessments.
Funding of health services for the Auckland district: The team funds a wide range
of health service providers for services provided to the population of Auckland. The
services range from service agreements (contracts) for services provided by small
community-based NGOs (non-government organisations) to multi-million dollar
agreements for secondary and tertiary services provided by our own hospital and specialist
services. Contract managers maintain an ongoing relationship with these providers, and
ensure the efficient management of these service agreements.
Monitoring of health service contracts: The monitoring of service contracts occurs
through a number of mechanisms including relationship development, reporting
mechanisms, and audit. The P&F team works closely with the Northern DHB Support
Agency (NDSA) on each of these areas.
Community engagement: Community engagement processes ensure that there is an
ongoing linkage to existing networks in the community, that appropriate consultation
occurs where required, and that the community and key stakeholders are updated and
kept aware of issues and plans.
Māori and Pacific health: We work with our Māori and Pacific colleagues in the DHB
to help achieve the DHB’s Māori and Pacific health objectives. This includes advice on
Māori engagement and participation; service, provider and workforce capacity and
capability development within the provider arm and community providers; as well as the
Māori responsiveness of mainstream providers and culturally appropriate service delivery.
Waiheke Island Health Needs Assessment 12 Our Vision, Outcomes and Current Priorities
2.1 Outcomes we are seeking for our population
Though the combined efforts of our ADHB system, we are striving to attain the following
long term outcomes or results for our population:
• Healthier communities and environments
• Equality in health status between population groups
• High quality health services
• Best and most sustainable use of resources
To achieve the outcomes we seek, we have a vision, goals and values that will support the
achievement of the outcomes over the longer term, together with a focus on the priority
areas for our work as identified from the health needs assessments.
2.2 Our vision
We have a vision, goals and values that will help us to achieve these outcomes. Our vision
is: Healthy Communities, Quality Healthcare / Hei Oranga Tika Mo Te Iti Me Te Rahi.
2.3 Our three goals
Our goals support the vision and all the objectives in our District Annual Plan (DAP) and
are aligned to the three goals:
• Lift the health of people living in Auckland city
• Performance improvement
• Live within our means
2 Waiheke Island Health Needs Assessment2.4 Organisational values
Underpinning all our work are the organisation values of:
Integrity, Respect, Innovation, Effectiveness
Kia u ki te tika me te pono
2.5 Our current priorities
As a DHB we focus on the people who live in Auckland City and on their health needs. We
want to achieve health gain in areas of highest need and problems responsible for the
greatest burden of disease. These priority areas are taken from earlier analysis of the local
population, particularly areas of high need and inequality.
The health problems responsible for the greatest burden of disease in our area, as
determined by our needs assessment, are:
• Cancer
• Cardiovascular disease (including congestive heart failure)
• Diabetes
• Respiratory tract diseases
• Stroke
• Injuries (intentional and unintentional)
• Nervous system disease
• Mental health
• Cellulitis
Our priority areas for local health gain therefore reflect these needs and are:
• Cardiovascular disease/diabetes
• Cancer control
• Child health
• Reducing inequalities
• Mental health
• The health of older people
Waiheke Island Health Needs Assessment 3PART I 4 Waiheke Island Health Needs Assessment
3             Waiheke Island – the People and the Place

Waiheke Island is in the Hauraki Gulf (Tikapa Moana-o-Hauraki) and is located about 17.7
km (approximately 35 minutes by ferry) from downtown Auckland. Due to its proximity
to Auckland, Waiheke has become the third most populated island in New Zealand, after
the North and South Islands, and is the fifth largest in size (approximately 92 km²).

The island is 19.3 km long from west to east and varies in width from 0.64 km to 9.65 km.
The coastline is 133.5 km and includes 40 km of beaches. The port of Matiatia at the
western end of the island is 17.7 km from Auckland and the eastern end is 21.4 km from
Coromandel. It is very hilly with few flat areas, the highest point being Maunganui at 231
metres [1-3].

Waiheke means ‘cascading or descending waters’, which is conventionally thought to refer
to the waterfalls now within the Whakanewha Regional Park, although there are other
interpretations. Tangata whenua for the island is Ngati Paoa, one of the tribes in the
Hauraki Confederation. The island’s marae however, Piritahi, is a pan-cultural centre
established on a city council reserve at the western end of Blackpool in the late 1970s.

3.1           Community Demographic Profile

3.1.1         Number of people
       •    At the 2006 Census, 7,689 people were usually resident on Waiheke Island
       •    This was an increase of 552 people, or 7.7 percent, since the 2001 Census
       •    Waiheke Island represents approximately 2% of the Auckland District Health
            Board (ADHB) population [4]

3.1.2         Population by gender
       •    The male to female ratio mirrors that of ADHB (and New Zealand) as a whole with
            approximately 49% of the population being male and 51% female. This ratio
            remained unchanged between 1996 and 2006

3.1.3         Population by ethnicity*
       •    In 2006, the largest ethnic group was the European/Other group with 93% of the
            total population (see Figure 1 below)
       •    903 people identified as Māori (12.3%) followed by Pacific, 282 people (3.8%) and
            Asian 183 (2.5%)
       •    At 12.3%, the Māori proportion is greater than for ADHB as a whole (7.8%) but less
            than for New Zealand overall (14.6%)

*
    Please note, these data are grouped total responses so individuals who identified with more than one ethnic group have
      been counted more than once. This is why, in some cases, the totals may add to more than 100%.

                                                                 Waiheke Island Health Needs Assessment                      5
Figure 1: Population by ethnicity (grouped total responses)
9000
8000
7000
6000
5000 Asian
Pacific
Maori
4000 European/Other
3000
2000
1000
0
1991 1996 2001 2006
Census Year
Table 1: Census Ethnicity Data – Numbers of people
Census European/Other Māori Pacific Asian
1991 4986 474 84 57
1996 5577 729 183 87
2001 6183 789 219 147
2006 6843 903 282 183
3.1.4 Age structure
• In 2006, there were 489 children under the age of 5 years living on Waiheke (6.4%
of the population) and 981 children aged 5 – 14 years (12.8%)
• 19.2% of the population were under the age of 15 years, compared with 18.5% of
the ADHB population overall (See Figure 2 below)
• 13% of the population (999 people) were over the age of 65 years, compared with
9.4% in ADHB overall
• The median age on Waiheke remains unchanged from 2001 at 41 years
• The trend and projected figures to 2011 are interesting for the continued decline in
the relative number of over 65 year olds, from 14.9% of the population in 1996, to a
projected 12.2% in 2011. This is likely to reflect a movement off the island for more
elderly people as they require increasing levels of care
6 Waiheke Island Health Needs AssessmentFigure 2: Population 1996 - 2011 by age group
Population 1996 - 2011 by age group
9000
8000
1005
999
7000
993
6000 939
2565
Number of people
2331 65 Years and Over
2097 45-64 Years
5000
25-44 Years
1719
15-24 Years
4000 5-14 years
2364 0-4 Years
2187
3000 2010
1809
2000 705 819
591
552
1000 831 996 981 966
435 447 489 531
0
1996 2001 2006 2011*
Census Year
* 2011 counts are projected
Table 2: Census Age Structure 1996 - 2006
65 Years Median
0-4 Years 5-14 years 15-24 Years 25-44 Years 45-64 Years
and Over Age
1996 6.9% 13.2% 8.8% 28.8% 27.4% 14.9% 40
2001 6.3% 14.0% 8.3% 28.2% 29.4% 13.9% 41
2006 6.4% 12.8% 9.2% 28.4% 30.3% 13.0% 41
2011* 6.4% 11.7% 9.9% 28.6% 31.1% 12.2% -
3.1.5 Life Expectancy
• Based on the mortality experiences of all New Zealanders in the period 2005–
2007, life expectancy at birth was 78.1 years for males and 82.2 years for females
• For Auckland DHB, the latest data available are 2000 – 2002 and are similar to
the national data at 77.7 years for males and 82.4 years for females (see Table 3)
• There is too little data to be able to accurately calculate life expectancy for Waiheke
specifically, but more information is available in the ‘Mortality’ section
Waiheke Island Health Needs Assessment 7Table 3: Auckland DHB, Life Expectancy at Birth
Auckland DHB 1995 - 1997 2000 - 2002
Male Female Male Female
Life expectancy at birth (years) 74.8 80.1 77.7 82.4
3.1.6 Households & Families
• 1,080 people (33 percent) live in one-person households on Waiheke Island. This
is significantly higher than for ADHB overall, where one-person households make
up 24 percent of all households
• The average household size on Waiheke Island is 2.2 people, compared with an
average of 2.7 people for all of ADHB
• Couples with children make up 33 percent of all families on Waiheke Island, while
couples without children make up 46 percent of all families. In ADHB, couples
with children make up 44 percent of all families, while couples without children
make up 38 percent of all families (Figure 3)
• 21 percent of families on Waiheke Island are one-parent-with-children families,
compared with 18 percent of families for ADHB as a whole (Figure 3)
• Waiheke Island has a higher rate of home ownership, with 64 percent of
households in private occupied dwellings owning the dwelling, with or without a
mortgage. For ADHB as a whole, 42 percent of households in private occupied
dwellings own the dwelling, with or without a mortgage. Figure 4 highlights the
decreasing trend in home ownership from 68.5 percent in 1996 to 63.7 percent in
2006
Figure 3: Family Types (Census 2006)
50%
45%
40%
35%
30%
New Zealand
25% Auckland
W aiheke
20%
15%
10%
5%
0%
Couple without children Couple with child(ren) One parent with
child(ren)
8 Waiheke Island Health Needs AssessmentFigure 4: Tenure of Households
100%
177 237 177
80% 687
888 1029
Other
60%
Not Owned by Usual
Resident(s)
40% Owned or Partly Owned by
1881 Usual Resident(s)
1992 2118
20%
0%
1996 2001 2006
Census Year
Waiheke Island experiences similar population churn to ADHB and other areas in New
Zealand. Figure 5 shows that in 2006, just one-third of the usually resident population
were living at the same address as five years previously, with nearly half (49%) living
elsewhere in New Zealand. What we cannot tell from these data is the balance between
internal migration – i.e. people changing address within Waiheke, compared with new
people moving to the island from the mainland and vice versa. Of note is the larger
proportion of overseas immigrants moving into the ADHB area.
Figure 5: Usual Residence in 2001 compared with 2006
60%
50%
Same as Usual Res idenc e in
40% 2006
Elsewhere in New Zealand
Not Born
30%
Overs eas
20% Not Stated
10%
0%
W aiheke ADHB M anawatu
Waiheke Island Health Needs Assessment 93.1.7 Seasonal Variation
One of the health challenges facing Waiheke is the provision of services to a fluctuating
population. Previous estimates have put the peak summertime population at up to
40,000, and estimates of 30,000+ are not uncommon. It is unclear where these estimates
have come from and so an independent attempt to quantify the seasonal variation was
made1. As can be seen in Figure 6, the population over the summer months 2007-2008, is
estimated to have peaked at 22,581 on New Years Eve, with other spikes associated with
Auckland Anniversary weekend (13,691) and other weekend periods.
The average population over this three month period is estimated to be 11,705, although as
Figure 6 shows, this is subject to significant variation. Although not as high as some other
estimates, these data clearly show the potential for increased burden on acute health
services over this period. The estimated average population of 11,705 is 48% higher than
the usually resident population (7,9142), with peaks up to double that figure.
Figure 6: Waiheke estimated summer population based on daily net passenger movements
(07/08)
24000
22581
22000
20000
18000
Estimated population
16000
14000
13691
12000
10000
8000
6000
1
2
3
4
5
6
7
8
9
10
11
12
13
14
15
16
17
18
19
20
21
22
23
24
25
26
27
28
29
30
31
1
2
3
4
5
6
7
8
9
10
11
12
13
14
15
16
17
18
19
20
21
22
23
24
25
26
27
28
29
30
31
1
2
3
4
5
6
7
8
9
10
11
12
13
14
15
16
17
18
19
20
21
22
23
24
25
26
27
28
29
December 2007 January 2008 February 2008
3.1.8 Other interesting facts
• 64.6 percent of households on Waiheke Island have access to the Internet,
compared with 67.1 percent of households throughout the ADHB region
• On Waiheke Island 69.4 percent of households have access to a cell phone,
compared with 75.8 percent of households for ADHB as a whole
1
The 2006 Census night population (7 March 2006) was used as a base (8,049 people). A projected island night population
for 6 March 2008 was calculated based on historical trends, and this used as a anchor for the data series. Accurate
passenger movement data for the entire period was obtained from both Fullers & Sealink ferries, and an estimation of
Waiheke Shipping figures (based on capacity and Sealink patterns) was added. These data were then mapped over the
period to give the graph shown as Figure 6.
2
Projected as at March 2008 from Census 2006 data.
10 Waiheke Island Health Needs Assessment• 27.2 percent of people on Waiheke Island were born overseas, compared with 40.1
percent for ADHB as a whole
• For people born overseas who are now living on Waiheke Island, the most common
birthplace was the UK and Ireland, compared with Asia for all of ADHB
• English is the most commonly spoken language on Waiheke Island
• 4.3 percent of people on Waiheke Island speak Māori, compared with 2.0 percent
of people for all of ADHB
3.2 Health Services
There are no hospitals on Waiheke Island and publically funded primary and community
health services are predominantly provided under the umbrella of two organisations:
Waiheke Health Trust and Piritahi Hau Ora Trust.
The Waiheke Health Trust, established in 1991, owns and operates primary medical care
services (traditional General Practice) from the Ostend Medical Centre as well as
providing a number of other community based health and social services.
Piritahi Hau Ora Trust has operated a primary medical care service at Piritahi Marae since
1996 in addition to providing a number of other community based health and social
services.
Equal joint partners Piritahi Hau Ora Trust and Te Korowai Hauora O Hauraki Inc. own
and operate the Oneroa Accident & Medical Centre. The philosophy of this joint venture is
to improve the health status of Māori of Pare Hauraki and others who elect to use their
services. Te Korowai O Hauraki Inc. operates throughout the Coromandel District with
its head office in Thames.
Figure 7: Public Healthcare Providers on Waiheke Island
For ease of description, the various services provided are described on the basis of physical
location. For more information, please refer to Section 8 Utilisation of Health Services.
3.2.1 Oneroa Accident & Medical Centre (OAMC)
The Oneroa Accident & Medical Centre provides General Practice medical and nursing
services from their clinic based in the Red Cross building in Oneroa. They employ three
General Practitioners (2.4 FTE) and three practice nurses (2.4 FTE) and are open from
8.00am to 5.00pm, Monday to Friday. An independent General Practitioner is also a
tenant at the practice (0.4 FTE). After hours care is operated on a shared roster with the
Waiheke Island Health Needs Assessment 11You can also read