2016 Towards 100% Renewable Energy for Kangaroo Island! PREPARED FOR:!
←
→
Page content transcription
If your browser does not render page correctly, please read the page content below
!

                                                          !

Towards 100% Renewable Energy for Kangaroo
Island!
PREPARED FOR:!
ARENA, RENEWABLES SA and KANGAROO ISLAND COUNCIL

BY:
UTS: INSTITUTE FOR SUSTANABLE FUTURES!

FINAL REPORT !

                                                   2016
INSTITUTE FOR SUSTAINABLE FUTURES, UTS                                                                September 2016

Towards 100% Renewable Energy for Kangaroo Island!
Prepared for:
ARENA, RENEWABLES SA and KANGAROO ISLAND COUNCIL

Acknowledgments
ISF is grateful to AECOM for providing peer review of this report and advice on technology and
costs and characteristics used in the modelled scenarios.
ISF would also like to express its appreciation to all those who supported and assisted in the
development of this report, including:
   • Australian Renewable Energy Agency (ARENA)
   • Renewables SA
   • Andrew Boardman, CEO, Kangaroo Island Council
   • Wendy Campana, Kangaroo Island Commissioner
   • Andrew Nance, The Energy Project
   • SA Power Networks
   • John Glassmire, HOMER Energy
Any errors in this draft report are the responsibility of the Institute for Sustainable Futures, UTS.

Please cite this report as:
   Dunstan C., Fattal A., James G., Teske S., 2016, Towards 100% Renewable Energy for
   Kangaroo Island. Prepared by the Institute for Sustainable Futures, University of Technology
   Sydney (with assistance from AECOM) for ARENA, Renewables SA and Kangaroo Island
   Council.

Disclaimer
The Institute for Sustainable Futures makes no guarantee regarding the accuracy or reliability of
the information in this Report. This Report contains approximate modelling results and should not
be relied on in any way, including in making commercial decisions.

About ISF
The Institute for Sustainable Futures (ISF) was established by the University of Technology
Sydney in 1996 to work with industry, government and the community to develop sustainable
futures through research and consultancy. Our mission is to create change toward sustainable
futures that protect and enhance the environment, human wellbeing and social equity. We seek to
adopt an inter-disciplinary approach to our work and engage our partner organisations in a
collaborative process that emphasises strategic decision-making.
For further information visit: www.isf.uts.edu.au

The intellectual property in this Report (including, but not limited to copyright) is and remains the property of the
Institute for Sustainable Futures, University of Technology, Sydney.
Cover image: http://www.tourkangarooisland.com.au

TOWARDS 100% RENEWABLE ENERGY FOR KANGAROO ISLAND                               FINAL REPORT                    2
INSTITUTE FOR SUSTAINABLE FUTURES, UTS                                 September 2016

CONTENTS

Summary                                                                4!
1! Introduction                                                       11!
2! Energy Supply Scenarios                                            14!
3! Local Energy Options and Costs                                     30!
4! Ensuring Reliable Supply                                           40!
5! Institutional Issues                                               45!
APPENDICES                                                            50!
Appendix A1: List of Interested Parties                               51!
Appendix A2: Precedents for Renewable Energy Islands                  54!
Appendix A3: Modelling Inputs                                         61!
Appendix A4: Modelling Details                                        67!

TOWARDS 100% RENEWABLE ENERGY FOR KANGAROO ISLAND      FINAL REPORT            3
INSTITUTE FOR SUSTAINABLE FUTURES, UTS                                               September 2016

SUMMARY
A"powerful"choice"for"Kangaroo"Island"
Kangaroo Island’s electricity is currently supplied through a 15 km submarine cable from mainland
South Australia. As this cable is approaching the end of its design life, SA Power Networks
(SAPN), the business responsible for the local electricity distribution network, is investigating
options for future electricity supply for the island. The preferred network option is a replacement
submarine cable at an estimated capital cost of $45 million (+10%, -50%). As required by the
National Electricity Rules, SAPN is undertaking a Regulatory Investment Test – Distribution (RIT-D),
including seeking proposals for non-network alternatives to a new cable.1
This study, Towards 100% Renewable Energy for Kangaroo Island, complements SAPN’s
investigation by assessing options for reliable local power supply that would meet Kangaroo
Island’s electricity needs from resources on the island, while delivering power reliability that is
equivalent to or better than would be provided by the new cable option. This local power supply
would be largely based on renewable energy sources including wind, solar and potentially
biomass, supported by batteries, demand management and back-up diesel generation. This study
also considers how local supply options could allow Kangaroo Island to transition towards 100%
renewable power.
This study finds that the overall direct and indirect costs of local electricity supply would be
comparable to the cost of the new cable option. The choice of power supply is therefore likely to
depend on other factors, such as the preferences of the local community, how costs, benefits and
risks are shared, and the level of engagement and support from other key stakeholders including
SAPN, governments and regulators.

Local"electricity"supply"a"cost8competitive"option"
This study considers ten possible scenarios, based on publicly available data, for meeting the
electricity needs of Kangaroo Island over a 25-year time horizon. Based on current technology and
costs for renewable energy, and for other generation and network services, a reliable, local “Wind-
Solar-Diesel Hybrid” Scenario is estimated to be broadly comparable in cost to the New Cable
Scenario. The Wind-Solar-Diesel scenario would likely include doubling the existing 8 MW diesel
generation capacity, four to eight wind turbines, five hectares of solar farm and additional solar
panels on about 800 rooftops.
The direct cost for the New Cable Scenario is estimated at $77 million (including the capital costs
for the new cable and the cost of mainland grid-supplied electricity consumed on Kangaroo Island).
This is 11% less than the $87 million for the Wind-Solar-Diesel Hybrid Scenario. However, if
indirect costs including network charges are included, costs for the New Cable Scenario rise to
$169 million, 6% more than the $159 million for local supply. The estimated cost difference
between the scenarios is thus relatively small, and well within the range of uncertainty.
The Wind-Solar-Diesel Hybrid Scenario is estimated to provide about 86% renewable power
supply (wind and solar) to the island, with the remaining 14% provided by new diesel generators.
This solution could very likely provide reliable supply on Kangaroo Island by December 2018 and it
could be fully established within four years. Such Wind-Solar-Diesel hybrid solutions have been
demonstrated in numerous places over recent years, including on King Island, Tasmania.

1
    SAPN 2016 Non-Network Options Report (NNOR): Kangaroo Island Submarine Cable

TOWARDS 100% RENEWABLE ENERGY FOR KANGAROO ISLAND                    FINAL REPORT            4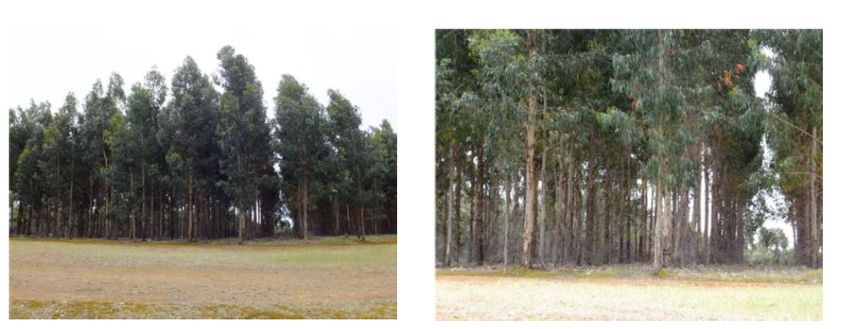
INSTITUTE FOR SUSTAINABLE FUTURES, UTS                                                             September 2016

Towards"100%"renewable"local"energy"supply"
The Wind-Solar-Diesel Hybrid Scenario also provides a strong foundation to transition to a 100%
renewable power supply. This study examines several scenarios for providing 100% local
renewable power for Kangaroo Island. Of these scenarios, one was considered to provide a
credible balance of cost, reliability, risk and community acceptance. This Balanced 100%
Renewables Scenario would use Kangaroo Island’s unused timber plantations to fuel biomass
electricity generation to complement the wind and solar resources in the Wind-Solar-Diesel Hybrid
Scenario.
The biomass generation would largely displace imported diesel fuel generation. Plantation timber
is a much less expensive fuel than diesel, but the capital cost of the biomass plant would be
considerable (about $25 million), so the Balanced 100% Renewables Scenario is estimated to cost
about 15% more than the Wind-Solar-Diesel Hybrid Scenario, at $100 million (direct costs) or 7%
more at $166 million (including indirect costs).
For this scenario, a small amount of diesel-generated power will still be required on rare occasions
when power demand is relatively high, wind and solar output are both low, biomass generation is
unavailable or fully utilised, and battery and demand management capacity are exhausted. It is
estimated that such diesel back-up generation would likely provide less than 1% of total electricity
supply. If this small volume of diesel generation was fuelled by renewable biodiesel2 instead of
conventional mineral diesel fuel, then Kangaroo Island could be supplied with 100% renewable
power. Such a 100% renewable system could be established within five years.

       Table 1: Estimated costs of new cable and local power supplies scenarios

Scenario                                         New Cable            Wind-Solar-              Balanced
                                                                     Diesel Hybrid          100% Renewables

Direct costs (NPV)                               $77 million           $87 million              $100 million
                                                             3
    Capital expenditure (amortised)              $34 million             $60 million             $87 million
    Operating expenditure                        $43 million             $42 million             $29 million
    (less Renewable Energy Certificates)             0                 (-$15 million)           (-$16 million)

Range of direct costs                          $57-96 million        $70-102 million          $69-129 million

Direct & indirect costs                         $169 million          $159 million              $166 million

Range of direct & indirect costs              $141-198 million      $119-184 million         $113-204 million

                                   "

2
  As has been demonstrated on King Island. http://www.kingislandrenewableenergy.com.au/project-
  information/biodiesel-trial
3
  The cable capital cost is $36 million, the centre of the range of uncertainty in the NNOR, amortised over a 35-
  year anticipated lifetime, and (as with all costs) is expressed as a net present cost over 25 years.

TOWARDS 100% RENEWABLE ENERGY FOR KANGAROO ISLAND                            FINAL REPORT                    5
INSTITUTE FOR SUSTAINABLE FUTURES, UTS                                                               September 2016

Supply"scenario"costs""
The estimated costs and the range of uncertainty of New Cable, Wind-Solar-Diesel Hybrid and
Balanced 100% Renewables Scenarios are shown in Table 1. These estimates are based on
conservative assumptions about the current and future costs of renewable energy technologies
and they include the costs of covering the risk that the existing undersea cable may fail during the
four years required to implement the Wind-Solar-Diesel Hybrid Scenario.4
These cost estimates are based on a wide range of sources, including future grid electricity price
projections and publicly available data not specifically tailored to Kangaroo Island’s circumstances.
Consequently, there is considerable uncertainty around scenario costs (up to +/-30%). The likely
cost range could be reduced to an estimated +/-10% through a detailed engineering design and/or
tender process. Such a process would likely take up to 12 months to complete.
The comparison of direct costs is also shown in Figure 1. The direct costs include capital and
operating costs of the new cable and local supply, and demand management options, minus the
value of Renewable Energy Certificates (RECs) generated by these options.

                 Figure 1: Direct costs of new cable and local power scenarios
                                          (Net present value over 25 years;
                                   Vertical blue bar indicates range of uncertainty)

4
    As required by SAPN’s assessment criteria, SAPN 2016, Non-Network Options Report, Section 7.2, “Such a
    non-network solution must be able to support total demand when the existing cable fails (i.e. islanded solution),
    thereafter for the whole evaluation period of 25 years”.

TOWARDS 100% RENEWABLE ENERGY FOR KANGAROO ISLAND                              FINAL REPORT                    6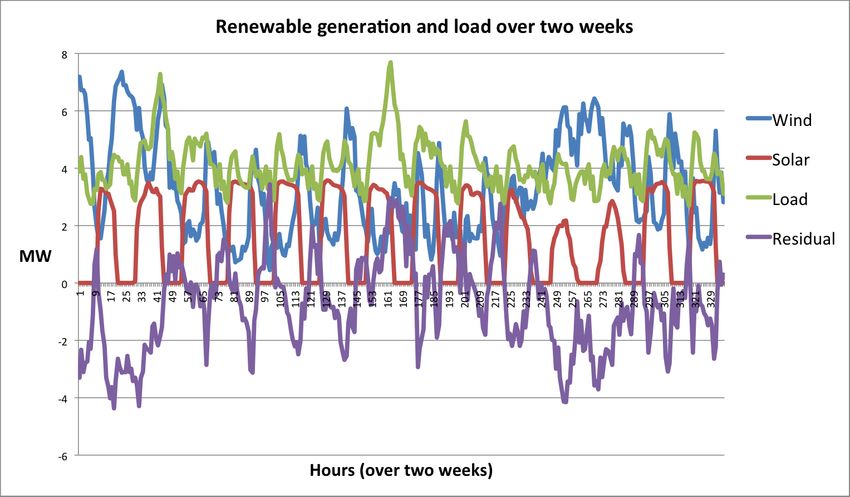
INSTITUTE FOR SUSTAINABLE FUTURES, UTS                                                          September 2016

The comparison of direct and indirect costs is shown in Figure 2. The indirect costs include
network charges and mandatory Renewable Energy Target costs associated with the electricity
supplied in each scenario. These costs are discussed in more detail in Section 3. The indirect
costs are paid by Kangaroo Island customers, but are not required to be taken into account by
SAPN in the RIT-D calculations. The reduced network charges in the local supply scenarios reflect
the reduced volume of energy supplied via the distribution network, due to demand management
and increased rooftop solar generation “behind the meter”.5

          Figure 2: Direct and indirect costs of new cable and local power scenarios
                                         (Net present value over 25 years;
                                  Vertical blue bar indicates range of uncertainty)

Other"benefits"of"local"electricity"supply"
There are also other benefits of supporting the development of local power supply and renewable
energy on Kangaroo Island that have not been quantified in this study. These benefits include:
      •    enhanced local economic development and employment,
      •    reduced carbon emissions,

5
    Note that these reduced network charges would not reduce SAPN’s total revenue during the current regulatory
    period and would be recovered by a slight increase in network charges across its service territory.

TOWARDS 100% RENEWABLE ENERGY FOR KANGAROO ISLAND                            FINAL REPORT                 7
INSTITUTE FOR SUSTAINABLE FUTURES, UTS                                                                September 2016

      •    reduced exposure to a single point of network failure,
      •    enhancing Kangaroo Island’s clean and green brand,
      •    providing a high-profile, innovative, large-scale Australian case study for high-penetration
           decentralised energy, renewable energy and smart mini-grid control.
These benefits carry significant economic potential and are consistent with current South
Australian Government policy objectives. Adopting a local renewable power supply strategy in a
popular, iconic location like Kangaroo Island is likely to attract much international attention. It is
likely to be recognised as a leading demonstration project with potential to catalyse other major
investment activity in this area.

Assessing"and"managing"risk"
Cost is not the only relevant criterion for assessing supply options for Kangaroo Island. Reliability,
risk and community acceptance are also crucial. The New Cable Scenario presents a
straightforward technical solution, and a well understood level of risk and reliability. By contrast,
the local electricity supply scenarios involve a relatively complex mix of wind, solar, battery,
demand management, diesel and possibly biomass technology. These would need to be
configured to be able to operate as an isolated mini-grid. While such technologies have all been
well demonstrated in Australia and overseas, such an approach at this scale in place of grid asset
replacement would represent a major precedent and innovation in the Australian context.
The short timeframe to implement such comprehensive local supply solutions is also challenging.
The practical lead times required to develop, assess, approve and construct local wind generation
and to establish a biomass supply chain and generator would almost certainly extend beyond the
December 2018 deadline stipulated by SAPN in its RIT-D assessment process. It would be
prudent to allow at least four years for these facilities to be operational.
On the other hand, it is reasonable to expect that solar, battery and diesel facilities could be
established well before December 2018, the date when the new submarine cable would be
completed. The use of local resources would enhance supply reliability in the period prior to the
proposed new cable completion, and could secure reliability between December 2018 and the
completion date for wind and potentially biomass generation (2020-2021). The cost of diesel
generation in the event of the failure of the existing cable during this period is included in the local
supply scenario cost estimates above. These estimates use a risk-weighted calculation as
described in Section 2.3.
Just as it is possible that the existing undersea cable could fail before December 2018, it is also
possible that the existing cable could continue to operate well beyond its expected design life of
2023. The longer the existing cable lasts, the lower the cost of operating diesel generation and
therefore, the lower the cost of the Wind-Solar-Diesel Hybrid and Balanced 100% Renewables
Scenarios. The continued operation of the existing cable could also facilitate the export of surplus
wind energy to the mainland with commensurate additional benefits for the Kangaroo Island
economy. These benefits are also estimated in Section 2.3.
It should also be noted that even a new cable can fail at any time during its design lifetime6, so the
Cable Solution also carries a risk of failure that is not costed in Table 1. The local electricity supply
scenarios are more complex than the New Cable scenario, but could also offer significant reliability
benefits because they are not dependent on a single source of supply. The value of this reduced
risk should also be considered.                                  "

6
    Consider for example of Basslink, which recently failed only 10 years into its 60-year design lifetime.

TOWARDS 100% RENEWABLE ENERGY FOR KANGAROO ISLAND                               FINAL REPORT                  8
INSTITUTE FOR SUSTAINABLE FUTURES, UTS                                                  September 2016

Non8technical"barriers"to"local"supply"solutions"
The above discussion addresses some key technical and financial risks associated with the
different supply scenarios. However, the most significant barriers to developing a local electricity
supply are probably non-technical, and relate to the regulatory, governance and business model
regime. Some of these key non-technical barriers are discussed briefly here.
Firstly, there is the issue of how various risks are allocated. Given its innovative nature, the local
electricity supply option is likely to be perceived as carrying significant additional risk. SAPN has
an obligation to ensure reliable supply of electricity on Kangaroo Island and is subject to significant
financial penalties if reliability falls short of specified targets. Adopting a local electricity supply
solution introduces numerous unfamiliar new elements that need to be managed by SAPN to
maintain reliability, along with consumer protection issues. These are examined in Section 5.2. A
single new cable owned directly by SAPN would be much simpler to manage.
Secondly, the way that SAPN revenues are regulated by the Australian Energy Regulator (AER)
means that it has strong long-term incentives to invest in new network assets, but relatively weak
short-term incentives to support non-network options. For example, SAPN can earn a net financial
return on investment in network assets (such as a new undersea cable) over the 30 to 40 year life
of the assets. However, if instead of investing in a new network asset, SAPN incurs operating
expenditure to support non-network local supply options, then at best it is permitted to retain the
short-term capital savings of deferring a network investment. Indeed, SAPN may not even be
permitted to recover the future cost of the non-network support. Such unbalanced incentives,
combined with other regulatory barriers, obstruct SAPN from establishing an attractive business
case to support non-network options, such as local electricity supply on Kangaroo Island.
Thirdly, the current RIT-D process does not ensure a balanced consideration of network and non-
network options. Network businesses are required, and funded, to devote substantial resources to
developing detailed network options, but such provisions seldom apply to developing non-network
options. Such local alternatives are usually only developed by non-network option proponents at
their own cost and risk. To provide a more balanced approach, detailed analysis of non-network
alternatives, such as those described in this study, should be the rule rather than the exception.
Fourthly, if a local electricity supply option were to be adopted, and subsequently the existing cable
from the mainland were to fail, then arrangements would need to be in place to ensure that the
local electricity suppliers were not able to abuse their monopoly power to raise electricity prices
unreasonably. However, there are contractual, ownership, governance and regulatory options
available to manage these issues, including shared community ownership of generation assets
and periodic tendering of retail services. However, to consult with and engage the community to
develop a suitable model would require a significant investment of time and resources. The South
Australian Government and the Kangaroo Island Council are two possible candidates who may be
willing and able to lead such a process.
These institutional issues are discussed in more detail in Section 5.

                               "

TOWARDS 100% RENEWABLE ENERGY FOR KANGAROO ISLAND                    FINAL REPORT                9
INSTITUTE FOR SUSTAINABLE FUTURES, UTS                                                 September 2016

Conclusion"
This study finds that a balanced local electricity supply solution, including a potential transition to
100% renewable power, could provide a timely, reliable and cost-competitive alternative to a new
cable linking Kangaroo Island to the mainland. The local electricity supply scenario would enhance
the energy self-reliance of Kangaroo Island and is likely to deliver a range of economic
development and other benefits to the local community. However, significant additional technical
analysis, market testing and stakeholder and community engagement would be required to confirm
costs and determine how a local electricity supply solution could be best configured.
A local electricity supply solution is only likely to be possible if it is strongly supported by the
Kangaroo Island community, and is also supported by SAPN. In particular, for local generation to
be cost competitive, SAPN funds earmarked for the new cable would need to be redirected to
support demand management and local generation in the form of “network support payments” or
similar arrangements. However, the current regulatory system creates a number of barriers to
SAPN providing such support.
It is likely that SAPN will wish to complete its RIT-D assessment of supply options in line with its
announced timeframe of December 2016. Despite the potential benefits of local renewable power
supply, it also seems likely that SAPN will prefer the new cable option for meeting the future
electricity needs of Kangaroo Island, due to:
   •   the non-technical barriers described above, including the constraints and incentives placed
       on SAPN by the current regulatory framework
   •   the limited amount of time and resources that have been available to assess local non-
       network alternatives
   •   the likely perception of higher risk by SAPN associated with local supply.
In this context, a local electricity supply solution seems unlikely to proceed unless there is strong
support from the Kangaroo Island community, and unless a significant third party, such as the
South Australian Government, the Australian Energy Regulator and/or ARENA, steps in to reduce
the barriers to SAPN adopting a more innovative non-network solution. Potential roles for these
and other stakeholders in driving the alternative solution are discussed in Sections 5.3, 5.4, and
5.5 in relation to network, generation, and retailing respectively.
Addressing such barriers in the context of Kangaroo Island would provide a powerful precedent for
supporting local electricity solutions throughout Australia.

TOWARDS 100% RENEWABLE ENERGY FOR KANGAROO ISLAND                   FINAL REPORT               10
INSTITUTE FOR SUSTAINABLE FUTURES, UTS September 2016 1 INTRODUCTION 1.1 BACKGROUND" Kangaroo Island’s electricity is currently supplied through a submarine cable connected to mainland South Australia. As the cable is approaching the end of its design life, the owner of the cable, SA Power Networks (SAPN), is considering options for future supply for the island. SAPN is in the process of undertaking a Regulatory Investment Test – Distribution (RIT-D) to determine the best solution for future supply for the island. As part of the RIT-D request, SAPN sought proposals for non-network alternatives to the network option of building a replacement submarine cable from the mainland at an estimated cost of $45 million (+10%/-50% – that is, between $22.5 and $49.5 million). This Towards 100% Renewable Energy for Kangaroo Island research project aims to support and complement the RIT-D non-network proposal process by providing a quantitative and qualitative assessment of local power supply for Kangaroo Island. This assessment is intended to provide a timely analysis in order to inform proponents and to build community and South Australian Government understanding of possible renewable energy (RE) options. This project assesses the costs and benefits of a mix of renewable energy, demand management, energy storage and supporting diesel or biodiesel generation to meet the current and foreseeable future energy needs of the Kangaroo Island community. It seeks to do this while improving reliability and flexibility, and without increasing energy bills. If implemented, local renewable electricity supply on Kangaroo Island would be a landmark in the development of renewable energy in Australia and would be a signpost to a future 100% renewable electricity system for Australia. The assessment includes the short-term and long-term potential costs and benefits for Kangaroo Island customers and for SAPN, compared to investing in a replacement cable. The sharing of costs and benefits depends on the regulatory framework, and potential regulatory pathways are considered. This report sets out: • the scenarios examined and the results of the modelling • a qualitative assessment of energy costs in the future • an assessment of maintaining reliability under future scenarios • an examination of the connection and network access. This chapter examines the background to the project, including: • the nature of Kangaroo Island electrical supply • the current RIT-D process being undertaken by SAPN. 1.2 KANGAROO"ISLAND" Kangaroo Island lies off the coast of the mainland of Australia near Adelaide and is part of the state of South Australia. Kangaroo Island is Australia’s third-largest island, after Tasmania and Melville Island. It has a land area of 4,405 km2, larger than the combined areas of Luxembourg, Singapore and Bahrain. One of the major industries is tourism, and the island has more than 200,000 visitors per year. The island has approximately 4,500 permanent residents. The largest town is Kingscote with a population of almost 2,000. Figure 3 shows a map of the island, and its position relative to the South Australian mainland. TOWARDS 100% RENEWABLE ENERGY FOR KANGAROO ISLAND FINAL REPORT 11
INSTITUTE FOR SUSTAINABLE FUTURES, UTS                                                 September 2016
                                                                       7
                                    Figure 3: Map of Kangaroo Island

Currently, Kangaroo Island is connected to the National Electricity Market (NEM) through a
submarine 33kV cable from Fishery Beach on the mainland to Cuttlefish Bay on Kangaroo Island,
near the town of Penneshaw. A map of the existing high voltage electrical infrastructure of the
island can be seen in Figure 4.

                                                                                          8
            Figure 4: Electrical infrastructure on Kangaroo Island (33 kV network in green )

The power supply cable from the mainland was energised in 1993 and has a design life of 30
years (until 2023), with an electrical rating of 10 MVA. As the cable is approaching the end of its
expected life, SAPN is looking at augmentation options to ensure continued reliable supply of
electricity to consumers on the island.

7
  Map sourced from Australian Travel and Tourism Network:
  www.atn.com.au/sa/south/kangarooisland-map.html
8
  SAPN (2105) Annual Planning Report, p. 258.

TOWARDS 100% RENEWABLE ENERGY FOR KANGAROO ISLAND                      FINAL REPORT            12
INSTITUTE FOR SUSTAINABLE FUTURES, UTS September 2016
The"RIT8D"process"
SAPN has identified a network option of replacing the existing submarine cable with a new 33 kV
submarine cable from Fishery Beach to Cuttlefish Bay. This cable would have a rated capacity of
20 MVA, with the potential to be upgraded to a higher voltage of 66 kV, with a resulting increased
capacity of 40 MVA. The estimated cost of this cable replacement is $45m with significant
uncertainty (+10%, -50%) due to the range of indicative quotations received by SAPN.
Under clause 5.17 of the National Electricity Rules, SAPN is required to undertake a RIT-D
process as part of evaluating the augmentation options. This is a regulatory test which aims “to
identify the credible option that maximises the present value of the net economic benefit to all
those who produce, consume and transport electricity”.9
As part of this process, SAPN has sought submissions from third parties on how best to continue
electricity supply to the island. It is requesting submissions on the best way to meet the island’s
supply needs through non-network solutions. A non-network solution in these circumstances would
involve the island being able to meet its own energy needs without a replacement cable.
Under the RIT-D process, SAPN needs to consider whether support payments to one or more non-
network project proponents will provide an option that maximises present value. A final decision on
the preferred option to meet the identified need will be made in the final Project Assessment
Report. For its analysis, SAPN has indicated that it is following the timeline outlined in Table 2.
10
Table 2: Planned timeline of the RIT-D process.
Milestone Date
Issue of Non-Network Options Report (NNOR) Friday 15 April 2016
Information Session (Q & A) Monday 16 May 2016
Latest date for Final Proposal Submissions to NNOR Friday 15 July 2016
Expected date for publication of Draft Project Assessment
October 2016
Report (DPAR)
Expected date for publication of Final Project
December 2016
Assessment Report (FPAR)
9
National Electricity Rules, Clause 17.17.1(b).
10
SAPN (2016) Non-Network Options Report: Kangaroo Island Submarine Cable.
TOWARDS 100% RENEWABLE ENERGY FOR KANGAROO ISLAND FINAL REPORT 13INSTITUTE FOR SUSTAINABLE FUTURES, UTS September 2016
2 ENERGY SUPPLY SCENARIOS
2.1 METHODOLOGY"
The analysis of supply options for Kangaroo Island has been undertaken using two different
energy models: the commercial software Hybrid Optimization of Multiple Energy Resources
(HOMER)11 and the RE24/7 model, which has been developed by ISF staff.12 This allowed us
flexibility to add helpful bespoke features to the RE24/7 model, while cross-validating the results
obtained by both models to ensure that the analysis follows accepted industry norms.
Table 3 discusses some areas of difference between the models to indicate their relative strengths.
Table 3: Feature comparison between HOMER and RE24/7 modelling software
Feature HOMER RE24/7
Sophisticated models including Basic models with time series
Models of renewable
automatic “typical year” solar developed manually for solar and
generation
profiles wind generation
Sophisticated and richly featured Basic models with assumptions
Models of diesel and
models based on years of user suitable only for a first-pass
biodiesel generation
experience analysis
Limited choice of operation regimes
Batteries used to store surplus RE
Battery operation with batteries used for balancing
and supply residual load
not energy shifting
System reserves specified manually
Ability to specify contingency
Reliability with calculated system adequacy
reserves
measures
Discounted cash flow over
Net present cost in total and per
Financial analysis modelling period with explicit RECs
generation technology
and other local features
11
HOMER is an energy modelling software package for designing and analysing hybrid power systems. A trial
version of the software can be downloaded free at the website: http://www.homerenergy.com/ .
12
RE24/7 is based on [R]Evolution which was developed in a thesis by ISF Research Principal Dr Sven Teske
(2015), ‘Bridging the Gap between Energy-and Grid Models: developing an integrated infrastructural planning
model for 100% renewable energy systems in order to optimize the interaction of flexible power generation,
smart grids and storage technologies’, University of Flensburg, Germany.
TOWARDS 100% RENEWABLE ENERGY FOR KANGAROO ISLAND FINAL REPORT 14INSTITUTE FOR SUSTAINABLE FUTURES, UTS September 2016
Our modelling approach used HOMER and RE24/7 in a complementary way, with the general
process outlined as follows:
• Develop models for several supply scenarios (defined in the next section) using RE24/7 to
ensure the generators can supply the Kangaroo Island demand through a single modelled
year at hourly intervals.
• Implement the same scenarios in HOMER and use this software’s sensitivity and
optimisation tools to explore the cost impacts of changing capacities of each energy supply
or storage technology.
• Select preferred supply mixes for each scenario based on cost, curtailment, likely
community appeal, and potential for continuous 100% renewable supply.
• Model the same supply mixes in both RE24/7 and HOMER to cross-validate on the basis of
cost and energy output per technology.
A significant level of curtailment of wind and solar generation was accepted in order to achieve a
high renewable energy fraction. Figure 5 shows two weeks of wind, solar and load on Kangaroo
Island. This assumes 8 MW of wind capacity and 6 MW of solar PV capacity in addition to the
existing rooftop solar PV generation, corresponding to the “Balanced” scenario described below.
Load data are scaled to account for load growth to 2017. The residual is negative when wind and
solar generation exceed load, leading to curtailment of generation. Curtailed wind and solar energy
that is not used to supply load cannot earn REC revenue and this is reflected in the net present
costs for these technologies.
Figure 5: Wind, solar and load on Kangaroo Island over two weeks
For more detailed discussion of the modelling approach please refer to Appendix A4.
TOWARDS 100% RENEWABLE ENERGY FOR KANGAROO ISLAND FINAL REPORT 15INSTITUTE FOR SUSTAINABLE FUTURES, UTS September 2016
2.2 INTRODUCTION"TO"SCENARIOS"
This chapter examines the scenarios that have been modelled to explore future supply options for
Kangaroo Island. Here, we briefly describe the scenarios used. Section 2.3 shows the net present
cost results and the energy output from each generation technology used. Section 2.4 examines
each scenario in turn, with a description of the technologies used.
To gain a greater understanding of the implications of 100% RE on Kangaroo Island we have
modelled five different groups of scenarios. These are:
• Scenario group 1: Construction of a replacement submarine cable connection to mainland
o Scenario 1a: Sourcing mainland wholesale electricity
o Scenario 1b: Sourcing mainland 100% renewable electricity
• Scenario group 2: Powering the entire island through diesel generation
o Scenario 2a: Using conventional diesel fuel
o Scenario 2b: Using renewable biodiesel fuel
• Scenario group 3: Simple decentralised energy solution using solar and wind generation
o Scenario 3a: Backed up by diesel with a short-term “balancing” battery
o Scenario 3b: As above (Scenario 3a) with demand management (including energy
efficiency and peak load management)
• Scenario group 4: Deployment of 100% renewable generation
o Scenario 4a: Renewable energy supply with an longer-term “energy-shifting”
battery
o Scenario 4b: Renewable energy supply with biomass generation (using existing
local plantation resources) and a balancing battery
o Scenario 4c: Renewable energy supply with biodiesel and a balancing battery
• Scenario 5: Balanced combination of wind, solar, biomass, and biodiesel generation
o This scenario models a staged introduction of new generation resources due to the
range of approval and procurement times involved.
All local generation scenarios, except 3A, include the estimated impact of demand management on
both the energy demand and the new generation capacity needed to meet the anticipated growth
in peak demand. Demand management opportunities on the island are likely to be cost effective
alongside local generation that is augmented incrementally with demand growth, because they
would reduce the requirement for both generation capacity and fuel. Demand Management is not
anticipated to be implemented alongside investment in a new submarine cable connection,
because it would only reduce the amount of wholesale electricity purchased, and not offset the
capital cost of the cable replacement.
2.3 SUMMARY"OF"RESULTS"
Direct"Costs"
We undertook a high-level cost comparison of the different scenarios using the RE24/7 model,
cross-validated with the commercial HOMER software to ensure the results are compatible with
standard micro grid analysis. The modelled costs for the different scenarios include:
• capital costs for the construction of the cable or for generation on the island
• operational costs for generation, including fuel costs where applicable
TOWARDS 100% RENEWABLE ENERGY FOR KANGAROO ISLAND FINAL REPORT 16INSTITUTE FOR SUSTAINABLE FUTURES, UTS September 2016 • wholesale energy costs for any imported energy to the island from the mainland grid • costs and benefits related to the longevity of the existing submarine cable. The cumulative direct costs of the different scenarios over 25 years as derived by the RE24/7 modelling can be seen below in Figure 6, and the corresponding annual energy outputs per technology are charted in Figure 7. The numerical data are given in Table 4 and Table 5. These are net present costs in constant-dollar terms (no inflation) assuming a 7% discount rate. Wholesale electricity and diesel fuel costs are a significant influence on the costs, and the relative costs, of the scenarios presented. They are also subject to significant future uncertainty. No detailed forecasting was attempted for this analysis; rather, the wholesale electricity cost was assumed to be constant at $67.1/MWh based on the ASX Futures market for September 2019, and the diesel fuel cost was assumed constant at $1.22/litre based on a recent study of diesel power generation in South Australia. These and other input assumptions are listed in detail in Appendix A3. In our modelling, we have included the potential Renewable Energy Certificate (REC) revenues from each renewable generator as a negative operational cost of running that generator. For example, the cost shown for wind power is the sum of the capital cost and operational cost minus the expected REC revenue. The Renewable Energy Target (RET) and the way it has been modelled in this project is explained in more detail in Section 0. The REC price to 2030 was assumed constant at $57.0/MWh based on the ASX Futures market for January 2021. Cable"Contingencies" Proponents are required by the SAPN Non-Network Options Report to propose solutions for reliable power supply from December 2018. The Scenario 3 and Scenario 5 options include an estimated cost of managing the risk of cable failure in 2019 or 2020, calculated as the diesel fuel and operating expenditure to supply the load until new wind and biomass local generation resources are operational, which is assumed to be in 2021. The Scenario 4 options do not include this cost because they are presented as illustrative options rather than viable supply options. Scenario 4A and 4C do not have diesel back up, while 4B is essentially a variant on Scenario 3B, with mineral diesel fuel replaced by biodiesel. Conversely, all scenarios with renewable generation include the estimated revenue from selling surplus generation to the wholesale market, weighted by the likelihood that the cable will remain in service until or beyond its design life of 2023. This revenue, and the cost of managing the risk of cable failure, are both weighted according to the probability that the cable will fail. In the absence of more reliable estimates, we have assumed the probability of cable failure to be 10% in each year from 2017 to 2026. The cable’s 30-year design life runs until 2023. To illustrate how cable contingencies are costed, Table 6 shows contributing annual costs and savings for Scenario 3B, the Wind-Solar-Diesel Hybrid power supply, for the possible life of the existing cable from 2017. The first three rows show our estimated likelihood that the cable will fail in or before each year, the cost of additional diesel fuel in each year prior to full installation of renewable energy supply, and the cost weighted by the likelihood. In this scenario, the wind generation is assumed to be fully installed in 2020, so the additional cost will be incurred prior to that year. Should the existing cable fail in 2017, there is no additional cost of fuel compared to the New Cable scenario, because a new cable would not be operational until 2018. The weighted costs, when calculated as a net present value, sum to $2.63 million as is shown in Table 4 for this scenario. Similarly, the remaining rows of Table 6 show our estimated likelihood that the cable will survive until each year, and the revenue from exporting- surplus generation and the savings in diesel fuel enabled by the cable in that year, both weighted by the likelihood. As a net present value they sum to $3.83 million as is also shown in Table 4 for this scenario. TOWARDS 100% RENEWABLE ENERGY FOR KANGAROO ISLAND FINAL REPORT 17
INSTITUTE FOR SUSTAINABLE FUTURES, UTS                                                     September 2016

                        Figure 6: Scenario costs (Net present value over 25 years, $M)

                 Table 4: Scenario Costs per technology (Net present value over 25 years, $M)
Scenario               1A       1B       2A       2B      3A       3B       4A      4B       4C          5
Solar                                                    5.19     5.19     5.19    5.19     5.19        8.23
Wind                                                     32.12   27.43     53.37   28.82   26.07    21.93
Batteries                                                7.32     7.32     173.1   7.32     7.32        6.38
Biomass                                                                                    49.73    36.32
Diesel                                  191.7            50.63   43.12
Biodiesel                                       209.1                              51.53            19.38
Demand                                  5.23     5.23             5.23     5.23    5.23     5.23        5.23
management
Wholesale             37.22    61.19
electricity
Cable                 39.54    39.54
Cable fails                                              3.02     2.63                                  3.45
2018-2019
(risk weighted
cost)

Cable fails                                              -4.31   -3.83                                  -1.19
2020-2026
(risk weighted
benefit)

Total                 76.76    100.7    196.9   214.3    93.98   87.08     236.9   98.08   93.53    99.75

.

TOWARDS 100% RENEWABLE ENERGY FOR KANGAROO ISLAND                        FINAL REPORT              18
INSTITUTE FOR SUSTAINABLE FUTURES, UTS September 2016
Figure 7: Scenarios Energy production (MWh/year)
Table 5: Scenario average energy outputs per technology (GWh p.a.)
Scenario 1A/1B 2A/2B 3A 3B 4A 4B 4C 5
Solar 2.3913 2.39 10.86 10.86 10.86 10.86 10.86 13.66
Wind 27.93 22.47 27.24 22.71 22.18 18.56
Batteries 0.674 0.658 3.01 0.650 0.665 0.629
Biomass 5.89 6.58
Diesel 36.53 7.23 5.61
Biodiesel 36.53 5.37 0.122
Cable 43.62
Total 46.01 38.92 46.01 38.92 38.92 38.92 38.92 38.92
Curtailment 20.15 17.84 42.06 19.15 16.57 13.98
14 15
RE fraction 5.2% 6.2% 84.3% 85.6% 100% 100% 100% 100%16
13
This is the modelled output of the 1.7 MW of solar PV generation that is already installed on the island.
14
This only includes the local renewable electricity fraction; does not include the share of renewable energy
in the mainland supplied electricity.
15
If renewable biodiesel is used instead of conventional diesel, then the renewable energy share is 100%.
16
Costs for biodiesel are used in scenario 5, so it is 100% renewable energy. Note that even if conventional
diesel is used, the renewable energy fraction is still a very high 99.7%.
TOWARDS 100% RENEWABLE ENERGY FOR KANGAROO ISLAND FINAL REPORT 19INSTITUTE FOR SUSTAINABLE FUTURES, UTS September 2016
Table 6: Method to estimate cost if cable fails and benefit if cable survives
Year 2017 2018 2019 2020 2021 2022 2023 2024 2025
Likelihood of failure 10% 20% 30% 40% 50% 60% 70% 80% 90%
Extra fuel consumption
6.05 6.05
if cable fails early ($M)
Weighted by likelihood
1.21 1.82
of cable failing ($M)
Likelihood of survival 90% 80% 70% 60% 50% 40% 30% 20% 10%
Revenue from selling
surplus generation if 0.97 0.97 0.97 0.97 0.97 0.97
cable survives ($M)
Weighted by likelihood
0.58 0.48 0.39 0.29 0.19 0.10
of cable surviving ($M)
Savings in fuel if cable
1.61 1.61 1.61 1.61 1.61 1.61
survives ($M)
Weighted by likelihood
0.96 0.80 0.64 0.48 0.32 0.16
of cable surviving ($M)
Estimating"Costs"to"Kangaroo"Island"Community"
Only direct costs are formally assessed by the RIT-D process. However, likely costs to the
Kangaroo Island community are an important additional consideration in situations where they are
affected by the proposed network or non-network solution. Were the existing submarine cable to
fail, without a replacement cable to Kangaroo Island, the price regime applying to customers would
depend on a negotiated outcome to manage the transition away from the present regulated
regime. This is further discussed in Section 5.
To attempt to estimate the costs facing Kangaroo Island customers via electricity bills, we have
assumed that Distribution and Transmission Use of System (DUoS and TUoS) charges would
continue to apply. Although it could be argued that TUoS should no longer apply if the island
produced its own power because it would not be benefitting the transmission system on the
mainland, it could equally be argued that the DUoS should be increased to allow for the additional
costs of operating an islanded network. Assuming the same network charges will apply seems a
balanced approach. The electricity consumption on the island, like all electricity consumption
across the National Electricity Market, also carries a RET liability that pays for REC revenues
delivered throughout the country.
Figure 8 shows the cumulative costs of the different scenarios over 25 years, derived using these
assumptions. From this viewpoint, the Local Wind-Solar-Diesel Hybrid Solutions represented by
Scenarios 3B and 5 are similar or slightly cheaper than the Cable Solution.
If the island wished to market itself as having 100% renewable energy, it may need to surrender its
REC certificates rather than sell them. This would imply a higher cost borne on the island. The
REC revenues from all renewable generators are also summed and shown as a separate item in
Figure 9. If the island decides to surrender its REC certificates without financial reward, this
summed “foregone revenue” should be added to the total cost of each scenario, because the
technology costs already incorporate the REC revenue, as discussed above.
TOWARDS 100% RENEWABLE ENERGY FOR KANGAROO ISLAND FINAL REPORT 20INSTITUTE FOR SUSTAINABLE FUTURES, UTS September 2016
Figure 8: Net present costs over 25 years including network and RET charges
Figure 9: Net present costs over 25 years including RECs retired and curtailed
Renewable energy generators that are under-utilised, but would have been capable of generating
if load was higher, do not generate RECs for that part of their output that is not used. These
foregone certificates are referred to as “curtailed RECs” and, for the purpose of comparison, are
shown below the axis in Figure 9. While the cable remains operational, any excess renewable
generation is delivered to the wholesale market and there are no curtailed RECs.
Table 7 shows the numerical data presented graphically in Figure 8 and Figure 9.
TOWARDS 100% RENEWABLE ENERGY FOR KANGAROO ISLAND FINAL REPORT 21INSTITUTE FOR SUSTAINABLE FUTURES, UTS September 2016
Table 7: Additional costs per scenario affecting the community ($ million net present cost)
Scenario 1A 1B 2A 2B 3A 3B 4A 4B 4C 5
DUOS 64.22 64.22 54.25 54.25 60.26 50.28 50.28 50.28 50.28 46.32
TUOS 23.87 23.87 19.99 19.99 22.33 18.45 18.45 18.45 18.45 16.91
RET
4.50 4.50 3.77 3.77 4.21 3.48 3.48 3.48 3.48 3.19
obligation
REC revenue 0.00 23.98 0.00 19.23 17.75 14.87 17.68 17.82 17.82 16.34
RECs
0.00 0.00 0.00 0.00 11.01 9.75 22.99 10.47 9.05 7.64
curtailed
2.4 SCENARIOS"
Scenario"1:"Replacement"Network"Cable"
This scenario shows the preferred network solution proposed by SAPN, which is to replace the
existing cable before the end of its design life with another 33 kV cable. The new cable would be
capable of operating at 66 kV as part of a future upgrade to increase its capacity.
Note that we have included an estimate of the wholesale electricity cost over the forward period, as
discussed in Section 2.3. This is because the value from any non-network solution will include not
just the deferral of network investment, but forgone imports of electricity from the South Australian
NEM wholesale market. Therefore, an estimate of this value is included so this scenario can be
directly compared with the non-network solutions outlined below.
We have split this scenario into two sub scenarios. Scenario 1A looks at the cost of replacing the
existing cable, and keeping supply from the NEM using current policies. Scenario 1B examines the
potential of sourcing 100% renewable energy from the mainland over the new cable. Scenario 1B
is not separately graphed but is shown in Table 4. The premium cost of renewable energy from the
mainland is estimated by the value of the large-scale generation certificates (LGCs) that would
need to be purchased for the wholesale energy that would be imported. This value corresponds to
the “RECs retired” shown in Figure 9.
Scenario"2:"Diesel"Generation"
This scenario examines the cost of supplying the island entirely with diesel generation, as a non-
network solution at the end of the life of the existing cable. We are not suggesting that this would
be a preferred alternative, but have included this scenario for comparison, and to highlight that a
diesel solution could be implemented quickly to meet reliability requirements. We consider that
supply on the island could be maintained with approximately 10 MW of generation in 2017,
increasing to 14 MW by 2041 to meet load growth. This provides redundancy, allowing a unit to be
offline for maintenance.
Diesel generation installed under this and all subsequent scenarios comprises diesel engines
capable of long-duration running. The existing diesel power station is intended for contingency use
only, and its engines are not designed for long-duration running.
We have split this scenario into two separate sub scenarios. Scenario 2A looks at supplying the
island solely through conventional diesel while Scenario 2B looks at supplying the island through
biodiesel. The usage of biodiesel is explained in Section 4.2. Scenario 2 is the most expensive
scenario examined, with a large portion of the costs being the assumed price of the diesel or
biodiesel fuel.
TOWARDS 100% RENEWABLE ENERGY FOR KANGAROO ISLAND FINAL REPORT 22INSTITUTE FOR SUSTAINABLE FUTURES, UTS September 2016
Scenario"3:"Wind8Solar8Diesel"Hybrid"
This scenario examines the cost of supplying the island largely with embedded energy sourced
from the island itself as an alternative to replacing the cable. The scenario is intended as a
conservative option for locally sourcing power using renewable generators that are already
prevalent in Australia (and particularly in South Australia). While largely using renewable
generation, diesel generation is included to provide power when the renewable resource is not
sufficient to meet the instantaneous demand; it also acts a contingency reserve. A short-duration
balancing battery (0.5 hours discharge capacity) is included to help manage ramp rates and to
reduce the need for low-load running of the diesel generators. Experience of high-penetration
renewable power stations elsewhere in Australia, such as those operated by Horizon Power17, has
shown that short-duration energy storage is desirable when diesel generators are required to
balance the combined variability of load and wind or solar generation.
Wind generation is assumed to comprise several moderately large turbines with capacity 1-2 MW,
similar to those that can be seen by Kangaroo Island residents on the nearby Starfish Hill wind
farm. The 2017 capacity of 8 MW would require 4 to 8 single turbines most likely distributed
between two locations with suitable network capacity to carry their output, such as in the vicinity of
Penneshaw and the north coast near Kingscote. Solar PV generation is assumed to be divided
between a 2 MW solar farm (occupying about 5 hectares, the equivalent of about 5 soccer fields)18
and a further 2 MW of subsidized rooftop solar generation installed by customers (for example, 800
customer rooftops with an average of 5kW or about 20 solar panels each). This would be in
addition to the existing 1.7 MW of rooftop solar.
For this scenario we have modelled two slight variations. Almost all of the non-network solutions
are modelled with demand management programs in place, as described in Section 4.1, including
Scenario 3B. Scenario 3A, however, looks at supplying the forecast demand on the island using
embedded energy technologies alone, without demand management. This exception illustrates
how the benefits of demand management exceed the costs, reducing energy consumption and
hence the required generation capacity.
In both of these scenarios, Kangaroo Island is largely powered by renewable energy, to the order
of 86% of energy supplied. We note that Scenario 3B is cost competitive with the installation of the
cable in net present value terms, subject to the uncertainties in our cost estimates, which are
indicated in Figure 1 and Figure 2.
Scenario"4:"100%"Renewable"Energy"
This scenario looks at undertaking full 100% RE supply on Kangaroo Island as an alternative to the
replacement of the cable. Three scenarios are examined. Scenario 4A uses batteries to maintain
supply during periods when wind and solar resources are not sufficient. This requires “energy-
shifting” battery technology and practices, which are different to the short-duration “balancing”
batteries used for ramp-rate management in several other scenarios in this study. We note that this
scenario results in a very large wind installation to reduce the duration of these generation deficit
periods, and consequently this option also results in the highest level of generation curtailment.
The oversizing of this wind generation is costly and inefficient from an economic perspective.
Unlike all the other scenarios modelled, this scenario has periods during the year when the full
load cannot be met, resulting in an unserved load of 773 MWh in 2017 and 902 MWh in 2041.
Therefore this scenario is therefore not viable as a reliable power supply, but it is presented here to
provide an indicative scenario of renewable energy backed up by batteries alone. Lacking any
17
http://horizonpower.com.au/about-us/our-assets/marble-bar-and-nullagine-solar-power-stations/
18
For comparison, the 20MW Royalla Solar Farm in the ACT occupies about 50 hectares,
https://www.engineersaustralia.org.au/news/work-set-commence-act-solar-farm
TOWARDS 100% RENEWABLE ENERGY FOR KANGAROO ISLAND FINAL REPORT 23INSTITUTE FOR SUSTAINABLE FUTURES, UTS September 2016
other form of controlled generation, it would require a very large battery system to store enough
energy for periods of sustained low wind and solar generation output. The lithium-ion battery
assumed here may not be the appropriate technology for this scenario, because other energy
storage technologies may have lower costs per kWh for a large energy-to-power ratio.
Scenarios 4B and 4C use biodiesel and biomass generation respectively, to maintain supply during
periods when wind and solar resources are not sufficient. Section 3.1 discusses how these
renewable energy supplies may be obtained on Kangaroo Island. Within the Scenario 4 grouping,
biomass generation appears to be the most cost effective way to augment wind and solar
generation to provide a 100% renewable energy supply. However, these scenarios don’t account
for the time required to approve, procure, and build all the renewable generation required, which
for wind and biomass generation is longer than the 2018 requirement for full replacement of the
cable supply. Nor does Scenario 4C account for the operational limitations of operating biomass
generation in a high penetration RE system, about which there is little experience in Australia.
Scenario"5:"“Balanced”"100%"Renewables"Scenario"
The final scenario, Scenario 5, is intended to provide practical and cost-effective 100% renewable
supply through a staged build of new generation capable of meeting the island’s full demand from
2018, transitioning to 100% RE by 2021. It can be seen by comparing Figure 6 and Figure 7 that
biomass generation is cost effective compared to diesel or biodiesel generation, producing the
same amount of energy for a much smaller cost, because of the readily available plantation
resource on Kangaroo Island. Scenario 4C, however, has the shortcomings noted above.
Scenario 5 was developed as a more robust implementation of Scenario 4C. It includes 8 MW of
diesel generation as a contingency reserve and to provide the flexible response that a biomass-
fuelled steam turbine generator lacks. It also includes 2 MW of additional solar PV generation
(giving a total increase of 6 MW to the island’s solar PV capacity) and 2 MW less wind generation
(8 MW in total) than Scenario 4C. This energy mix benefits from the complementary generation
profiles of wind and solar generation that is commonly seen in the time series data; this
complementarity is evident in the first week of data graphed in Figure 5. A 3 MW “balancing”
battery is used in both Scenarios 4C and 5 to help manage ramp rates and reduce the necessity
for low-load diesel or biomass operation.
These measures increase the cost of Scenario 5, compared to Scenario 4C, but they help to
achieve a realistic investment transition strategy during the next few crucial years. Solar PV and
(new long-running) diesel generation can be built relatively quickly and would be able to provide
the necessary security of supply in the required timeframe to the end of 2018. Should the
submarine cable fail in 2018, the new diesel generation would be in place to supply load, and the
increased solar PV generation would reduce the diesel fuel requirement and therefore the financial
risk. Meanwhile, a demand management program could be implemented progressively, and wind
generation would be in advanced stages of planning and procurement. Therefore, a continual
reduction in fuel requirement could be expected with a higher degree of certainty. Biomass
generation would then be introduced, probably in a similar time frame to wind generation so that
everything would be in place by 2020. From then on, the island would experience very little, if any,
additional cost in the event of cable failure.
This build strategy provides reliable power in the event of cable failure from 2018, minimises the
financial risk of such failure by placing an effective cap on diesel fuel consumption, and provides a
diverse mix of renewable generation by the end of 2020 that is likely to be resilient to resource
variability. More granular modelling (with a finer time step than hourly) is required to confirm this
resilience and more generally the reliability of the Scenario 5 solution. This “balanced” scenario
was modelled using the cost of biodiesel instead of conventional diesel fuel. As the diesel plant is
minimally required, this is therefore low cost, and provides an effective path to 100% renewable
energy by 2020.
"
TOWARDS 100% RENEWABLE ENERGY FOR KANGAROO ISLAND FINAL REPORT 24You can also read