Electricity market reform - Karnataka case study - Udetanshu Himanshu Baghel David Nelson September 2020 A CPI Energy Finance project - Climate ...
←
→
Page content transcription
If your browser does not render page correctly, please read the page content below
Electricity market
reform – Karnataka
case study

Udetanshu
Himanshu Baghel
David Nelson

September 2020

A CPI Energy Finance project
Acknowledgements
This paper has been produced by the Energy Finance team at Climate Policy Initiative
(CPI EF) as part of the market reform and transition programme for India, focusing on
select states.
We are grateful for the support from multiple stakeholders we engaged with throughout
the process and who took part in the meetings and calls, including the Central Electricity
Regulatory Commission, Power System Operation Corporation, NTPC, Siemens, BSES,
AmarRaja, Exide, Exicom, Orient Green, L&T, Secure, WinAMR, Power One, Mahindra
Electric, ChargeMyGaadi, Fortum, CII and IESA
We would also like to acknowledge the support of our funders at CIFF, Hewlett and Shakti
and also for our civil society and consultant partners AVC, WRI, CAG, RAP, TERI, NREL,
Brookings, PEG and GTG-Rise.
Special thanks go to Vasudha Foundation, who have kindly shared with us data on
generation profiles in Karnataka.

Descriptors
Keywords                  Decarbonisation, Renewable energy, Market reform, Market
                          Transition, Flexibility, Integration, Solar, Wind, Thermal, Flexibility
                          from demand, Energy storage

Region                    Karnataka, India

Contact                   Udetanshu                udetanshu@cpilondon.org

                          Felicity Carus           felicity.carus@cpilondon.org

About CPI
Climate Policy Initiative works to improve the most important energy and land use policies
around the world, with a particular focus on finance. An independent organization
supported in part by foundation funding, CPI works in places that provide the most
potential for policy impact including Brazil, China, Europe, India, Indonesia, and the United
States. Our work helps nations grow while addressing increasingly scarce resources and
climate risk. This is a complex challenge in which policy plays a crucial role.
CPI's Energy Finance practice is a multidisciplinary team of economists, analysts and
financial and energy industry professionals focused on developing innovative finance and
market solutions that accelerate the energy transition.

 Copyright © 2020 Climate Policy Initiative www.climatepolicyinitiative.org
 All rights reserved.
September 2020 Electricity market reform: Karnataka case study
Table of contents
1. Introduction __________________________________________________________________ 13
2. Framework & methodology ___________________________________________________ 15
2.1 Renewable Energy Scenarios ______________________________________________ 15
2.2 Assessment of flexibility needs _____________________________________________ 16
2.3 Assessment of flexibility options ____________________________________________ 17
2.4 Power system modelling and integrated portfolios __________________________ 18
2.5 Barriers ___________________________________________________________________ 19
2.6 Role of market reforms ____________________________________________________ 19
3. Karnataka’s flexibility needs and challenges ___________________________________ 21
4. Meeting Karnataka’s growing flexibility needs __________________________________ 25
4.1 Flexibility portfolios ________________________________________________________ 26
4.2 Flexibility portfolios and the impact of reducing Karnataka’s coal pipeline ___ 29
4.3 Additional value for Karnataka, interstate markets and transmission__________ 30
5. Flexibility resources, potential, costs, barriers and market reform _________________ 32
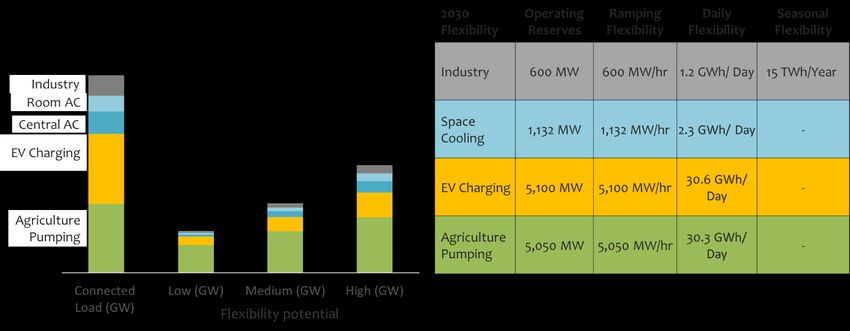
5.1 Meeting Karnataka’s flexibility needs from demand _________________________ 33
5.1.1 Potential for flexibility from demand for Karnataka ______________________ 33
5.1.2 Flexible capacity from agriculture pumping ____________________________ 36
5.1.3 Flexible capacity from EV charging ____________________________________ 38
5.1.4 Flexible capacity from space cooling __________________________________ 41
5.1.5 Flexible capacity from Industry ________________________________________ 43
5.1.6 Barriers to Flexibility from Demand______________________________________ 45
5.1.7 Market reform to integrate flexibility from demand ______________________ 45
5.2 Meeting Karnataka’s flexibility needs using storage technologies ____________ 47
5.2.1 Cost of storage _______________________________________________________ 48
5.2.2 Different business models can contribute to meeting flexibility needs ____ 51
5.2.3 Barriers to flexibility from energy storage ________________________________ 51
5.2.4 Market reform to integrate energy storage _____________________________ 52
5.3 Meeting Karnataka’s flexibility needs from powerplants _____________________ 55
5.3.1 Hydro powerplants and flexibility_______________________________________ 57
5.3.3 Cost of meeting flexibility needs from power plants _____________________ 60
5.3.4 Barriers to flexibility from powerplants __________________________________ 61
5.3.5 Market reform: incentivizing and integrating flexibility from powerplants _ 63
6. Summary & Recommendations ________________________________________________ 65
Annex 1: Figures & tables __________________________________________________________ 68
Annex 2: Acronyms _______________________________________________________________ 70
Not for Distribution 3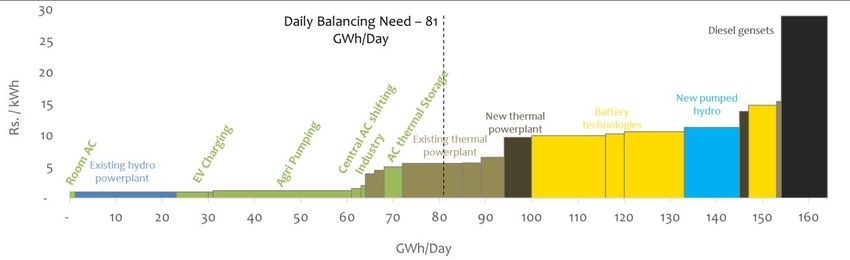
September 2020         Electricity market reform: Karnataka case study

Not for Distribution                                                     4
September 2020                                                    Electricity market reform: Karnataka case study

Executive summary
Karnataka is well placed to meet its energy needs over the next decade thanks to its rapid
deployment of renewables as part of India’s ambitious decarbonisation programme, which
aims to reduce emissions while meeting energy demand and supporting economic growth.
At the end of 2019, Karnataka’s solar capacity stood at 7.3GW, the highest of any state in India
and almost 22% of the total deployed in the country. Overall, the state accounts for 22%
(15GW) of India’s total installed capacity1. These achievements have helped put India on track
to meet its carbon reduction targets agreed under the Paris accord in 20152.
However, capacity additions alone will not be sufficient to develop an economically efficient
power system that reduces carbon emissions at low costs. Like the rest of the country and its
neighbouring state, Tamil Nadu, Karnataka is at a critical inflection point with respect to the
electricity market design and the structure of the electricity industry.
Previous analysis for the Energy Transitions Commission showed that for generic electricity
systems3, as well as for India when taken as a whole4, the total cost of a low carbon electricity
system would be lower than the cost of the current energy mix, including all system and
integration costs. However, this analysis also suggested that these benefits could only be
achieved if market mechanisms and other measures could increase the flexibility of both supply
and demand of electricity to adapt to changing demand patterns and the variability of
renewable energy supply.
This analysis also indicated the importance of local and regional differences in the demand
and supply for flexibility and the need to evaluate options and plans at state level to
understand fully the costs, potential, and issues that may arise. This case study is one of a series
of regional and national studies in India that addresses key elements of electricity market
reforms and technology development that are central to the ability of Karnataka, and India as
a whole, in meeting this challenge.
In this case study, we have:
     •    Assessed the cost, development, capital requirements and timing of potential flexibility
          options – including flexibility from demand, energy storage, and powerplant flexibility –
          through to 2030 across three main flexibility scenarios, Current Trajectory (CTS), Current
          Policy (CPS) and the High Renewables Scenario (HRE)
     •    Assessed the higher renewables scenarios (CPS, HRE) without any powerplant pipeline –
          ie, no additions of coal, gas or hydro powerplants beyond the existing operational
          capacity.
     •    Modelled the dispatch of Karnataka’s electricity system in 2030 using different
          generation capacity additions and different mixes of flexibility options to determine the
          impact of these mixes on cost, carbon emissions, excess energy that is wasted and
          potential load shedding
     •    Identified development needs, barriers and market mechanisms that could help
          Karnataka achieve the system benefits identified.

Although our analysis has found similarities with the India-wide cost and carbon benefits of
flexibility, the state’s flexibility needs are accelerating faster than the rest of the country due to
Karnataka’s peculiarities around fuel procurement for its coal powerplants, along with its

1 KPCL Annual report, 2019, SRPC; Annual report, 2019
2 India has three main NDCs: 40% of electricity to come from non-fossil fuel sources by 2030; to reduce the emissions intensity
of India’s gross domestic product (GDP) by 33-35% compared to 2005 levels by 2030; and to create carbon sinks of about 2.5-
3 billion tonnes.
3 Better Energy, Greater Prosperity, Energy Transitions Commission (2017) https://www.energy-

transitions.org/publications/better-energy-greater-prosperity/
4 ETC India report https://www.climatepolicyinitiative.org/wp-content/uploads/2020/08/CPI-India-flexibility-25-August-2020-full-

report-1.pdf

Not for Distribution                                                                                                          5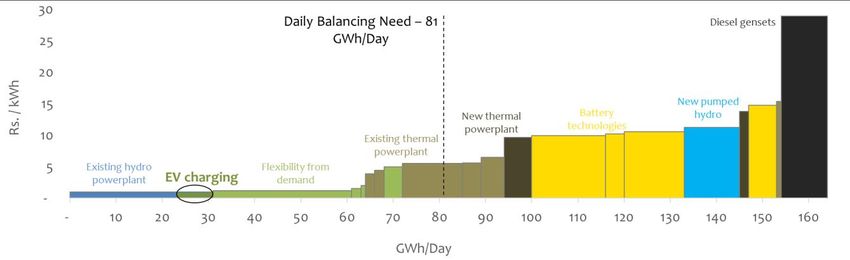
September 2020                                       Electricity market reform: Karnataka case study

leadership role if solar capacity deployment. In the absence of greater flexibility through
planning, ramping and daily shifting needs could start creating system constraints in the next
few years. By 2030, renewable energy generators could see curtailment of 15-20% of renewable
capacity in Karnataka, almost triple that of India’s average. Thermal generation in Karnataka is
already seeing strong variations, with monthly load factors below 40% for many state units, a
situation which is likely to deteriorate further adding stress to both coal powerplants as well as
the overall electricity system without the development and integration of flexibility resources,
including options for powerplants to provide flexibility services and recover relevant costs.
Four main findings have emerged from this work:
         1. Flexible energy markets reduce costs, the need for curtailment and emissions. If
            Karnataka were to have no access to interstate flexibility or power exchanges,
            increasing flexibility to its electricity system through markets and flexibility resource
            development and investment could reduce electricity costs by up to 10%, the need
            for curtailment (by reducing excess energy) by up to 85% and emissions by up to 35%
         2. A portfolio of flexibility options provides the most promise. Flexibility from demand is
            often the lowest cost of the three types of flexibility options, but a portfolio that also
            includes storage and additional powerplant flexibility provides greater certainty and
            additional carbon benefits.
         3. Interstate markets and transmission can provide additional value. Integration into an
            India-wide market could reduce system costs in Karnataka by a further 7%.
         4. Developing appropriate market mechanisms to encourage the development of
            flexibility options is critical.

Finding 1: Flexible energy markets reduce costs in Karnataka
We find that the development of flexibility from demand, energy storage, and flexible
generation from powerplants can reduce system costs even without access to interstate or
regional power markets.
In order to focus on the value, supply, and demand for flexibility in Karnataka, we began our
analysis by modelling the extreme case where Karnataka stands on its own, with limited
electricity transfers with neighbouring states and the rest of India. While this model forms one
extreme, the India model, which effectively assumes there are no transmission or market
limitations between states, forms the other. The likely outcome would be somewhere in
between.
Figure ES1 The impact of adding flexibility markets and options on electricity costs and carbon
emissions in Karnataka - 2030

Source: CPI analysis

Not for Distribution                                                                                   6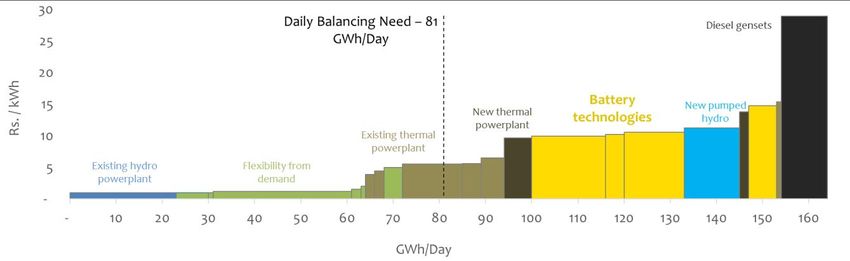
September 2020                                        Electricity market reform: Karnataka case study

For an isolated Karnataka system, we found that enhanced flexibility can reduce average
electricity costs by up to 10% and carbon emissions by up to 35%, as in figure ES1 on the
previous page.
Our analysis was based on estimates for the cost and potential of flexibility in Karnataka,
including that provided through greater participation of consumers in electricity markets, with
battery storage, and enhanced flexibility in the operation of powerplants.
We modelled the system with three different levels of renewable energy build out, one based
on the current trajectory, a second based on current policy, and a third, higher renewable
energy scenario. The current policy and higher renewable energy scenarios, when combined
with higher flexibility, made the addition of new thermal capacity redundant, without sacrificing
resource adequacy and reliability. Thus, even with the retirement of some of the oldest units at
the Raichur Thermal Power Stations (RTPS), Karnataka can eliminate the 1.6GW pipeline for the
expansion of the Udupi Thermal Power Plant.
Our analysis shows that, as for India as a whole, adding flexible resources reduces costs and
carbon emissions at any level of additional renewable energy supply, and thus should be
pursued under any scenario. Furthermore, the analysis shows that once greater flexibility is
achieved, even higher levels of renewable energy supply, and reduced carbon emissions, can
be achieved without increasing average electricity costs.

Finding 2: A portfolio of flexibility options provides the most promise.
We studied the potential and cost of three main sets of flexibility options:
    •    Flexibility from demand. Increasing the ability of agriculture, industrial, commercial and
         residential electricity consumers to adjust the timing of their electricity usage in response
         to price signals, to coincide with energy supply and thus reduce system costs.
    •    Energy storage. Using battery storage to shift energy supply from times of excess energy
         production to times of excess energy demand and meeting the ramping up of evening
         demand peak just as solar generation starts ramping down.
    •    Powerplant flexibility. Increasing the ability of thermal and hydroelectric powerplants to
         vary output in response to electricity supply and demand, and prices.
Our analysis covers many different needs for flexibility to balance an electricity system, from
short term reserves where near-instantaneous response is required to manage surges or dips in
electricity demand or supply, to ramping – the speed at which supply can increase to meet
rising demand, to the ability to shift demand from one season to another – for instance the
monsoon with high wind and hydro output to a season with higher demand. Figure ES2 on the
next page is a supply curve for daily balancing, that is, it ranks the lowest cost options to shift
surplus energy production over the course of one day by cost and output. The options to the
left of the chart are the lowest cost, with costs rising as more flexibility supply is needed.

Not for Distribution                                                                                     7
September 2020                                       Electricity market reform: Karnataka case study

Figure ES2 Daily balancing supply curve for Karnataka 2030

Source: CPI analysis
Figure ES2 shows how the costs of flexibility from demand, energy storage, thermal and hydro
powerplants would compare in 2030, including very significant expected reductions in energy
storage costs. Crucially, for an average day, all daily shifting could be met at the lowest cost
with a combination of the existing supply from powerplants, from new demand side measures,
and from storage flexibility from the two-way charging of electric vehicles (EVs). Other flexibility
needs have different patterns, with different mixes of demand, powerplants and storage
providing the lowest cost set of options.
Across all flexibility resources and flexibility needs, we found that flexibility from demand is
generally the least expensive resource, even factoring in additional costs for technology
upgrades, systems and processes. For Karnataka, our analysis focused on the potential for
flexibility from four key demand sources:
    •    Agriculture pumping represents over one-third of the demand in Karnataka and flexible
         operation of pumping provides a low-cost opportunity for flexibility, but one that requires
         completion of the current programme of separation of agricultural feeders or their
         solarization, new metering and pricing schemes and control systems.
    •    EV charging presents one of the cheapest forms of flexibility across many balancing
         needs, but access to this flexibility will require careful development of business models,
         charging infrastructure and incentives with real time pricing.
    •    Space cooling is a third option with a high potential for meeting reserves and ramping
         needs, given the rapid growth forecast for cooling demand, but one that requires
         especially designed incentives and metering to change behaviour
    •    Industry consumes a little under 20% of Karnataka’s electricity supply. Options to shift
         demand and provide flexibility are very dependent on industry segment and facility. We
         estimate that industrial flexibility potential is only a small proportion of the potential
         available from agriculture or EV charging for ramping reserves or daily flexibility.
         However, industrial demand provides an attractive opportunity for seasonal load shifting.
         By improving incentives to manage maintenance periods or production schedules,
         industrial load shifting can provide competitive paths to seasonal flexibility.
Our experience is that the response of consumers is unpredictable, so we have taken
conservative estimates of the potential from demand flexibility. Thus, we believe that our
estimate for potential is likely to be low. Nevertheless, a specifically designed programme
targeted at consumer behaviour change and that starts early could help achieve high levels of
demand flexibility.

Not for Distribution                                                                                   8
September 2020                                      Electricity market reform: Karnataka case study

Energy storage is the easiest of the three sets of options to visualize. Plug a battery into a
renewable heavy electricity system and, with the right price signals, the battery charges when
there is excess energy and discharges when the system needs more energy. At the right price, it
is very well suited to meet Karnataka’s growing flexibility needs that will be dominated by
ramping and daily shifting requirements. Battery storage is the least dependent on local
conditions out of all three options. While flexibility from demand depends on the mix of
consumers, their equipment and even the weather, powerplant flexibility depends on the
powerplants already in place. National factors such as equipment cost, and design dominate
storage flexibility options. Thus, many of our findings from the national analysis hold true.
Namely, that despite a 85% decrease in cost and improved performance since 2010, and an
anticipated further 65% decline in cost by 2030, batteries remain a high capital cost. However,
storage economics improve when batteries can be used across several flexibility needs, and
when battery applications are tailored to meet specific needs, such as wholesale market
flexibility, distribution investment deferral, industrial/commercial backup and power quality, or
EV charging.
The major local determinant of storage potential – beyond the use in different consumer modes
– is the residual load to be met, and the relative value and competition from dispatchable
powerplants and flexibility from demand. Energy storage also has a significant advantage that
unlike powerplants or demand, batteries do not need to overcome entrenched practices to
make storage useful.
Increased powerplant flexibility. Hydro and coal powerplants already provide the bulk of
Karnataka’s system flexibility. Unlike its neighbouring state of Tamil Nadu, all of Karnataka’s
plentiful hydro generation capacity (3.8GW) is available for flexibility. Its state-based coal-fired
plants already see monthly PLFs dipping below 40%, driven in equal parts by fuel costs and
availability challenges. With the right incentives, contract modifications, market signals, and in
some cases investment, there is potential to create and enhance sustainable flexible capacity.
For example, lowering the mandated technical minimum from 70% to national standards of 55%
could unlock 15% additional daily shifting capacity at little cost except the slightly lower
efficiency of operating at a lower output. By 2030, we estimate that powerplants can provide
up to 6GW of flexible capacity to the system; 1.6GW of which would require plant upgrades
and changes in the cost recovery mechanisms; 840MW of coal capacity would need to be
retrofitted for maximum flexibility, ie a technical minimum of 40%. Further flexibility could be
added by enabling two-shifting, the shutdown of powerplants during the renewable generation
hours, which requires study and investment. This potential is not included in our analysis.
The flexibility potential of older coal powerplants is in some cases limited by design and
operating practices as well as contractual constraints. For our analysis, we assume that the
oldest state plants only reduce their flexibility floor to 55%, while all other coal plants – state-
owned as well as contracted from the center and IPPs adjust to run at a technical minimum of
40%. Overall, we believe, coal powerplants have the potential to make significant contributions
to flexible capacity in the immediate term and as Karnataka builds out its renewable
infrastructure.
Increasing flexibility from the thermal fleet requires operational changes, retrofit and
modernization, the cost of which we include in our development of new flexibility options. Short-
term incentives are unlikely to be enough to encourage major retrofits or operating changes.
Rather, we believe that long-term contracts for additional capacity and contractual changes
will be needed to encourage significant increases in powerplant flexibility.
Building a portfolio of flexibility options. Flexibility from demand, energy storage and
powerplants each have advantages and disadvantages in terms of cost, potential, certainty,
and speed of development. Developing a portfolio of options thus enables mid-course
corrections to ensure that flexibility continues to develop as needed. Proper market signals – for
development, investment, and dispatch of the options once available – are essential in

Not for Distribution                                                                                  9
September 2020                                       Electricity market reform: Karnataka case study

encouraging the development of more options and for the dispatch of options once
developed.
To understand how each of these options would work together in optimized dispatch, with
efficient market incentives and pricing, we ran a model of the system with different portfolios of
flexibility options under a range of generation mixes. Figure ES3 shows the results of this
modelling and the impact of flexibility portfolios that rely predominantly on enhanced
powerplant flexibility, storage, demand flexibility, or a combination of all three to meet flexibility
needs. These models assess the impact on excess energy, average system electricity cost and
carbon dioxide emissions.
Figure ES3 Portfolio approach to flexibility delivers the highest optimisation on curtailment
reduction, CO2 emissions reductions and lower system costs

Source: CPI analysis
The results indicate that using a portfolio of options leads to the lowest cost solution, maximum
reduction in excess energy and carbon emissions. Furthermore, the portfolio will provide greater
security in development, as failures to meet flexibility from demand targets could be offset by
acceleration of powerplant flexibility or storage development.

Finding 3: Interstate markets and transmission can provide additional value.
While our analysis modelled one extreme of an isolated Karnataka system, the other extreme is
a completely integrated system with no transmission constraints and access to flexibility markets
– for both demand and supply – across India. The comparison suggests that strong transmission
links and broader markets could provide further benefits.
In particular, our analysis shows that costs for Karnataka could be a further 7% lower with
integration into an India wide market. Karnataka will need strong transmission linkages and
participation in regional and trading and exchanges to fully harness the benefit of its high
shares of renewables in its energy mix. Karnataka’s ability to transact flexibility would be value
accretive as well as significantly reduce the need for curtailment even under High RE scenarios.

Not for Distribution                                                                                   10
September 2020                                            Electricity market reform: Karnataka case study

Figure ES4 Interstate electricity trading could reduce system costs further – average electricity
cost per unit for a fully integrated India versus for an isolated Karnataka

               Average system cost for electricity supply in Karnataka and India – 2030

Source: CPI analysis
The reality lies somewhere in between, and we have also modelled a system with interstate
exchange levels similar to today’s levels. This analysis indicates that only a small portion of the
7% further benefit is achieved given today’s levels of integration, after all flexibility advantages
have been factored in.
Connectivity will also alleviate the pressure on Karnataka’s existing flexibility resources that
without action will be insufficient to meet the state flexibility needs from the middle of 2020s and
has the potential to add value to the state’s excess capacity from solar generation. A state
electricity system, well integrated with the rest of the national grid, under a HRE scenario also
eliminates the need for expensive and carbon-intensive back-up diesel generation, figure ES4
above.

Finding 4. Developing appropriate market mechanisms to encourage the development of
flexibility options is critical
In our report on electricity market development and flexibility options for India5, we set out a
series of actions that India should take related to electricity system market design to realize the
cost, reliability, and environmental advantages of increasing flexibility for the Indian electricity
system. These actions begin with developing comprehensive data to be used first in planning
and implementation decisions and then as the basis for developing and implementing pricing
systems. After data, we set out a series of actions around technology and infrastructure
development, incentives, business models and market design. Most of the requirements at the
India level are mirrored by needs in Karnataka, although differences in circumstances inevitably
lead to different emphasis and focus. In Figure ES5 we set out the issues and systems/incentives
that Karnataka should address in the short and long-term.
Taken together, these actions should put Karnataka on course for both a lower cost and
cleaner electricity system, but the state would also be well positioned as an important
participant and contributor to the development of improved operational resilience, reliability
and resource adequacy for India’s electricity system.

5 ETC India Flexibility report - https://www.climatepolicyinitiative.org/wp-content/uploads/2020/08/CPI-India-
flexibility-25-August-2020-full-report-1.pdf

Not for Distribution                                                                                             11
September 2020 Electricity market reform: Karnataka case study
Figure ES5 A market reform roadmap for developing a flexible, low carbon electricity system for Karnataka
Data Technology Infrastructure Awareness Business Models Incentives
Market Design
Develop, improve, Develop, deploy, cost Plan, finance, Build and drive Facilitate Provide and
Improve and integrate
disseminate reduction build behaviour development harmonize
Build awareness among Create expanded energy suppliers remit
India and KA will benefit KA could benefit from pilot KA needs to build Develop a long-term model
agriculture consumers re and build a competitive energy supplier
from a comprehensive programmes: out a for the Karnataka electricity
separate feeders vs industry
‘data mission’, focused on measurement and system design – potentially
• Agricultural pumping – feeder solarization of pumps under
regular and systematic energy Create and negotiate daily, ramping and working with national
separation vs solarization of KUSUM
data collection, and management seasonal flexibility contracts with industry players - that gives flexibility
pumps Building awareness among
maintaining databases on: system that resource developers
Flexibility from • Commercial space cooling – industrial customers of Create and negotiate contracts for daily
includes: confidence in the future
Demand • Demand by end-use automated access flexibility opportunities and shifting with commercial cooling load
demand for flexibility
• RE generation for each • Cold storage • Additional ways of accessing value
Develop, test, Pricing mechanism along with an incentive/ services
and roll out plant by 15-min block • EV charging models metering, Develop awareness among penalty for EV charging to encourage
• Powerplant capabilities, • Industrial flexibility including hourly
options space cooling consumers shifting of load from high demand periods to
costs and generation management – contracts vs and time of day
high generation periods Create transition markets
profile by 15-min blocks incentives metering Widespread information
that accelerate the
• Potential flexibility • Conduct dissemination on
development of flexibility
options and cost expanded pilot programmes with
options
programmes involvement of local
and Develop a influencers
This data would be smart metering
essential input into building Pilot programmes for battery system rollout for Build awareness among Explore developing, fostering, or
additional flexibility storage: some customer owners of standby (diesel incentivizing Karnataka storage
Storage capacity and evaluating groups and storage) of development/ manufacturing / operating
the value of options and • Substation/Grid • Develop opportunities to provide companies – as part of KPCL and BESCOM
Develop and programmes • Distribution system measurement, flexibility services as well as separate private developers
install • Backup/Diesel replacement settlement, and
• Ramping assistance pricing
• RE+ storage, especially small capabilities and
scale IT infrastructure
to support the Amend thermal powerplant contracts to
Pilot programmes to assess costs Capacity building across
Powerplants new systems of enable/ enhance potential offerings of
and potential for each category industry and practitioners –
market and flexibility and reward power plant owner/
of powerplants to: Facilitate better
Encourage incentives to operators for the value of services
understanding of
operation and • Lower minimum generation to support flexibility Implement a new seasonal capacity
opportunity to enhance
regulatory improve ramping and shifting and integration mechanism
system performance against
changes and • Two-shifting
impact on operating costs Shift existing coal to two-shifting and
investment • Seasonal operation of older
and plant reliability seasonal capacity
plant units
Transmission Karnataka should work with the national regulators to develop and improve interstate exchanges, transfers, and the related markets.
This work should include evaluation of options for ancillary service mechanisms.
Continue
KA should also be involved in national discussion on infrastructure build, transmission expansion, and development of pricing mechanisms such as financial transmission
expanding with rights and locational pricing.
flexibility needs KA may wish to begin developing state level locational markets to improve intrastate flexibility and reduce state level distribution and transmission costs & constraints.
Integration Karnataka will be one of the first states to experience significant issues with respect to flexibility, with certain challenges becoming apparent in the very near term and
therefore should be a leader in pulling together a complete package of programmes.
of options to KA should develop a comprehensive plan that includes incentives and markets for development of the options, alongside markets and infrastructure build-out that
minimize cost demonstrate a long-term commitment to increasing system flexibility and providing the mechanisms and incentives to optimize the integration of the options that
develop.
Not for Distribution 12September 2020 Electricity market reform: Karnataka case study
1. Introduction
Karnataka is a critical player in India’s target to install 175GW renewable capacity by 2022, and
a further target of 450GW by 2030. In July 2019, over 50% of Karnataka’s demand was met by
solar and wind generation on three consecutive days, when 43% of the installed (and
contracted) capacity came from renewable resources6. Capacity additions for generation will
continue to be a political focus to support the economic development of the services sector in
a state that has considerable agriculture demand.
Karnataka has a diverse portfolio of energy resources, with 9.5GW of existing thermal
generation capacity, 5GW state-owned, 4.3GW contracted from IPPs, NLC and NTPC7. Over
the last decade, the state has considered a number of coal, gas and hydro (including pumped
hydro) powerplants, but a number of these plants are stalled for environmental reasons, or
plans are still in the early stages. We share a summary of the status of these plants in Table 1.1.
Table 1.1 Overview of the powerplant pipeline and current status for Karnataka
Hydro projects Capacity (MW) Ownership Status
Stalled due to implementation of Yethnable drinking water
Gundia Phase II 200 State
scheme in the same catchment area
Shivasamudram RoR 200 State
Gangavali Stage II (Bedthi) 400 State
Pre-feasibility Report (PFR) prepared by KPCL. S&I delayed
due to local opposition
Kali Stage III 300 State
Aghanashini (Tadri) 600 State
Pumped Hydro projects Capacity (MW) Ownership Status
Kali 600 State PFR prepared by KPCL. S&I delayed by local opposition
Project approved by Dept of Forest, Karnataka, and
Sharavathy 2,000 State
NBWL, KPCL to start geotechnical investigation and survey
Varahi 1,500 State Survey and Investigation in progress
Coal-fired projects Capacity (MW) Ownership Status
RTPS Stage II - Edlapur 800 State
Gulbarga 1320 State No update since 2014
Kadechur - Yadagiri Phase I 1320 Private
PFR submitted, sought permission from MNRE, expected to
Udupi (Adani) Phase II 1600 Private
come online by 2022.
Gas-fired projects Capacity (MW) Ownership Status
Yehlanaka CCPP 370 State Expected CoD – 2021
All clearances are obtained including MoEF. EPC tender
Bidadi CCPP 700 State
stalled by court.
PFR prepared and action has been taken for obtaining
Tadadi CCPP 2100 State
statutory clearances.
Source: Annual report SRPC, KPCL
6 Clean Technica - https://cleantechnica.com/2019/07/22/solar-wind-met-over-50-of-an-indian-states-energy-demand-3-
days-this-month/
7 SRPC Annual report 2018-19
Not for Distribution 13September 2020 Electricity market reform: Karnataka case study
For our analysis, we have assumed that the 370MW Yehlanaka gas plant will reach COD by
end-2021 and the 1.6GW Phase II of the Udupi supercritical plant will reach COD by 2030.
Karnataka benefits from 3.8GW of hydro capacity, including pumped hydro, the majority of
which is available for grid balancing and flexibility services. Some 2.6GW of nuclear and
biomass provide mostly baseload power. The state has already met its 2022 solar target, with
7.04GW of installed solar capacity, over one-fifth of India’s total installations. Wind has seen a
steadier growth and the state is well placed to meet its 2022 target of 6.2GW8.
With the abundance of hydro for balancing capacity, Karnataka is able to integrate its
renewable capacity and balance its grid. Meanwhile, thermal plants have seen their load
factor fall during high renewable generation periods, driven in part by the high cost of coal
procurement for Karnataka’s coal plants (long distance to domestic coal mines, and imported
coal).
This paper is a continuation of our previous work for both the Energy Transitions Commission
(global) and ETC India, where we concluded that high levels of additional flexibility was
paramount in delivering lower system costs for a high renewable, low carbon electricity system.
This study follows from a similar one for Tamil Nadu, where we dug further to understand what
kind of market transitions and reform steps would be required to deliver and integrate the
state’s flexibility needs. We now look at the flexibility options for Karnataka, how much they cost
and what they will be worth to the overall development and operation of a low carbon system.
This paper then looks at how market reform can help the state access and efficiently integrate
this flexibility within its electricity system.
This paper is structured is structured as follows:
• Section 2 lays out the methodology we applied in our analysis
• Section 3 examines Karnataka’s flexibility needs
• Section 4 first summarises how the flexibility options for Karnataka come together into
portfolios and what it means for costs, need for curtailment and CO2 emissions. We then
take a deep dive into each of the flexibility options – the potential and cost of flexibility
options, what barriers exist to accessing their potential and the role of market reforms in
resolving these
• Section 5 is a transition roadmap for Karnataka, outlining what the state needs to do to
deliver these options; either by maximising the potential of available options now and
others that are necessary to plan for now to deliver by 2030.
8 KPCL, 2020 - http://karnatakapower.com/en/generation/
Not for Distribution 14September 2020 Electricity market reform: Karnataka case study
2. Framework & methodology
Our evaluation of the market reforms required to put Karnataka’s power system on a low-
carbon pathway is based on our work looking at India’s flexibility options and needs up to
20309, and uses a similar framework and methodology to our market reform case study for Tamil
Nadu10.
For Karnataka, the examination of flexibility needs and options are influenced by:
• High levels of solar, with less impact from the monsoon season;
• High electricity demand from agriculture;
• Relatively low levels of industrialisation;
• Overweight contribution from the state to India’s overall GDP;
• Lack of in-state coal sources.
Our findings are based on the cost, resource potential of various electricity system flexibility
options in Karnataka, and the barriers that exist in their development, including the integration
of these options within the context of the state as well as the country. The cost and resource
potential of flexibility depends on how demand and generation capabilities evolve. The barriers
to their development are more widespread, spanning regulatory, technical, commercial,
contractual, and behavioural drivers as well as lack of data and awareness. Our approach
assesses the impact of potential flexibility options against realistic scenarios to estimate the
value of flexibility, the priority options to be pursued as well as reforms to target these priorities.
The data for our models and analysis has been drawn from a combination of sources such as
tariff orders, annual reports, regulatory guidelines, and various reports published by CEA, KERC,
KPCL, SRPC and other electricity authorities in the state, with the generous contribution of
historic demand data by POSOCO and historic generation data from Vasudha Foundation.
To fully understand the need and scope for electricity market reform in Karnataka, we asked
the following questions:
1. Challenges. What are and will be in the future the most important challenges for the
electricity system in Karnataka? How and why are they different than at the national
level?
2. Technology options. What options can the technology/ business provide and what is the
local need / market for these services?
3. Cost. What is the cost of delivering these services?
4. Value. What is the value of these services, compared to other options?
5. Barriers. What are the barriers or market development needs for these options?
6. Market design implications. How do these options relate to market design and
development issues?
2.1 Renewable Energy Scenarios
For Karnataka, three different renewable energy scenarios have been considered.
• Current trajectory scenario (CTS) based on forecast of future renewable energy
deployment following Karnataka’s historical trends and growth rates.
9 ETC India flexibility report - https://www.climatepolicyinitiative.org/wp-content/uploads/2020/08/CPI-India-flexibility-25-
August-2020-full-report-1.pdf
10 Electricity Market reform – Tamil Nadu case study
Not for Distribution 15September 2020 Electricity market reform: Karnataka case study
• Current Policy Scenario (CPS) where Karnataka meets the state specific renewable
energy deployment target for 2022 set by the Ministry of New and Renewable Energy
(MNRE)11, and continues to further add renewable capacity at the same rate to 2030.
• High renewable energy (HRE) assumes that India accelerates renewable energy
deployment in line with increased climate mitigation objectives, ie, a national RE target
of 450GW by 2030 with state distribution of the new renewable energy capacity in the
same proportion as that in 2022 under the current policy scenario.
Figure 2.1 Renewable Energy Scenarios for Karnataka
Current Trajectory Scenario Current Policy Scenario High RE Scenario
60
50
Capacity (GW)
40
30
20
10
0
2017 2019 2022 2026 2030 2017 2022 2026 2030 2017 2022 2026 2030
Nuclear (as baseload) Biomass Hydro Wind Utility PV Rooftop PV Thermal Gas Thermal Coal
Source: KPCL, CPI analysis
In each of the scenarios, Karnataka’s nuclear capacity doubles in 2026, with another 700MW
unit added at Kaiga. Hydro capacity is assumed to be constant across the decade. We
assume 370MW of Yehlanka gas-fired capacity will be added in the near term and the 1.6GW
Phase II expansion of the Udupi supercritical plant will reach COD by 2030. For the CPS and HRE
scenarios, we have considered additional scenarios, eliminating the 1.6GW of coal pipeline.
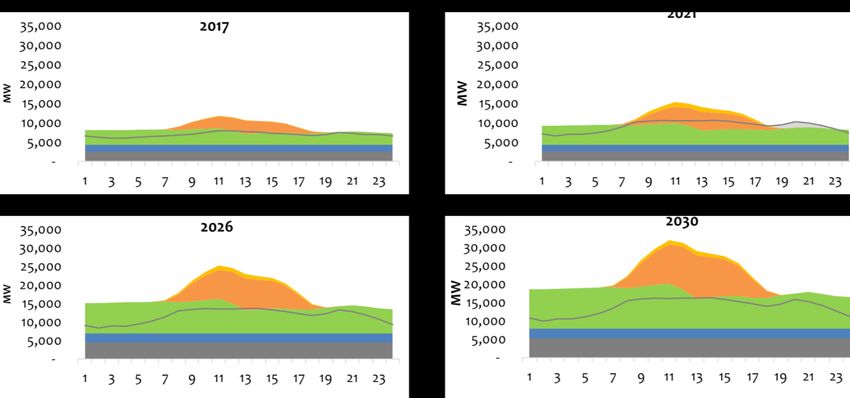
2.2 Assessment of flexibility needs
For each of the three renewable energy scenarios, we assess the development of different
flexibility needs between 2017 and 2030. The demand profile for 2017-18 was received from
POSOCO. The demand profile for 2030-31 was based on the 2013-1412 load profile, also
received from POSOCO, scaled to match 19th EPS estimated energy requirement and load
factor (2026-27 projected forward to 2030-31) at the same rate as historical CAGR.
The assessment is based on the analysis of Karnataka’s load shape in a typical year and how it
will be affected by changing usage patterns, analysis of system modelling, and application of
local system operation guidelines. The flexibility requirements we have assessed include:
• Short-term reserves to meet sudden, unexpected changes in either supply or demand
due to errors in scheduling, forecasting or forced outages.
• Ramping requirements where the limiting factor is not how much energy can be
provided, but how fast the system can react to increasing (or decreasing) demand or
decreasing supply (for example from solar PV) over a period of 15 minutes to three hours.
11 As of 2018, Karnataka had already met its 2022 solar energy target of 7.04GW
12 2013-14 to align with the base year chosen by NREL for wind and solar production profile projection.
Not for Distribution 16September 2020 Electricity market reform: Karnataka case study
• Daily balancing to match excess production with higher demand at a different time in a
24-hour period. It analyzes the mismatch between the peaks and troughs of the
demand curve against generation and the need to shift demand or generation
resources to match the two.
• Seasonal balancing matches seasonal variation in generation patterns and demand
and the flexibility to shift supply or demand across seasons and the year to maintain the
required match of supply and demand across the year.
Due to the high proportion of solar PV, Karnataka requires special attention to its growing
ramping and daily balancing needs, as production varies dramatically between sunrise and
sunset, and the state’s electricity system will require other resources to smooth out the drop in
supply from solar at the end of the day. Currently, hydro plays a significant role in daily
balancing.
2.3 Assessment of flexibility options
As a next step we looked at the potential and cost of flexibility options within three main
categories:
• Flexibility from demand. The lowest cost opportunity, and the greatest uncertainty is the
amount of flexibility that Karnataka can harness from demand. The lack of
comprehensive end-use data on energy consumed, load patterns, price sensitivity,
customer attitudes and other data needs prevents a complete analysis of demand
potential. We have focused on developing preliminary estimates, that can help
determine the role and potential importance of demand side flexibility, focusing on a
sub-set of end-uses, agriculture pumping, EV charging, space cooling (commercial and
domestic) and industrial demand. Capacities and growth have been calculated based
on existing capacities, market data, current and projected growth. For each of the end
uses, we estimate potential and use these as proxies to identify potential barriers and
how market reform can remove these barriers and facilitate implementation.
• Storage. Batteries and other storage options can provide most of the flexibility service,
but the cost of doing so is highly dependent on the capital cost of the battery systems
(including balance of systems, EPC and operation costs), the full cycle efficiency and
how long batteries last. In Karnataka, we found that apart from grid-level, behind the
meter and co-location with utility scale solar projects, the state’s focus on distributed
solar creates opportunities to evaluate the feasibility and value of storage that is co-
located with distributed solar agriculture pumps and rooftop systems.
• Powerplant flexibility. Most flexibility today is provided by Karnataka’s 3.8GW hydro
capacity and 5.2GW of state coal-fired generation. These plants are capable of
delivering all types of flexibility. Although there are limits and costs associated with these
resources. Operating thermal plants flexibly reduces plant efficiency, increases fuel costs
and can increase operating costs, not all of it recoverable under standard contracts.
Karnataka faces the additional challenge of high fuel costs for its coal-fired plants. To
provide reserve, extra plant capacity needs to be built and kept online, again increasing
costs. We compare these costs for each type of flexibility using incremental costs to
deliver the service. Additionally, we have found that most plants on the Indian system,
including Karnataka, can deliver more flexibility than they currently offer. Even without
modification, experts suggest that the plants can offer more flexibility by changing
operational practices. Retrofit investments can also significantly increase the amount of
flexibility each plant can offer. We incorporated feedback from Siemens’ studies on coal
plants in India and feedback from the operations team at NTPC to evaluate the cost
and potential of retrofits and to include those options in our system modelling.
Not for Distribution 17September 2020 Electricity market reform: Karnataka case study We have focused here on identifying important categories of flexibility options rather than an exhaustive assessment of all resources for flexibility available to the state. As Karnataka develops market incentives and with proper market design, more flexibility options could develop, particularly more flexibility from demand. Hence, the analysis and benefits from flexibility are conservative, provided Karnataka can implement the programmes and market reform needed to develop the flexibility options. 2.4 Power system modelling and integrated portfolios Supply curves With the demand for flexibility established and a potential supply and cost for each of the flexibility needs, we are then in a position to model how these various flexibility options would work together in meeting India’s electricity supply needs. To understand which options will be used, we put together a series of supply curves for each flexibility need, mapping the cost competitiveness of each flexibility option in providing each flexibility need, as shown later in section 4. Power system models Using our supply curves and forecasts for annual hourly load shapes for Karnataka, we evaluate the "dispatch” of different sets of flexibility options to meet various flexibility needs of the system. The aim is to both assess the cost of integrating various levels of renewable energy into the system, as well as to evaluate how the availability of different supply side options affects cost and overall dispatch. CPI Energy Finance has built its own power system model to understand the costs and dispatch of the Karnataka system for each of the three energy mixes and flexibility mixes, starting with a base case limited to existing flexibility resources, portfolios predominantly relying on procuring flexibility from demand, storage, powerplants, and a combined portfolio incorporating all flexibility options. More information on portfolios and their impacts on system costs and dispatch is shared in section 4. Figure 2.2 Integrating assumptions into a power system model Not for Distribution 18
September 2020                                          Electricity market reform: Karnataka case study

While these are not complete system optimisation models, these models should provide results
that are accurate within the constraints of the assumptions around load, costs, resource
potential, renewable energy supply, weather conditions and so forth for 2030. Our model fits the
various assumptions together in one model as depicted in the figure 2.2.

2.5       Barriers
There are considerable barriers to the development of flexibility resources and their adoption
and integration. Barriers impact each of the potential resources differently but emanate from
overlapping factors.
      •   Data. Lack of end use data makes it difficult to understand which consumers can shift
          their demand at reasonable cost, and which incentives will be most effective. Data
          gaps for individual powerplants makes it difficult to assess their flexibility potential, costs
          and trade-offs.
      •   Technology. With more flexibility options, metering, measurement, communication and
          settlement systems will be integral to monitoring, control, dispatch, incentives and
          planning. For example, to reduce the costs of storage and to create storage solutions
          specific to segmental needs.
      •   Infrastructure. Investment and planning are required to develop infrastructure, such as
          transmission to deliver flexibility where it is needed, when it is needed, or the IT and
          metering systems to schedule and integrate flexibility.
      •   Awareness and behaviour. Before any action can be taken, consumers and generators
          need to be aware of the opportunities for flexibility. Beyond that, programmes need to
          help change entrenched practices that have developed over many years.
      •   Business models. Developing new business models can have a very important role in
          reducing the costs of flexibility options and making growth and scale more accessible,
          enabling investors, consumers and other to monetize and benefit.
      •   Incentives. Incentives and markets need to operate at two levels, dispatch and
          optimisation as well as investment to align flexibility providers with system needs.

Current systems, operational practices and barriers for different technologies and options have
been analysed using secondary research as well as stakeholder engagement within and
outside Karnataka. These engagements helped us understand the institutional readiness to
adapt to market reforms and the trade-offs in the context of Karnataka. For our
recommendations, we also looked at successful international frameworks and projects, eg,
case studies and interviews on battery storage systems across the the US and Australia by our
team at Stanford University.

2.6       Role of market reforms
Karnataka can pursue ambitious renewable energy targets, but concerted action on barriers is
essential. Our analysis has shown that flexibility reduces system costs and makes integrating
clean energy cheaper. Thus, increasing flexibility is a no-regrets step for Karnataka. While
developing more flexibility should be addressed urgently to reduce costs and improve the
quality of electricity supply, the pathway is not as straightforward. Karnataka needs to develop
new data and information, technology, behaviour, and market designs to develop flexibility
efficiently and cost effectively.
A number of the current market structures, policy framework, business models and incentives
are designed to support old supply and demand models for electricity. Transitioning to new
behaviours, new market models and incentivizing the evolution of operational and financing
models will require not just the creation of new pathways (eg, markets can find the right price

Not for Distribution                                                                                      19
September 2020 Electricity market reform: Karnataka case study for ancillary and balancing services, real-time markets, market aggregators and deployment of control and measurement infrastructure can facilitate demand side flexibility) but also the assessment of approaches to integrate flexibility and flexible operation within the scope of existing contracts and arrangements (eg, the adjustment of existing thermal generation contracts to compensate for the cost of flexible operations). We evaluated a range of different market mechanisms (figure 2.3) for Karnataka to assess their application and effectiveness to remove barriers and integrate priority flexibility options. On the basis of this analysis, we put forward our recommendations in Section 6 for market reform and a transition roadmap for Karnataka. Figure 2.3 Range of market mechanisms to develop and integrate flexibility options into Karnataka’s electricity system Source: CPI analysis Not for Distribution 20
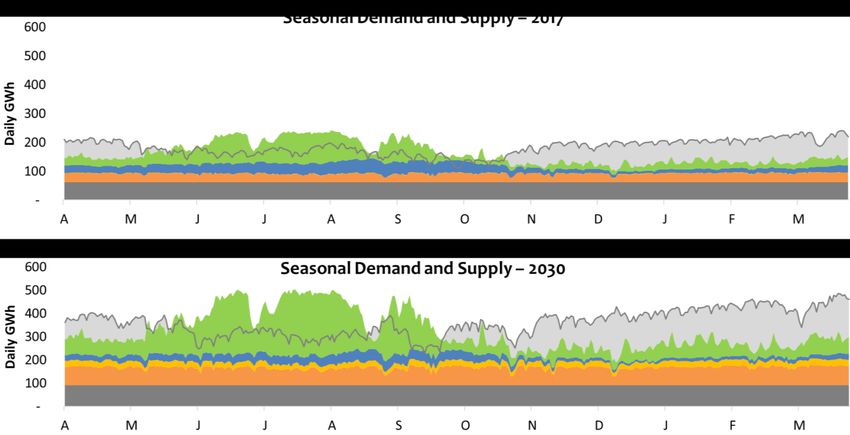
September 2020                                               Electricity market reform: Karnataka case study

3.       Karnataka’s flexibility needs and challenges
Karnataka is the fourth largest economy in India, with agriculture, manufacturing and services
contributing 10%, 26% and 64% respectively to the state’s economy. Heavy industry is under-
represented in the state, but Karnataka has the second largest though as yet unmodernised
textile industry and a burgeoning services sector, fuelled by its incentives to attract the IT
industry, which is expected to grow c.8% in 2020-2113.
On the demand side, agriculture is the largest electricity consumer in Karnataka (38%), ahead
of residential (22%) and industrial (19%). The overall growth in demand for Karnataka remains
low at a CAGR of 3.5%, driven largely by the residential and agriculture sectors, each growing
at c.8% over the last 5 years.14
Karnataka operates a diversified energy portfolio, with an increasing share of renewables. As of
December 2019, the state had installed 14GW of renewable capacity excluding hydro – 7.2GW
solar, 4.8GW wind and 1.9GW biomass. Thermal (coal and lignite) contributed a third of the
installed capacity at 9.5GW.15
Solar and wind generation assets are largely owned by independent power producers (IPPs),
Hydro is mostly owned by the state and coal capacity is split between state and inter-state
generating stations. Karnataka’s coal plants are heavily dependent on far-lying mines mines,
from 250km to 1,200km away and imported coal, which serves around 23% of the generating
assets, adding significant costs and uncertainty to its supply. Karnataka’s thermal fleet runs at
low average PLFs, a result of uncertain supply and high fuel costs for thermal powerplants and
and cheaper renewable generation. Despite surplus energy in the system, Karnataka imported
7TWh of electricity in 2017-18. By 2027-2816, this could mean that an additional 49TWh of in-state
generation could be needed to avoid such imports.
In the absence of additional flexibility and the accompanying market reform to facilitate and
integrate flexible resources, Karnataka could face high system costs and lower reliability
because of the curtailment of must-run renewables, compensation for expensive thermal
generation for capacity not called and, in spite of excess energy, costly purchases from the
exchange during peak periods.
Figure 3.1 Growth in Karnataka’s flexibility needs 2017 – 2030

Source: CPI analysis

13 Citation for https://www.prsindia.org/parliamenttrack/budgets/karnataka-budget-analysis-2020-21
14 Annual report, SRPC, 2014-19
15 Karnataka Power Corporation Limited
16 Citation for www.thehindu.com/news/national/karnataka/coal-crunch-hits-thermal-power-generation/article20557326.ece

Not for Distribution                                                                                                21
You can also read


