Do men and women benefit differently from the productive use of energy? Evidence from the Brong Ahafo region in Ghana
←
→
Page content transcription
If your browser does not render page correctly, please read the page content below
Do men and women benefit differently from the productive
 use of energy? Evidence from the Brong Ahafo region in
                         Ghana
Ana Pueyo (ECREEE and IDS), Simon Bawakyillenuo (ISSER) and Marco Carreras (University of
Sussex)

Abstract

Productive uses and gender mainstreaming are two priorities of Ghana´s energy policy, but they have
not been addressed jointly. This paper provides new evidence about how men and women use energy
productively in urban areas within the Brong Ahafo region, which display high electrification access
rates and significant levels of women empowerment. Three research questions are posed: 1. What is
the differential benefit of the productive use of energy (PUE) for men and women? 2. What explains
the differences? And 3. Which interventions can successfully address the constraints that men and
women face to benefit from the PUE? A multi‐methods approach combining quantitative and
qualitative analysis is applied to provide answers. In the three towns surveyed, men and women‐led
enterprises display similar levels of energy consumption and intensity, but men dominate the use of
electricity, whereas women dominate cooking fuels. Women´s businesses are smaller and operate in
a narrow subset of sectors, while men´s businesses are more capitalised and operate along a wider
set of activities. The promotion of Light Industrial Zones with improved electricity supply in the region
has clearly benefitted men over women, but women have benefitted from other policies and overall
do not display worse performance than male businesses located in LIZ. Education and exposure to
role models have eroded to some extent gender norms determining the kinds of activities that men
and women can aspire to at home and at work. Still, many deep‐rooted preconceptions prevail. Two
types of recommendations are made to further improve gender equality in the productive use of
energy: first target the specific needs of men and women in their current roles through for example,
finance, energy management education, higher power reliability, equipment and affordable tariffs.
Second, support further transformation of gender roles with education, exposure to role models and
associations to scale up.

Keywords: productive uses of energy, gender, Ghana

1    INTRODUCTION
Ghana has walked giant steps to provide universal access to energy, and particularly electricity. The
latest statistics show that 84% of the Ghanaian population have a power connection (IEA, 2018),
making Ghana one among 8 Sub‐Saharan African (SSA) countries with access rates above 80% (IEA‐
OECD, 2018). These figures are tainted, nevertheless, by low consumption levels and poor reliability.
Electricity consumption per capita is well below the SSA average and the average for Lower Middle‐
Income countries, Ghana´s income group according to World Bank’s classification (Pueyo, 2018).
Furthermore, chronic unreliability causes significant losses for local firms. As a result, more than 50%
of them need to resort to a generator to guarantee their supply (World Bank, 2013).

On one hand, low power consumption figures are a symptom of low productive uses in Ghana. On the
other hand, poor quality of electricity supply is considered the second most important constraint to
business activities in the country, after access to finance (World Bank, 2013a). Whether good
electricity supply causes economic growth, or instead economic growth causes good electricity supply
is an issue that remains unresolved in the literature ((Best & Burke, 2018; Paul & Bhattacharya, 2004).
What is clear is that low productive uses damage the financial sustainability of electrification

                                                   1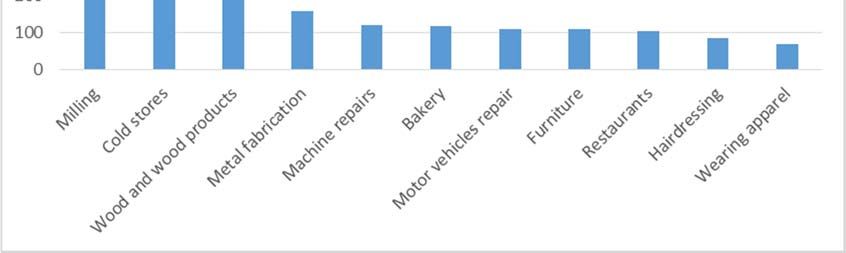
programmes. The poor state of the Ghanaian electricity utility is in part a consequence of the low
commercial and industrial demand in rural areas (Pueyo, 2018). This is in spite of the widespread use
of generators in the country, which points at a large latent demand for grid electricity. Productive uses
of energy and improved reliability have therefore become two distinctive priorities of Ghana’s energy
strategy (MoE, 2010; Energy Commission, 2010).

The Program for Sustainable Economic Development (PSED), presented by the Ghanaian Ministry of
Trade and Industry and implemented by GIZ, is one of the interventions aiming at increasing
productive uses of energy in the country. The program combined the provision of electricity,
improvement of other infrastructures, business and environmental management training and
clustering of enterprises in light industrial zones (LIZ). The improved access to electricity jointly with
other interventions was expected to increase productivity by facilitating the use of appliances. With
this aim, the programme supported a total of 15 LIZ in five regions of Ghana between 2006 and 2014.
In order to check if expected impacts were fulfilled, the program went through two separate impact
evaluations. The first, found that electricity supply had not had the expected positive impact on
profits. Instead, industrial zones had created a destructive competition, damaging the performance of
existing firms (GIZ‐RWI, 2011). The second found no significant difference in profits between firms
connected and not connected to electricity, with the result being robust across different methods
(Peters, Sievert and Vance, 2013). While these evaluations faced some shortcomings, such as small
samples and the impossibility to find a credible counterfactual, the results backed previous research
showing that electricity is a necessary, but not sufficient input for economic growth (Pueyo &
DeMartino, 2018). But, following a tradition of “gender blindness” in energy planning (Clancy, Ummar,
Shakya and Kelkar, 2007), both evaluations missed the gender dimension of the intervention.

Taking gender into account for the design and implementation of productive uses of energy (PUE)
interventions is important because there is gender division of labour, and different activities have
different energy consumption patterns (Clancy et al, 2007). Consequently, PUE interventions that do
not take into account gender differences could be biased towards male dominated activities, as these
are typically more visible (formalised), more productive, and larger than female activities (Addati,
Bonnet, Ernst, Merola, & Wan, 2016b; Campos, Goldstein, McGorman, Boudet, & Obert, 2015;
Morton, 2013; De Haan, 2016; Cirera & Qasim, 2014). Furthermore, due to their low participation in
the energy sector, and to their heavy reliance on biomass and human physical energy for daily tasks,
women’s needs often go unnoticed for electricity planners and suppliers (Clancy, Ummar, Shakya, &
Kelkar, 2007; Winther, 2012).

Lack of gender‐disaggregated data is partly behind the lack of interest on gender equity among energy
policymakers (Skutsch, 2005). To address this gap, this paper revisits the LIZ experience in Ghana, this
time around with an emphasis on gender disaggregated data. Three research questions are addressed:
1. What is the differential benefit of the PUE for men and women? 2. What explains the differences?
And 3. Which interventions can successfully address the constraints that men and women face to
benefit as much as men?

The empirical strategy consists of a multi‐methods approach, combining quantitative and qualitative
methods. Quantitative tools include enterprise questionnaires administered to 400 enterprises (63%
male owned and 37% female owned). Randomisation of electricity provision or LIZ location was not
possible, as it took place more than a decade ago. Thus, the quantitative analysis consists of
differences in means in energy consumption and business performance between men and women
enterprises, and OLS regressions to identify the most significant variables that explain performance
differences. Qualitative data are used to complement and enrich the quantitative findings, providing
the all‐important context in which gender norms manifest themselves. Qualitative methods include

                                                    2
Semi‐structured interviews (SSI) with 40 men and women workers and entrepreneurs, Key Informant
Interviews (KKI) to 10 informants, and Focus Group Discussions (FGD) gathering 80 participants.
The paper is structured as follows: The second section provides the background about gender, energy
and employment in Ghana, and describes PUE interventions in our target communities. The third
section explains the methodology. The fourth section shows results for each research question. The
discussion provides policy recommendations drawing from the results and the final section concludes.
2 GENDER AND PRODUCTIVE USES OF ENERGY IN GHANA
2.1 Ghana’s policy framework for energy, productive uses and gender
The energy policy landscape of Ghana is laden with various policies stretching over the past three
decades. The first major energy policy framework of Ghana was undertaken in 1990 by the then
National Energy Board (NEB) geared towards energy development in Ghana (ISSER, 2012). The NEB
established five key departments (petroleum planning, electricity planning, renewable energy
programmes, energy conservation programmes and energy information) (ISSER, 2012, citing
Edjekumhene et al., 2001). In succession, the following policies and programmes have been
fundamental in the development of Ghana’s energy sector within the past three decades: The National
Electrification Scheme (NES) (1990); Energy Sector Development Programme (1996‐2000); Energy
for Poverty Alleviation and Economic Growth: Policy Framework, Programmes and Projects
(2001‐2009); Strategic National Energy Plan (SNEP) (2006‐2020); National Energy Policy (NEP)
(2010); Ghana Renewable Energy Policy (2009‐2020); Sustainable Energy For All (SE4ALL) Action
Agenda of Ghana (2015).
The main goal of the National Electrification Scheme (NES), which came into effect in 1990, was to
extend electricity to all parts of the country by 2020. The Energy for poverty Alleviation and
Economic Growth programme aimed at developing an energy economy that would ensure a
reliable supply of high‐quality energy services for all Ghanaian homes, businesses, industries,
transport as well as exports. The Strategic National Energy Plan (SNEP) (2006) was developed
with the goal of creating a sound energy market that would provide sufficient, viable and
efficient energy services for Ghana’s economic development. Similarly, the National Energy Policy’s
(2010) main goal was to develop an energy economy that would guarantee secure and reliable supply
of high quality energy services for all sectors of the economy and also contribute to export earnings.
The Renewable Energy Act 2011, Act 832 provided the necessary legislative support and framework
to boost renewable energy’s share in the energy mix. The SE4ALL Action Agenda of Ghana (2015)
provided the roadmap for the attainment of the three global 2030 energy objectives.
Strongly embedded within the identified past and present energy policies and programmes have been
the overarching goals of enhancing energy accessibility as well as the productive uses of energy. Thus,
these policies share lots of similar goals and objectives. Additionally, the National Energy Policy (2010)
and the SE4ALL Action Agenda of Ghana (2015) do not only cover the accessibility and productive uses
of energy, but also gender issues. These mainly relate to the promotion of modern forms of energy in
households to minimize the adverse health effects of the use of wood fuels on women; provisions for
ensuring the participation of women in the formulation and implementation of energy interventions;
and provisions for building the capacity of women in the energy sector.
The policy, regulatory and institutional framework related to gender mainstreaming in the energy
sector is growing in the ECOWAS region. Increasingly, a number of Member States have referred to
gender equality in their energy policy documents; have established gender focal units within public
sector energy agencies; and have conducted gender audits of energy agencies (ECREEE and NREL,
2015). Key energy policies within the ECOWAS region recognise the gender gap in energy access and
3the need to empower women to make productive use of modern energy sources. The 2006 ECOWAS
White Paper on a Regional Policy for Increasing Access to Energy Services in Peri‐urban and Rural Areas
specifically mandates member states to prioritise women’s energy needs at the household level. Also,
the ECOWAS Renewable Energy Policy (EREP), highlights the need for the creation of opportunities for
women to have access to modern sources of energy in a bid to maximise their economic potentials as
well as the need to enhance clean energy sources for cooking. Similar to the (EREP), the ECOWAS
Energy Efficiency Policy (EEEP) recognises that efficient and clean energy sources are sine qua non to
bridge the gender gap. It enjoins member states to implement policies that will build the capacity of
women as well as get them to actively participate in the energy sector. Building on these, the ECOWAS
White Paper for a Regional Policy and the Bioenergy Policy both mandate member states to ensure
substantive women participation in the energy decision‐making process at all levels.
These policy guidelines have shaped various programmes and projects that seek to empower women
to access modern energy sources. The ECOWAS Women’s Business Fund, for instance, has supported
women groups to access clean energy source (mainly LPG) in Ghana and Senegal. Similarly, the
ECOWAS Programme on Gender Mainstreaming in Energy Access (ECOW‐GEN) and The West African
Clean Cooking Alliance (WACCA) have supported gender‐sensitive policy development, and have
enhanced capacity of women to engage in awareness creation on clean cooking initiatives.
The ECOWAS regional level policy frameworks have also shaped various national levels’ policy options.
In Ghana for instance, the 2015 National Gender Policy identifies gendered energy inequality as a
critical issue in society that needs to be addressed. The policy therefore envisions to promote
sustainable energy sources particularly, for women at the household level. It, however, does not
outline how the identified gaps will be closed and also failed to show the nature and extent of
gendered energy inequality. More importantly for the topic of this paper, it does not address
specifically gender issues in the PUE, failing to bridge the gap between these two important
dimensions of Ghana’s energy policy.
2.2 The case of energy supply for LIZ in Brong Ahafo Region
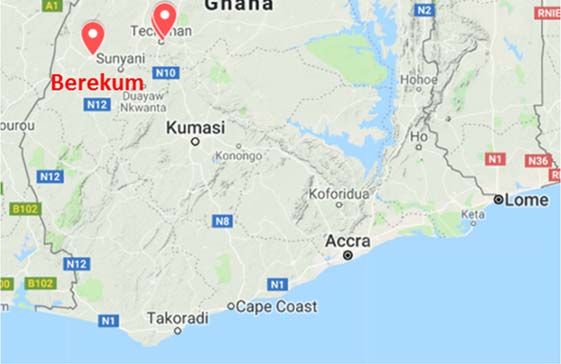
Within Ghana, this research looks at PUE and gender in three towns in the Brong Ahafo Region. The
region was selected because it had been targeted by PUE interventions implemented by Deutsche
Gesellschaft für Internationale Zusammenarbeit (GIZ). A partnership between GIZ and the researchers,
facilitated fieldwork logistics and access to key informants. Techiman, Tuobodom (which until recently
was part of Techiman, but was recently established as a new municipality) and Berekum were the
towns selected for fieldwork, due to their large size in comparison to other towns where LIZ had been
implemented, and their proximity to each other, allowing for faster transfer of enumerators.
Brong Ahafo is a transition zone between the relatively poorer Northern regions and the more densely
populated and wealthier central and coastal regions, where economic hubs of Kumasi and Accra are
situated (Peters, Sievert and Vance, 2013). Agriculture is the most important source of income, with
commercial crops like maize, yams, cassava, plantain or cocoa. The non‐agriculture sector is
dominated by trading and the surveyed towns have large markets operating at least once a week.
Techiman in particular has one of the biggest markets in West Africa. Manufacturing activities include
palm oil production; grain milling, woodworks, nuts roasting, tailoring, shoemaking, welding, and car
repair and maintenance services which prevail in the region. Figure 1 shows the location of the
fieldwork sites, in Mid‐Western Ghana.
4Figure 1‐ Location of Techiman and Berekum
Source: Google maps
Techiman‐Tuobodom and Berekum were targeted by the Industrial Zone Development component of
the Programme for Sustainable Economic Development, implemented by GIZ from 2007. The
promotion of LIZ aimed at expanding Ghana’s economic growth beyond the capital and the major
cities of the South. Some of the challenges faced by SMEs in the targeted areas were: unsecure land
tenure, which decreased willingness to invest; missing access to infrastructure like electricity and
roads; unregulated business causing environmental degradation; and road congestion in the town
centre. The project provided entrepreneurs with land and business capabilities and served industrial
zones with improved infrastructure, such as grid extension, road access, water supply and sanitary
facilities, as well as business development services to the enterprises and technical assistance to the
district government. The three main actors that participated in project implementation, and their key
roles are:
• Local Governments and Business Associations: identified and acquired land; prepared the land
for infrastructure; provided access to roads, drains, water supply and latrines, and paid labor
costs for electricity hardware installations.
• GIZ: Advised on planning, design, implementation and management of the sites; supported
local economic development processes and sets up dialogue platforms; procured and
delivered the electricity hardware; supported management and environmental training.
• Utilities: provided technical assistance for network design, cost estimates and installation.
5LIZ in Techiman, Tuobodom and Berekum clustered automotive maintenance and related industries
and are managed by garages associations. However, since their creation, many other supporting
businesses have joined such as restaurants, shops and barbers. Figure 2 shows the number of
businesses, per sector of operation, jointly for all LIZ analysed as of the December 2016. Car mechanics
are the most frequent trade, followed by autobody and share of spare parts.
Figure 2‐ Number of business per sector of operation in Techiman and Berekum LIZs as of December 2016
Source: authors, from GIZ monitoring data
Table 1 shows the main characteristics of the two towns and their LIZ. In this research, within
Techiman municipality we also include Tuobodom, because this new municipality was created by
introducing a new border in what used to be Techiman after the time of the LIZ intervention. Even if
Techiman municipality is larger, Berekum’s LIZ hosts more enterprises.
Table 1‐ Key characteristics of Techiman, Berekum and their industrial zones.
Techiman‐Tuobodom Berekum
Population of municipality 206,856 129,628
Area of municipality (km2) 669.7 955
Date of grid connection 1990 1990
Implementation of LIZ 2007 2007
Number of plots in LIZ 525 400
Date of electricity connection to LIZ 2007 2008
Number of enterprises at the site 160 477
(December 2016)
Number of workers at the site 974 2450
Number of women‐led enterprises 11 (7% of total) 72 (15% of total)
Number of enterprises connected to 73 (46%) 200 (42%)
electricity
Source: Field survey, 2018
Gender data included in the previous table was extracted from GIZ’s monitoring records. Women’s
participation is very small, with just 7% of the total enterprises in Techiman and 15% in Berekum. As
6illustrated in Figure 3, food vending is the most common female activity, followed by the sale of spare
parts.
Figure 3‐ Female owned businesses in Techiman and Berekum LIZ, per sector of occupation
Source: authors, from GIZ monitoring data
GIZ’s rationale for the support of LIZ was that a service package including infrastructure, training,
access to microfinance and clustering of enterprises, to take advantage of agglomeration effects,
would be more effective than providing these services individually. Electricity in particular would
improve business productivity, allowing the use of new equipment (Peters et al, 2013). However, two
impact evaluations carried in 2011 and 2013 did not show these positive results.
The first impact evaluation assessed the impact of LIZs on firms’ performance and energy usage. It
included enterprises within LIZ in Techiman, Berekum and Goaso‐Min involved in manufacturing
(welding and carpentry) and car repair (car body, upholstery, electricians, other metal work, and
mechanics). A before‐after comparison was used as counterfactual. Findings showed that access to
land was the main reason why companies had relocated to LIZ, with access to electricity being just a
secondary reason. There were encouraging signs of investment picking up, as 44% of firms with access
to electricity purchased new equipment after relocation, and increased their credit uptake. However,
monthly profits and customers per week decreased, due to increased competition among clustered
enterprises. Therefore, the LIZ had not led to positive impacts for companies, even if they had
benefitted from land and services (Peters, Sievert and Strupat, 2012).
The second impact evaluation extended the scope to include enterprises both in and out of LIZ in
Techiman, Berekum, Goaso Min and Nkoranza; and across a wider set of sectors, including services
(hairdressing, communications, electrical services, mechanics, and restaurants) and manufacturing
(dressmaking, tailoring, metal works, and carpentry). It described energy use patterns in the firms and
analysed the impact of electricity use on firm performance. The counterfactual were firms not
connected to electricity. No significant effect of electricity on firm performance was found, showing
that electricity does not increase income by all means.
This paper does not seek to replicate previous evaluations, but to extend the scope by providing
gender disaggregated data, and using a diversity of methods, qualitative and quantitative, as
described in the following section.
73 METHODS
Our analysis uses a mixed methods approach where quantitative data is drawn from an enterprise
survey, and qualitative data from semi‐structured interviews (SSI), key informant interviews (KII), and
participatory focus group discussions (FGD). Mixed‐methods approaches provide the rigour required
in complex environments like this, where randomisation of the PUE interventions is not possible and
where several gender and entrepreneurship programmes have already taken place, which makes it
difficult to isolate their effects (Chambers, 2017).
The identification strategy consisted in comparing energy consumption patterns and business
performance of men and women entrepreneurs located in and out of LIZ in Techiman and Berekum.
Subsequently we looked for the main reasons that could explain these differences, by looking at
correlations between outcomes and independent variables through OLS regressions and using insights
from qualitative research.
All data were collected by a gender‐balanced team of 10 enumerators and 4 senior researchers from
the Institute of Social, Statistical and Economic Research (ISSER) of the University of Ghana, with
support from a researcher from the Institute of Development Studies (IDS). Previous to departure for
fieldwork, enumerators had 3 days of training about the context and underlying theory of the
research, the research tools, and the functioning of Computer Assisted Personal Interview (CAPI)
enabled tablets. Fieldwork activities started on the 21st of May 2018 and ended on the 1st of June
2018. To meet district entry protocols, the project leaders met the Municipal Assembly Chief
Executives of Techiman and Berekum, who guaranteed support for the study.
An enterprise questionnaire was used to collect data about enterprise and business owner
characteristics, business performance, and energy use patterns, for quantitative analysis. Government
bodies could not provide the researchers with an updated census of enterprises. Therefore, we had
to design a sampling frame drawing from three sources: a baseline survey undertaken by GIZ in 2007;
the enterprise census prepared by LIZ as part of their M&E activities, and observations during a
reconnaissance visit ahead of the fieldwork. With a target of 400 respondents, we designed a stratified
sample taking into account sector of activity, gender, population, and location in and out of LIZ. Eleven
target sectors were selected, with the aim of focusing on enterprises with some employees apart from
the owner, and requiring a substantial amount of energy for their operations. This meant excluding
petty trading, a sector where many women operate individually in Ghana, that due to its small size
and energy consumption was not interesting for our study.
Each enumerator received a sampling frame showing the kinds of enterprises to be targeted and
requested to screen the zones in search of respondents. Data were uploaded every day to the central
server and monitored by a senior researcher to guarantee high quality. There were no major
incidences during fieldwork.
Table 2 shows the characteristics of the sample per location and gender. A 37% share of enterprises
are women owned, and 20% of all enterprises are located in LIZ. Female representation within LIZ is
significantly smaller than in the total sample, at 20% of enterprises, because the car repair industry is
dominated by men. We oversampled female enterprises in LIZ, which is why the share appears higher
than shown in the LIZ census prepared by GIZ.
Table 2‐ Sample characteristics‐ Number of enterprises per town, owner’s gender, and location within LIZ
Berekum Techiman Tuobodom Total
Total 162 169 69 400
Women owner 59 (36%) 61 (36%) 27 (39%) 147 (37%)
Within LIZ 49 48 21 118 (20%)
8Women owner within LIZ 6 (12% of LIZ) 3 (6% of LIZ) 3 (14% of LIZ) 12 (10% of LIZ)
Source: Field survey, 2018
Table 3 shows the characteristics of the sample per sector of activity, and then disaggregated by
location in industrial zones. The most frequent sector is vehicle repair, where 22% of enterprises in
the sample operate. Other sectors with numerous enterprises are hairdressing, with 16% of the
sample, tailoring with 14%, metal works and restaurants, each with 12%.
Table 3‐ number and percentage of enterprises per sector of activity, in and out of LIZ
Total % of total % out of LIZ % in LIZ
Food preservation (cold store) 19 5% 19 0
Manufacture of grain mill products 15 4% 14 1
Manufacturing of textiles 1 .3% 1 0
Manufacture of wearing apparel 58 14% 58 0
Manufacture of wood and products 12 3% 11 1
Manufacture of fabricated metal products 48 12% 23 25
Manufacture of furniture 15 4% 8 7
Repair and installation of machinery and equipment 11 3% 7 4
Maintenance and repair of motor vehicles 88 22% 19 69
Restaurants 48 12% 37 11
Hairdressing 64 16% 64 0
Bakery 21 5% 21 0
Total 400 100 282 118
Source: Field survey, 2018
KII aimed at improving understanding about cultural and gendered norms in the region and country;
Government activities to promote gender equity in PUE; and approaches of electricity suppliers for
meeting this goal. A total of 10 key informants were interviewed from the Government and the private
sector. Details of respondents are presented in Table 4.
Table 4‐ Key informant interview details
Position of interviewee Type of organisation Gender Location
District Chief Executive Officer Government Male Berekum
Chairman of LIZ Private sector Male Berekum
Gender, Child and Social Protection Officer Government Female Sunyani
NEDCO assistant chief technical engineer Public electricity utility Male Berekum
President of hairdressers association Private sector Female Berekum
Head of hairdressers association Private sector Female Techiman
Head of business advisory centre Government Male Techiman
Chairman of Light Industrial Zone Private Sector Male Techiman
Municipal Assembly Planning Officer Government Male Techiman
District Planning Officer Government Male Techiman
Source: Field survey, 2018
In‐depth interviews with men and women explored time availability constraints, gender roles, access
to skills and resources, motivations, aspirations, etc. A total of 40 (20 men and 20 women) respondents
were targeted, half in each of the towns, and equally split in four groups: women workers or
entrepreneurs in female dominated or neutral activities; women workers or entrepreneurs in male
dominated activities; men workers or entrepreneurs in male dominated activities; and male workers
or entrepreneurs in female dominated or gender neutral activities.
9Finally, five mixed sex1 FGD were conducted in Techiman and Berekum, therefore 10 FGD, with a total
of 80 participants. Four different research tools were used to elicit different types of information:
Tool 1‐ Community and energy mapping. The objectives of this exercise are: identifying key
services and infrastructure that men and women use in the community; where men and
women work; the types of work they do; the types of energy they use and how they use them.
Tool 2‐ Activity and energy use mapping. This tool supports men and women to talk about the
activities they do through the day, classifying them in three groups: unpaid care work; paid
work; and leisure or community work. The tool also supports a discussion about the different
energy sources men and women use for each of these activities.
Tool 3‐ Access to and control over resources. This tool reveals the differences between men
and women in terms of their access to and control over household and business resources,
including productive assets, natural resources, family labour, income, etc. Access represents
the opportunity to use a resource without having the authority to make decisions to sell,
exchange or modify it. Control, on the other hand, represents the full authority to make
decisions about the use of a resource.
Tool 4‐ Gendered value chains. A value chain is defined as the sequence of activities required
to make a product or a service from conception, through the different phases of production,
delivery to final consumers, and final disposal after use. This activity aims to map the way men
and women are involved in the different steps of the value chain. We wood works, metal
fabrication, cassava and wearing apparel, due to their male or female dominance and their
economic and energy consumption importance for the region.
Table 5‐ FGD participants per township, tool and gender
Berekum Techiman/Tuobodom
Community and energy mapping 8 (5 women, 3 men) 9 (4 woman, 5 men)
Activity and energy mapping 8 (4 women, 4 men) 9 (5 woman, 4 men)
Access to and control over resources 7 (3 women, 4 men) 9 (unknown)
Gender value chain Textiles: 8 (5 women, 2 men) Metal: 7 (all men)
Wood: 6 (all male) Cassava: 9 (4 female, 5 men)
Total 37 43
Source: Field survey, 2018
The analysis of enterprise data starts with descriptive statistics, showing differences in means of a
number of indicators for men and women enterprises, and for different regions. Descriptive data is
organised around research questions. Firstly, we show differences in energy consumption patterns for
productive uses by men and women owned enterprises. Then we look at data to support or refute the
following hypothesis about gender differences: in business size and performance; in access to financial
and physical capital and skills; in domestic care responsibilities; in motivations to run businesses; and
in occupational segregation.
Following the descriptive statistics, the report presents results of several Ordinary Least Square (OLS)
regressions looking at outcomes of interest related to enterprise performance and energy
consumption. An experimental design was not possible, due to the impossibility to randomise
electricity provision in our context, as this arrived to the sites over a decade ago. Quasi‐experimental
approaches were challenging as well, due to the difficulty of finding enterprises not connected to
electricity that share all other characteristics with those connected, or credible instrumental variables.
Our OLS results, therefore can only be able to establish whether the correlations among our variables
1
After piloting the FGD we realised that mixed groups were able to provide the information we required, as men
and women felt comfortable to express themselves freely, with good facilitation.
10of interest are statistically significant, without the possibility of claiming for causality. The model used
for this analysis is presented in Equation 1:
2
The dependent variables are a set of business‐related indicators about economic performance
(including profits, customers, sales, opening hours and business expenditure) and energy consumption
(measured as monetary expenditure for energy and electricity). The paper details the results for
monthly profits, energy expenditure, and number of hours of electricity used3.
The list of covariates in includes a set of control variables accounting for business, individual and
household characteristics. The following Table 6 summarizes the list of control variables, common for
all estimated regressions.
Table 6‐ List of control variables
Business Individual Household
Number of workers Age Number of children
Starting capital No Education/Primary Education Number of elderlies
Member of an association Migrant4
Officially registered Married
Keep books Bank Account
Permanent Building
Requested Loan
Source: Field survey, 2018
The dummy variables and and account for, respectively,
whether the business uses electricity, whether the business is female‐owned and whether the
business is within an industrial zone. Finally, all sample regressions include sector and region fixed
effects. For sector fixed effects we take “Processing and preserving of food and vegetables” as the
sector of reference, against which performance of the other sectors is compared. This sector is
selected because both men and women are represented and there are many observations. For the
regional fixed effects, Berekum is taken as the reference region.
The qualitative analysis is used to validate and complement the results of the quantitative analysis.
The information gathered through FGD, SII and KII was transcribed and then coded using the same
themes as the quantitative analysis, to provide answers to our research questions.
4 RESULTS
This section on results provides answers to the first two research questions about differences in PUE
by men and women enterprises, and the reasons behind them. The first two sub‐sections use
descriptive statistics and qualitative analysis to provide answers, whereas the third uses OLS
regressions to isolate the importance of each explaining variable ceteris paribus. The last research
question about interventions for gender equity in the PUE, is addressed in the discussion section.
4.1 Do men and women benefit differently from the PUE in Brong Ahafo?
The creation of LIZ with improved infrastructure and business services has clearly targeted male
enterprises. LIZ cluster enterprises within the vehicle repair and maintenance sector, which is a
2
For all outcome variable relative to electricity, the variable is omitted.
3
Results with other economic and energy indicators are reported in the Appendix
4
Every individual not born in the same village where the business is located is defined as migrant
11typically male sector. Figure 4 shows all enterprises located in Techiman and Berekum LIZ, per gender
of the owner and sector of activity. Only 13% of enterprises in the LIZ of these towns are owned by
women, and they operate in a narrow number of activities, mainly food preparation5.
Figure 4‐ Number of enterprises in Techiman and Berekum LIZ per gender of the owner and sector, December 2016
Enterprises within LIZ represent only 20% of the sample used for quantitative analysis in this paper.
This research includes enterprises in and out of LIZ precisely to take into account energy consumption
patterns of female owned enterprises. Even so, most of the enterprises in our sample are male owned,
and 37% are female owned. As indicated in the methodology, our sample excludes petty trading,
which is a sector that women dominate. The market, described in our FGD as “the most important
location” in town, is dominated by women traders, but they often operate individually and with very
small energy consumption. Figure 5 shows the gendered distribution of business activities in our
sample, with a clear division of activities between male and female (occupational segregation will be
further discussed in section 4.2.5).
5
A more detailed account of female activities is presented in Figure 2 in section 2.2
12Figure 5‐ Number of enterprises in our sample, in Techiman and Berekum per sector and gender of the owner
Enterprises outside of LIZ have also benefitted from business promotion interventions, and hence we
cannot assume that women enterprises are not targeted just because they have not benefitted from
LIZ. Table 7 shows that effectively female enterprises have received as much support as male
enterprises, and to some extent more, but none of these activities dealt with improving electricity
supply, as the LIZ did.
Table 7‐ Share of enterprises that have received support activities, per location and gender of the owner
Location Gender
No
Ind P‐ P‐
Ind Male Female
Zone value value
Zone
Awareness campaigns to involve women in business 1.8% 0.0% 0.146 0.4% 2.7% 0.044
Management training 17.4% 27.1% 0.027 17.8% 24.5% 0.108
Technical training*** 19.9% 35.6% 0.001 24.5% 24.5% 0.997
Loans to purchase equipment 0.4% 0.0% 0.517 0.0% 0.7% 0.189
Support to find and engage with customers *** 5.7% 0.8% 0.029 1.2% 9.5% 0.000
Provision of raw materials at a better price 0.4% 0.0% 0.517 0.4% 0.0% 0.445
Other 1.1% 0.8% 0.843 1.2% 0.7% 0.624
None*** 78.4% 61.9% 0.001 72.7% 74.8% 0.646
*** pby a number of interviewees and participants in FGD as a determinant of men and women segregation
across sectors. Some men in the carpentry and car repair industries indicated that they only use their
man‐power and manual tools for their job. For this reason, the introduction of electric machines
replacing physical energy with electricity would allow women to enter male trades, like carpentry: “if
the government gives us machines, a woman will not give birth once and stop the work and stay at
home. Because the machines will help you do the work without using the physical energy that men
use.” (Female carpenter in Techiman).
Table 8‐ Share of male and female businesses using each type of energy
All Male Female P‐value
None 13.8% 18% 6% 0.001
Dry cell batteries 3.0% 1% 6% 0.005
Lighting 91.7%
Cooking 0.0%
Operating Equipment 33.3%
Car or other rechargeable battery 1.5% 2% 1% 0.861
Lighting 1.0%
Cooking 0.0%
Operating Equipment 0.5%
Gas (LPG) 13.0% 7% 23% 0.000
Lighting 0.0%
Cooking 54.5%
Operating Equipment 71.1%
Diesel or Petrol 6.8% 8% 4% 0.105
Lighting 26.0%
Cooking 0.0%
Operating Equipment 100.0%
Charcoal 24.8% 5% 59% 0.000
Lighting 0.0%
Cooking 82.6%
Operating Equipment 47.4%
Firewood 10.3% 3% 23% 0.000
Lighting 0.0%
Cooking 97.5%
Operating Equipment 9.8%
Electricity 68.5% 74% 60% 0.005
Lighting 97.6%
Cooking 30.5%
Operating Equipment 94.6%
Total energy expenditure, and energy intensity are not significantly different in male and female
enterprises. However, men spend significantly more on electricity than women. According to
representative of NEDCO (Northern Electricity Distribution Company), men typically operate the larger
businesses in the area and are heavier consumers of electricity. For example, two of NEDCO’s major
consumers in Berekum are a large saw mill and a plastic factory, run by men. Within trades, for
example cold stores, men typically own large cold rooms, whereas women operate smaller kiosks with
one or two freezers. In an interview, a rare female miller clarified that she produces at a much smaller
scale than male owners. Average expenditure in cooking fuels, LPG and firewood in particular, is very
high. This is unexpected for firewood, as during FGD some respondents indicated that they collect it
from the bush themselves, and therefore it is free. However, the Manager of the Business Advisory
14Centre in Techiman indicated that the Forestry Commission is trying to curb the use of firewood, and
accessing it is getting difficult and more expensive with time.
Table 9‐ Average monthly expenditure in each type of energy source, by gender
Fuel types All Male Female Diff. p‐value
Dry cell batteries (e.g. torch or radio batteries) 17.1 37.0 10.4 26.6 0.118
Car or other rechargeable battery 27 2.5 76.0 ‐73.5 0.008
Gas (LPG) 191.9 130.1 224.7 ‐94.6 0.281
Diesel or Petrol 123.6 152.5 22.5 130.0 0.041
Charcoal 99.5 152.0 91.5 60.5 0.569
Firewood 213.3 288.6 197.8 90.8 0.184
Electricity (solar, generator, mini‐grid or national grid)*** 161.4 192.0 96.8 95.2 0.007
Total energy expenditure 280.2 281.7 277.6 4.08 0.969
Energy Expenditure over Total Expenditure 20% 15.2% 15.2% 0.0% 0.995
Energy Expenditure over Profit 40% 43.3% 46.1% ‐2.8% 0.775
*** pSmoother 0.00 0.66 ‐0.66 0.025
Tailors
Electric sewing machine 2.04 0.59 1.45 0.000
Electric iron 0.84 0.65 0.19 0.222
Hotel
Blender 0.10 0.46 ‐0.36 0.030
Woodworks/furniture
Electric saw 0.5 ‐
Electric drill 0.8 ‐
Milling
Mill with motor 3.6 ‐
Table 12 shows characteristics of electricity supply, and their differences per location of the enterprise
and gender of the owner. There are significant differences in reliability of supply, which is higher in
industrial zones due to improvement of the distribution network, resulting in less outages with lower
duration. Location in or out of LIZ may hence be driving gender differences in reliability of supply, with
female enterprises suffering significantly more outages than male owned enterprises. On the other
hand, we observe differences in the reported connection fees paid by male and female owned
enterprises, with women paying significantly lower fees.
Table 12‐ Characteristics of power supply per location and gender (averages)
Zone differences Gender differences
Non‐
Ind
Ind Diff p‐value Male Female Diff p‐value
Zone
Zone
Availability (hours per day) 9.71 8.44 1.26 0.086 9.24 9.64 ‐0.40 0.552
Availability in the evening (hours) 6.94 8.03 ‐1.09 0.044 7.32 7.16 0.17 0.738
Average number of outages per week 3.75 2.75 1.00 0.129 2.63 5.03 ‐2.39 0.000
Average duration of outages (hours) 4.07 2.41 1.66 0.001 3.50 3.87 ‐0.37 0.410
Upfront investment ‐ connection fee 358 318 40.4 0.595 410 236 174.1 0.039
N 239 85 208 116
The representative of NEDCO explained that Berekum is currently suffering from power reliability
issues. The distribution network has not grown with population, and overloading is common, leading
to power cuts and voltage drops, which are particularly acute during evening hours. There are plans
to upgrade the network to deal with overloads. Unreliable supply causes losses for businesses in the
area. For example, a car mechanic explained “When someone has given his car to be done and for the
past three days the lights have been off, there is a problem because the person needs the car for work
and you have seized it”. A female sprayer shared her frustration “If power is reliable, you are able to
meet the deadline as promised to your customers thereby keeping the bond between you and the
customer. He or she will pay for the services happily, but when light goes off, they are highly
disappointed and may reduce the price agreed”. A hairdresser also explained that “when potential
customers find there is no power, they just leave, and we can spend 3 days without business”. Not
only power cuts reduce sales, but also they can damage equipment: “the straighteners over there they
are about 8 and 3 are damaged because of on and off of power” (female hairdresser from Berekum).
To deal with frequent outages, some businesses aspire to purchase diesel powered machines or solar
PV systems that provide a backup for the grid. According to a female grain miller from Berekum “Due
to frequent light out, I plan on getting the diesel version of the machine to provide a support. This has
16been my dream for long (…) but my best wish is that the government minimizes power cuts and if
possible eliminates them because it is really worrying”
Electricity tariffs are set by the Public Utilities Regulatory Commission of Ghana (PURC), in a way that
households and enterprises with higher consumption levels pay higher tariffs per kWh than lower
consumers. Table 13 shows the most recent electricity tariffs approved, at the date of this research.
While our respondents could not specify the tariff they pay per unit consumed, it is expected that
male owned enterprises, typically consuming more, would be paying higher tariffs than female
enterprises consuming less. This could effectively create a cross‐subsidy from high power consuming,
typically male, enterprises, to low power consuming, typically female ones.
Table 13‐ Approved electricity Tariff – Effective 15 March, 2018
Tariff Category Unit Effective 15 March, 2018
Residential
0 ‐ 50 GHp/kWh 27.6858
51 – 300 GHp/kWh 55.5450
301 – 600 GHp/kWh 72.0866
601+ GHp/kWh 80.0963
Service Charge
Lifeline Consumers GHp/month 213.000
Other Residential Consumers GHp/month 633.1717
Non‐Residential
0 ‐ 300 GHp/kWh 67.7536
301 ‐ 600 GHp/kWh 72.0971
600+ GHp/kWh 113.7598
Service Charge GHp/month 1055.2862
Many respondents manifested lack of knowledge about how their electric bills are set and required
further information on this topic. According to a car mechanic, “I had one master welder, just recently
they came to cut his power. His bill was about GHc 1,500 and they had given him a meter but he
doesn’t have a fixed price so when the person comes he can give him any amount”. This lack of trust
in meter readings was also stated by the female president of the hairdressers’ association: “We are
pleading that the people who come to read the meters are truthful to those of us who are not that
educated”. Although the NEDCO representative insisted on the benefits of pre‐paid meters for
businesses to control their expenditure in electricity, this was not welcome by some users, particularly
the hairdressers, which indicated they don’t have enough cash flow to pay for the bills in advance, and
a power cut during a service to a client can damage their reputation. Other trades, however, were
happy with the prepaid meters as they allowed them to control their expenditure.
In summary, the quantitative data shows that the provision of improved electricity supply in LIZ has
targeted male enterprises. However, female owned enterprises have benefitted from other business
promotion interventions. Even though electricity is the most prevalent type of energy in enterprises
across genders, a larger share of male enterprises uses it and they spend more on it. Women
enterprises use cooking related fuels and while LPG is widely available, charcoal is still used more
frequently. Men owned enterprises more frequently use no energy other than their physical energy.
In the end average energy expenditure and energy intensity, including all fuels, is similar across
genders. The quality of electricity supply is poor, with frequent and long outages that bring significant
costs and lost sales for businesses. However, quality is better in LIZ, served with a new transformer
and more stable electricity supply. Furthermore, women enterprises report more frequent outages
than men´s, as well as lower connection fees. Finally, electricity tariffs are set progressively in Ghana,
17with consumers that use more, paying higher tariffs per kWh. This could have created a cross‐subsidy
from larger, male owned enterprises, to smaller, typically female enterprises.
4.2 Which gendered constraints affect women’s chances to benefit from PUE?
4.2.1 Differences in size and profitability of men and women enterprises
Indicators of business performance presented in Table 14 show that women on average sell less than
their male counterparts during the high season, but the difference is not statistically significant.
Seasonality is determined by public festivities and the harvesting period. On the other hand, women
have a higher number of customers than men, indicating the lower value of their unit sales. Even if
male owned businesses have higher average monthly and annual profits, the difference with women
is not statistically significant, due to the high standard deviation of profit figures. Business
performance, therefore, is not clearly biased in favour of men. Interviewees highlighted that women’s
businesses are typically smaller than men’s, because women are typically involved in petty trading,
but this sector was not part of our sample. Also, that women tend to combine many different activities,
while men focus on larger scale businesses: “It looks like women are rich because they can do so many
things at the same time, but the men too are rich because they are involved in relatively large scale
activities” (District planning officer from Techiman North).
Table 14‐ Differences in means of business performance indicators by gender of entrepreneur
Gender
Male Female Diff p‐value
Average Sales in high season (GHC/week) 2481 1852 628 0.475
Average Sales in low season (GHC/week) 869 866 3 0.994
Customers in high season*** 66 161 ‐95 0.001
Customers in low season*** 33 93 ‐59 0.001
Last Month Profit (GHC/month) 1267 966 301 0.481
Annual Profit (GHC/year) 14207 11692 2515 0.608
Total expenses (GHC/month) 2762.6 2841.3 ‐78.7 0.912
*** pTotal expenses (GHC/month) 2638.3 3157.6 ‐519 0.639 *** p
performance, therefore, does not explain the lower level of electricity consumption of female
businesses.

4.2.2 Differences in access to and control over capital, skills and other resources
Businesses across the sample show significant access to financial services. More than 75% hold bank
accounts, and nearly 40% have requested loans, the majority of which were granted. Gender
differences in bank accounts are significantly biased in favour of women. Banks were in fact described
by women participants in FGD as one of the most important services in the town, because “After
selling, we cannot take our money home. We must keep it at a place where it cannot be stolen”
(female tailor in Berekum). Male enterprises, on the other hand, have higher capitalisation, but the
difference with women is not statistically significant.
Table 18‐ Access to capital and finance by gender of the owner

                               All     Male     Female Diff. p‐value
 Starting capital            3346      3693      2748          945   0.245
 Own Bank account**          76.5%     73.1%     82.3%               0.037
 Requested loan              38.5%     36.0%     42.9%               0.172
 Loan Granted                93.5%     94.5%     92.1%               0.545
*** p
there is nothing you can do. (…) but if you don’t have machines, you can hire them” Male
straighter from Techiman.
Contradicting previous research (de Mel, McKenzie, & Woodruff, 2009) some respondents said men’s
business profits are more likely captured by household needs than women’s profits:
“Female businesses are the ones that usually grow faster than those of men. The reason is
that, if she is a married woman, she doesn’t spend her revenue on anything. She is always
reinvesting it back into the business but for a married man, you are responsible for the
household expenses. She can say she doesn’t have money but you can’t. You have to manage
for the business to survive as well as bring something home. This is why businesses of men do
not grow as fast as those of women.” (Male welder from Berekum).
“When women come for a service they put it into the right place, but men sometimes divert
the funds. When women get support for their businesses, they look and their families look
happier.” Head of the Business Advisory Centre of Techiman.
It seems, therefore, as if women had lower access to capital to start with, but then they were more
able to save and reinvest in their businesses to make them grow: “when a man decides to take up this
job, he easily expands because of the bigger start‐up capital, but for the females they start from
somewhere and grow into a bigger business.” Female soap maker Techiman.
Table 20‐ Most important constraints for doing business (two selected per respondent)
All Male Female p‐value
Accessing capital 59.8% 59.3% 60.5 % 0.805
Family or friends disapproval 0.3% 0.0% 0.7% 0.189
Limited time due to family care responsibilities*** 1.8% 0.4% 4.1% 0.007
Lack of skills*** 4.3% 2.0% 8.2% 0.003
Harassment by customers or public authorities 6.3% 7.5% 4.1% 0.172
Competition‐ many people do business in a similar 17.3% 18.2% 15.6% 0.518
Not enough customers 16.8% 16.2% 17.7% 0.702
Other*** 28.5% 34.4% 18.4% 0.001
No barriers 7.8% 7.1% 8.8% 0.533
*** pmen and women, but higher women’s control over gas, and higher men’s control over petrol.
Participants also indicated that men and women have control over their own income.
Table 21‐ Access and control of resources by men and women‐ Averages for Techiman and Berekum
ACCESS CONTROL
Men Women Men Women
Water 8 2 0 10
Firewood 0 10 2 8
Microwave 6 4 2 8
Woman's income 3 7 2 8
Gas (LPG) 5 5 3 7
Fridge 6 4 4 7
Television 6 4 4 7
Other elec. appliances 4 6 4 6
Utensils for cooking 2 9 4 6
Charcoal 0 10 5 5
Electricity 7 3 5 5
Fan 9 1 5 5
Mobile phones 7 3 7 4
Motorbike 9 2 7 4
Radio 8 2 7 4
Cash 7 3 7 3
Computers 9 2 7 3
Iron 7 3 7 3
Livestock 7 3 7 3
Furniture 8 3 8 3
House 8 2 8 2
Lands 9 2 9 2
Car 9 1 9 1
Man's income 7 3 9 1
Petrol/Diesel 9 1 9 1
Total Average 6.3 3.7 5.5 4.5
Skills are another important resource for starting and operating businesses. Gendered data on
education, presented in Table 22, shows again that in our target region men and women
entrepreneurs enjoy similar levels of education. This aspect was validated in our interviews to workers
and key informants:
“Things have changed drastically as far as the education of the Ghanaian children. Gone are
the days when education was restricted to the boys alone here in Berekum” Berekum
Municipal Chief Executive (male)
“when it comes to school enrolment you have gender disaggregated data showing that the
ratio is almost 1 to 1” Techiman Municipal Planning office (male)
Table 22‐ Education of business owner, ANOVA by gender
All sample Male Female P‐value
None 15.8% 16.6% 14.3% 0.540
Primary 10.5% 11.1% 9.5% 0.627
Secondary 52.5% 50.6% 55.8% 0.316
High School 13.5% 15.4% 10.2% 0.141
Vocational 4.0% 3.2% 5.4% 0.262
University Degree/Master/PhD 3.8% 3.2% 4.8 % 0.417
22*** p
helping with homework or putting them to sleep. On the other hand, there are some activities that
are still specifically female, mainly cooking and serving food, washing clothes and dishes. But men
have distinctively taken over activities such as ironing, probably facilitated by the use of electric irons.
Table 26 shows caring activities done exclusively by women, by men, and both as detailed by FGD
participants.
Table 26‐ Care activities detailed in FGD discussions in Techiman and Berekum, per men or women responsibility
Women’s responsibility Men’s responsibility Both men and women
Prepare and serve food for Pound fufu (cassava meal) Walk my child to school
the family Iron my family’s clothes Clean the house/sweeping
Wash children’s clothes Take my wife to the shop Bath children
Wash dishes Dress children/ get them ready
Pray with children in the morning
Help children with homework
Put children to sleep
The discussions highlighted that strong traditional gender roles, giving women full responsibility for
the care of the household, coexist with attitudes that challenge them. The following quotes provide
some examples of traditional gender roles:
“The difference here is that, we men are very occupied so when the women wake up in the
morning, bath the children and send them to the bus station to go to school, the men face the
rest of the responsibilities. That is the arrangement between husband and wife. Activities
undertaken by men and women towards children or other members of the household can
never be equal.” (39 years old man, father of three, working in radio electronics, in Techiman)
“Due to financial pressures, men get up early and go to work so all the household chores
automatically are left for the women”. (35 years old, father of 3 auto‐electrician in Techiman)
“it is the responsibility of men to take care of their wives. So, if a man should take a wife, he
will have to assume all the responsibilities of her parents by making sure he provides for her.
That is what God said. It is not in the place of a woman to take full responsibility for her
husband. Any man who allows that is not man enough. This explains the disengagement of
men in domestic chores. Even if for a day, a man is not able to provide housekeeping money
it becomes a debt that he ought to pay.” (Man working in Techiman)7.
“It is women who take care of household chores and if not done, the whole house will be very
dirty.” (30 year old female hairdresser, mother of one)
“If someone builds a house and it is covered in weeds, the remarks from society are, is there
no woman in this house? It is the responsibility of women to ensure cleanliness and keep the
house in order.” (Man working in Techiman)
“It is the responsibility of the man to give the woman money for housekeeping, school fees
and give gifts at funerals. So if you don’t try to work hard, your family won’t do well. Most of
the houses in Berekum are built by men. So if you are a man, you always have to work hard to
get money to look after your family.” (56 year old welder working in Berekum.)
This traditional role of men as providers was not entirely satisfactory for men themselves, who found
it very stressful:
7
Personal details of this participant could not be retrieved due to his late arrival
24You can also read


