Cutting Edge Technology Profile for STRING - Technological Strengths and Linkages Basel, 11 December 2019
←
→
Page content transcription
If your browser does not render page correctly, please read the page content below

Cutting Edge Technology
Profile for STRING

Technological Strengths and Linkages

Basel, 11 December 2019

Issuer
BAK Economics AG

Project Management
Andrea Wagner, T +41 61 279 97 04
andrea.wagner@bak-economics.com

Editorial Staff
Klaus Jank
Raphael Frey
Andrea Wagner
Niklas Bernhard

Communication
Marc Bros de Puechredon, T +41 61 279 97 25
marc.puechredon@bak-economics.com

Copyright
Copyright © 2019 by BAK Economics AG
Contents

1       Introduction ............................................................................................................. 6
1.1     Definition of the STRING region and its benchmarks....................................... 7
1.2     Regional innovation systems ............................................................................. 8
1.3     BAK Technology Approach .............................................................................. 10
1.4     Structure of the analysis ................................................................................. 12
2       Technology analysis of the four regions (Oslo region, West Sweden,
        Øresund, Hamburg region) and the entire STRING region ............................ 13
2.1     Overview ........................................................................................................... 13
2.2     Technology profiles .......................................................................................... 15
2.2.1   Oslo Region ...................................................................................................... 18
2.2.2   West Sweden ................................................................................................... 21
2.2.3   Øresund ............................................................................................................ 23
2.2.4   Hamburg Region .............................................................................................. 25
2.2.5   STRING ............................................................................................................. 27
2.3     Overview of top research companies and universities in STRING ................ 29
2.4     Summary .......................................................................................................... 34
3       Green Technologies in STRING .......................................................................... 35
3.1     Overview ........................................................................................................... 35
3.1.1   Patent portfolio in green technologies ........................................................... 36
3.1.2   Comparison with the San Francisco Bay Area ............................................... 39
3.2     Green technology profile of STRING and San Francisco ............................... 41
3.3     Summary .......................................................................................................... 42
4       Research interdependencies ............................................................................. 43
4.1     Intra-STRING research interdependencies .................................................... 43
4.2     Co-ownership of patents in STRING................................................................ 47
4.3     Summary .......................................................................................................... 49
5       Analysis of the potential of technology combinations .................................. 50
5.1     Technology combinations in STRING .............................................................. 50
5.2     Oslo Region ...................................................................................................... 51
5.3     West Sweden ................................................................................................... 53
5.4     Øresund ............................................................................................................ 55
5.5     Hamburg Region .............................................................................................. 57
5.6     STRING ............................................................................................................. 59
5.7     Digitization in STRING...................................................................................... 61
5.8     Summary .......................................................................................................... 62
6       Conclusion ............................................................................................................ 65
7       Appendix ............................................................................................................... 67
7.1     Definition of the STRING Region ..................................................................... 67
7.2     Green technology profiles of the Oslo region, West Sweden, Øresund and the
        Hamburg region ............................................................................................... 68
7.3     Technology definitions ..................................................................................... 70
List of tables

Tab. 1-1   Regional Innovation Scoreboard 2019 ........................................................ 9
Tab. 2-1   Technology Overview .................................................................................. 17
Tab. 2-2   Technology selection for the Oslo region .................................................. 18
Tab. 2-3   Technology selection for West Sweden ..................................................... 21
Tab. 2-4   Technology selection for Øresund ............................................................. 23
Tab. 2-5   Technology selection for the Hamburg region .......................................... 25
Tab. 2-6   Technology selection for STRING ............................................................... 27
Tab. 2-7   Top research companies ............................................................................ 30
Tab. 2-8   Top research institutes/universities.......................................................... 32
Tab. 3-1   Patent portfolio in green technologies (2016) and annual patent
           growth between 2010 and 2016 .............................................................. 37
Tab. 4-1   Regional Research interdependencies ..................................................... 44
Tab. 4-2   Research interdependencies in the Oslo region ...................................... 45
Tab. 4-3   Research interdependencies in West Sweden ......................................... 46
Tab. 4-4   Research interdependencies in Øresund.................................................. 46
Tab. 4-5   Research interdependencies in the Hamburg region .............................. 47
Tab. 4-6   Top co-owners of patents in STRING ......................................................... 48
Tab. 5-1   Heatmap Digitization in STRING ................................................................ 62
Tab. 7-1   Definition of the selected regions.............................................................. 67
Tab. 7-2   Definition of focus and green technologies .............................................. 70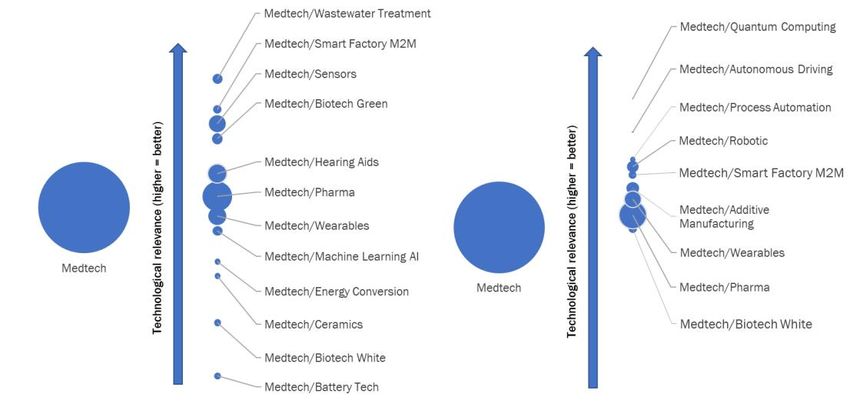
List of figures

Fig. 1-1    The STRING Region ....................................................................................... 7
Fig. 1-2    Measuring patent strength: technological quality and market
            coverage ...................................................................................................... 11
Fig. 2-1    Portfolio size/Patent intensity ................................................................... 13
Fig. 2-2    Total patent growth..................................................................................... 14
Fig. 2-3    World-class patent growth ......................................................................... 15
Fig. 2-4    Technology profile of the Oslo region ........................................................ 19
Fig. 2-5    Technology profile of West Sweden........................................................... 22
Fig. 2-6    Technology profile of Øresund ................................................................... 24
Fig. 2-7    Technology profile of the Hamburg region ................................................ 26
Fig. 2-8    Technology profile of STRING .................................................................... 28
Fig. 3-1    Size of green technologies/Patent growth in green technologies ........... 40
Fig. 3-2    Green Technology profile: STRING vs. San Francisco .............................. 41
Fig. 5-1    Image Analysis: Oslo Region vs. World ...................................................... 51
Fig. 5-2    Sensors: Oslo Region vs. World ................................................................. 52
Fig. 5-3    Electro & Hybrid Vehicles: West Sweden vs. World .................................. 53
Fig. 5-4    Autonomous Driving: West Sweden vs. World .......................................... 54
Fig. 5-5    Medtech: Øresund vs. World ...................................................................... 55
Fig. 5-6    Biotech White: Øresund vs. World ............................................................. 56
Fig. 5-7    Additive Manufacturing: Hamburg Region vs. World ................................ 57
Fig. 5-8    Energy Conversion: Hamburg Region vs. World........................................ 58
Fig. 5-9    Biotech Green: STRING vs. World .............................................................. 59
Fig. 5-10   Clean Tech: STRING vs. World ................................................................... 60
Fig. 7-1    Technology profile with focus on green technologies of the Oslo
            region........................................................................................................... 68
Fig. 7-2    Technology profile with focus on green technologies of West
            Sweden........................................................................................................ 68
Fig. 7-3    Technology profile with focus on green technologies of Øresund ........... 69
Fig. 7-4    Technology profile with focus on green technologies of the
            Hamburg region .......................................................................................... 69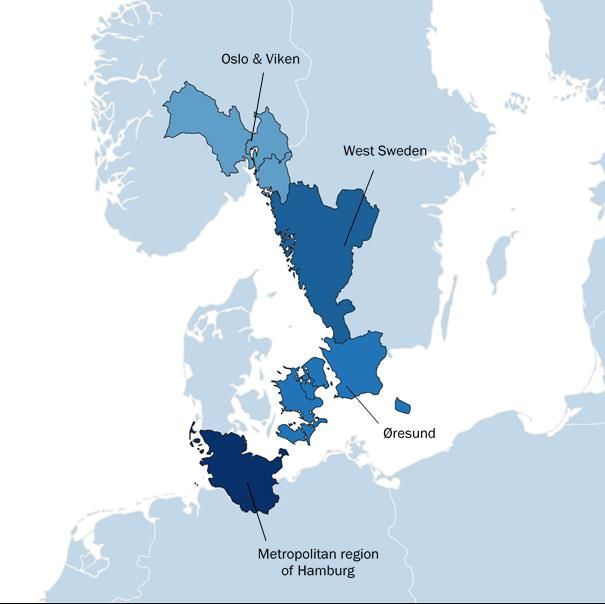
1 Introduction

STRING is a political cross-border organisation, with eight regions and five cities as
members, located in Norway, Sweden, Denmark and Germany. STRING is also a geo-
graphical area that comprises Oslo City and Viken, West Sweden, the Copenhagen-
Malmö-Region (Øresund) and the region of Hamburg. The vision of STRING is to be a
globally acknowledged green investment hub and a leading implementer of sustaina-
ble infrastructure to combat climate change while improving the lives of its citizens.1

Technological progress is key to ensuring competitiveness and future growth. To cope
with global competition, European regions and cities must innovate. Innovation is also
central to addressing global challenges like climate change.2 About two-thirds of Eu-
rope's economic growth over the last decades has been driven by innovation.3 How-
ever, the nature of innovation is changing and, therefore, also the ways in which re-
gions compete.4 The diffusion of technology advances is increasing. New technologies
are spreading faster within society. It is expected that multidisciplinary approaches will
become even more important because innovations that arise from the intersections of
different fields are often more valuable. In addition, the importance of cooperation and
communication among researchers and engineers is growing as innovations become
more complex.

Although technological progress is decentralised and is mainly achieved at the com-
pany level, one method available for measuring these activities is through the interna-
tional patent system. Together with the Swiss Federal Institute of Intellectual Property,
BAK Economics has developed an approach that allows for the measurement, analysis
and assessment of research and technology activities of companies and regions within
a global comparison, based on patent analysis. Further, this approach allows BAK to
analyse how research-intensive regions are and to evaluate the quality of these re-
search activities. This technology approach also highlights research cooperation and
technology combinations, i.e. patents that are relevant for more than one technology.

Cross-border regional cooperation aims to develop untapped growth potential of border
regions. The goal of this study is:
     -    to identify technological strengths of the STRING region,
     -    to provide better reciprocal knowledge to facilitate collaboration in cross-bor-
          der research and development,
     -    to identify existing cross-border research cooperation and
     -    to detect intelligent technology combinations leading to better research out-
          comes, regional competitiveness and growth prospects.
As green growth is a main strategic priority of STRING, special attention will be paid to
green technologies.

1 https://stringnetwork.org/about/
2 http://www.oecd.org/governance/regional-policy/regionalinnovation.htm.
3 https://europa.eu/rapid/press-release_IP-19-2991_en.htm
4 For the following see Council of Competitiveness 2005: Measuring Regional Innovation. A Guidebook for Conducting

  Regional Innovation Assessments, p. 8.

                                                                                                                6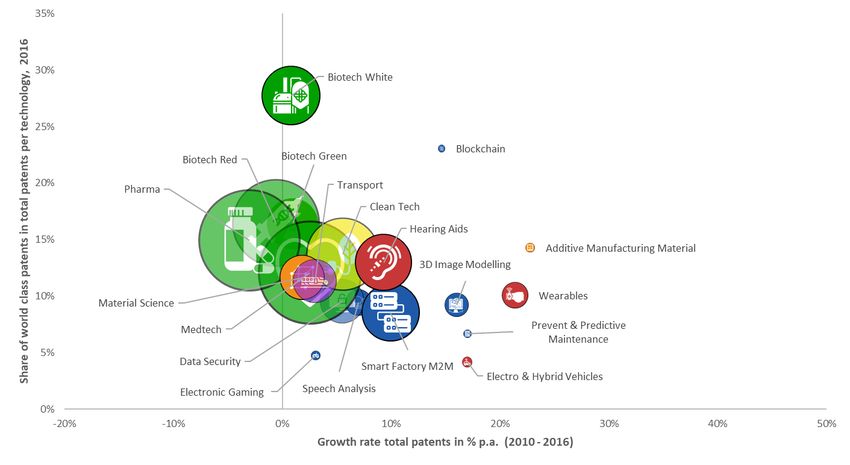
1.1        Definition of the STRING region and its benchmarks

Geographically, the STRING region consists of the Oslo region (Oslo-City and Viken5),
West Sweden, Øresund (Zealand-Copenhagen-Malmö-Region) and the region of Ham-
burg (Hamburg and Schleswig-Holstein). Except for figures and tables where region ab-
breviations are used for the sake of visibility, this will be the terminology of choice
throughout this report. With a population of 1.9 million, the Oslo region generated a
GDP per capita of 64,000 US dollars in 2018. West Sweden has 2.0 million inhabit-
ants, the largest city being Gothenburg, and a GDP per capita of 52,000 US dollars.6
The Øresund region has slightly more than 4 million inhabitants, while its recent GDP
per capita amounts to 56,000 US dollars. The Hamburg region, in turn, has 4.7 million
inhabitants and a GDP per capita of 56,000 US dollars, similar to the Øresund region.
In sum, the STRING region includes 12.6 million inhabitants and had an average GDP
per capita of 58,000 US dollars in 2018.

This report compares the STRING region to Western Europe, which consists of Austria,
Belgium, Denmark, Finland, France, Germany, Ireland, Italy, Luxembourg, Netherlands,
Norway, Spain, Sweden, Switzerland and the United Kingdom. In addition, the STRING
region is compared to the average of the 50 most research-intensive countries in the
chapter on technology combinations. For comparing green technologies, the San Fran-
cisco Bay Area has been chosen as a benchmark for the STRING region. This region is
home to more than 8.7 million people and earned a GDP per capita of 103,000 US
dollars in 2018.

Fig. 1-1          The STRING Region

Source: BAK Economics

5   As per 01.01.2020, the regions Akershus, Buskerud and Østfold will be merged into the province of Viken.
6   The following data are from BAK Economics Regional Economic Database 2019. All GDP per capita figures are of
    2018 and adjusted for differences in purchasing power.

                                                                                                              7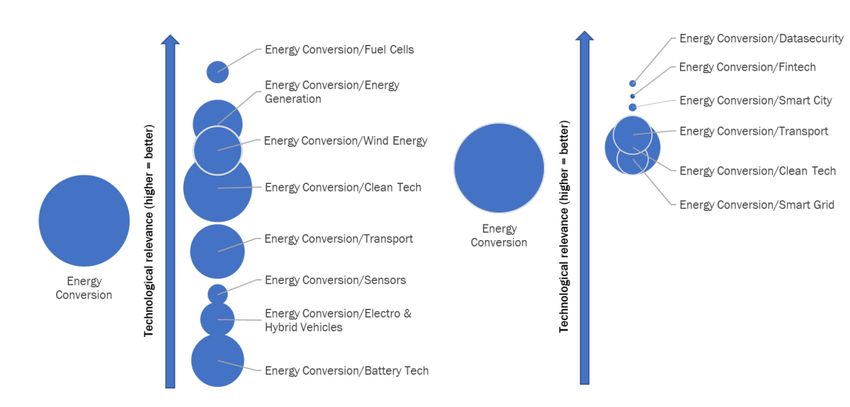
1.2        Regional innovation systems

For the definition and implementation of innovation strategies and policy instruments,
cities and regions must analyse the strengths and weaknesses of their research and
innovation systems. There are many different approaches to defining innovation and
assessing performance.7 One well-established instrument is the European Innovation
Scoreboard (EIS), provided by the European Commission. The Regional Innovation
Scoreboard (RIS) provides comparative assessment of the innovation performance of
European regions and measures innovation performance in the same fields and cate-
gories as the European Innovation Scoreboard, but with a limited set of indicators.

The RIS assesses innovation performance in four categories:

       •    Framework conditions
       •    Investments
       •    Innovation activities
       •    Impacts

The category of framework conditions comprises the main drivers of innovation per-
formance external to companies, such as human resources as measured by indicators
such as lifelong learning. In addition, the attractiveness of research systems is meas-
ured with indicators such as international scientific co-publications.

The category of investments captures investments spent by both the public and the
business sector with the two categories finance/support and firm investments. Indica-
tors are, for example, R&D expenditures in the public sector (finance and support) and
R&D expenditures in the business sector (firm investments).

The category of innovation activities summarizes different facets of innovation in the
business sector: innovators, linkages and intellectual assets. The facet of innovators
measures product or process innovations at the company (SME) level. The facet of
linkages measures collaboration activities with indicators such as public-private co-
publications or innovative SMEs collaborating with others. The facet of intellectual as-
sets is assessed by patent, trademark or design applications.

The category of impacts depicts the efforts of a firm’s innovation activities resulting in
employment increases (employment impact) or sales of new-to-market and new-to-firm
innovations (sales impacts). Together, these indicators form the Innovation Index that
can be used to compare regional innovation systems.

A first impression of the innovation performance of the analysed regions is given in
Table 1-1, reflecting the results of the RIS 2019. The RIS classifies the innovation per-
formance of regions into different innovation categories. The first group consists of
innovation leaders comprising regions with a performance above 120% of the EU av-
erage. The second group of strong innovators includes all regions with a performance
between 90% and 120% of the EU average. Moderate innovators are regions with a
score between 50% and 90% of the EU average, whereas modest innovators show a
performance level below 50% the EU average. Innovation leaders are coloured in dark

7   European Commission (March 2019): European Innovation Scoreboard. Exploratory Report A : What to measure and
    why ? Capturing mechanisms and emerging phenomena of innovation.

                                                                                                              8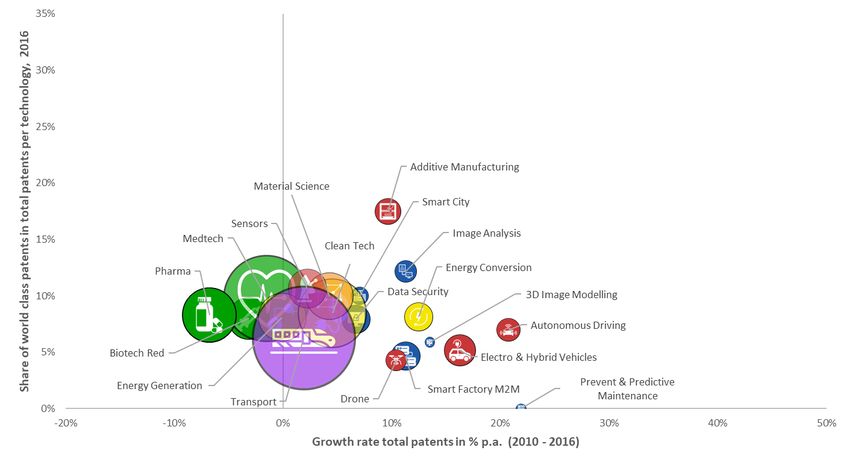
green, strong innovators are coloured in light green, moderate innovators in grey and
modest innovators in light red in Table 1-1.

Tab. 1-1            Regional Innovation Scoreboard 2019
                                               Ham burg                                                            STRIN G
                      C ategory                                  Øresund          Oslo Region   W est Sw eden
                                                Region                                                             Region
Hum an resources

Population with tertiary education                        71                150           162            140                 120

Lifelong learning                                         84                282           199            298                 198

Attractive research system s

Scientific co-publications                           111                    151           136            129                 128

Most-cited publications                                   97                117            92            117                 105

F inance and support

R&D expenditure public sector                        110                    135           131            114                 120

F irm investm ents

R&D expenditure business sector                           83                131           107            153                 113

Non-R&D innovation expenditures                           84                 75           130            110                  94

Innovators

SMEs innovating in-house                             116                    122           142            109                 121

Marketing or organisational innovators               129                    108           157            109                 124

Product or process innovators                        116                    102           166            106                 119

Link ages

Innovative SMEs collaborating with others                 65                108           166             86                  99

Public-private co-publications                       113                    178           153            245                 158

Intellectual Assets

Design applications                                  129                    122            29            109                 107

EPO patent applications                              102                    174            96            157                 133

Trademark applications                               133                    172            68            156                 137

Em ploym ent im pacts
Employment medium and high tech
                                                     106                    115           116            140                 115
manufacturing & knowledge-intensive services
Sales im pacts
Sales of new-to-market and new-to-firm
                                                          49                 78            92             96                  72
innovations

Innovation Index                                     105                    134           125            139                 122

                                                               Modest                                           Moderate
                                                               Innovators                                       Innovators
                                                               Strong                                           Innovation
                                                               Innovators                                       Leaders

Performance in 2019 relative to the EU in 2019. The category Innovation Leaders includes regions with performance
above 120% of EU average. Strong Innovators includes regions with performance 90% -120% of EU average. Moder-
ate Innovators includes regions with performance 50%-90% of EU average. Modest Innovators includes regions with
performance below 50% of EU average. The RIS provides data only at the NUTS 2, not the NUTS 3 territorial level.
Therefore, RIS data are available for the following regions: Hamburg region = Hamburg and Schleswig-Holstein, Øre-
sund region = Capital region Copenhagen, Zealand and South Sweden (Skåne and Blekinge), Oslo region = Oslo &
Akershus and South-Eastern Norway (Østfold, Buskerud, Vestfold and Telemark), West Sweden. To account for the
correct composition of the STRING region, performance values for Øresund, Oslo region and STRING region were
measured as population weighted averages of the according NUTS3 regions they comprise.
Sources: BAK Economics, Regional Innovation Scoreboard 2019

                                                                                                                                   9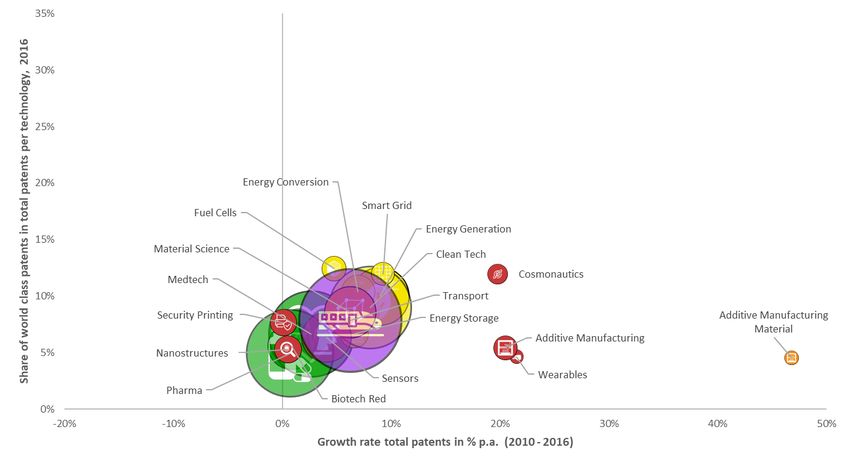
As can be seen from the table, all regions depicted achieve good results. The Oslo
region, West Sweden, and Øresund perform well in almost all indicators and are clas-
sified as innovation leaders. These three regions achieve particularly great scores in
the area of human resources (population with tertiary education and lifelong learning).
The Hamburg region scores slightly lower and is thus classified as a strong innovator.
The Hamburg region has some weaknesses in sales impact, human resources, and
firm investments compared to the other regions. The STRING region as a whole counts
as an innovation leader. The STRING region scores well in every innovation category
except for its sales impacts where it is regarded as a moderate innovator.

The following report is not intended to address all aspects of innovation when evaluat-
ing the regional innovation system in STRING. Instead, it focusses on the linkages and
intellectual assets evident there. BAK assesses the innovation performance in these
innovation categories by analysing patent data. Patents serve as a measure of re-
search performance, which can lead to marketable products and increase productivity.

The following analysis tries to gain deeper insight concerning:

     •    The technological strengths of the regions
     •    Linkages between researchers within the STRING region
     •    Interesting linkages within technologies

1.3       BAK Technology Approach

The BAK Economics technology approach, developed jointly with the Swiss Federal In-
stitute of Intellectual Property, breaks new ground by basing measurement on patent
quality and refined technologies.8 The underlying patent database is the OECD Regpat
database which covers all patents that have been filed by at least one of the large
international patent offices (EPO, USPTO or PCT).9

The definition of technology fields has been refined since the classical technological
definition of technology fields by the World Intellectual Property Organization (WIPO)
does not cover the latest technological trends anymore. Therefore, a new list of cutting-
edge technologies that have an increasing impact on economic development in the
coming years has been developed. It is possible to specifically show where STRING and
its geographic regions are positioned in these cutting-edge technologies, which com-
panies are technology leaders, and what the key technologies are.

In this study, the patents are identified and counted according to the reporting date
concept – all active and published patent families and applications are counted at a
specific point in time. This approach differs from other patent analyses (such as the
RIS) where only new patent applications per year are counted. Whereas the latter con-
cept focusses on the dynamics of patent development, the approach used in this study
focusses on the absolute size and strength of a patent portfolio at a given date. For

8 Patents are analysed according to the researcher’s address on the patent filed. This approach allows for the identifi-
  cation of the region where the research has taken place and circumvents the potential problems arising from inter-
  national companies which apply for patent ownership via their headquarters.
9 EPO: European Patent Office; USPTO: US Patent and Trademark Office; PCT: Patent Cooperation Treaty

                                                                                                                     10
example, the reporting date 2016 (31. December) includes all patents and pending
applications up to this day. Still, active patents from all previous years are included.
When analysing the research capabilities of regions, it is important not only to look at
the number of patents (= the quantity of research) but also to take the quality of re-
search into account. The patent strength is evaluated for each individual patent world-
wide and is comprised of two components: the patent activity and the patent quality.
Fig. 1-2 Measuring patent strength: technological quality and market coverage
Patent Quality Patent Activity
Individual Patent Strength
Technological Relevance Market Coverage
External Assessment – How do Internal Assessment – How do Patent strength is the product of
competitors assess the importance patent owners assess the technology relevance and market
of a patent importance of their own invention coverage and is calculated for
every single patent worldwide.
Definition: Worldwide citations Definition: The number of
from other patents, adjusted for X countries protected by patents and = The patent strength shows the
age and patent office practices patent applications, adjusted for relative value of a patent
market size. compared to all other patents
worldwide within the same
Argument: the more often other technology.
patents refer to one patent, the Argument: the coverage of
higher the technological relevance intellectual property per country is
of that patent compared to other cost intensive. Patent owners will
patents within one technology seek a wide coverage only for
promising patents
Source: BAK Economics, IGE, PatentSight
The patent quality corresponds to the relevance of the technology and shows how im-
portant an invention is in comparison with other patents in the corresponding technol-
ogy (competitor’s assessment) based on the references and citations by third parties.
The patent activity corresponds to the market coverage, i.e. the statutory coverage of
the patent protection, and shows how companies assess the importance of their own
inventions. Since international patent protection is costly, extensive international mar-
ket coverage signals that a patent is promising (self-assessment).
Taken together, patent quality and patent activity comprise the overall evaluation of
the patent or patent portfolio and can be evaluated according to specific technologies.
The result is a rating in deciles where the top 10% of patents in the 50 most research-
intensive countries in every technology are defined as world-class patents.
In today’s research and technology environment, linkages and technology combina-
tions play an increasingly important role in the innovation process, due to knowledge
spillover and new dynamics made possible by digitization. The BAK technology ap-
proach can identify existing research networks and useful technology combinations.
A patent is the fruit of research usually carried out by more than one researcher, often
by more than one company or institution. It must be noted that a university, research
institute or company can only be identified as connected to a patent if it is named as
(co-) owner of the patent. However, patenting strategy can differ quite substantially
between research institutes and universities across countries.
Apart from shared ownership, many patents belong to more than one technology. This
is because patents are often relevant for more than one technology. The International
11Patent Classification (IPC) system currently consists of more than 70,000 classes.
Technologies are defined by grouping relevant patent classes.
1.4 Structure of the analysis
In chapter 2, a technology profile is defined for the Oslo region, West Sweden, Øresund
and the region of Hamburg as well as for the entire STRING region. The technology
profiles of these regions are compared in order to identify common strengths and to
discover technological differences. In addition, the top research companies and re-
search institutes are listed. As a result, this first chapter gives a detailed overview of
the intellectual assets in STRING.
Chapter 3 examines the research performance of STRING in green technologies. The
technology profiles based on these technologies show which green technologies are
important for STRING and the four analysed regions. The profiles also reveal which
green technologies have experienced high patent growth rates in recent years and
which technologies exhibit a high level of research efficiency. Moreover, the results of
STRING are compared with the San Francisco Bay Area – an innovation leader in green
technologies.
In the next part, the focus is on research interdependencies. First, the relevance of
patents involving scientists from more than one of the four regions has been analysed.
Moreover, patents with more than one owner have been filtered out to see whether co-
ownership patents have a higher average quality than single-owner patents.
Promising technology combinations make up the chapter 5. Patents are often not only
relevant to one specific technology, but rather two or more technologies. Therefore,
some patents are counted in more than one technology field. It is assumed that inno-
vations not only emerge from brand new technologies, but also emerge from the intel-
ligent linking of existing technologies, among other ways.
Based on the focus technologies of the four regions and STRING, an analysis of poten-
tial combinations between technologies has been performed to identify which combi-
nations lead to better results in terms of a better ranking of the respective patents.
The final chapter of the study consists of a conclusion based on the findings obtained.
122 Technology analysis of the four regions (Oslo region,
West Sweden, Øresund, Hamburg region) and the en-
tire STRING region
The results of the Regional Innovation Scoreboard (RIS) in chapter 1 show that STRING
is rated as an innovation leader in the EU concerning intellectual assets. This chapter
gives an overview in which specific technology fields the intellectual assets of STRING
and the four regions (Oslo region, West Sweden, Øresund and Hamburg region) are
located. To achieve this, technology profiles have been created that identify common
strengths and show technological differences. Finally, a list of the top research compa-
nies and universities/research institutes in STRING is presented.
2.1 Overview
Total patent numbers
The regions of STRING are active in many different technology areas from transport
technologies to Life Sciences to Clean Tech solutions. The research strength of STRING
is reflected in its large and increasing patent numbers.
In 2016, there were almost 60,000 active patents in STRING according to the OECD
Regpat Database. Øresund has the largest patent portfolio among the four analysed
regions with a total of almost 25,000 active patents. The Hamburg region is in second
place with a total of 18,000 patents. West Sweden (more than 11,000 active patents)
and the Oslo region (more than 5,500 total patents) complete the list. Øresund also
has the highest share of world-class patents, whereas the Hamburg region has the
lowest share of world-class patents.
Fig. 2-1 Portfolio size/Patent intensity
Portfolio size 2016 Patent intensity 2016
STRING Øresund
Øresund West Sweden
Hamburg STRING
Other Patents
West Sweden Hamburg
World class Patents
Oslo region Oslo region
0 20000 40000 60000 0 2 4 6 8
Portfolio size: Total number of active patents in 2016 by region
Patent intensity: Number of total active patents per 1’000 inhabitants in 2016
Sources: BAK Economics, Swiss Federal Institute of Intellectual Property
13Patent intensity
The indicator of patent intensity measures the number of patents divided by the resi-
dent population. Øresund achieves the best results again. In 2016, there were 6.3
patents per 1,000 inhabitants in Øresund. West Sweden has the second-highest pa-
tent intensity with 5.8 patents per 1,000 inhabitants. In STRING in total, this number
is 4.8. The Hamburg region, which is the largest region, has a patent intensity of 3.7
patents per 1,000 inhabitants. The Oslo region, which is the smallest region, also has
the lowest patent intensity with 3.1 patents per 1,000 inhabitants.
Patent growth
The comparison over time shows the dynamics of the regional patent portfolio. Since
2000, the number of active patents has more than doubled in Øresund and the Oslo
Region. The Hamburg region and West Sweden performed below the average of
STRING. However, between 2000 and 2016, they both still had total growth in patents
of 85% and 75% respectively. It must be noted, nonetheless, that patent growth has
somewhat slowed down in all regions in recent years. The main reason for this slow-
down is that Life Sciences patent growth has decelerated noticeably in the same time
period (see chapter 2.2 for more details).
Fig. 2-2 Total patent growth
25000 225
Oslo region
Oslo Region
West Sweden West Sweden
Øresund Øresund
200
Hamburg Hamburg
20000
STRING
175
15000
150
10000
125
5000
100
0 75
Left side: Number of total active patents from 2000 – 2016,
Right side: Patent growth between 2000 and 2016, 2000 = 100
Sources: BAK Economics, Swiss Federal Institute of Intellectual Property
Øresund and Oslo are also the two leading regions in terms of world-class patent
growth. In the Hamburg region, the number of world-class patents has increased at a
slower rate than the number of total patents. As a result, its share of world-class pa-
tents of total patents has decreased slightly, whereas it has risen in the other regions.
14Fig. 2-3 World-class patent growth
2500 275
Oslo Region
Oslo region 250 West Sweden
West Sweden
2000 Øresund
Øresund
225 Hamburg
Hamburg
STRING
200
1500
175
1000
150
125
500
100
0 75
Left side: Number of total active world-class patents from 2000 – 2016,
Right side: World-class patent growth between 2000 and 2016, 2000 = 100
Sources: BAK Economics, Swiss Federal Institute of Intellectual Property
2.2 Technology profiles
The technology profiles for STRING and its four member regions show the most relevant
technologies in terms of patent numbers, their patent growth since 2010 and their
research efficiency. These technologies are called “focus technologies” in the remain-
der of the text.
The focus technologies that make up the technology profiles are mainly based on the
new BAK “cutting edge” technologies that were developed together with the Swiss Pa-
tent Office. These technologies are designed to highlight significant new developments.
The cutting-edge technologies are a subset of the broader traditional WIPO10 catego-
ries. In addition, the WIPO category of Transport was selected because it is a key tech-
nology field for STRING, and it is not covered sufficiently by the cutting-edge technolo-
gies.
BAK Technology areas
The BAK cutting edge technologies can be divided into five general technology areas:
Life Sciences, Materials, Systems, Energy and Digital/IT.
Digital/IT: Digital technologies are an important and fast-growing component of the
BAK cutting-edge technologies. From Digital Medtech to Fintech to Data Security to
Machine Learning and to the Internet of Things, digital technologies are increasingly
gaining relevance in various areas of the economy.
Life Sciences: Life Sciences is one of the most mature areas of cutting-edge technology
and there are sizeable research activities in all analysed regions. This is reflected in
10WIPO: World Intellectual Property Organization: Concept of a Technology Classification for Country Comparisons
(2008); https://www.wipo.int/export/sites/www/ipstats/en/statistics/patents/pdf/wipo_ipc_technology.pdf
15the very high number of patents. Life Sciences include technologies that deal with the
processes or structures of living beings.
The most important technologies in Life Sciences are Pharma, Biotech, and Medtech.
Biotech is further subdivided in Biotech Red, Biotech Green, and Biotech White. Bio-
tech Red refers to all medical applications of biotech such as regenerative medicine,
gene therapy, cell therapy, and medicines based on biological molecules such as ther-
apeutic antibodies. Biotech White involves the use of biotech in industrial processes
(therefore sometimes also called industrial biotech) such as the production of new
chemicals and materials or the development of new fuels for vehicles. Biotech Green
includes all biotech applications related to agriculture, including the development of
genetically modified organisms (GMOs) which are plants, animals or microorganism
that are modified by using genetic engineering. GMOs are mainly used to create more
fertile and resistant crops, seeds, or plants. The production of bio-fertilizers and bio-
pesticides also belong to the Biotech Greenfield.
Systems: The area systems includes diverse technologies such as Autonomous Driv-
ing, Additive Manufacturing (with 3D-printing as the major application), Electric & Hy-
brid Vehicles, Drones, Sensors, or Hearing Aids. It also contains certain green technol-
ogies such as Recycling Waste Reuse and Wastewater Treatment.
Energy: The energy category consists of novel technologies that deal with the genera-
tion, conversion or storage of energy. For example, various types of batteries, but also
Wind Energy technology, belong to this category. Clean Tech is another important En-
ergy technology (see chapter Green Technologies for more details).
Materials: Materials include technologies that deal with the research, development,
production, and use of novel materials. Material Science is a blanket term for these
novel materials. These novel materials include, for example, smart polymers that
change according to their environment, based on factors such as temperature or hu-
midity. These polymers are used in many different applications including sensors, ac-
tuators, the production of hydrogels or drug delivery. Additive Manufacturing (3D-Print-
ing) Materials is another materials technology.
These materials technologies are mostly in the early stages of their growth and this is
reflected in the relatively small number of patents attributed to the segment. However,
there are high expectations for growth in Material technologies and research activities
are expected to intensify in the coming years.
The following table gives an overview of all cutting-edge technologies that were se-
lected as focus technologies and/or green technologies for this report. A short descrip-
tion of all the different single technologies is included in the appendix.
16Tab. 2-1 Technology Overview
Technology Areas Technologies
Digital/IT Blockchain, Data Security, Digital Medtech, Electronic Gaming, Image
Analysis, IoT: Smart Factory (Machine to Machine), IoT: Smart House,
IoT: Smart City, FinTech Wealth Management, Machine Learning/Arti-
ficial Intelligence, Prevent & Predictive Maintenance, Process Automa-
tion, Quantum Computer, Speech Analysis
Life Sciences Biotech Green, Biotech Red, Biotech White, Medtech, Pharma
Systems Additive Manufacturing (3D Printing), Advanced Manufacturing, Au-
tonomous Driving, Carbon Capture, Collaborative Robotics, Cosmo-
nautics, Drones, Electric & Hybrid Vehicles, Hearing Aids, Nanostruc-
tures, Recycling Waste Reuse, Sensors, Wastewater Treatment, Wear-
ables
Energy Biomass Fermentation, Clean Tech, Energy Storage, Energy Conver-
sion, Energy Generation, Fuel Cells, Lithium Battery/NiMH Battery,
Smart Grid, Solar Energy, Organic Perovskite Solar Cells
Materials Material Science, Smart Polymers, Additive Manufacturing Materials
Sources: BAK Economics, Swiss Federal Institute of Intellectual Property
Selection of focus technologies
In order to identify the focus technologies for each region, three selection criteria were
used:
- Number of patents
- Level of specialization compared to Western Europe
- Patent growth
The top ten technologies in terms of patent numbers in 2016 were chosen for each
region (blue colour in Tab. 2-1 and following). Second, five technologies with the high-
est specialization index, not already included because of their size, were selected (grey
colour). The specialization index was calculated by comparing the share of each tech-
nology of total patents to the average in Western Europe. Values higher than one show
above-average specialization, values lower than one reflect below-average specializa-
tion. Third, the five technologies with the highest average patent growth between 2010
and 2016, not already included due to the other two criteria, were added (red colour).
In addition, the WIPO technology Transport was selected for all regions, because it is a
key technology in STRING. The technology profile graphs in the remainder of this sec-
tion exclude technologies that had less than 10 active patents in 2016.
172.2.1 Oslo Region
Tab. 2-2 Technology selection for the Oslo region
Focus technologies in the Oslo region, number of patents in 2016, specialization index in 2016, annual growth be-
tween 2010 and 2016
Sources: BAK Economics, Swiss Federal Institute of Intellectual Property
The table above shows the focus technologies for the Oslo region based on patent
data. The largest technologies are Transport, Pharma, Medtech and Biotech Red. GE
with its subdivision GE Vingmed Ultrasound is one of the leading research companies
in Oslo that has developed many Pharma and Medtech patents. The company focuses
on the manufacturing of radiographic X-ray, fluoroscopic X-ray, and therapeutic X-ray
apparatus and tubes.
Other specialized technologies in Oslo are Advanced Manufacturing and Drones. Ad-
vanced Manufacturing technologies introduce network components to production ma-
chines (or industrial robots) along with other features from fields such as artificial in-
telligence, automatic programming, and smart grids. However, total patent numbers in
both Advanced Manufacturing and Drones are still relatively small in the Oslo region.
The highest annual patent growth rates between 2010 and 2016 were recorded in
Drones, Smart City, and Wearables. “Wearables” is a blanket term for electronics that
can be worn on the body. Some of the most popular devices are activity trackers and
smart watches. One of the major features of wearable technology is its ability to con-
nect to the Internet, enabling data to be exchanged between a network and the device.
18Fig. 2-4 Technology profile of the Oslo region
Bubble size: Number of total patents in a technology in 2016
Sources: BAK Economics, Swiss Federal Institute of Intellectual Property
Reading Example:
A technology profile, like the one depicted in figure 2-4, can be read as follows: The
vertical axis shows the share of world-class patents compared to the number of total
patents in a technology. The higher the share, the higher the research efficiency. The
horizontal axis shows the growth of patent numbers in a technology between 2010
and 2016 (per year in %). The bubble size represents the number of total patents in
a technology in 2016.
For example: There are more patents in Sensors than in Drones. The research effi-
ciency is higher in Sensors, however, the number of patents in Drones grew more
robustly.
The technology profiles are coloured as follows: Life Sciences technologies are repre-
sented by green bubbles, Material technologies have orange bubbles, Systems are
coloured red, the Energy Sector is represented by yellow bubbles, all Digital technol-
ogies are blue, and Transport is purple.
The key technologies in the Oslo region mostly belong to the Life Sciences and the
Energy Sector. These technologies are also leading in terms of research efficiency, but
patent growth was only modest between 2010 and 2016.
Another important regional technology is Transport. With a share of world-class patents
of almost 13%, the Oslo region has the highest research efficiency in Transport of all
the analysed regions in this report. The Oslo region is also a global leader in the adop-
tion of plug-in and electric vehicles. The city of Oslo has the world’s highest number of
Electric Vehicles per inhabitant and is, therefore, often called the “EV Capital of the
19World”.11 This development was supported by tax incentives for EVs in Norway as well
as free parking, free charging and free tunnels in the city of Oslo.
A specific strength in the Oslo region is Sensors. With 286 patents in 2016, 5.2% of all
patents in the Oslo region are Sensor patents, compared to only 3.1% in STRING. The
most important research related to Sensors in the Oslo region has its roots in the oil
and gas industry as can be seen by the top research companies Schlumberger, Petro-
leum Geo-Services, and Equinor.
Image analysis is another regional strength in the Oslo region. Patent growth in this
technology was high between 2010 and 2016 and research efficiency is already above
average. The top regional research companies in this field are Cisco, Idex ASA, and
Hexagon.
The two technologies with the strongest patent growth are Drones and Smart City, with
annual growth rates of 20.8% resp. 12.9% between 2010 and 2016. Smart cities use
different types of electronic data collection sensors to supply information that is then
used to manage assets and resources efficiently. This includes data collected from
citizens, devices, and assets that is processed and analysed to monitor and manage
traffic and transportation systems, power plants, water supply networks, waste man-
agement and other services. There are a wide range of Smart City projects in the Oslo
region such as the Climate Dashboard that visualizes climate and environmental data,
such as bicycle and pedestrian counts, use of charging stations for electrical vehicles,
and air quality. The goal is to develop a more climate-friendly city, by referring directly
to the statistics and trends.12
11 http://news.trust.org/item/20180307114110-a0cqx/
12 https://www.oslo.kommune.no/politics-and-administration/smart-oslo/projects/climate-dashboard/#gref
202.2.2 West Sweden
Tab. 2-3 Technology selection for West Sweden
Focus technologies in West Sweden, number of patents in 2016, specialization index in 2016, annual growth be-
tween 2010 and 2016
Sources: BAK Economics, Swiss Federal Institute of Intellectual Property
The table above shows the focus technologies of West Sweden. Transport is by far the
largest regional technology, followed by Medtech and Clean Tech.
Moreover, West Sweden is highly specialized compared to the Western European av-
erage in Drone, Additive Manufacturing (3D-Printing) Material and Autonomous Driving.
The share of patents in these technologies of total patents is roughly four, respectively
three times the size of the share of these technologies in Western Europe.
High annual growth rates are shown in the technologies Prevent & Predictive Mainte-
nance, Smart Grid, Electro & Hybrid Vehicles, and Autonomous Driving.
21Fig. 2-5 Technology profile of West Sweden
Bubble size: Number of total patents in a technology in 2016
Sources: BAK Economics, Swiss Federal Institute of Intellectual Property
In West Sweden, Transport is the largest tech field with more than 1,600 patents in
2016. However, research efficiency in Transport is below average and patent growth
was only moderate in recent years. Volvo, Geely (Owner of Volvo Cars) and Autoliv are
key research companies in Transport in West Sweden.
Medtech is the second-biggest category with over 1,100 patents. But most Life Sci-
ences technologies including Medtech have had negative patent growth rates in West
Sweden in recent years. Hygiene and health company Essity currently holds most
Medtech patents in West Sweden.
Autonomous Driving and Electro/Hybrid Vehicles are both fast growing technology
fields in West Sweden. Volvo and Geely are the top research companies in West Swe-
den in these tech fields. Volvo Cars released its first all-electric vehicle in 2019 and
promised that 50% of its cars will by electric by 2025. Moreover, Volvo Cars is planning
to offer self-driving cars soon. The company is cooperating with Uber on autonomous
driving. Moreover, Volvo Cars has struck a deal with Chinese technology giant Baidu to
develop electric cars for use in a Chinese autonomous taxi fleet.
Borealis, which produces polyethylene (PE) and polypropylene (PP), is an innovator in
Material technologies and enhances West Sweden’s strength in Materials.
Additive Manufacturing (with its major application of 3D-Printing) and Image Analysis
are two promising areas in West Sweden. While total patent numbers in these technol-
ogies are still modest, they are growing fast and have a very high research efficiency.
GE and Danaher are top research companies in Additive Manufacturing in West Swe-
den.
222.2.3 Øresund
Tab. 2-4 Technology selection for Øresund
Focus technologies in Øresund, number of patents in 2016, specialization index in 2016, annual growth between
2010 and 2016
Sources: BAK Economics, Swiss Federal Institute of Intellectual Property
The table above shows the focus technologies for Øresund. The largest technologies
are Medtech, Pharma, Biotech Red and Clean Tech.
Compared to Western Europe, Øresund is highly specialized in Hearing Aids, Smart
Factory, all Life Sciences Technologies, Wearables, and Electronic Gaming.
The technologies with the highest annual growth rates between 2010 and 2016 were
Additive Manufacturing Material, Wearables, Prevent & Predictive Maintenance, Smart
Polymer, and Electro & Hybrid Vehicles.
23Fig. 2-6 Technology profile of Øresund
Bubble size: Number of total patents in a technology in 2016
Sources: BAK Economics, Swiss Federal Institute of Intellectual Property
Øresund is outstanding in Life Sciences, especially in Medtech (2,459 patents in
2016), Pharma (2,371 patents), and Biotech Red (1,755 patents). In addition, Biotech
White has by far the highest research efficiency. Novozymes and Novo Nordisk are
Øresund’s research engines in Biotech White. Novozymes produces industrial enzymes
that help to reduce costs and improve productivity in manufacturing processes of var-
ious goods. Roche has developed many patents in Biotech Red (medical applications
of Biotech) in Øresund. The Roche Innovation Center Copenhagen is a leader in the
rapidly emerging field of RNA (ribonucleic acid)-targeted drugs. Coloplast and Cook
Group are top Medtech research companies in the region. However, patent growth in
most Life Sciences technologies was relatively weak between 2010 and 2016.
By contrast, some upcoming technologies such as Additive Manufacturing Material and
Wearables saw robust patent growth.
Compared to the other analysed regions, Øresund is uniquely strong in Hearing Aids
and Smart Factory. Both technologies have more than 700 patents each and grew al-
most 10% per year between 2010 and 2016. Moreover, there is a high regional spe-
cialization in Hearing Aids compared to the Western Europe average. The top research
companies in Hearing Aids are Oticon, WS Audiology, and GN Store Nord.
Øresund also has many Data Security patents (450 patents in 2016). Due to the steady
presence of major software and hardware companies such as Nokia, Motorola Solu-
tions and Canon, Øresund has long been a hub for innovation in digital technologies.
The technology Wearables is another strength in Øresund. The top research companies
in Wearables are BlackBerry, WS Audiology, and Oticon.
242.2.4 Hamburg Region
Tab. 2-5 Technology selection for the Hamburg region
Focus technologies in the Hamburg region, number of patents in 2016, specialization index in 2016, annual growth
between 2010 and 2016
Sources: BAK Economics, Swiss Federal Institute of Intellectual Property
The focus technologies for the Hamburg region are depicted in the table above.
Transport, Pharma, Medtech and Clean Tech are the technologies with the highest
number of active patents in the Hamburg region in 2016 with over 1,500 patents each.
The Hamburg region is highly specialized compared to Western Europe in Cosmo-
nautics, Smart Grid, Pharma, Transport, Medtech and Clean Tech.
The technologies with the highest patent growth in the period between 2010 and 2016
were Additive Manufacturing Materials, Wearables, Additive Manufacturing and Cos-
monautics.
25Fig. 2-7 Technology profile of the Hamburg region
Bubble size: Number of total patents in a technology in 2016
Sources: BAK Economics, Swiss Federal Institute of Intellectual Property
Transport is the most important technology in terms of patent numbers. Airbus,
Thyssenkrupp, Autoliv, and Jungheinrich are key companies. Hamburg is the largest
German aviation industry hub and along with Toulouse, Europe’s most important.
Energy patents rose annually by almost 10% between 2010 and 2016. There is also
high research efficiency in Fuel Cells, Smart Grid and Energy Conversion. The top re-
search companies in the Energy Sector are Airbus and Nordex.
The Hamburg region also has several companies/research institutes that are doing
research in Material Science, such as Airbus, Beiersdorf, and Helmholtz Association.
The technology Additive Manufacturing Material stands out in the Hamburg region with
its high annual growth rate of over 45% since 2010. The closely connected technology
Additive Manufacturing (with its major application 3D-Printing) also developed dynam-
ically. The top research companies in these two technologies are Airbus, SLM Solu-
tions, and Siemens. Airbus is increasingly using 3D printing to produce aircraft compo-
nents. By using 3D printing, certain parts can be produced quicker and less expensive
than with conventional moulding techniques. Moreover, 3D-printed parts can be made
lighter in weight. In the future, 3D printing is expected to gain further relevance not
only in aviation, but also in areas such as Medtech and construction.
Another interesting technology in the Hamburg region is Cosmonautics. It is still a ra-
ther small technology, but it showed annual growth rates of nearly 20% between 2010
and 2016. Airbus Defence and Space is a division of Airbus responsible for defence
and aerospace. The division is the world's second largest space company after Boeing.
Even though it is still a rather small technology and does not yet belong to the special-
ized technologies in the Hamburg region, Wearables showed strong growth in recent
years. The research of Draegerwerk in Hamburg is one reason for this development
262.2.5 STRING
Tab. 2-6 Technology selection for STRING
Focus technologies in STRING, number of patents in 2016, specialization index in 2016, annual growth between
2010 and 2016
Sources: BAK Economics, Swiss Federal Institute of Intellectual Property
The table above shows the focus technologies for STRING. Medtech, Pharma,
Transport and Clean Tech are the technologies with the largest number of active pa-
tents in 2016.
There is a high specialization in STRING compared to Western Europe in all Life Sci-
ences technologies as well as in Hearing Aids, Additive Manufacturing Material and
Smart Factory.
The highest annual growth rates between 2010 and 2016 were recorded in Additive
Manufacturing Material, Wearables and Autonomous Driving.
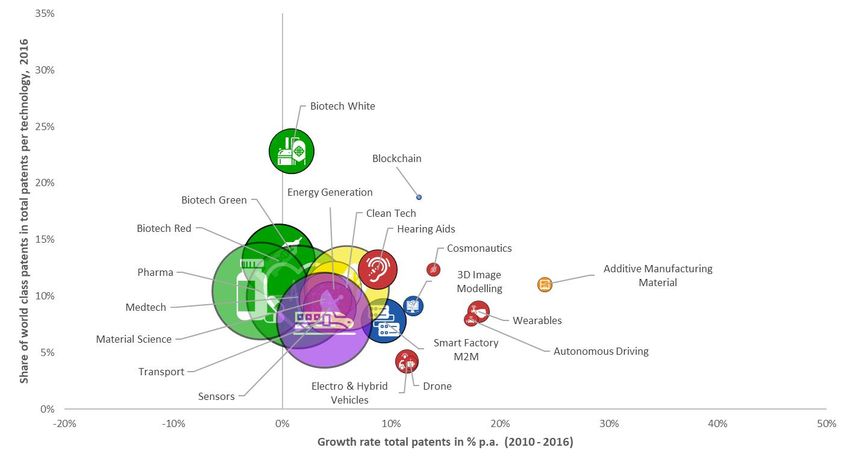
27Fig. 2-8 Technology profile of STRING
Bubble size: Number of total patents in a technology in 2016
Sources: BAK Economics, Swiss Federal Institute of Intellectual Property
The technology profile of STRING shows a great number of patents in Medtech,
Pharma, Biotech Red, Transport and Clean Tech. However, these technologies did not
have high growth rates between 2010 and 2016.
The development of patents in Life Sciences technologies follows a clear pattern. While
total patent numbers expanded rapidly between 2000 and 2010, they have stagnated
or even decreased since then. This trend can also be observed in many other regions
in developed countries. An explanation is that many Life Sciences patents were devel-
oped during the biotech boom related to the human genome project in the 1990s and
at the start of the new millennium. Many of these patents have expired by now or have
become obsolete due to technological advances. As patent protection is associated
with annual costs, companies do not extend coverage for outdated patents. This has
slowed down patent growth.
In terms of research efficiency, White Biotech is the top technology. White Biotech in-
volves the use of biotech in industrial processes such as the production of new chem-
icals and materials or the development of new fuels for vehicles. The top research
company in this tech field in STRING is Novozymes with 434 active patents in 2016.
While Life Sciences remains important in STRING, the development of patent numbers
suggests that other technology fields have the potential to achieve higher growth in the
coming years. For example, Additive Manufacturing Material, Wearables and Autono-
mous Driving all show very high patent growth. However, these technologies are still in
their early stages.
28You can also read