Draft Regional Roadmap 2013 16 Appendix
←
→
Page content transcription
If your browser does not render page correctly, please read the page content below
Draft Regional Roadmap 2013‐16 ‐ Appendix
                     Townsville and North West Queensland
  Boulia, Burdekin, Burke, Carpentaria, Charters Towers, Cloncurry, Doomadgee, Flinders,
 Hinchinbrook, Mornington Island, McKinlay, Mount Isa, Palm Island, Richmond, Townsville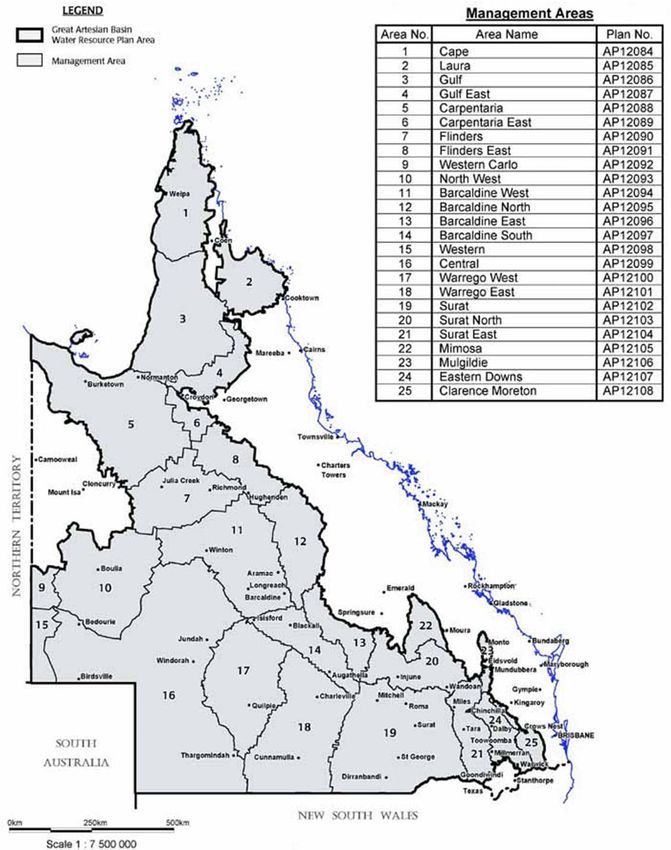
Draft Regional Roadmap 2013‐16 ‐ Appendix
TABLE OF CONTENTS – ATTACHMENT A

1      ANNEXURE ONE – REGIONAL PROFILE ........................................................................................... 6
    1.1        Summary – Our Region ........................................................................................................... 6
    1.2        KEY DETERMINANT ONE: HUMAN CAPITAL (EDUCATION AND SKILLS) ................................. 7
       1.2.1          Human Capital ................................................................................................................. 7
    1.3   KEY DETERMINANT TWO: SUSTAINABLE (ECONOMICALLY, ENVIRONMENTALLY AND
    SOCIALLY) COMMUNITIES AND POPULATION GROWTH .................................................................. 16
       1.3.1          Economic ....................................................................................................................... 16
       1.3.2          Environmental ............................................................................................................... 25
       1.3.3          Social ............................................................................................................................. 40
       1.3.4          Population ..................................................................................................................... 44
    1.4  KEY DETERMINANT THREE: ACCESS TO INTERNATIONAL, NATIONAL AND REGIONAL
    MARKETS ........................................................................................................................................... 47
       1.4.1          Remoteness................................................................................................................... 47
       1.4.2          Infrastructure ................................................................................................................ 48
       1.4.3          Telecommunications ..................................................................................................... 56
       1.4.4          Energy ........................................................................................................................... 60
       1.4.5    Social Services Infrastructure ‐ Hospitals, Aged Care, Emergency Services and
       Education ...................................................................................................................................... 64
    1.5        KEY DETERMINANT FOUR: COMPARATIVE ADVANTAGE AND BUSINESS COMPETITIVENESS
               66
       1.5.1          Business......................................................................................................................... 66
       1.5.2          Gross Regional Product (GRP) ....................................................................................... 69
       1.5.3          Imports and Exports ...................................................................................................... 73
       1.5.4          Net Exports.................................................................................................................... 75
       1.5.5          Cluster Mapping ............................................................................................................ 76
       1.5.6          Industry Areas ............................................................................................................... 79
    1.6   KEY DETERMINANT FIVE: EFFECTIVE CROSS‐SECTORAL AND INTERGOVERNMENTAL
    PARTNERSHIPS (INCLUDING THROUGH PLACE‐BASED APPROACHES) AND INTEGRATED REGIONAL
    PLANNING ......................................................................................................................................... 84
       1.6.1          Cross‐Sectoral and Intergovernmental Partnerships .................................................... 84
       1.6.2          Northern Queensland Strategy ..................................................................................... 84
       1.6.3          Integrated Regional Planning ........................................................................................ 85
2      ANNEXURE 2 – STAKEHOLDER CONSULTATION AND PARTNERSHIPS .......................................... 86
3      ANNEXURE 3: DESKTOP ANALYSIS OF REGIONAL PLANNING DOCUMENTS ................................ 89

                                                                                                                                           Page |2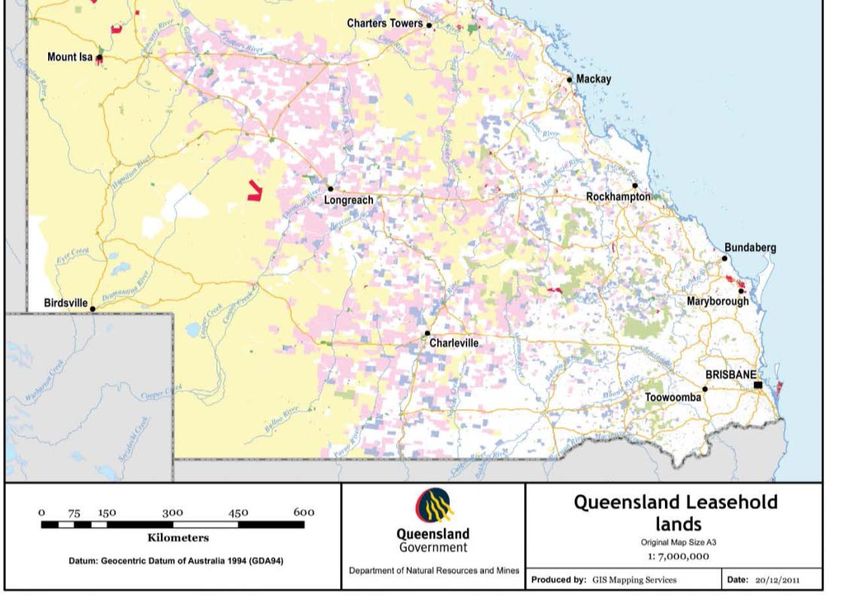
Draft Regional Roadmap 2013‐16 ‐ Appendix
4   ANNEXURE 4: REFERENCES (ATTACHMENT A) ............................................................................. 91
5   ANNEXURE 5: LIST OF ABBREVIATIONS ........................................................................................ 95

                                                                                                                  Page |3
Draft Regional Roadmap 2013‐16 ‐ Appendix
Index of Tables and Figures – ATTACHMENT A
Table 1: Count of early childhood education and care services by type, by Local Government 2011 ... 8
Table 2: Number of persons of highest level of schooling per Local Government area, 2011............... 9
Table 3: Post school qualifications by Local Government Area 2001 ‐ 2011 ........................................ 12
Table 4: VET student numbers by enrolment type by statistical area level 3 a) TVL and North West
RDA Region, 2011 ................................................................................................................................. 14
Table 5: Employment by occupation TVL and North West RDA Region, 2011 ..................................... 15
Table 6: Socio‐Economic Index of Disadvantage by Local Government area, 2011 ............................. 16
Table 7: Number of persons by total personal weekly income by Local Government area, 2011 ....... 17
Table 8: Occupied private dwellings by tenure type by Local Government area, 2011 ....................... 18
Table 9: Unemployment and labour force by Local Government area, December quarter 2012........ 18
Table 10: Workforce Participation Rate per Local Government, 2001, 2006, 2011 ............................. 19
Table 11: Employment by industry Townsville and North West RDA Region, 2011............................. 20
Table 12: Protected areas ‐ park and forest estate by Local Government area, TVL and North West
RDA Region, 2010 ................................................................................................................................. 33
Table 13: Major Storages Located in North West Queensland ............................................................ 36
Table 14: Surface Water related Water Resource Plans throughout the TVL and North West Region
and their servicing uses......................................................................................................................... 37
Table 15: Components of Population Change by Local Government Area, 30 June 2011 ................... 40
Table 16: Number of persons by birthplace by Local Government Area, 2011.................................... 41
Table 17: Estimated resident population by age by Local Government area, 30 June 2011 ............... 43
Table 18: Median age by Local Government area, 2006 and 2011 ...................................................... 44
Table 19: Estimated resident population by Local Government area, 2007, 2011 and 2012 .............. 45
Table 20: Projected population by statistical area level 3, Townsville and North West RDA Region,
2011 ‐ 2031 ........................................................................................................................................... 46
Table 21: Number of persons by Indigenous status by Local Government area, 2011 ........................ 46
Table 22: Population in remoteness areas by statistical area level 3, TVL and North West RDA Region,
2011 ...................................................................................................................................................... 47
Table 23: Ports in Townsville and North West Queensland ................................................................. 51
Table 24: Throughput Port of Townsville 2002/03 ‐ April 2013 ........................................................... 52
Table 25: Trade throughput at the Port of Lucinda .............................................................................. 53
Table 26: Internet Access per Local Government ................................................................................. 60
Table 27: Aged Care Services by Local Government area, TVL and North West RDA Region, 30 June
2010 ...................................................................................................................................................... 65
Table 28: Emergency services, schools and hospitals by Local Government area, TVL and North West
RDA Region, 30 June 2010 .................................................................................................................... 66
Table 29: Counts of registered businesses by industry, Townsville and North West RDA Region, 2010‐
11 .......................................................................................................................................................... 68
Table 30: Counts of registered businesses by turnover range by statistical area level 3, Townsville
and North West RDA Region 2010‐2011 .............................................................................................. 68
Table 31: Nominal gross regional product, current prices ($m), Queensland, 2000‐01, 2006‐07 and
2010‐11 ................................................................................................................................................. 69
Table 32: Composition of gross value added current prices, Northern 2000‐01 and 2010‐11 ............ 70
Table 33: Composition of gross value added, current prices North West 200‐01 and 2010‐11 .......... 72
Table 34: Building Approvals by Local Government ............................................................................. 83

                                                                                                                                              Page |4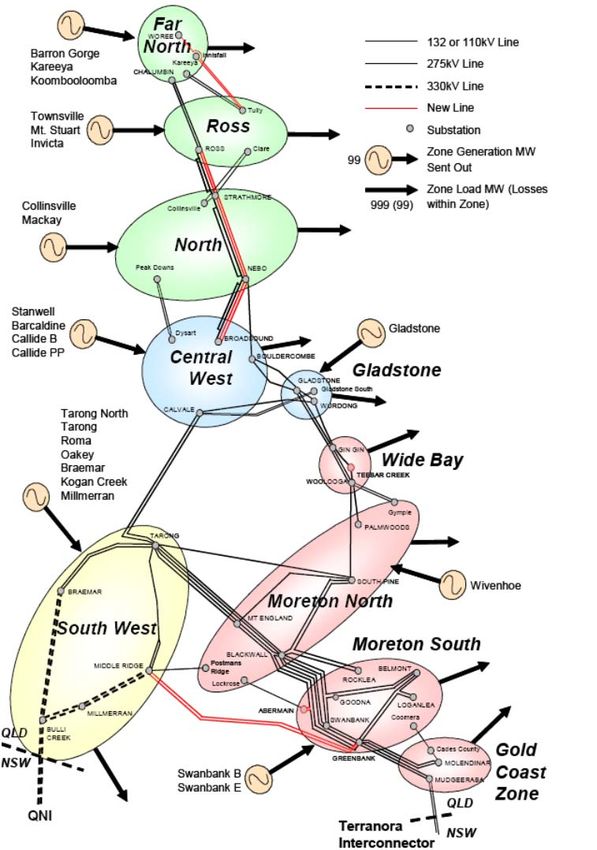
Draft Regional Roadmap 2013‐16 ‐ Appendix
Figure 1: Map of the Townsville and North West Regional Development Australia region ................... 6
Figure 2:RDA Townsville and North West Region (Ranked 50 out of 55 for Regional Competitiveness)
 ................................................................................................................................................................ 7
Figure 3: Proportion of employment by occupation a) TVL and North West RDA Region and
Queensland 2011 .................................................................................................................................. 15
Figure 4: Proportion of employment by industry a) TVL and North West RDA Region and Queensland,
2011 ...................................................................................................................................................... 21
Figure 5: Proportion of Unfilled Vacancies ........................................................................................... 23
Figure 6: Land tenured under lease arrangements, Queensland ......................................................... 32
Figure 7: Water Catchments, Dams and Weirs in Townsville and North West RDA Region ................ 35
Figure 8: Great Artesian Basin Management Areas, Queensland ........................................................ 39
Figure 9: Map of the road network throughout the Townsville and North West Region .................... 49
Figure 10: Queensland Rail Network in Townsville and North West Queensland ............................... 51
Figure 11: Commercial Flight Routes Ex‐Townsville Airport ................................................................. 54
Figure 12: Townsville Airport Passenger Statistics 1999 ‐ 2010 financial years ................................... 54
Figure 13: Commercial Flight Routes Ex‐Mount Isa Airport ................................................................. 55
Figure 14: Mount Isa Airport Passenger Statistics 1999 ‐ 2010 financial years .................................... 56
Figure 15: Ten geographical zones in the Queensland Electricity Network ......................................... 63
Figure 16: North West Growth in Real Gross Value Added, 2000 ‐ 2001 to 2010 ‐ 2011..................... 71
Figure 17: North West Growth in Real Gross Value Added, 2000‐2001 to 2010‐2011 ........................ 73
Figure 18: Estimates of Exporting Industries in the Townsville and North West Queensland Region
(2008‐09) ............................................................................................................................................... 74
Figure 19: Estimates of Importing Industries of the Townsville and North West Queensland Region
(2008‐09) ............................................................................................................................................... 75
Figure 20: Cluster Mapping of Industries in the Townsville and North West Queensland Region, 2006
(close up map ‐ excluding mining) ........................................................................................................ 77
Figure 21: Cluster mapping of industry in Townsville and North West Queensland Region, 2006
(including mining) ................................................................................................................................. 78

                                                                                                                                                 Page |5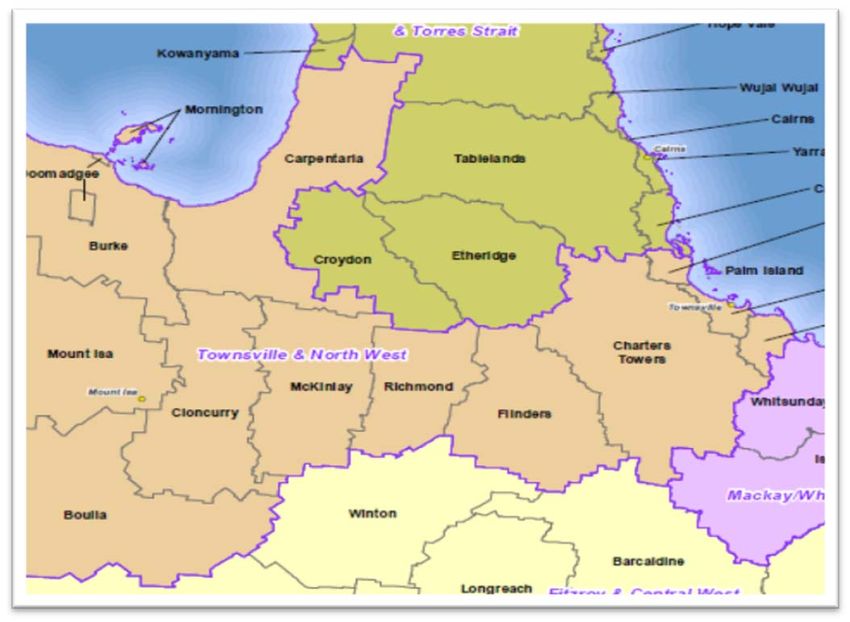
Draft Regional Roadmap 2013‐16 ‐ Appendix
1 ANNEXURE ONE – REGIONAL PROFILE
1.1 SUMMARY – OUR REGION
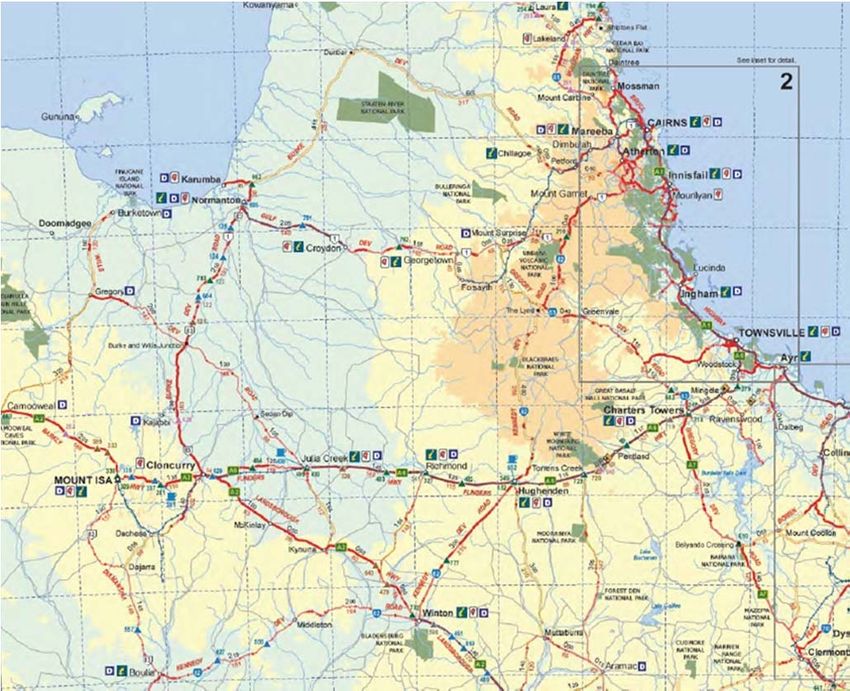
The Townsville and North West Queensland Region is a large area encompassing 449,190.9 km2
traversing across the centre of the state from the outback to the coast (Queensland Government,
Treasurey and Trade Government Statistician, June 2013). As shown in Figure 1, this area represents
the 15 Local Government areas of Townsville, Palm Island, Hinchinbrook, Burdekin, Charters Towers,
Flinders, Richmond, McKinlay, Cloncurry, Mount Isa, Boulia, Doomadgee, Mornington Island, Burke
and Carpentaria.
Figure 1: Map of the Townsville and North West Regional Development Australia region
Regional competitiveness indicators as published by the Regional Development Australia Institute,
suggest that the Townsville and North West Region is ranked 50th out of Australia’s 55 Regional
Development Australia regions. The biggest area of advantage is institutions, where the region is
ranked 8th out of 55 regions. Followed by innovation and business sophistication, 14th and 15th
respectively. Figure 2, demonstrates the region’s determinants affecting its regional
competitiveness (Regional Development Australia Institute ‐ Insight, 2013).
Page |6
Draft Regional Roadmap 2013‐16 ‐ Appendix
Figure 2:RDA Townsville and North West Region (Ranked 50 out of 55 for Regional Competitiveness)

Figure 2, also demonstrates that the region as a whole is uncompetitive in the natural resources field
and infrastructure and essential services.

1.2 KEY DETERMINANT ONE: HUMAN CAPITAL (EDUCATION AND SKILLS)
1.2.1    Human Capital
         1.2.1.1    Child Care
                    The Australian Early Development Index (AEDI) measures young children’s
                    development across five domains: physical health and well‐being; social
                    competence; emotional maturity; school‐based language and cognitive skills; and
                    general knowledge. 2009 AEDI data indicated at a national level, 23.6 per cent of
                    children were vulnerable on one or more domain and 11.8 per cent were
                    vulnerable on two or more domains. The AEDI found that the AEDI community of
                    Flinders had the lowest proportion of vulnerable children for the region, less than
                    the national rates on both measures. However, except for Richmond, all other
                    AEDI communities demonstrated vulnerability rates higher than the national
                    averages on both measures. The AEDI communities of Burke, Carpentaria and
                    Dalrymple had the highest proportions of vulnerable children (The Office of
                    Regional Education, Skills and Jobs , July 2012).
                    Preliminary consultations undertaken by DEEWR with stakeholders in the region
                    have revealed a degree of uncertainty in the early childhood education and care
                    sector in light of legislative changes surrounding the National Quality Framework
                    established in January 2012. The changes aim to raise the quality of care in the
                    sector and to introduce continuous improvement frameworks. The industry will
                    need to be responsive to potential outcomes such as current employees choosing
                    to leave the sector rather than complete further education, and will need

                                                                                                   Page |7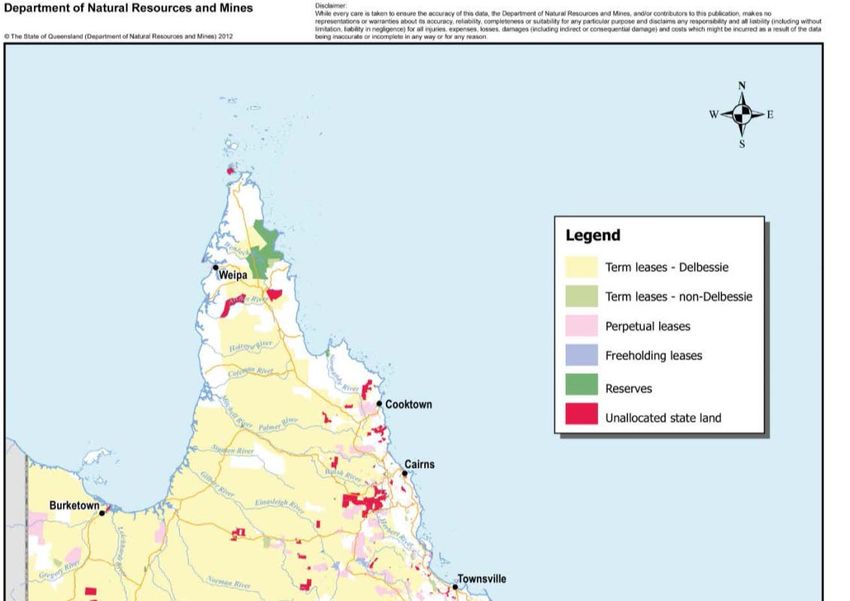
Draft Regional Roadmap 2013‐16 ‐ Appendix
          strategies to attract and retain new workers. There is a need to provide
          coordination and support to the sector as it transitions to the new arrangements
          (The Office of Regional Education, Skills and Jobs , July 2012).
          As Table 1, the majority of child care services are located in Townsville, followed by
          Charters Towers – Ayr – Ingham areas. Community consultation suggests that
          there is a lack of childcare facilities in the Mount Isa region, not only in provision
          but offering flexible service to accommodate shift workers.
          Table 1: Count of early childhood education and care services by type, by Local Government 2011

           (Queensland Treasury and Trade ‐ Government Statistician, 2013)

 Local             Family       Kindergartens   Long        School      Limited         Child Care   Total early
 Government        Day                          Day         Aged Care   Hours           and Family   childhood
 Area              Care                         Care                    Care            Support      education
                                                                                        Hubs         & care
                                                                                                     services
                                                  ‐Number‐
 Boulia (S)                 0               0        0              0              0            0              0
 Burdekin (S)               1               3        6              0              0            0             10
 Burke (S)                  0               1        0              0              0            0              1
 Carpentaria (S)            0               1        2              0              0            0              3
 Charters                   0               3        3              2              0            0              8
 Towers (R)
 Cloncurry (S)              0               1          1            0              0            0              2
 Doomadgee (S)              0               0          1            0              0            0              1
 Flinders (S)               0               0          1            0              0            0              1
 Hinchinbrook               1               2          2            2              0            0              7
 (S)
 McKinlay (S)               0               0           1           0              0            0              1
 Mornington (S)             0               0           0           0              0            0              0
 Mount Isa (C)              1               6           4           3              0            1             15
 Palm Island (S)            0               0           1           1              0            0              2
 Richmond (S)               0               0           1           1              0            0              2
 Townsville (C)             4              17          73          30              2            0            126
 RDA – Tvl &                7              34          96          39              2            1            179
 NW Region
 Queensland            100               461     1,372           692              42           10          2,677
 RDA – Tvl &            7.0               7.4       7.0           5.6             4.8         10.0            6.7
 NW Region as
 % of Qld

1.2.1.2   Education and Schooling
          According to the 2011 Census data, formal education levels in the Townsville and
          North West Queensland region as a whole remain below the State and National
          average benchmarks. 50.9% of residents aged over 15 years completed high school
          to Year 11 or 12. This compares to a state average of 55.3%. Of residents aged
          over 15 years, 13,927 have not completed education beyond Year 8. The
          Australian Government sees these figures as an opportunity to improve education
          attainment levels in the region (The Office of Regional Education, Skills and Jobs ,
          July 2012).

                                                                                                     Page |8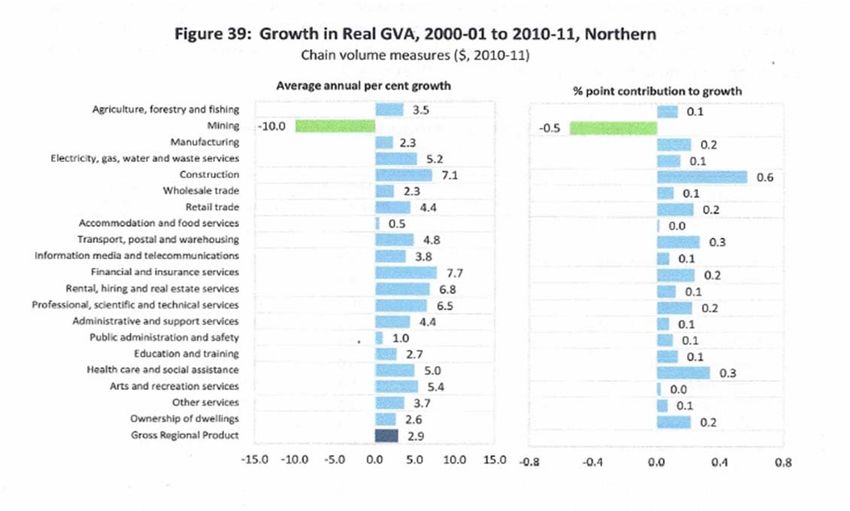
Draft Regional Roadmap 2013‐16 ‐ Appendix
Table 2: Number of persons of highest level of schooling per Local Government area, 2011

(Australian Government ‐ Bureau of Statistics, 2013)

Local Government     Did not go to        Year 9 or 10 or         Year 11 or 12 or        Total (b)
Area                 school, or Year 8    equivalent              equivalent
                     or below
                     Number %             Number       %          Number       %          Number
Boulia (S)                 63      17.0       156          42.2        117         31.6         370
Burdekin (S)            1,639      12.4     5,254          39.8      5,113         38.7      13,213
Burke (S)                  34       7.9       153          35.5        164         38.1         431
Carpentaria (S)           232      14.5       595          37.1        464         28.9       1,605
Charters Towers         1,080      12.1     3,275          36.8      3,570         40.1       8,904
(R)
Cloncurry (S)            217       8.7        777          31.0       1,093        43.7       2,503
Doomadgee (S)            150      19.1        433          55.0         192        24.4         787
Flinders (S)             204      14.8        516          37.5         522        37.9       1,377
Hinchinbrook (S)       1,319      14.5      3,317          36.5       3,646        40.1       9,094
McKinlay (S)              67       7.6        276          31.3         414        47.0         881
Mornington (S)           144      19.9        305          42.2         250        34.6         722
Mount Isa (C)            938       6.0      4,587          29.4       7,384        47.4      15,588
Palm Island (S)          287      18.4        662          42.5         573        36.8       1,556
Richmond (S)              79      12.3        249          38.7         240        37.3         643
Townsville (C)         7,474       5.7     39,018          29.6      72,659        55.1     131,856
RDA – Tvl & NW        13,927       7.3     59,573          31.4      96,401        50.9     189,530
Region
Queensland           219,102       6.6    977,116          29.4   1,836,995        55.3   3,320,761
RDA – Tvl & NW            6.4        ‐         6.1            ‐          5.2          ‐          5.7
Region as % of
Qld

According to the Office of Economic and Statistical Research, there were 44,847
school students in the region in 2009; 64.4 per cent attending a government school
and 35.6 per cent attending a non‐ government school. The corresponding
percentages for Queensland were 67.5 per cent and 32.5 per cent respectively. As
of 2010 there are 142 schools identified across the region (Queensland Treasury
and Trade – Government Statistician, 2013).
At the time of the 2006 Census there were 82,136 people aged 15 years and over
who stated that Year 11 or 12 (or equivalent) was their highest level of schooling
(46.4% of all people aged 15 years and over). This is similar to Queensland’s
average of 49.5 per cent. Townsville City had the highest proportion of people with
Year 11 or Year 12 (or equivalent) as their highest level of schooling (50.8%). At
the time of the 2011 Census, the region had 96,280 persons aged 15 years and
over whose highest level of schooling was year 11 or 12 (or equivalent),
representing 50.9 per cent of all persons aged 15 years and over (Queensland
Treasury and Trade – Government Statistician, 2013). Over the 5 year period
between Census information the percentage of persons aged 15 years and over
whose highest level of schooling was year 11 or 12 (or equivalent) rose by 4.5%.
These statistics indicate that there is potential to raise education levels for people
in the rural and more remote locations. In these more remote areas, students
often must leave their community in order to attend boarding schools and
complete Year 12 (The Office of Regional Education, Skills and Jobs , July 2012).
Consultation outcomes in the Gulf and North West sub‐regions show concern for
the impact that the Queensland Governments decision to make Year 7 high school
standard has meant that families have left the region as they feel that children are

                                                                                            Page |9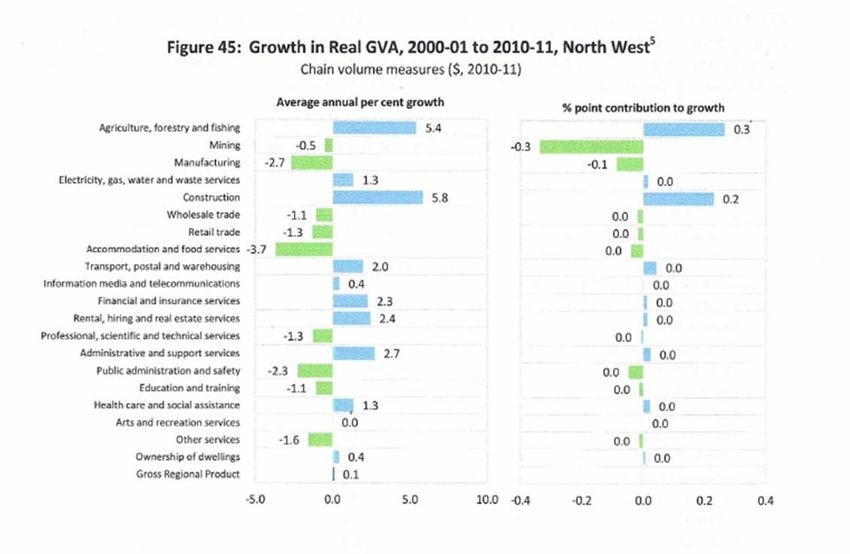
Draft Regional Roadmap 2013‐16 ‐ Appendix
          too young to attend boarding school at that age. This is combined with the issue
          that the number of state schools offering high school within rural centres has
          declined.
          The 2010 Next Step Survey shows that Townsville and North West region high
          school graduates were less likely to enter university than the state average (31.2%
          compared to 36.1%). More than half of Year 12 graduates in the region left school
          with a vocational education and training (VET) qualification (55.8%), while 17.4 per
          cent were school‐based apprentices or trainees. Those with a VET qualification had
          greatly improved rates of transition to employment‐based training (24.1%
          compared to 7.5%). In comparison with state data, high school graduates from the
          region were more likely to be engaged in construction and twice as likely to be in
          mining (The Office of Regional Education, Skills and Jobs , July 2012).
1.2.1.3   Education Tertiary
          The region has a presence of a large internationally recognised university with
          campus both in Townsville and Mount Isa. In 2011, James Cook University had
          11,880 students studying the arts, business, creative arts, education, engineering,
          law, medicine and health sciences, science, information technology and social
          sciences at its largest campus of Townsville and 19 students at Mount Isa. These
          figures represent 60.5% and 0.1% of the university’s total student population
          respectively. Of the domestic students studying at James Cook University 45.3%
          originated from the Northern Statistical Division. Following completion of studies
          49.1% of graduates stayed within the region (James Cook University, 2013). The
          university also conducts internationally recognised research in areas such as
          marine sciences, biodiversity, tropical ecology and environments, global warming,
          tourism, and tropical medicine and public health care in under‐served populations
          (The Office of Regional Education, Skills and Jobs , July 2012). Referring to

                                                                                 P a g e | 10
Draft Regional Roadmap 2013‐16 ‐ Appendix
Table 3, the proportion of population with post school qualifications in the region
has improved from 30% in 2001 to 38.9% in 2011. Though the region’s proportion
of population with post school qualifications has not been at as an improved rate
compared to Queensland wide statistics.
P a g e | 11Draft Regional Roadmap 2013‐16 ‐ Appendix
Table 3: Post school qualifications by Local Government Area 2001 ‐ 2011
(Australian Government ‐ Bureau of Statistics, 2013)
Proportion of Proportion of Proportion of
Population (15 years Population (15 years Population (15 years
and over) with a Post and over) with a Post and over) with a Post
School Qualification School Qualification School Qualification
% % %
Local Government 2001 2006 2011
Boulia (S) 0.22119 0.293269 0.280922
Burdekin (S) 0.248206 0.273907 0.314183
Burke (S) 0.425698 0.379759 0.419657
Carpentaria (S) 0.269559 0.283081 0.3094
Charters Towers (R) 0.234897 0.263505 0.30812
Cloncurry (S) 0.307318 0.358163 0.382719
Doomadgee (S) 0.07377 0.1125 0.199758
Flinders (S) 0.234245 0.258065 0.302905
Hinchinbrook (S) 0.242095 0.285655 0.327612
McKinlay (S) 0.324278 0.358506 0.371447
Mornington (S) 0.102339 0.146575 0.279799
Mount Isa (C) 0.324368 0.336839 0.37795
Palm Island (S) 0.078752 0.139241 0.212687
Richmond (S) 0.201733 0.257844 0.31407
Townsville (C) 0.322182 0.369666 0.41608
Townsville and North
West Queensland 0.301359 0.344029 0.38945
Queensland 0.316608 0.36791 0.425299
Australia 0.342672 0.389694 0.443882
1.2.1.4 Education Vocational
TAFE institutes operate from various campuses located in Mount Isa, Burdekin,
Charters Towers, Ingham and Palm Island, with major facilities in Townsville and a
new Trade Training Centre.
P a g e | 12Draft Regional Roadmap 2013‐16 ‐ Appendix
Table 4 outlines the enrolment numbers per Local Government area throughout
the region. The Barrier Reef Institute of TAFE is the major provider of VET for most
of the region. It delivers over 200 training programs across a diverse range of
community and industry areas, including mining, construction, health, tourism,
hospitality, business and defence. Tec‐NQ, formerly an Australian Technical
College, offers VET programs to both industry and the community of Townsville
with a focus on school‐based apprenticeships. The Mount Isa Institute of TAFE
services the North West part of the region and focuses on training to meet
identified skill shortages in the mining, manufacturing, and building and
construction industries. Some smaller registered training organisations offer
training services to industry and the general public (The Office of Regional
Education, Skills and Jobs , July 2012).
P a g e | 13Draft Regional Roadmap 2013‐16 ‐ Appendix
Table 4: VET student numbers by enrolment type by statistical area level 3 a) TVL and North West RDA
Region, 2011
(Queensland Treasury and Trade ‐ Government Statistician, 2013)
Local Government Area Commencing Continuing Students Total (b)
Students
Number % Number % Number
Boulia (S) 26 74.3 8 22.9 35
Burdekin (S) 730 58.6 487 39.1 1,246
Burke (S) 13 68.4 6 31.6 19
Carpentaria (S) 150 64.9 81 35.1 231
Charters Towers (R) 610 65.5 315 33.8 932
Cloncurry (S) 167 47.0 187 52.7 355
Doomadgee (S) 96 69.6 41 29.7 138
Flinders (S) 67 46.9 66 46.2 143
Hinchinbrook (S) 944 70.0 404 29.9 1,349
McKinlay (S) 27 55.1 22 44.9 49
Mornington (S) 38 59.4 26 40.6 64
Mount Isa (C) 1,137 54.2 946 45.1 2,096
Palm Island (S) 0 .. 0 .. 0
Richmond (S) 38 50.0 38 50.0 76
Townsville (C) 8,878 66.2 4,514 33.7 13,412
RDA – Tvl & NW Region 12,921 64.1 7,141 35.4 20,145
Queensland 203,580 66.8 100,454 33.0 304,800
RDA – Tvl & NW Region as % of Qld 6.3 ‐ 7.1 ‐ 6.6
1.2.1.5 Education and Skills Strategies
In July 2012, the Regional Education, Skills and Job Plan Queensland – Townsville
and North West 2012 – 2014 was launched (The Office of Regional Education, Skills
and Jobs , July 2012). As of 1 July 2013, the Australian Government’s Remote Jobs
and Communities Program will provide a more integrated and flexible approach,
providing better participation and employment services for people living in remote
areas of Australia. The new service will become the ‘one stop shop’ for people in
remote Australia currently being assisted by Job Services Australia, Disability
Employment Services, Indigenous Employment Program and the Community
Development Employment Projects program.
Key education, skills and jobs challenges identified in the Regional Education, Skills
and Job Plan Queensland – Townsville and North West 2012 – 2014 include:
availability of suitably qualified staff to work in early childhood education
and child care services within the region
strengthening the coordination of services to ensure students successfully
transition from school to further study, training and employment
access to vocational and higher education services can be compromised by
the isolation in rural and remote areas of the region
the resources boom has created demand for workers in the mining and
related support service industries, resulting in local industries losing staff to
the high paying mining sector
disadvantaged people, including those with a disability, youth, sole parents,
the long‐term unemployed and Indigenous Australians, face challenges in
actively participating in, and benefiting from, the strong, diverse regional
economy.
P a g e | 14Draft Regional Roadmap 2013‐16 ‐ Appendix
Skills Queensland are expecting that across Queensland there will be increasing
competition for skilled labour due to the resources boom. Currently the mining
and resources, construction, and health care and social assistance sectors currently
face significant skills constraints across Queensland. This is reflective of the
situation across the Townsville and North West region. The downturn in the
housing construction and manufacturing sectors is exacerbating these constraints,
as these sectors have traditionally trained many of the qualified skilled
tradespeople available to other sectors. These factors are in turn placing pressure
on the availability of skilled workers for other industries, such as agriculture.
Meanwhile, the tight labour market threatens to constrain industry development
for sectors such as tourism (Skills Queensland, 2012).
Statistics of employment by occupation (Table 5 and Figure 3) suggest that as a
whole the region is under skilled in the areas of managers, clerical, administration
and sales workers compared to the Queensland average.
Table 5: Employment by occupation TVL and North West RDA Region, 2011
(Queensland Treasury and Trade ‐ Government Statistician, 2013)
Occupation Tvl and North Queensland Specialisation
West RDA Region ratio (c)
Number % Number % Number
Managers 13,330 10.9 245,605 12.0 0.91
Professionals 19,329 15.9 385,583 18.9 0.84
Technicians & trades workers 20,620 16.9 304,564 14.9 1.13
Community & personal service workers 13,552 11.1 202,979 10.0 1.12
Clerical & administrative workers 16,147 13.3 299,326 14.7 0.90
Sales workers 10,826 8.9 199,633 9.8 0.91
Machinery operators & drivers 12,086 9.9 149,322 7.3 1.36
Labourers 13,552 11.1 215,236 10.6 1.05
Total (d) 121,749 100.0 2,039,278 100.0 1.00
Figure 3: Proportion of employment by occupation a) TVL and North West RDA Region and Queensland 2011
(Queensland Treasury and Trade ‐ Government Statistician, 2013)
P a g e | 15Draft Regional Roadmap 2013‐16 ‐ Appendix
1.3 KEY DETERMINANT TWO: SUSTAINABLE (ECONOMICALLY,
ENVIRONMENTALLY AND SOCIALLY) COMMUNITIES AND POPULATION
GROWTH
1.3.1 Economic
1.3.1.1 Socio‐Economic Disadvantage
The Index of Relative Socio‐economic Disadvantage (IRSD) is a general socio‐
economic index that summarises a range of information about the economic and
social conditions of people and households within an area. Unlike the other
indexes, this index includes only measures of relative disadvantage. A low score
indicates relatively greater disadvantage in general. For example, an area could
have a low score if there are (among other things), many households with low
income, many people with no qualifications, or many people in low skill
occupations. A high score indicates a relative lack of disadvantage in general. For
example, an area may have a high score if there are (among other things), few
households with low incomes, few people with no qualifications, and few people in
low skilled occupations (Australian Bureau of Statistics, 2013).
Table 6, outlines the socio‐economic index of disadvantage by Local Government
areas throughout the region. As compared to Queensland wide statistics the
region has a higher percentage of population in the quintile 2 (disadvantaged) and
less percentage of population in quintiles 4 and 5 (least disadvantaged). The
Indigenous Local Government areas of Palm Island, Doomadgee and Mornington
Island experience nearly 100% of their population as being in quintile 1 (most
disadvantaged).
Table 6: Socio‐Economic Index of Disadvantage by Local Government area, 2011
(Queensland Government, Treasurey and Trade Government Statistician, June 2013)
Local Quintile 1 (most Quintile 2 Quintile 3 Quintile 4 Quintile 5 (least
Government disadvantaged) disadvantaged)
Area
‐percentage of population‐
Boulia (S) 48.3 51.7 0.0 0.0 0.0
Burdekin (S) 32.9 38.1 17.3 8.3 3.4
Burke (S) 38.8 61.2 0.0 0.0 0.0
Carpentaria (S) 87.4 0.0 12.6 0.0 0.0
Charters 43.1 35.1 15.8 4.3 1.7
Towers (R)
Cloncurry (S) 36.6 26.6 36.7 0.0 0.0
Doomadgee 97.8 2.2 0.0 0.0 0.0
(S)
Flinders (S) 53.3 0.0 27.0 19.7 0.0
Hinchinbrook 32.6 37.5 23.7 6.2 0.0
(S)
McKinlay (S) 0.0 33.2 0.0 66.8 0.0
Mornington (S) 100.0 0.0 0.0 0.0 0.0
Mount Isa (C) 9.6 25.3 33.8 23.5 7.8
Palm Island (S) 100.0 0.0 0.0 0.0 0.0
Richmond (S) 27.4 34.6 38.0 0.0 0.0
Townsville (C) 13.4 28.2 19.7 15.8 23.0
RDA – Tvl & 19.7 28.6 20.4 14.4 16.9
NW Region
Queensland 20.0 20.0 20.0 20.0 20.0
P a g e | 16Draft Regional Roadmap 2013‐16 ‐ Appendix
Table 7: Number of persons by total personal weekly income by Local Government area, 2011
(Queensland Government, Treasurey and Trade Government Statistician, June 2013)
Local Less than $400 per $400 to $999 per $1,000 to $2,000 or more Total (b)
Government week week $1,999 per per week
Area week
Number % Number % Numb % Number % Number
er
Boulia (S) 126 34.2 147 39.9 51 13.9 11 3.0 368
Burdekin (S) 4,944 35.9 4,751 34.5 2,414 17.5 425 3.1 13,760
Burke (S) 72 16.5 137 31.4 91 20.8 46 10.5 437
Carpentaria 468 28.9 542 33.5 255 15.8 45 2.8 1,617
(S)
Charters 3,686 39.2 2,655 28.3 1,614 17.2 427 4.5 9,397
Towers (R)
Cloncurry (S) 579 22.6 595 23.2 684 26.7 294 11.5 2,564
Doomadgee 517 65.0 189 23.8 59 7.4 9 1.1 795
(S)
Flinders (S) 496 35.1 431 30.5 255 18.0 53 3.7 1,414
Hinchinbroo 3,861 40.6 3,245 34.1 1,408 14.8 270 2.8 9,520
k (S)
McKinlay (S) 147 16.5 290 32.5 204 22.9 115 12.9 891
Mornington 480 64.9 141 19.1 80 10.8 9 1.2 740
(S)
Mount Isa 3,512 21.8 3,427 21.3 4,306 26.7 2,148 13.3 16,122
(C)
Palm Island 1,060 66.1 393 24.5 102 6.4 8 0.5 1,604
(S)
Richmond 195 30.1 263 40.6 86 13.3 28 4.3 647
(S)
Townsville 41,942 30.5 42,618 31.0 33,25 24.2 7,017 5.1 137,631
(C) 9
RDA – Tvl & 62,085 31.4 59,824 30.3 44,86 22.7 10,905 5.5 197,507
NW Region 8
Queensland 1,195,059 34.6 1,095,509 31.7 689,4 19.9 191,236 5.5 3,456,877
95
RDA – Tvl & 126 34.2 147 39.9 51 13.9 11 3.0 368
NW Region
as % of Qld
P a g e | 17Draft Regional Roadmap 2013‐16 ‐ Appendix
Table 8: Occupied private dwellings by tenure type by Local Government area, 2011
(Queensland Treasury and Trade ‐ Government Statistician, 2013)
Local Government Area Fully owned Being purchased Rented (c) Total (d)
(b)
Number % Number % Number % Number
Boulia (S) 42 25.1 10 6.0 93 55.7 167
Burdekin (S) 2,665 41.1 1,766 27.2 1,823 28.1 6,491
Burke (S) 30 25.6 8 6.8 62 53.0 117
Carpentaria (S) 162 25.2 83 12.9 337 52.4 643
Charters Towers (R) 1,535 36.5 1,246 29.6 1,210 28.8 4,207
Cloncurry (S) 200 22.1 150 16.5 485 53.5 907
Doomadgee (S) 6 2.8 20 9.4 182 85.4 213
Flinders (S) 263 39.5 152 22.8 221 33.2 666
Hinchinbrook (S) 2,158 48.1 955 21.3 1,173 26.1 4,487
McKinlay (S) 128 42.7 47 15.7 98 32.7 300
Mornington (S) 0 0.0 3 1.2 234 94.4 248
Mount Isa (C) 1,165 18.2 2,162 33.8 2,801 43.8 6,399
Palm Island (S) 16 4.1 0 0.0 361 92.8 389
Richmond (S) 107 34.1 64 20.4 111 35.4 314
Townsville (C) 14,134 23.2 22,083 36.2 22,752 37.3 60,969
RDA – Tvl & NW Region 22,611 26.1 28,749 33.2 31,943 36.9 86,517
Queensland 448,617 29.0 533,868 34.5 513,415 33.2 1,547,303
RDA – Tvl & NW Region as % 5.0 ‐ 5.4 ‐ 6.2 ‐ 5.6
of Qld
1.3.1.2 Employment and Unemployment
The North West and Townsville region has a smaller unemployment rate of 4.5% as
compared to 5.8% for Queensland. There is significantly higher unemployment
rates (than that of Queensland wide) in the six Local Government areas of Boulia,
Burke, Carpentaria, Doomadgee, Mornington, and Palm Island.
Table 9: Unemployment and labour force by Local Government area, December quarter 2012
(Queensland Treasury and Trade ‐ Government Statistician, 2013)
Local Government Area Unemployed Labour Unemployment
Force Rate
‐number‐ %
Boulia (S) 32 337 9.5
Burdekin (S) 393 10,238 3.8
Burke (S) 78 375 20.8
Carpentaria (S) 114 1,104 10.3
Charters Towers (R) 361 6,483 5.6
Cloncurry (S) 87 2,103 4.1
Doomadgee (S) 80 399 20.1
Flinders (S) 46 1,212 3.8
Hinchinbrook (S) 300 6,505 4.6
McKinlay (S) 8 718 1.1
Mornington (S) 64 494 13.0
Mount Isa (C) 733 12,159 6.0
Palm Island (S) 66 709 9.3
Richmond (S) 20 596 3.4
Townsville (C) 4,190 101,185 4.1
RDA – Tvl & NW Region 6,572 144,617 4.5
Queensland 143,637 2,480,728 5.8
RDA – Tvl & NW Region as % of Qld 4.6 5.8 ‐
P a g e | 18Draft Regional Roadmap 2013‐16 ‐ Appendix
Workforce participation rates have changed throughout the period 2001 – 2011.
The majority of Local Governments have experienced a decline in workforce
participation rates, these are Mount Isa, Mornington, McKinlay, Flinders,
Doomadgee, Charters Towers, Carpentaria, Burke, Burdekin, and Boulia. There has
been significant improvements in workforce participation rates on Palm Island and
slight improvements in the local government areas of Townsville and Richmond
(Table 10).
Table 10: Workforce Participation Rate per Local Government, 2001, 2006, 2011
(Australian Government ‐ Bureau of Statistics, 2013)
Participation Rate 2001 Participation Rate 2006 Participation Rate 2011
% % %
Region Name 2001 2006 2011
Boulia (S) 78.47358 70.79208 64.83516
Burdekin (S) 61.89908 59.42125 59.23028
Burke (S) 70.13575 62.38185 60.1735
Carpentaria (S) 47.10337 45.54974 44.23653
Charters Towers (R) 57.76888 56.45954 55.7794
Cloncurry (S) 65.30718 71.50504 65.64448
Doomadgee (S) 53.78151 47.96238 47.99026
Flinders (S) 66.50602 66.34304 60.08429
Hinchinbrook (S) 54.51593 53.56884 54.7087
McKinlay (S) 79.60583 79.03226 69.05859
Mornington (S) 58.35777 56.88456 48.43554
Mount Isa (C) 69.00313 64.03437 64.23553
Palm Island (S) 31.7401 44.65558 52.64798
Richmond (S) 65.18905 66.06648 66.32258
Townsville (C) 64.49508 64.39523 65.29279
Townsville and North
West Queensland 63.40941 62.80038 63.28067
Queensland 60.55803 61.08482 62.17507
Australia 60.30457 60.35896 61.38357
As compared to Queensland there is a larger percentage of employed in the
agricultural, mining, electricity, public administration and education and training
industries.
P a g e | 19Draft Regional Roadmap 2013‐16 ‐ Appendix
Table 11: Employment by industry Townsville and North West RDA Region, 2011
(Queensland Treasury and Trade ‐ Government Statistician, 2013)
Industry Tvl and North Queensland Specialisation
West RDA Region
Number % Number % Number
Agriculture, Forestry and Fishing 4,882 4.0 55,416 2.7 1.48
Mining 7,430 6.1 52,955 2.6 2.35
Manufacturing 9,333 7.7 171,669 8.4 0.91
Electricity, Gas, Water and Waste 1,748 1.4 24,828 1.2 1.18
Services
Construction 10,731 8.8 183,780 9.0 0.98
Wholesale Trade 3,344 2.7 74,288 3.6 0.75
Retail Trade 12,401 10.2 217,610 10.7 0.95
Accommodation and Food Services 7,828 6.4 141,855 7.0 0.92
Transport, Postal and Warehousing 5,910 4.9 107,072 5.3 0.92
Information Media and 1,378 1.1 25,358 1.2 0.91
Telecommunications
Financial and Insurance Services 1,760 1.4 54,153 2.7 0.54
Rental, Hiring and Real Estate Services 1,715 1.4 37,007 1.8 0.78
Professional, Scientific and Technical 4,846 4.0 132,754 6.5 0.61
Services
Administrative and Support Services 3,367 2.8 65,015 3.2 0.87
Public Administration and Safety 12,670 10.4 136,818 6.7 1.55
Education and Training 9,731 8.0 160,921 7.9 1.01
Health Care and Social Assistance 14,108 11.6 242,559 11.9 0.97
Arts and Recreation Services 1,273 1.0 28,444 1.4 0.75
Other Services 4,575 3.8 78,713 3.9 0.97
Total (d) 121,749 100.0 2,039,275 100.0 1.00
P a g e | 20Draft Regional Roadmap 2013‐16 ‐ Appendix
Figure 4: Proportion of employment by industry a) TVL and North West RDA Region and Queensland, 2011
(Queensland Treasury and Trade ‐ Government Statistician, 2013)
P a g e | 21Draft Regional Roadmap 2013‐16 ‐ Appendix
1.3.1.3 Priority Employment Areas
The Townsville and North West Region covers two priority employment areas
(PEA) as defined by DEEWR (Department of Education, Employment and
Workplace Relations, 2013).
(a) Townsville Priority Employment Area
The Townsville PEA includes the LGAs of Burdekin, Charters Towers, Hinchinbrook,
Palm Island and Townsville and has a working age population of 153,000
(Australian Government ‐ Bureau of Statistics, 2013).
The unemployment rate for the Townsville PEA in December 2012 was 4.2 per
cent, well below that for the state (5.8 per cent). Unemployment rates across the
PEA ranged from a low of 3.8 per cent in the Burdekin Local Government Area
(LGA), to a high of 9.3 per cent in the Palm Island LGA (Department of Education,
Employment and Workplace Relations, 2012).
Despite the relatively low unemployment rate in the region, total employment
declined by 8,700 in the Northern‐North West Labour Force Region (LFR)
(Department of Education, Employment and Workplace Relations, 2012) in the two
years to May 2013. Over the same period, the participation rate also decreased
from 76.4 per cent to 69.6 per cent (Australian Government ‐ Bureau of Statistics,
2013).
The largest employing industries for people living in the Townsville PEA are Health
Care and Social Assistance (12 per cent of all employment), Public Administration
and Safety (11 per cent), and Retail Trade (11 per cent). Growth in employment
between 2006 and 2011 was highest in the Health Care and Social Assistance and
Construction industries, while employment fell significantly in the Agriculture,
Forestry and Fishing industry. (Australian Government ‐ Bureau of Statistics, 2013)
While the unemployment rate in the Townsville PEA has remained lower than that
for the state and the other PEAs for much of the last five years, labour market
conditions have moderated in the past two years and there are some signs of
weakness in the region.
Overall employment and the labour force participation rate have declined in the
last two years indicating that the labour market has softened;
There are also pockets of disadvantage within the Townsville PEA, with the
Indigenous population in particular experiencing poorer labour market outcomes;
The survey results show a reduction in recruitment activity, although the level of
recruitment is still in line with the average for all regions surveyed;
Since the last survey in November 2011, competition for vacancies has increased
and the unfilled vacancy rate has decreased significantly, particularly for
Technicians and Trades Workers, indicating that past skill shortages are easing;
While future recruitment expectations have softened since November 2011, there
will be a range of employment opportunities, in both higher and lower skilled
occupations, in the coming year.
A Survey of Employers’ Recruitment Experiences conducted by Department of
Education, Employment and Workplace Relations (DEEWR) in November 2011,
highlighted the positions that are the most difficult to fill within the Burdekin,
P a g e | 22Draft Regional Roadmap 2013‐16 ‐ Appendix
Charters Towers, Hinchinbrook, Palm Island and Townsville. The most common
positions included: Motor Mechanics, Child Carers, Electricians, Chefs, Registered
Nurses and Metal Fitters and Machinists (Figure 5) (Move to Townsville, 2013).
Figure 5: Proportion of Unfilled Vacancies
(Move to Townsville, 2013)
At the time of the 2011 Census, 7 per cent of the working age population in the
Townsville PEA identified as Indigenous (3 per cent for Queensland overall). A
significantly lower proportion of the Indigenous working age population (44 per
cent) in the Townsville PEA were employed compared with the non‐Indigenous
working age population (77 per cent).
Despite the apparent easing of skill shortages in the area, many surveyed
employers still reported recruitment difficulty and that a majority of job applicants
were unsuitable. Applicants were mostly considered unsuitable due to a lack of
qualifications and experience. Increasing opportunities for apprenticeships,
traineeships and work experience in the region may help to address this concern
and assist with future skilled labour supply.
(b) Mount Isa Employment Service Area (ESA)
As at June 2011, the unemployment rate for the Mt Isa ESA was 5.4 per cent,
similar to the Australian rate of 5.1 per cent. Several Statistical Local Areas (SLAs)
within Mt Isa had much lower unemployment rates, such as Cloncurry (4.1 per
cent), Longreach (2.9 per cent) and Barcaldine (2.6 per cent). Other SLAs had high
unemployment rates such as Burke (17.6 per cent), Doomadgee (17.1 per cent),
Mornington (12.1 per cent) and Carpentaria (11.3 per cent) (Department of
Education, Employment and Workplace Relations, 2011). Issues identified in the
Mount Isa Service area are:
Educational attainment is very low among Indigenous people in the Mt Isa ESA,
with 21 per cent having completed year 12 or equivalent at the time of the 2006
Census, compared with 42 per cent among non‐Indigenous people.6 Similarly, the
unemployment rate for Indigenous people in the Mt Isa ESA (12.4 per cent) was
five times higher than the non‐ Indigenous unemployment rate (2.4 per cent).
P a g e | 23Draft Regional Roadmap 2013‐16 ‐ Appendix
The Mt Isa ESA is dominated by the Mining industry, particularly the Xstrata zinc
mines operating in the region, and the cattle industry. Almost one third (31 per
cent) of the working age population is employed in these two trade‐exposed
industries. Significant challenges for the region are managing the ‘boom and bust’
nature of these primary production industries in a way that complements other
industries in the region, as well diversifying industry to achieve more balanced
economic growth.
Net population growth in the Mt Isa ESA has been almost non‐existent when
compared with the Australian average. Total population growth between 2005 and
2010 was 1.5 per cent, compared with 9.5 per cent for Australia over the same
period. The increase in the working age population in Mt Isa over the same period
was 0.7 per cent.9 Strong job growth in the Queensland Mining industry10 has not
translated into population growth in the ESA, as there are a large number of non‐
resident workers who live in on‐site worker villages or who live in temporary or
leased accommodation and are not included in ABS resident population estimates.
This varies by region. Most mining jobs in Cloncurry and McKinlay were filled by
non‐resident workers (83 per cent and 99 per cent respectively), yet non‐resident
workers accounted for a small minority (16 per cent) of mining jobs in Mt Isa.
Despite strong growth in the Mining industry, there is a shortage of affordable
and/or adequate housing in Mt Isa, as well as an inadequate provision of
infrastructure and social services, partly as a result of the transient/non‐resident
workforce and fluctuating population. This is a significant barrier to attracting and
retaining staff in the region.
Opportunities for job seekers may exist for occupations with high unfill rates, high
recruitment difficulty and low numbers of (suitable) applicants, such as:
Labourers (namely Commercial Cleaners, Livestock Farm Workers and Motor
Vehicle Parts and Accessories Fitters); and
Technicians and Trades Workers (particularly Motor Mechanics, Metal Fitters
and Machinists, Chefs and Cooks).
Opportunities may become available in the industries that are expecting a high
level of future recruitment and with occupations difficult to fill, namely
Accommodation and Food Services (Chefs, Commercial Cleaners, Bar Attendants
and Baristas) and Other Services (Motor Mechanics, Metal Fitters and Machinists).
A small labour force, minimal population growth and lack of affordable
accommodation means that employers may need to look to people not currently in
the labour force to fill their labour needs. Opportunities exist in entry‐level
occupations (namely Sales Workers and Labourers) which could provide entry into
the labour market for job seekers with little or no experience in the labour market,
such as young people, mature aged people, parents returning to the labour force
and Indigenous job seekers.
One of the main reasons applicants were deemed unsuitable was a lack of
experience. Support for work experience programs, work readiness skills and
support for apprentices and trainees could provide job seekers with the skills that
employers are seeking.
Support for employers with apprentices and trainees could help increase the stock
of skilled workers in the Mt Isa ESA, especially in difficult to fill occupations.
P a g e | 24Draft Regional Roadmap 2013‐16 ‐ Appendix
1.3.2 Environmental
1.3.2.1 Climate Change
The Department of Industry, Innovation, Climate Change, Science, Research and
Tertiary Education (2013) outlines that there will be potential impacts and costs to
Queensland’s industries, infrastructure, environment and people from climate
change. Key impacts for the Townsville and North West region could include:
Populated coastal communities are likely to be inundated from a sea level
rise of 1.1 metres, this will not only impact on residential housing, but also
roads, railways and commercial buildings.
Rainfall variability across the state, combined with an increase in average
temperate and evaporation rates may impact regional water supplies due to
less surface water availability for water catchments and dams.
Projections of an increase in the proportion of tropical cyclones in the more
intense categories (3–5), yet overall a decrease in the number of cyclones.
There is also a projection for tropical cyclones to move southward as sea
surface temperatures increase. A greater intensity in tropical cyclones could
result in damage to infrastructure and a decline in agricultural production. It
is estimated that Cyclone Larry, a category 4 cyclone in 2006 resulted in a
loss of $500 million to the economy.
Extreme rainfall intensity to increase, leading to more flooding impacts.
Impacts on the Great Barrier Reef Marine Park where the sea surface
temperatures across the Great Barrier Reef have increased by 0.4 degrees in
the past 30 years and increasing atmospheric carbon dioxide has also
resulted in an increase in ocean acidity. This climate change has caused a
number of coral bleaching events and could significantly impact on the
economic value that the Great Barrier Reef provides to Queensland.
The agricultural sectors of sugar and beef production will most be affected
by climate change. With an estimated decline in production of 11.9% and
19% respectively by 2030 across Queensland.
Further there is expected to be significant public health risk with mosquitoes likely
to spread, with a high likelihood of dengue fever ranging over a wider area (Hugo,
2012).
(a) Sub–Regional: North West Climate Change
Queensland’s North West area is forecasted (on a medium emissions scenario) to
experience the following by 2030: (Queensland Department of Environment and
Heritage Protection, 2009)
The annual mean temperature (the average of all daily temperatures within
a given year) is projected to increase by 1.1 °C. There is little variation in
projections across the seasons.
Annual rainfall (the total rainfall received within a given year) is projected to
decrease by two per cent (‐11 mm). The largest seasonal decrease of seven
per cent (‐5 mm) is projected for spring.
P a g e | 25Draft Regional Roadmap 2013‐16 ‐ Appendix
Across all seasons the annual ‘best estimate’ increase in annual and seasonal
potential evaporation is projected to be around three per cent (83 mm), with
some models projecting up to a six per cent increase in winter (29 mm).
More extreme climate events, such as cyclonic weather and duration of heat
waves to increase.
These projected temperature increases and reduced rainfall are most likely to
affect communities within the area dependant on agriculture and tourism. There
will also be greater energy demands to cater for the increasing temperatures and
heat waves.
(b) Sub–Regional: Coastal North Queensland Climate Change
Queensland’s coastal North Queensland area (incorporating Townsville, Charters
Towers, Hinchinbrook and Burdekin Local Government areas) is forecasted (on a
medium emissions scenario) to experience the following by 2030: (Queensland
Department of Environment and Heritage Protection, 2009)
The annual mean temperature (average of all daily temperatures within a
given year) is projected to increase by 0.9 °C. There is little variation in
projections across the seasons.
The annual rainfall (the total rainfall received within a given year) is
projected to decrease by two per cent (‐16 mm). The largest seasonal
decrease of seven per cent (‐8 mm) is projected for spring.
Across all seasons the annual ‘best estimate’ increase in annual and seasonal
potential evaporation is projected to be around 3–4 per cent (61–81 mm),
with some models projecting up to a six per cent increase in winter (21 mm)
and autumn (27 mm).
Climate change is likely to impact on the area’s agricultural, horticultural and
tourism activities due to (Queensland Department of Environment and Heritage
Protection, 2009):
Sea surface temperature increases combined with increasing concentrations
of carbon dioxide are leading to more regular occurrences of the coral
bleaching in the Great Barrier Reef.
Inundation from higher sea levels and storm surges causing damage to
infrastructure and natural eco‐systems.
Health related problems due to temperature increases and exposure to
catastrophic events.
Longer duration of heatwaves can result in significant health impacts for the
very young or old.
Tropical diseases such as Ross River virus are expected to increase under
climate change.
Higher temperatures could exacerbate problems such as poor pasture
quality. Thermal stress for animals is very likely also, reducing animal
production, reproductive performance and increase mortality.
P a g e | 26Draft Regional Roadmap 2013‐16 ‐ Appendix
Less rainfall and increasing evaporation will also deplete soil moisture,
ground cover and stock carrying capacity.
Tropical weeds may increase in abundance.
(c) Sub–Regional: Gulf Area Climate Change
Queensland’s Gulf area is forecasted (on a medium emissions scenario) to
experience the following by 2030 (Queensland Department of Environment and
Heritage Protection, 2009):
An annual mean temperature (the average of all daily temperatures within a
given year) is projected to increase by 1.0 °C. There is little variation in
projections across the seasons.
Annual rainfall (the total rainfall received within a given year) is projected to
decrease by one per cent (‐9 mm). The largest seasonal decrease of six per
cent (‐5 mm) is projected for spring.
Across all seasons the annual ‘best estimate’ annual and seasonal potential
evaporation is projected to increase to be around three per cent (76 mm),
with some models projecting up to a six per cent increase in winter (32 mm).
Climate change is expected to most impact the area local agricultural and fishing
industries. Other impacts to the area are:
Increased occurrence of tropical diseases such as the Ross River Virus,
dengue fever and malaria.
Increases in extreme storm events causing more cyclone damage and
closest to the coast these storm events could cause, flash flooding,
wind damage and considerable structural damage from falling trees,
affecting industry and infrastructure including water, sewerage and
stormwater, transport and communications.
1.3.2.2 Renewable Energy Sources
In 2008, renewable energy accounted for approximately 6 per cent or almost 750
megawatts of Queensland’s total installed generating capacity of more than 12,500
megawatts (including solar hot water systems). Biomass co‐generation (primarily
from bagasse) is the major renewable energy source in Queensland and provides
415 megawatts of the state’s renewable energy capacity. Hydroelectricity provides
169 megawatts and solar hot water systems around 144 megawatts. Wind, solar
photovoltaic and geothermal sources provide only small amounts of electricity
(Department of Employment, Economic Development and Innovation, 2009).
P a g e | 27You can also read