Assessing Hydrological Situation of Kapuas Hulu Basin, Kapuas Hulu Regency, West Kalimantan - Betha Lusiana, Rudy Widodo, Elok Mulyoutami, Dudy ...
←
→
Page content transcription
If your browser does not render page correctly, please read the page content below
Assessing Hydrological Situation of
Kapuas Hulu Basin, Kapuas Hulu Regency,
                        West Kalimantan

         Betha Lusiana, Rudy Widodo, Elok Mulyoutami,
            Dudy Adi Nugroho and Meine van Noordwijk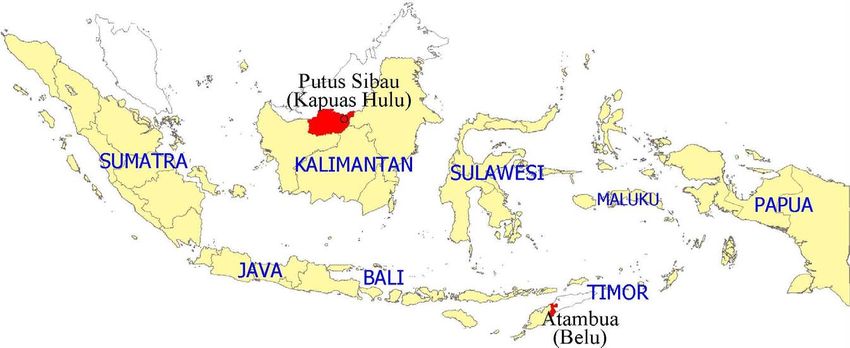
Assessing Hydrological Situation of
 Kapuas Hulu Basin, Kapuas Hulu
       Regency, West Kalimantan

                               Betha Lusiana
                                Rudy Widodo
                             Elok Mulyoutami
                           Dudy Adi Nugroho
                         Meine van Noordwijk

                         Working Paper nr 57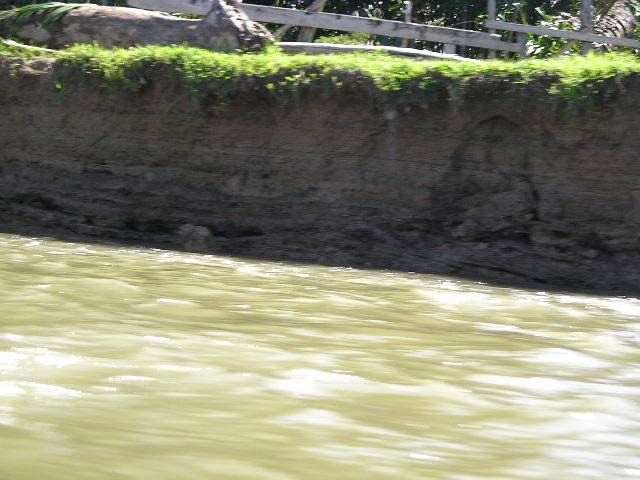
LIMITED CIRCULATION

Correct citation:
Lusiana B, Widodo R, Mulyoutami E, Nugroho DA and van Noordwijk M. 2008. Assessing Hydrological
Situation of Kapuas Hulu Basin, Kapuas Hulu Regency, West Kalimantan. Working Paper No. 57. Bogor,
Indonesia. World Agroforestry Centre. 67 p.

Titles in the Working Paper Series aim to disseminate interim results on agroforestry research and
practices and stimulate feedback from the scientific community. Other publication series from the World
Agroforestry Centre include: Agroforestry Perspectives, Technical Manuals and Occasional Papers.

Published by the World Agroforestry Centre
ICRAF Southeast Asia Regional Office
Jl. CIFOR, Situ Gede, Sindang Barang, Bogor 16680
PO Box 161, Bogor 16001, Indonesia

Tel: 62 251 625415, fax: 62 251 625416
Email: icraf-indonesia@cgiar.org
ICRAF Southeast Asia website: http://www.worldagroforestrycentre.org/sea

© World Agroforestry Centre 2008
Working Paper nr 57

Photos: RHA Team
Maps: RHA Team
Geographical data: RHA Team

The views expressed in this publication are those of the author(s) and not necessarily those of the World
Agroforestry Centre.
Articles appearing in this publication may be quoted or reproduced without charge, provided the source is
acknowledged.
All images remain the sole property of their source and may not be used for any purpose without written
permission of the source.
About the authors

Betha Lusiana (b.lusiana@cgiar.org)

Rudy Widodo (r.widodo@cgiar.org)

Elok Mulyoutami (e.mulyoutami@cgiar.org)

Dudy Adi Nugroho (d.nugroho@cgiar.org)

Meine van Noordwijk (m.vannoordwijk@cgiar.org)

                                           -i-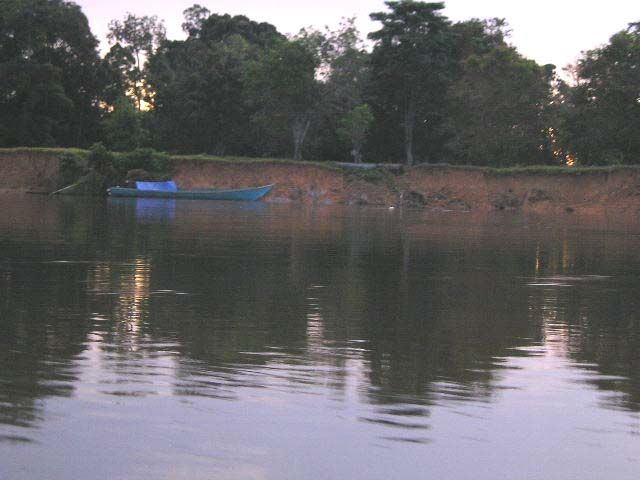
Abstract

This report presents results of a ‘rapid appraisal’ of the hydrological situation in Kapuas Hulu
Basin, Kapuas Hulu Regency in West Kalimantan (Indonesia). The main objective of this
study was to assess the hydrological situation of Kapuas Hulu Basin and to provide information
on what and where the payment for watershed services could be focused. In the upstream of
Kapuas Hulu Basin lies Batang Kerihun National Park, one of the last frontiers of natural habitat
in Kalimantan. The National Park is a hot-spot biodiversity area containing thousands of
different plant and animal species, many of them endemic to Kalimantan.

Kapuas Hulu has a very wet climate, with an average annual rainfall of 4100 m/year. Rainfall is
evenly distributed throughout the year with the wettest month in November or December. The
dominant land cover class in Kapuas Hulu Basin is forest (90%). Lands that are managed by
farmers (in form of agriculture and tree-based systems) only formed around 3% of the total area.
There are three main catchments in Kapuas Hulu Basin: Sibau, Mendalam and Kapuas
(Koheng). The intensity of land management varies between catchments, with Sibau the most
intensive (vegetable plots, tree-systems and tembawang) and Kapuas the least intensive
(gathering forest products and tembawang).

Currently, forest areas in Kapuas Hulu are under threat of being lost and fragmented due to fire,
logging and mining activities. The local stakeholder (local community and policy makers) are
concerned about the impact of loss of forest cover on watershed hydrological functions,
particularly on water level and water quality (erosion, sedimentation and pollution). Boats are
the main transportation for people in the area, thus stable and sufficient river depth is desirable.
Water quality issues in the area are related to water turbidity due to erosion and sedimentation,
as well as pollution.

The hotspots areas of Kapuas Hulu Basins are in Sibau Hulu village of Sibau catchment and
Datah Dian village of Mendalam Catchment. These villages are the most upstream villages in
the basin and the location where most land use change by local communities are occurring.

The average annual precipitation in the Kapuas Basin is approximately 4100 mm/year. The
landscape water balance in Kapuas indicated that around 60% flows into the river, while 40% is
used by the vegetation in interception and transpiration. According to the model, only 0.5 % of
rainfall come as surface run-off, 16% as soil quick flow (interflow; reaching the river within 2
days after the rain) and 39% as base flow.

Based on existing data and the estimated water balance through a modelling approach, the
Kapuas Hulu basin is currently still able to maintain its watershed function, particularly those
related to maintaining river flow.

As indicated by the result of scenario analysis, reducing forest cover in the area will increase
surface runoff and reduce soil quick flow. Thus, if the riparian zones are not healthy, there will
also be increase of sedimentation in the river. The landscape water balance analysis also
showed that up to 2004, the runoff fraction in Kapuas Hulu Basin was low. However, there
were already signs of degradation at smaller scale as shown in the result of scenario analysis in

                                                - ii -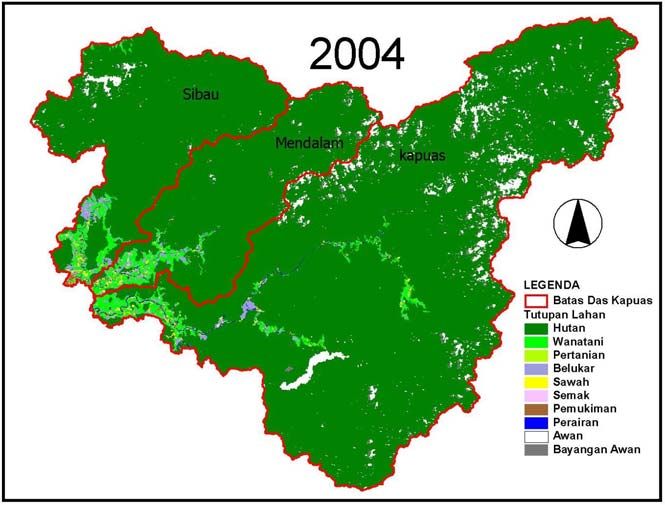
the Datah Dian sub-catchment. In this sub-catchment, around 3% of total rainfall becomes
surface run off or amounting to 6 times the overall basin condition.

The hydrological study also looked into the effect of the changes in forest cover into other land
uses (agriculture systems, bush-fallow) to the total water balance, particularly the shift from
base flow into soil quick flow or surface run off. These changes will have influence on the
temporal pattern of river flow at a daily basis, but not on the weekly or monthly patterns.

Future development of reward mechanisms in the area could be linked to activities that improve
the (i) tree cover along river banks as well as (ii) converting non-productive land, as these areas
are contributing to sedimentation in the river. The lack of existing hydrological data shows the
important part of water and river monitoring activities in the overall scheme.

To ensure that the hydrological condition of Kapuas Hulu basin can be maintained or improved,
attention should be paid also to large logging activities as well as gold mining activities.

Keywords

environmental services assessment, environmental services reward mechanisms, hydrological
modelling, Indonesia, local knowledge, watershed function

                                               - iii -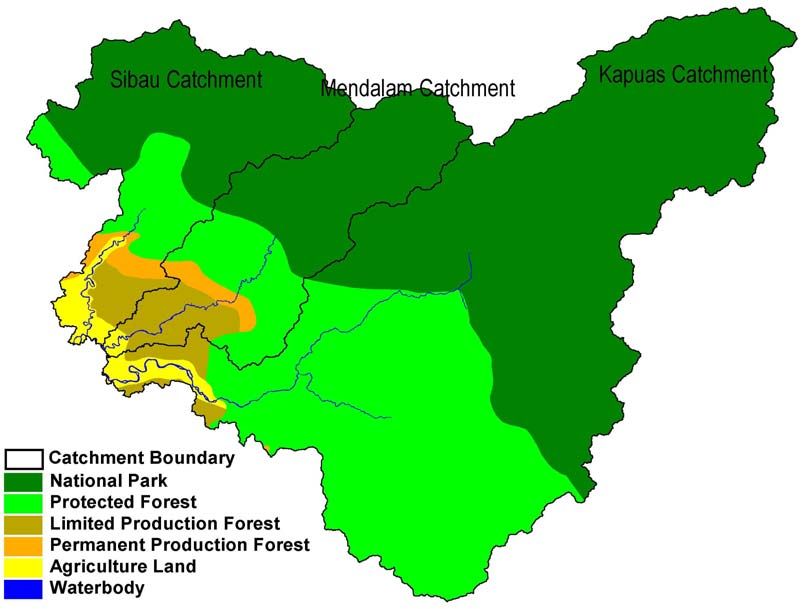
Acknowledgements

This paper is based on a study conducted within ‘Equitable Payments for Watershed Services,
Phase I: Making the Business Case’ Programme, a joint program by WWF, CARE and IIED in
funded by DANIDA and DGIS, in collaboration with RUPES Programme.

We would like to thank staffs of WWF Pontianak and Putusibau office who have helped in
organizing the RHA surveys in December 2006. In particular, we would like to thank Patria
Palgunadi and Rudi Zapariza for their help in providing us with secondary data. We would also
like to thank to Heri Mustopa for his kind assistance on LEK and PEK field survey.

                                            - iv -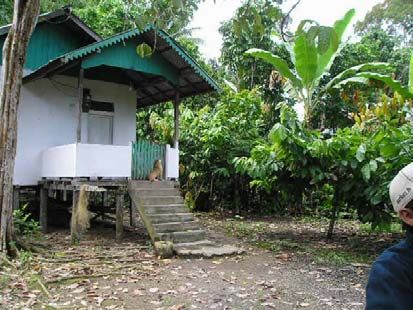
Contents

   Introduction............................................................................................................................... 1
Methodology.................................................................................................................... 5
   Hydrological appraisal methods ............................................................................................... 5
Land use/cover analysis of Kapuas Hulu Basin......................................................... 13
   The study site .......................................................................................................................... 13
   Land use/cover change analysis.............................................................................................. 14
   Delineation of sub-catchments of Kapuas Hulu Basin ........................................................... 21
What are the main hydrological problems in Kapuas Hulu Basin? local
community and policy makers’ perspectives ............................................................. 22
   Local Community Perspectives and Knowledge .................................................................... 22
   Policy makers at district level: perception and knowledge on watershed function ................ 26
Estimating landscape water balance of Kapuas Hulu basin .................................... 34
   Calibrating river flow data ...................................................................................................... 34
   Climatic condition of Kapuas Hulu Basin .............................................................................. 34
   Riverflow and rainfall pattern in Kapuas Hulu Basin............................................................. 35
   Calibrating GenRiver model for the Kapuas Hulu condition.................................................. 36
   Landscape water balance of Kapuas Hulu Basin .................................................................... 37
   Hydrological condition of Kapus Hulu Basin......................................................................... 38
The relationship of land use and hydrology in Kapuas Hulu Basin ........................ 40
   Land use scenarios .................................................................................................................. 40
   Impact of land cover change on water balance ....................................................................... 40
Hydrological situation in Datah Dian and Sibau Hulu: the hotspots area in
Kapuas Hulu basin ....................................................................................................... 44
   Landscape situation of Datah Dian and Sibau Hulu ............................................................... 44
   Hydrological issues................................................................................................................. 46
   Impact of land use changes on water balance of Sibau Hulu and Datah Dian village............ 47
Conclusion ..................................................................................................................... 50
   Can we develop reward mechanisms in the area? A hydrological perspective ...................... 50
   Environmental services rewards: potential scheme ................................................................ 52
   Conclusion .............................................................................................................................. 53
   Appendix 1. Accuracy of Landsat image classification result................................................ 59
   Appendix 2.............................................................................................................................. 60
   References............................................................................................................................... 62
   Glossary .................................................................................................................................. 64
   Working Paper Series ............................................................................................................. 66

                                                                     -v-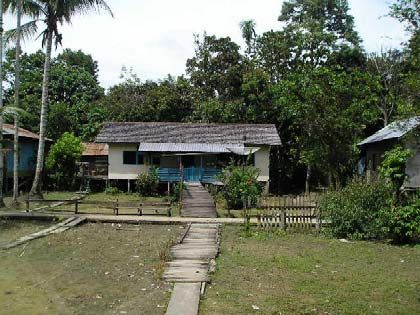
Acronyms

WWF:          World Wild Fund

DANIDA:       Danish International Development Agency

IIED:         International Institute for Economic and Development

RUPES:        Rewarding the Upland Poor for the Environmental Services they provided

BAPPEDA:      Badan Perencanaan dan Pembangunan Daerah (Regional Planning and
              Development Bureau)

RTRWP:        Rencana Tata Ruang Wilayah Propinsi (Spatial Planning for Provincial Area)

PDAM:         Perusahaan Daerah Air Minum (Public Drinking Water Company)

RHA:          Rapid Hydrological Appraisal

CIFOR:        Center for International Forestry Research

WCMC:         Water Conservation Monitoring Centre

BAKOSURTANAL: Badan Koordinasi Survei dan Pemetaan Nasional (National Coordinating
         Agency for Surveys and Mapping)

BMG:          Badan Meteorologi dan Geofisika (Meteorological and Geophysical Agency)

KIMPRASWIL: Pemukiman dan Prasarana Wilayah (Settlement and Regional Infrastructure
          Agency)

                                           - vi -
Introduction
Why hydrological assessment in Kapuas Hulu Basin?
Increasing degradation of watersheds has led to awareness of services that a watershed can
provide and recognition of the need to maintain these functions. It is known that land use can
significantly affect watershed functions such as water quality, water flow, erosion control and
sedimentation in downstream areas. However, those who own or manage upper watershed land
often have little incentive to maintain these services because the benefits occur downstream and
because they do not receive compensation for providing them.
The increased awareness of the importance of maintaining watershed functions has triggered
various form of initiatives to protect watershed including providing incentives for people in
upper watershed areas to protect watershed functions. Landells Mills and Porras (2002)
identified 61 initiatives on reward mechanism associated with maintaining watershed functions,
mostly with goals to maintain dry season flows, to protect water quality and to control
sedimentation. Reward mechanism is seen as a more direct approach in watershed conservation
approach and it explicitly recognized the need to bridge the interests of landowners and outside
beneficiaries through compensation payments.
Kapuas Hulu District as a potential site to develop reward mechanisms
Geographically, Kapuas Hulu District lies at 0°15' – 1°25' East and 111°39' – 114° 13' North in
the northern part of West Kalimantan, bordering to Sarawak– Malaysia (Figure 2). To its east,
lies East Kalimantan and Central Kalimantan Province, while in the west and south lies Sintang
District. The total area of Kapuas Hulu District is around 30,800 km2.
In the northern part of Kapuas Hulu lies Betung Kerihun National Park, that is the origin of
most of the island’s rivers, Kapuas, Rejang and Lupar. Kapuas is the longest river in
Kalimantan. The Lupar River flows into Sarawak (Malaysia). Betung Kerihun is a recognized
hot-spot of biodiversity. It has a range of habitats, including lowland Dipterocarp forest, wet
hill forest, montane forest, moss forest, and swamp forest. All are extremely bio-diverse, home
to thousands of different plant and animal species, many of them endemic to Kalimantan. They
also represent some of the last-remaining natural habitats on Kalimantan. Currently, forests in
this area are under threat of being lost and fragmented due to fire, logging and mining activities;
which could cause (if not already has caused) watershed functions degradation.
-1-Figure 1. The location of ‘‘Equitable Payments for Watershed Services’ sites in Indonesia. Atambua and Putussibau are the capital of Belu and Kapuas Hulu Regency,
respectively.
-2-The current situation in Kapuas Hulu is an opportunity to develop equitable reward
mechanism, specifically in the Kapuas Hulu Basin that has 57% of its area included under the
Betung Kerihun National Park. Communities living in and around the national park are
potential sellers in providing service to maintain the watershed function including the forest
and its biodiversity. Stakeholder with a strong interest in biodiversity could be the potential
buyer of these services, as part of an overall strategy to maintain the integrity of the ‘Heart of
Borneo’. The local government might be an intermediary, buying the services locally on the
basis of watershed protection, and selling globally as part of an integrated conservation
package.
Another potential buyer for the services provided by the community of Kapuas Hulu Basin is
the Public Water Service (PDAM = Perusahaan Daerah Air Minum). At present, PDAM
provides drinking water to the residents of Putussibau (the capital of Kapuas Hulu District),
using water from Kapuas River. Therefore, continuous supply of clean water is of interest to
PDAM. According to Indonesia Human Development Report (2004), in 2002 around 80.4%
of Kapuas Hulu is without access to clean water.
Reward mechanisms will have to address the poverty issue in Kapuas Hulu Basin. The
Human Development Index (HDI)1 of West Kalimantan province is 62.9, the fourth lowest
among 30 provinces in Indonesia (Indonesia National Human Development Report, 2004).
Within the province, Kapuas Hulu was ranked 5 (out of 9 districts including Pontianak the
capital of West Kalimantan), or 276 (out of 340 districts in Indonesia). The low HDI score of
West Kalimantan and Kapuas Hulu reflect the challenged livelihood situation of Kapuas Hulu Basin.
Why hydrological condition assessment?
As a consequence of landscape variability and site-specific characteristics of watershed
functions, it is important that we conduct a general approach to monitor and assess the
biophysical condition of a watershed, prior to developing reward mechanism. The
hydrological assessment is crucial and it needs to be conducted independently and
transparently. Otherwise, the development of reward mechanisms could be based on myths or
general beliefs about land use and water relationship that lead to inappropriate solutions
(Kaimowitz, 2001).
RUPES2 proposed seven necessary stages in the development of reward mechanisms (Jeanes,
et al., 2006): (1) Scoping, (2) Awareness, (3) Identifying Partners, (4) Negotiations, (5)
Action Plans, (6) Environmental Services Rewards: Support for Actions and (7) Monitoring.
Hydrological condition assessment encompasses the first three stages that need to be
conducted at the beginning of reward mechanisms development.
1 The Human Development Index (HDI) measures the overall achievements in a country/district in three basic dimensions of
human development – longevity, measured by life expectancy at birth; educational attainment, as measured by the combination
of adult literacy rate (two-thirds weight) and mean years of schooling (one-third weight); and standard of living, as measured
by adjusted per capita expenditure (Purchasing Power Parity, Rupiah). The HDI is a summary, not a comprehensive measure of
human development (Indonesia National Human Development Report, 2001)
2 RUPES (Rewarding the Upland Poor for the Environmental Services they provide) is a program for developing reward
mechanisms in upland poor Asia. Its goal is to enhance the livelihoods and reduce poverty of the upland poor while supporting
environmental conservation at local and global levels. See http://www.worldagroforestrycentre.org/sea/networks/rupes
-3-Van Noordwijk et al. (2006, 2007) developed criteria and indicators of ‘equitable
compensation and reward’ mechanisms: realistic, voluntary, conditional and pro-poor. The
current report is focused on step I, the appraisal of ‘realistic’ relations between land use and
environmental services that are of sufficient value to become the basis for reward
mechanisms. Step I also requires appraisal of the degree of ‘awareness’ and ‘shared
understanding’ between stakeholders, so there is necessarily interaction with activities in step
II, which should run in parallel, jointly preparing for a negotiation phase. The main objective
of this study is to assess the hydrological situation of Kapuas Hulu basin from the perspective
of multiple stakeholders (local ecological knowledge, policymakers knowledge and
ecohydrology) to assess ‘whether there is a case to be made’, as first step to appraisal of ‘the
business case’, and to provide information on what parts of the area and which environmental
service functions are most interesting for further exploration and development of payments
for watershed service mechanisms.
Table 1. Steps in the process of developing equitable environmental service reward (payment)
mechanisms that are based on a ‘business case’ with identified buyers, sellers and intermediaries
I. Knowledge to knowledge ( K to K): II. Actor to actor (A to A)
Scoping the knowledge systems: is there a realistic a. Mandatory protection of environmental services,
case for cause-effect relations between upland land spatially explicit and general restrictions on land use.
use and downstream effects (avoided degradation
b. Options for voluntary agreements: Exploring
and/or rehabilitation), and is there enough
stakeholder positions, preferences, scenarios for the
awareness and shared understanding of these
future and preferences; what are their likely
issues among major stakeholder (RUPES step 1+2)
negotiation positions.
c. Comparison of willingness to engage on the buyer
side, willingness to engage on the seller side and
availability of trusted intermediary – jointly defining
‘the business case’
d. Differences in wealth and power between
stakeholders, exploration of what ‘equitabability’
implies in the local context.
III. Negotiations: (K+K Ù A+A) leading to (K to A) link
Focus on conditionality (quid pro quo) of the agreements, the criteria for success and mechanisms for learning
and step-wise improvement
IV. Implementation and monitoring
Specifically the objectives are:
To identify the major forms of land cover/land use in the watershed,
To identify the core hydrological issues and problem according to major stakeholders
(including scientists),
To identify which part of the watershed contributes the most to core problems and
possible solutions,
To estimate the water balance of the watershed, how it is affected by land use change and
how it is related to the core problems identified,
To suggest and rank options to deal with the hydrological issues, as a potential basis for
payment/reward schemes.
-4-Methodology
Hydrological appraisal methods
The hydrological condition of Kapuas Hulu Basin was assessed using ‘Rapid Hydrological
Appraisal (RHA)’ approach3 (Jeanes, 2006). This approach was developed to provide a rapid,
inexpensive and integrated tool to assess hydrological functions of a certain watershed. It was
also developed to identify the gaps in understanding between three types of knowledge on
watershed function: local people, policy makers and scientific knowledge. If there are no major
gaps, then we can focus on the conditionality of reward mechanism. If there are gaps, then we
need to address those first.
The most important aspect of RHA approach is that it can provide clarity concerning criteria
and indicators of hydrological function and thus provide clarity on: (i) how the watershed
function is provided, (ii) who can be responsible for providing this service, (ii) how it is being
impacted upon at present, and (iv) how rewards can be channeled to effectively enhance or at
least maintain the function.
The assessment was based on the following activities:
Spatial analysis of Kapuas Hulu Basin based on LANDSAT imageries, available maps and
digital data to obtain land cover information for watershed modeling purpose
Collection and review of existing relevant information on Kapuas Hulu Basin, including
climate, river flow data and land cover maps
Exploration of local ecological knowledge from the stakeholders of Kapuas Hulu Basin
(local community and policy makers) on hydrological functions, water movement and
consequences of land use options on the landscape
Analysis of existing hydrological data
Estimating the water balance and water use in Kapuas Hulu Basin using GenRiver4 model.
Scenario analyses of plausible land cover changes and their likely impacts on key
performance indicators with the GenRiver model
Land cover/land cover change analysis
Image classification was conducted using object-based classification approach. The object based
is a method of digital image classification based-on creation of spectrally homogenous cluster of
pixels that represent real objects on the earth surface. The cluster of pixel is called image
segments, which contained not only spectral information from the satellite image but also
spatially related information such as area, perimeter, and neighborhood relationship. Together
3 Rapid Hydrological Appraisal (RHA) was developed by ICRAF to assess hydrological functions of a watershed and the impacts of
land use change on key functions. ICRAF has also developed Rapid Carbon Stocks Appraisal (RaCSA) and Rapid
(Agro)Biodiversity Appraisal (RaBA). These are three basic tools that can be used to assess environmental services of a given
area. For more information see http://www.worldagroforestrycentre.org/sea/networks/rupes
4 GenRiver is a generic river flow model developed by ICRAF. For more information, see
http://www.worldagroforestrycentre.org/sea/products/models
-5-with spectral information, the additional spatial information is used to classify certain land
cover/vegetation type on the satellite image.
In this study, we used two scenes of LANDSAT-TM acquired in 2001 and 2004. Landsat
images have 30 m spatial resolution and 7 spectral channels. For the purpose of this study, we
used only channel 3, 4, 5 and 7. Table 2 shows description of Landsat images used in this study
and other additional data.
Accuracy assessment was performed with the aim to provide quantitative estimation on the
quality of information from land cover map by comparing sample locations on the land cover
map with reference data taken during field trip. We used Kappa methods in Arc View.
Training samples for image classification were obtained during field survey on December 2006
and a total of eight land cover classes were identified:
Forest, is an area characterized by more or less dense and extensive natural tree cover usually
consisting of stands varying in characteristics such as species composition, diameter
distribution, total basal area age class.
Agroforestry, refers to a mixed systems (trees and crops) managed by farmers. Often found
near settlement area.
Crop land is defined as an area cultivated with annual crops or non-woody vegetation.
Shrubs are characterized by an area covered by mostly low woody-vegetation combined with
grass.
Table 2. Description of data used in land classification of Kapuas Hulu Basin
Data Description of Data
Landsat 7 ETM Acquisition date: 26 November 1999
Scene ID: 119-60 Spatial resolution: 30 m.
Cloud cover: 10%.
Sun elevation: 57.52
Landsat 7 ETM Acquisition date: 10 July 2001
Scene ID: 119-59 Spatial resolution: 30 m.
Cloud cover: 1%
Sun elevation: 53.59
Landsat 7 ETM Acquisition date: 19 August 2004
Scene ID: 119-60 Spatial resolution: 30 m.
Cloud cover: 1%
Sun elevation: 57.07
Landsat 7 ETM Acquisition date: 19 August 2004
Scene ID: 119-59 Spatial resolution: 30 m.
Cloud cover: 1%
Sun elevation: 57.77
Rencana Tata Ruang dan Scale: 1 : 100 000
Wilayah Propinsi (RTRWP)
-6-Data Description of Data
map Source: Dinas Kehutanan Kapuas Hulu
GPS data GPS data for training sample, obtained on December 2006
Grassland refers to an area dominated by Imperata grass. In some areas, the physical
appearance of grass is almost similar to shrub. The major difference is that most of the
vegetation cover is usually non-woody herbs
Rice field refers to inundated rice field include irrigated or non-irrigated rice field. These areas
usually appear in light blue using visible-NIR-MIR bands combination.
Water body, an area that is inundated or flowed with water, such as lake or stream.
Settlement represents an area used as human residential area, including main road and village
Figure 2. Flow chart of land cover analysis from Landsat image conducted in Rapid Hydrological
Appraisal study in Kapuas Hulu basin (Source: Jeanes, et al., 2004).
Delineation of watershed and its sub-catchments
To delineate watershed area in Kapuas Hulu, we used DEM data from SRTM (Shuttle Radar
Topography Mission), obtained from http://srtm.csi.cgiar.org//. Table 3 list the descriptions of
STRM data used in this study.
-7-Table 3. Description of STRM-DEM data used in delineation of Kapuas Hulu Basin
Product Data File Centre point Year
SRTM 90m DEM srtm_59_12 Latitude 2.50 N 2004
Longitude 117.50 E
SRTM 90m DEM srtm_59_13 Latitude 2.50 S 2004
Longitude 112.50 E
Figure 3. General work flow of hydrological features extraction in ArcView Hydro Module (Source,
Jeanes, et al., 2004).
Notes:
Flow Direction: each cell is assigned a value denoting the direction of the flow based on the height
differences of its neighboring pixels
Sink: cells identified as having no outlet, being the lowest in height compared to its neighboring cells
Flow Accumulation: each cell is assigned a value of accumulated number of cells contributing their flow
to that cell
Knowledge surveys and stakeholder analysis
The objectives of these surveys are to explore the local people and policy makers’ perspectives
and concerns on hydrological issues in Kapuas Hulu Regency, particularly in Kapuas Hulu
Basin. Perspectives from urban water users were also explored.
Local people are the actual land manager that work and interact with watershed landscape on
day to day basis. Policy makers at regency and provincial level are people that have been given
a mandate to control and manage the watershed areas. The policies they create will have strong
influence on the future condition of a watershed. Thus, both local and policy makers views on
watershed hydrological condition are very vital in this overall study.
-8-The knowledge surveys were carried out in Pontianak, Putussibau and Sibau, Mendalam and
Kapuas watersheds in December 2006. The methods used in the survey are adapted from
Knowledge Based Systems developed by Dixon et al. (2001)5.
Climatic, geology and hydrological data of Kapuas Hulu watershed
Up to date data on rainfall and river flow in Kapuas Hulu watershed is very scarce. There were
no continuous monitoring program for water quality or quantity in Kapuas Hulu watershed, thus
there are no continuous water quality or quantity data available.
The only river flow data that we were able to obtain are from Sanggau, located about 590 km
downstream with a catchment area 7 times larger than that of our focus study area), and
downstream of the Danau Sentarum swamps that acts as a buffer. We scaled up our modeled
results for the study area to match this larger scale for the calibration set, as will be discussed
later.
Table 4. List of data on climate, geology and river flow of Kapuas Hulu watershed.
Data Type Year Source
Rainfall Daily rainfall, weather 1996-2005 BMG Putussibau
station: Pangsuma,
Putusibau
Soil Soil map, scale: - REPPROT-WWF Putusibau
1:250000
Hydrology Daily water level, 1997-2006 Proyek Pengendalian dan Pengamanan Banjir
Sanggau station Kalimantan Barat, Seksi Sumber Daya Air, Dinas
Kimpraswil Propinsi Kalbar (Settlement and
Regional Infrastructure Agency)
Estimating the landscape water balance of Kapuas Hulu watershed
To estimate the landscape water balance, we used modeling approach using GenRiver model
(Farida and van Noordwijk, 2004, van Noordwijk et al., 2003), a generic model of land use and
river flow. GenRiver is a distributed process-based model that simulates river flow. It was
developed for data-scarce situations and is based on empirical equations. The model can be
used to explore the basic changes of river flow characteristics across spatial scales – from patch
level, sub-catchment to catchment. GenRiver is a simple river flow model that aims to simulate
changes in river flow due to land use change.
The core of the model is a patch level daily water balance, driven by local rainfall and modified
by the land cover and soil properties of the patch. The patch can contribute to three types of
stream flow: surface-quick flow on the day of the rainfall event, soil-quick flow on the next day
and base flow (simulated as the gradual release of groundwater).
5
More information on local knowledge is also available at Sinclair, FL (1998).
-9-Figure 4.
Diagram flow of
hydrological
processes in GenRiver
The core of the model is a patch level daily water balance, driven by local rainfall and modified
by the land cover and soil properties of the patch. The patch can contribute to three types of
stream flow: surface-quick flow on the day of the rainfall event, soil-quick flow on the next day
and base flow (simulated as the gradual release of groundwater).
The modeling activity was carried out using the following steps:
• Data preparation
• Processing spatial information resulting from spatial analysis The activity conducted in
this step includes producing hydrological features data such as sub-catchment boundary,
drainage, routing distance (distance of streams within sub-catchment to main river), soil
characteristics
• Model parameterization.
• Model calibration using existing data
• Scenario development
• Model simulation with plausible land use change scenarios to understand the impact of
land use change on sub-catchment water balance.
Analysis on Indicators of Watershed Functions: water quantity and water quality
The assessment of hydrological situation in Kapuas Hulu basin is established mostly on criteria
and indicators of water transmission (total water yield per unit rainfall), buffering capacity
(relationship of peak river flow and peak rainfall, linked to flooding risk) and gradual release of
(ground) water in the dry season, based on recharge in the rainy season (Table 5). These
indicators all relate the flows of water to the preceding rainfall – and by doing so; allow the
analysis of the relatively small land use effects, superimposed on substantial year-to-year
variation in rainfall.
As there is a shortage of reliable data on river flow, we first calibrated and validated a water
balance model for the area, and then used this for further exploration of scenarios. As no data
continuous data on sedimentation or erosion exist, we will assess the risk to erosion through
- 10 -level of runoff. This is with an underlying assumption that high run-off would lead to high risk
of erosion.
Analysis of relationship between land cover and water balance
To understand the impact of land cover on landscape water balance and river flow, we will use
modeling approach to simulate land cover change scenarios. The scenarios will be based on the
results of both local knowledge surveys and policy makers’ surveys. The simulation study will
focus on (i) Sibau and (ii) Mendalam catchments where hydrological issues are most prominent.
- 11 -Table 5. Criteria and indicators of watershed hydrological functions that relevant to downstream stakeholders (van Noordwijk, et al., 2004)
Criteria Indicator Quantitative Indicator Site characteristics Relevant for
Water Total water yield (discharge) per unit Q Annual rainfall Downstream water users
TWY = ,
transmission rainfall (TWY)
A× P (mm.year-1)
Q = annual river flow,
A = total watershed area
P = annual precipitation
Buffering peak Buffering indicator for peak flows given Qabs _ Avg Geomorphology Communities living along
BI = 1 − , where
rain event peak rain events (BI)
A × Pabs _ Avg the river and in flood
plains
Pabs _ Avg = ∑ max( P − Pmean ,0)
Qabs _ Avg = ∑ max(Q − Qmean ,0)
Relative buffering indicator, adjusted for ⎛P Qabs _ Avg ⎞
RBI = 1 − ⎜ mean × ⎟
relative water yield (RBI)
⎜Q P ⎟
⎝ mean abs _ Avg ⎠
Buffering peak event (BPE) max( Daily _ Q − Qmean )
BPE = 1 −
A × max( Daily _ P − Pmean )
Fraction of total river discharge derived Direct output from model
from surface quick flow (run off)
Fraction of total river discharge derived Direct output from model
from soil quick flow
Gradual water Lowest of monthly river discharge totals relative to mean monthly rainfall Soil type and Communities who do not
release (water characteristics own water harvesting/
availability storing systems (lake,
during dry Fraction of discharge derived from slow Direct output from model embung)
season) flow (> 1 day after rain event)
Note: Q (mm.day-1) = {[(m3.sec-1) x24 hourx3600 sec.hour-1]/ [A (km2) x106 m2.km-2)]} x103 (mm.m-1)
- 12 -Land use/cover analysis of Kapuas Hulu Basin
The study site
The hydrological study was conducted in December 2006, focusing on three main catchments of
Kapuas Hulu Basin: Sibau, Mendalam and Kapuas (Koheng), with a total area of about 9800
km2 and each catchments covers 19%, 16% and 65% of the whole basin, respectively. The
three main rivers in each catchment meet in Putussibau, the capital of Kapuas Hulu Regency,
West Kalimantan Province.
Geographically, the area lies at 112° 50’ 00’’ – 114° 12’ 00’’ East and 0° 23’ 40’’ – 1° 28’ 00’’
North, administratively under Putussibau and Kedamin District, bordering to Sarawak–
Malaysia in the north, to Manday and Embaloh Hilir District in the South, East Kalimantan and
Central Kalimantan in the east and Embaloh Hulu District to the west.
The topography of Kapuas Hulu Basin encompasses plain, hill and mountainous area, with
elevation ranging from 30 – 2000 m above sea level. The upstream of this area is part of Muller
Mountain range and Kapuas Hulu Mountain range.
Embaloh Group (85%) dominates the geological unit of the area and the rest falls under the
category of Kapuas Complex, Sintang and Selangkai Stones and Lapung Volcanic. The soils of
Kapuas Hulu belong to Ultisol (Podsolic), Inceptisol (cambisol), Histosol (organosol), Gleysol
(Glei humus), and Entisol (Alluvial).
Af-aw climate (Koppen) is the typical climate of the area, which is isothermal tropical rain
climate with hot dry season. The average temperature is around 22º C and average rainfall of
3500-4500 mm per year. Wet months (or total monthly rain of above 200 mm) normally occur
for 10 – 12 months every year.
The river flow pattern varied, from dendritic, parallel and trelis pattern in the northern part and
southern part of Muller Range, as well as anastosomic pattern in the alluvial plain (inundated
areas).
The local community living in the area are mainly of Dayak tribes; Dayak Iban, Taman, Kantu',
Kayan, Bukat, and Punan. According to their livelihood options and community structures, the
Dayak tribes can be categorized into three main groups. Bukat and Punan are hunter gatherers,
living in small groups and leader structures are based on seniority and skills. Orang Iban and
Kantu’ are farmers; they are egalitarian being more open and democratic. Orang Tamambaloh
and Kayan are also farmers with more complex leadership structures.
- 13 -Figure 5. Location of Kapuas Hulu Basin.
Land use/cover change analysis
The result of land cover classification analysis on 2001 and 2004 Landsat imageries are
presented in Table 6 and Figure 6. The land cover map has an overall pixel-level accuracy of
77% (see Appendix 1).
The Kapuas Hulu Basin has an area of approximately 9800 km2. The main land use system in
Kapuas Hulu is forest, covering more than 90% of the area. Only about 3% of the area is
managed by farmers (crop land and agroforestry). The land cover patterns of the three main
sub-catchments (Kapuas, Mendalam and Sibau) are similar.
Based on the RTRWP (Rencana Tata Ruang and Wilayah Propinsi = Provincial Landscape and
Area Planning) map, around 56% of Kapuas Hulu Basin is part of a National Park, 36% under
protected forest, 6% under production forest (limited and permanent) and only 214 km2 (2%) is
free for other land uses including settlement and agricultural cultivation (Table7 and Figure 7).
- 14 -Table 6. Area of Kapuas Hulu Basin in 2001 and 2004 under various land cover
Land cover Class 2001 2004
Area in km2 (Proportion in %) Area in km2 (Proportion in %)
Forest 9001 (91.9) 8873 (90.5)
Agroforestry 252 (2.6) 279 (2.9)
Crop land 7 (0.07) 17 (0.2)
Bush 38 (0.4) 102 (1.0)
Grassland 2 (0.02) 11 (0.1)
Rice field 21 (0.2) 26 (0.3)
Settlement 9 (0.1) 22 (0.2)
Water Body 25 (0.2) 26 (0.3)
No Data (cloud, shadow) 445 (4.5) 445 (4.5)
Total 9800
Table 7. Area of Kapuas Hulu Basin under designated land use categories (based on RTRWP map)
Designated Land Use Total area
(according to RTRWP) Km %
National Park 5502 56
Protected Forest 3487 36
Limited Production Forest 409 4
Permanent Production Forest 152 2
Dry land Agriculture 214 2
Water body 37 0
Total 9800 100
- 15 -Figure 6. Land cover map of Kapuas Hulu Basin based on classified image of Landsat in 1001 and 2004.
- 16 -Figure 7. Map of Kapuas Hulu area under different land use designation based on RTRWP map.
Between 2001 and 2004, forest area in the Kapuas Hulu basin was reduced by around 130 km2,
while the total area managed by farmers increased by around 42 km2. Both are insignificant
changes in terms of percentage to the total basin area, but they represent a substantial relative
increase in the agriculturally used area. Settlement area has more than doubled within this
period. These changes mostly occurred in the designated ‘Dry Agricultural’ land area.
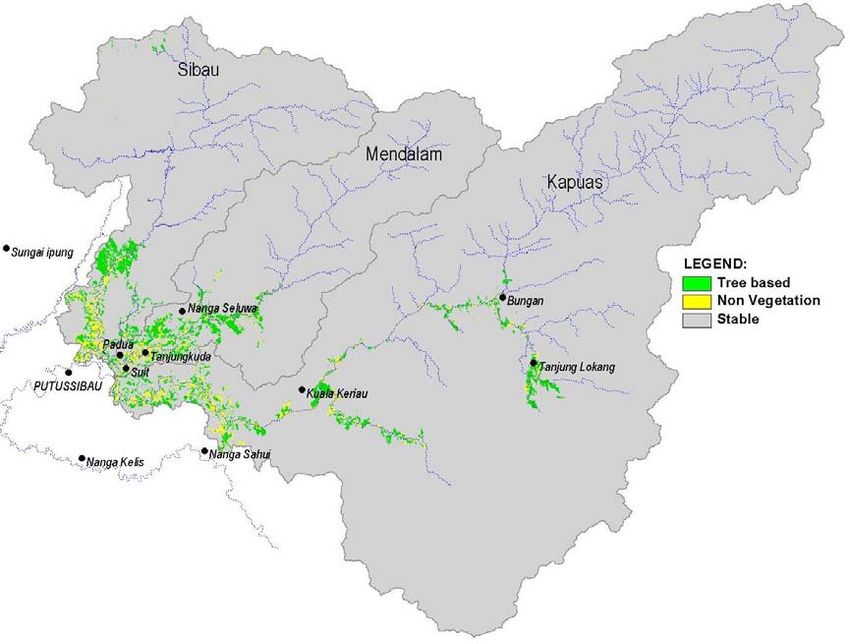
Further analysis showed that most of the land changes occurred along the river (Figure 8).
Areas highlighted in green refer to changes from forest into tree-based systems, while changes
in yellow refer to changes from forest into non-tree systems (crop, shrubs, bush or settlements).
None of the land use changes occurred in the National Park area, showing quite good protection
of the area as well as good stewardships by the people living surrounding the area.
Nevertheless, changes that had occurred along the river, could affect the stability of the river
banks. Direct field observation showed that the riparian condition of Sibau and Mendalam area
are more open compared to Kapuas catchment (Table 8).
Table 8 presented a general overview of the landscape condition in each of the main catchments.
In terms of intensity of land use management, farmers land seems to be the most intensive in
Sibau catchment, where farmers planted many types of vegetables. On the other hand, Kapuas
is the least intensive, where basically farmers still carried out gathering activities.
- 17 -Figure 8. Map of location where land cover changes occurred between 2001 – 2004. Yellow color refers
to area that has changed from forest to non-tree vegetation, while green color refers to changes from
forest to tree-based vegetation.
- 18 -Rice Field Grassland
Water body Settlement
Shrub Cropland
Agroforestry (Tembawang) Forest
Figure 9. Example of land use systems found in Kapuas Hulu Basin (Photo by: RHA Team, World
Agroforestry Centre/ICRAF)
- 19 -Table 8. Landscape situation in Sibau, Mendalam and Kapuas catchments
Sibau Mendalam Kapuas
Catchment area (km2) 1907 1579 6315
Land form PLAIN–UNDULATING
Slope FLAT - STEEP
Land use Forest, tembawang, rubber systems, mixed-tree (rubber, Forest, tembawang, rubber systems, mixed Forest, shrubs, fruit tree systems,
cacao and fruit trees) systems, dryland agriculture, shrubs tree systems, shrubs, dryland agriculture dryland agriculture
Riparian condition Many open areas Many open areas Good condition
Villages Upstream Nanga Potan Nanga Hovat Tosoing Loing, Marang, Berarang, Na.
Bungan, Nanga Lapung
Mid-region Tanjung Lasa, Tanjung Pandan Pagung Uma’, Suling, Teluk telaga Metelunai, Nanga Keriau, Nanga
Balang, Nanga Erak, Nanga Enap
Downstream Bua Manik, Panggilingan Tanjung Karang, Semangkok, Nanga Pulau Lunsara, Lunsara Hulu, Siut,
Sambus Ingko Tambe, Malapi, Suai
Tribe Bukat, Kantuk, Taman, Melayu, Iban Bukat, Kayan, Taman, Melayu Punan, Bukat, Suru, Taman, Melayu
River use Transportation, fishing, drinking water, communal toilet and wash facilities (MCK)
Source of water River River, rainfall, springs
Farmers group KSM Tangke sio mambele, Kelompok Lumut Berdaun Bukit balio None
Main cultivated plants Vegetables: sawi (Brassica juncea), maize (Zea mays), Vegetables: cucumber, maize, groundnut, Kebun: pepper, rubber, tobacco, rubber,
cucumber (Cucumis sativus), kangkung/ water spinach long bean tengkawang, fruits, ginger (Zingiber
(Ipomoea reptans), egg plant (Solanum sp.), kacang cacao (Theobroma cacao), rubber (Hevea officinale), turmeric (Curcuma
panjang/long bean (Vigna sinensis) brassiliensis) domestica)
Tree-based systems: cacao (Theobroma cacao), rubber
(Hevea brassiliensis), pepper (Piper nigrum), tengkawang
Tembawang: tengkawang (Shorea sp.), NTFP: rattan, damar (Shorea sp.), asam
(Shorea spp.), kayu belian (Eusideroxylon zwageri)
kandis (Garcinia urophylla), sengkuang
durian (Durio zibethinus), langsat (Lansium
Tembawang: durian (Durio zibethinus), rambutan (Dracontomelon dao)
domesticum) rambutan (Nephelium sp.),
(Nephelium lappaceum), langsat (Lansium domesticum),
kelengkeng (Dimocarpus longan)
cempedak (Artocarpus integer), nangka (Artocarpus
heterophyllus) and kelengkeng (Dimocarpus longan)
- 20 -Delineation of sub-catchments of Kapuas Hulu Basin
The size of Kapuas Hulu is very large. To enable us to have a good and thorough assessment on
the impact of land cover on water balance, we need to divide the basin into smaller sub-
catchments. Thus, for the purpose of modeling, we divided Kapuas Hulu basin into 16 sub-
catchments.
The focus areas of the study are Mendalam and Sibau catchment, in particular Sibau Hulu
village (sub-catchment 4) and Datah Dian village (sub-catchment 9). These villages are the most
upstream villages and the surrounding landscapes are where land use change by local
community is occurring.
Kapuas Koheng
Mendalam
Sibau
Figure 10. Map of sixteen sub-catchments within Kapuas Hulu Basin.
- 21 -What are the main hydrological problems in
Kapuas Hulu Basin? local community and policy
makers’ perspectives
Local Community Perspectives and Knowledge
People and land use pattern
The majority of the people living in Kapuas Hulu Basin are Dayak people and few are from
Melayu origins. The Dayak tribes are mainly Pukat, Kantu, Tamambaloh, Taman and Iban.
Each tribe has its own culture and livelihood, depending on the history of their arrival to the
area6.
The location of their settlements in the landscape are strongly linked to the land use systems and
livelihood options, and influencing their perceptions and attitude in managing natural resources
(Table 9). Land use pattern also changes along the river. In the upstream area, the land use
systems are less permanent, subsistence in nature and use less technology. In terms of
livelihood options, upstream community also carried out hunting and gathering activities. These
activities provide higher income but at the same time higher uncertainty.
Table 9. Characteristic of the community in Sibau, Mendalam, and Kapuas Koheng Catchments based on
their geographical position.
Upstream Mid-region Downstream
Villages Nanga Potan, Nanga Tanjung Lasa, Padua, Sibau Hilir, Nanga Sambus,
Hovat, Nanga Bungan, Nanga Balang, Matalunai Semangkok, Dalinge
Ethnic Pukat and Punan Kayan and Taman Kayan Taman, and Melayu
group
Land use Traditionally managed Rubber systems and semi- Rubber systems and semi-
complex agroforest and permanent upland systems permanent upland systems
dryland field (dryland and wetland) (dryland and wetland),
Vegetable patch
Livelihood Hunter and gathering Upland rice (fallow Upland rice (fallow systems),
NTFP: eaglewood systems), Livestock breeding
(Aqauilarria sp.), swiftlet Livestock breeding
Trader
nests, gold mining
Trader
(Kapuas Hulu)
Accessibility Limited access to market Medium access to market Good access to market
High transportation cost Medium transportation cost Low transportation cost
Source: interview and observation during LEK Survey (December, 2006)
Local knowledge
Dayak people believe that nature provides signs and guidance to direct them in managing their
life and natural resources. For instance, bird singing is an indicator that it is time to harvest.
6 Further detail on Dayak community around Taman Nasional Bentuang Karimun is available in Ngo M (1998).
- 22 -(a) Forest
Local people believe that forest has economic and ecological function. Forest functions as water
reservoir and can prevent floods and landslide. Forest also the source for human basic need such
food (hunter and gather the food), timber for construction, and also for religious or ritual
process.
The Dayaks use their own customary law in managing forest. Timber harvesting is allowed
only for household need with the leader permission. Only certain trees and animals are allowed
to be harvested.
(b) Vegetation, erosion and river bank collapse
Local people knew the type of trees that has high ecological function as well as high economic
value. They refer to meranti, tengkawang and durian as trees that have strong roots. Bayuan,
tebelian air, sengkuang, rabug and ensurai are good trees to prevent river bank collapse. Bungo
tree and araso grass are good for landslide prevention.
In local perception, erosion and landslide along the river are caused by logging activities in
upstream area and riparian zones and it has caused high economic loss.
(c) Soil
The local typology of soil types is based on observable characteristics and is related to
implications of soil conditions for plant growth. To get good yield from their farming systems,
farmers need to practice a fallow rotation systems, in which they move their plots after two-
years and leave plots to fallow for 5 years.
Fertile soils are black, normally found along the river and upstream. They will produce ‘white’
(clear) water. This type of soil is called tulin soil and bengkinai and meranti trees are normally
found in fertile soil. Soils that have stones and that are reddish or yellow in color are not fertile
as they lack of water and ‘fertilizer’. Peat land is not fertile and produces dark reddish black
water. It is normally found downstream. Another type of infertile soil is gugup soil, which is
normally covered with ferns or grasses. It has dry and hot characteristics and difficult to
cultivate.
Table 10. Soil classification based on local perception and knowledge
Soil type ‘black-reddish’ (peat) ‘liat’ (clay) or ‘white’ ‘black’ soil
soil soil
Indicator Hardwood species, e.g. Cashew, Resam, Softwood species,e.g. Manyam,
(vegetation) Rengas, Jelutung Bungur, Bengkirai, Leban,
Bongut, Mahang, Keniung,
Color Black reddish White yellowish Black or dark brown
Characteristics Low water content, high Sandy, stones, low Porous, high water content,
quantity of humus water content landslide prone
Fertility Less fertile Not fertile Fertile
Location - Upland areas Flat areas
Appropriate Rubber Tengkawang Dry land agriculture
vegetation
Source: interview and observation during LEK Survey (December, 2006)
- 23 -(d) Flood
Local people perceived that reduction in forest cover and high intensity of rain caused flooding.
Nevertheless, they also accepted that flooding is part of their life, even before logging activities
occurred.
Flooding occurred once a year, normally between October to December after the tengkawang
fruiting season.
Hydrological issues
Table 11 presented the various concerns of local people within the three main catchments. In
general, the hydrological concerns among them are more or less similar, related to quantity and
quality of river flow and particularly on river flow fluctuation, water turbidity, pollution, soil
erosion and river bank collapse.
The people perceptions on the main reason for the hydrological problems in general is similar
with slight variation between catchments. In Sibau and Mendalam, people blamed the
establishment of shortcut (pintas) as causing sedimentation. The Mendalam people also
concerned about a recent establishment of forest concession company in the area
(http://www.kompas.com/ver1/Dikbud/0703/26/174657.htm). In Kapuas, mining and small-
scale logging are considered to be the main factors.
Table 11. Hydrological problems as perceived by local people in Sibau Watershed
Sibau Mendalam Kapuas
Hydrological river flow (water depth) fluctuation, turbidity, pollution, soil erosion and river bank collapse,
issue sedimentation
increasing river width
Causing
logging, high intensity of rain, over fishing (poisoning)
Factors
domestic and logging river shortcut construction Gold mining (jack
trash machine)
soil structure (sandy soil), degraded riparian zones Soil structure (prone
degraded riparian zones to erosion)
Impact Transportation problem, decreasing amount and diversity of fish, people having water
related stomach problem,
water turbidity, widening of river, bank widening of river,
sedimentation in the river collapse, bank collapse, lack of
clean water
Efforts made agreement of forest as formation of ’community -
protected area adat forum of Mendalam
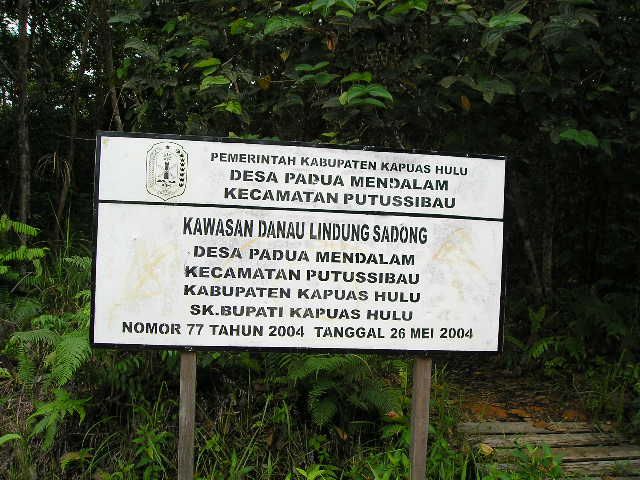
watershed’
declaring Sadong Lake as
protected lake
banning on fishing using
electricity and poison.
community of Melayu
- 24 -Sibau Mendalam Kapuas
Sambus agreement to ban
(i) the use of pesticide and
insecticide when opening
land, (ii) outsiders to open
and exploit land around the
community area.
What they Planting Belian trees planting trees in riparian Community
would like to (Eusideroxylon zwageri), zones development, clean
do/have establishing rubber mixed- ban cutting trees in water,
systems (cacao, banana, Tembawang systems and Better collaboration
coffee), riparian zones, with National Park
ban cutting trees in no forest concession in the and compensation
Tembawang systems and area, re-enactment of from National park
riparian zones, community law Rubber planting
planting trees in riparian ban on the use of poison in More information from
zones and establishing fishing government related to
‘barao’ to prevent bank community group rules and regulation
collapse
development
no forest concession in the
forest and water watch
area, re-enactment of
community law
Figure 11. Sadong Lake area as protected lake area.
- 25 -Policy makers at district level: perception and knowledge on
watershed function
Stakeholder analysis: interest and position
The stakeholder analysis showed the lack of working intergratedly between the various
institutions that manage Kapuas Hulu basin. Table 12 presented the various institutions in
Kapuas Hulu, including their roles and interests.
Table 12. Stakeholder interest and role in watershed management
Stakeholder Role on watershed Watershed Stakeholder Score
management function position role in
in stakeholder watershed
interest management
Water resource agency Supporter 3 4 7
(Direktorat Jenderal Sumber
Daya Air) - Kalimantan Barat
Province
Regional Development Supporter and Policy 3 4 7
Planning Agency (Bappeda) maker
– Kalimantan Barat Province
Environmental Impact Controller, Supporter 4 4 8
Management Agency and Policy maker
(Bapedalda) – Kalimantan
Barat Province
Natural Resource Controller 4 4 8
Conservation Agency -
Kalimantan Barat Province
Kapuas Watershed Controller, supporter 4 5 9
management centre (BPDAS
Kapuas)
Forestry Agency - Controller, supporter 4 5 9
Kalimantan Barat Province and organizer
Mining Agency – Kalimantan Controller, supporter 3 4 7
Barat Province
Environmental service Provide 5 5 10
provider
Environmental service user User 3 5 8
NGO’s Organizer 3 4 7
Public water service (PDAM) User 5 3 8
Kapuas Hulu District
Regional Development Supporter and Policy 3 4 7
Planning Agency (Bappeda) maker
Kapuas Hulu District
Transportation and User and controller 4 4 8
communication agency
Kapuas Hulu District
Energy and Mineral resource Controller and Policy 3 5 8
agency (ESDMLH) Kapuas maker
- 26 -Stakeholder Role on watershed Watershed Stakeholder Score
management function position role in
in stakeholder watershed
interest management
Hulu District
Forestry and plantation Controller, organizer 3 5 8
agency Kapuas Hulu District and policy maker
Agriculture and irrigation Controller, supporter 4 4 8
agency Kapuas Hulu District and organizer
Public works agency Kapuas Supporter 3 4 7
Hulu District
Tourism and Cultural agency Supporter - - -
Kapuas Hulu District
Balai Taman Nasional Supporter and 4 5 9
Betung Kerihun organizer
Note: 1= not important, 2 = less important, 3 = moderately important, 4 = important, 5 = very important. Source: literature and interview
Hydrological issues
The following are the main hydrological concerns of policy makers that related to quality and
quantity of river:
(a) Water flow fluctuation, erosion and sedimentation
Similar to the findings in local community knowledge, the main hydrological issues that the
local stakeholders (provincial and district) found are the fluctuation of water level (water flow).
They indicated that logging activities had caused this problem in two ways (i) decreasing
amount of river flow and (ii) increase river sedimentation (due to erosion), thus decreasing river
depth.
The problem in decreasing water level had caused serious transportation problem in the area as
boat is the main transportation to go up and downstream
(http://www.kompas.com/ver1/nusantara/0610/06/ 165140.htm).
Department of Transportation reported that during the time when water level decreased, boats
with tonnage capacity of above 10 tonnes cannot reach Putussibau. This caused problem in
distribution of goods, particularly food and fuel, thus price increase and electricity shortage
(http://www.kompas.com/ver1/nasional/0608/01/185031.htm).
Policy makers attributed the problem to logging and mining activities as well as conversion of
forest to other land uses. Establishment of ‘shortcuts’ (pintas) on the river had also added to the
problem. Shortcuts’ on river way that is established naturally or artificially has made
transportation by river shorter (thus reducing fuel cost) and reduce flooding incidence. But, it
has caused river banks unstable and collapsing, adding sediments to the river.
- 27 -You can also read