NET ZERO SOUTHLAND Economic Mitigation Pathways Analysis to Net Zero Emissions for Southland
←
→
Page content transcription
If your browser does not render page correctly, please read the page content below
NET ZERO
SOUTHLAND
Economic Mitigation
Pathways Analysis to
Net Zero Emissions
for Southland
March 2021
Table of Contents

Acknowledgements ................................................................................................................. 1
Glossary ................................................................................................................................. 2
1.         Executive summary........................................................................................................ 4
2.         Introduction .................................................................................................................. 7
3.         Motivation for Analysis................................................................................................... 8
4.         Approach and Engagement in Development of this Report................................................. 9
5.         Development of the Mitigation Options and Themes ........................................................ 10
6.         Alignment with the CCC’s Draft Advice .......................................................................... 12
7.         Regional Physical Risks Analysis ................................................................................... 13
8.       Quantitative Transition Modelling Results ...................................................................... 15
     8.1    Business as Usual................................................................................................... 15
     8.2    Mitigation Pathways Analysis .................................................................................. 18
       8.2.1 Technology and Innovation Theme ...................................................................... 18
       8.2.2 Land Use and Agriculture Theme ......................................................................... 22
     8.3    Economic Assessment ............................................................................................ 26
       8.3.1 Net Present Value .............................................................................................. 26
       8.3.2 Marginal Abatement Cost Analysis....................................................................... 30
9.       Discussion................................................................................................................... 36
     9.1     Transport .............................................................................................................. 36
     9.2     Industry ................................................................................................................ 37
     9.3        Land Use and Agriculture ....................................................................................... 37
10.        Conclusion .................................................................................................................. 39
Limitations ........................................................................................................................... 41
References ........................................................................................................................... 42
Appendix A            Technical Method ............................................................................................. 45
Appendix B            Physical Risks and Resulting Economic Impact Analysis ....................................... 57
Appendix C            Sectoral Analysis of Climate Change Risks and Opportunities ............................... 61
Appendix D            Disclaimer ....................................................................................................... 66
Table of Figures Figure 1: Marginal abatement cost curve of the modelled mitigation options. ............................... 5 Figure 2: Infographic demonstrating Southland’s Climate Change Risks (source: Great South). .... 13 Figure 3: Business as usual modelled scenario. ........................................................................ 17 Figure 4: Modelled mitigation pathways of the technology and innovation theme (all options). ..... 19 Figure 5: Modelled mitigation pathways of the land use and agriculture theme (all options). ........ 23 Figure 6: Cumulative cost benefit of the technology and innovation theme. ................................ 27 Figure 7: Cumulative cost benefit of the land use and agriculture theme. ................................... 28 Figure 8: Cumulative cost benefit of the portfolio of all positive NPV options. ............................. 29 Figure 9: Marginal abatement cost curve of the modelled mitigation options. ............................. 31 Figure 10: Fiordland and Islands FMU/sub-region highlighted. ................................................... 58 Figure 11: Waiau FMU/sub-region highlighted. ......................................................................... 58 Figure 12: Aparima FMU/sub-region highlighted. ..................................................................... 59 Figure 13: Ōreti FMU/sub-region highlighted. .......................................................................... 59 Figure 14: Matāura FMU/sub-region highlighted....................................................................... 60 Table of Tables Table 1: Mitigation options developed for the emissions reduction modelling. ............................. 10 Table 2: 100 year Global Warming Potentials (IPCC, Fifth Assessment Report) ........................... 15 Table 3: Key trends under the business as usual scenario by sector. .......................................... 15 Table 4: Key outcomes for the technology and innovation theme. ............................................. 18 Table 5: Mitigation options under the technology and innovation theme. .................................... 20 Table 6: Key outcomes for the land use and agriculture transformation theme. .......................... 22 Table 7: Mitigation options under the land use and agriculture theme. ....................................... 24 Table 8: Modelling results for all mitigation options .................................................................. 26 Table 9: Key metrics for the individual mitigation options. ........................................................ 32 Table 10: Cost by sector. ....................................................................................................... 34 Table 11: Positive NPV options. .............................................................................................. 40
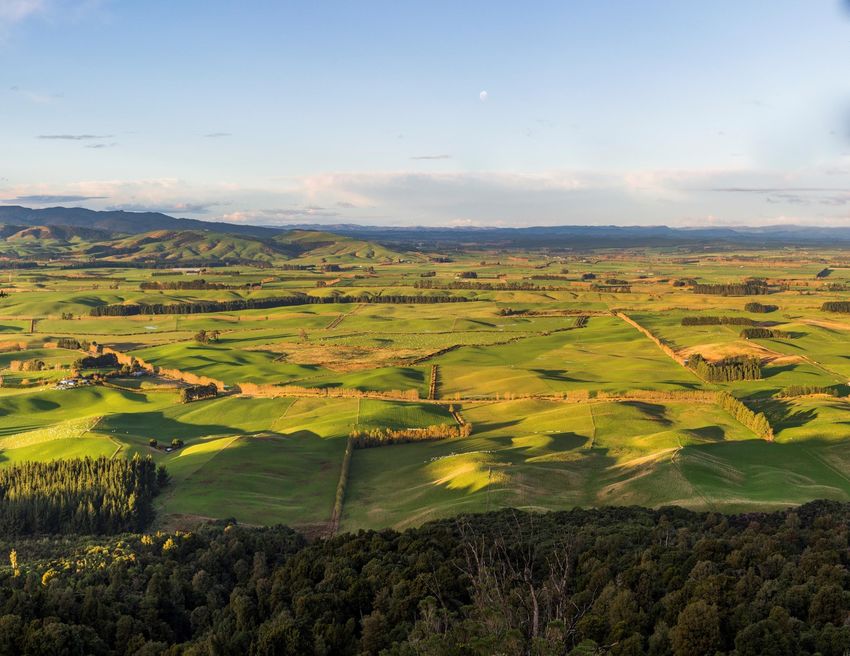
Cover page image courtesy of Great South.
Viewed from Forest Hill Reserve looking north-east
Acknowledgements
Ernst & Young would like to thank contributors to this report during the stakeholder engagement
process; specifically, the youth panel (comprising representatives from YMCA, Fonterra, PowerNet,
Rayonier and FarmRight), Great South (with assistance from Isabel Huther and Lee Atkinson)
Environment Southland, the Fertiliser Association of New Zealand, the Ministry for the Environment,
and The Tindall Foundation.

Great South have engaged Ernst & Young to undertake this work with contributions made by, the
Carbon Neutral Advantage Project Steering Group (Paul Bull – EECA, Mark Hamill – farmer, Richard
Gray – Fonterra, Glenys Dickson – Community and Gore District Councillor, Dale Cocker – HW
Richardson, Rob Phillips – Environment Southland), Carbon Neutral Advantage Advisory Group
(Rebecca Amundsen – Invercargill City Council, Simon Knight – Niagara, Steve Smith – AB Lime, Peter
McDonald – farmer, Wayne McCallum – McCallums, Frank O’Boyle – South Port, Vicky Henry – H&J
Smith, Lindsay Bowmar – Calder Stewart, Nick Tait – Dairy NZ, Christine Henderson – Community,
Donna Morrall – World Sollar, Tim Holland – Milford Sound Tourism, Ashleigh Putt-Fallows – Youth,
India Rose Diack – Youth, Kavi Singh – Powernet, Jim Hargest – Southland Warm Homes Trust, Paul
Horner – Invercargill City Council, Ewen Mathieson – farmer, Tom Kelly – The Warehouse Group,
Marion Poore – former SDHB, John Faul – CH Faul, Marcus Roy – Southland District Council, Margaret
Bailey, Jeremy Rees – Invercargill City Council, Lucy Hicks – Environment Southland, Alex de Boer –
The Electric Motor Vehicle Company), Isabel Huther, Grant Smith, and Alzbeta Bouskova.

Financial support has been received from The Ministry for the Environment and The Tindall
Foundation as part of the Carbon Neutral Advantage Project that Great South is leading.

Great South
Economic Mitigation Pathways Analysis to Net Zero Emissions for Southland                    EY | 1
Glossary
 Term                                Definition
 Abatement                           A reduction in level, especially of something that is harmful.
 AECOM                               An infrastructure firm providing in climate change and
                                     environmental consulting services.
 Aerobic Digestion                   A process which uses bacteria and oxygen to break down organic and
                                     biological waste.
 Baseline                            A starting point used for future comparisons.
 BAU                                 Business as usual.
 BEV                                 Battery electric vehicle.
 Bioenergy                           Renewable energy produced by living organisms.
 Biofuel                             A fuel derived from living matter.
 Biogas                              Gas (methane) derived from the fermentation of organic matter.
 Biogenic                            Produced or brought about by living organisms.
 Biosequestration                    The net removal of carbon dioxide from the atmosphere by plants
                                     and micro-organisms and its storage in vegetative biomass (trees,
                                     plants) and in soils.
 Carbon Sequestration                The process of capturing and storing atmospheric carbon dioxide.
 CCC                                 He Pou a Rangi – Climate Change Commission
 CH4                                 Methane.
 Climate Change                      A change in global or regional climate patterns such as temperature,
                                     precipitation, wind patterns.
 CO2                                 Carbon dioxide.
 Decarbonisation                     To remove or reduce the carbon dioxide emitted in the economy.
 EECA                                Energy Efficiency and Conservation Authority
 Effluent                            Liquid waste or sewage.
 Euro6                               A vehicle exhaust emissions standard for petrol and diesel vehicles
                                     developed by the European Emissions Standards.
 FCEV                                Fuel cell electric vehicle.
 Fossil Fuel                         A fuel formed by natural processes of buried dead organisms of
                                     biological origin.
 GDP                                 Gross Domestic Product.
 Greenhouse Gas                      A gas that contributes to the greenhouse effect by absorbing infrared
                                     radiation.
 ICE                                 Internal combustion engine.
 IPCC                                (United Nations) Intergovernmental Panel on Climate Change.
 IPPU                                Industrial processes and product use.
 kWh                                 Kilowatt hour (measure of energy over time).
 LULUCF                              Land use, land use change, and forestry.
 Marginal Abatement Cost             The comparison between the financial costs and benefits associated
                                     with the implementation of mitigation options and their emissions
                                     abatement potential.
 Mitigation                          The process or result of making something less severe, serious, or
                                     painful.
 Mitigation Pathway                  The resulting pathway modelled from the mitigation option.
 MtC02e                              Megatonnes of carbon dioxide equivalent.
 N02                                 Nitrogen dioxide.
 NDC                                 National Determined Contribution

Great South
Economic Mitigation Pathways Analysis to Net Zero Emissions for Southland                           EY | 2
Net Present Value The difference between the present value of cash inflow and the
present value of cash outflow over a period of time.
Net Zero Emissions The balance between the amount of greenhouse gas put into the
atmosphere and those taken out.
NIWA National Institute of Water and Atmosphere.
PCL Public Conservation Land
Renewable (of a natural resource or source of energy) not depleted when used.
tCO2e Tonnes of carbon dioxide equivalent.
Great South
Economic Mitigation Pathways Analysis to Net Zero Emissions for Southland EY | 31. Executive summary The New Zealand Government has committed to reaching net zero emissions of long lived gases by 2050, and to reducing biogenic methane emissions by between 24-47% by 2050 (Climate Change Commission, 2021). In 2018, Great South in partnership with the Ministry for the Environment and the Tindall Foundation, established the Carbon Neutral Advantage project with the key objective of providing a commitment to supporting Southern industries and communities towards establishing a competitive carbon neutral advantage and creating a sustainable environment for generations to come. The purpose of the Economic Mitigation Pathways Analysis to Net Zero Emissions for Southland report (hereon referred to as the ‘Net Zero Southland Report’) is to establish a baseline for carbon abatement and a high-level economic assessment of achieving net zero greenhouse gas emissions at regional scale. Key outcomes from this report will be the identification of implementable mitigation options for the Southland region, and the economic effect of these options towards achieving net zero emissions by 2050, which is in line with the mandated government directive of achieving net zero emissions by 2050 on a national scale. A baseline emissions profile has been established for the region showing Southland contributes 9.7% to New Zealand’s gross emissions. This equates to 8.9 megatonnes of carbon dioxide equivalent (MtCO2e) of total emissions. Agriculture contributes 69% of gross emissions, and 27.5% of Southland’s gross emissions are offset by exotic and native forestry. Two emission reduction themes were developed and modelled in this analysis reflecting different focus areas: Technology and Innovation, and Land Use and Agriculture. Corresponding mitigation options were identified and modelled to show the mitigation pathway to achieving net zero emissions with an economic analysis undertaken to provide the marginal abatement costs associated with these options. Marginal abatement cost analysis evaluates the financial costs and benefits of implementing the identified mitigation options, and compares this to the mitigation option’s emissions abatement potential, where abatement is the reduction in carbon dioxide equivalent. Figure 1 illustrates this relationship. Simply, the width of each column in the graph represents the potential reduction in carbon dioxide equivalent (expressed as kilotonnes of carbon dioxide equivalent per year), with the height of the column representing the cost of implementing the mitigation option. Negative marginal abatement costs (such as mode shift and industrial boiler fuel switch) indicate an overall financial benefit for implementing the mitigation option. Great South Economic Mitigation Pathways Analysis to Net Zero Emissions for Southland EY | 4
Figure 1: Marginal abatement cost curve of the modelled mitigation options.

Great South
Economic Mitigation Pathways Analysis to Net Zero Emissions for Southland     EY | 5
Key findings from the overall analysis:

    1. Southland is not on track to meet net zero emissions under the current trajectory which is in
       line with the Climate Change Commission’s findings for New Zealand in the Climate Change
       Commission’s 2021 Draft Advice for Consultation (Climate Change Commission, 2021)
       (hereon known as the ‘CCC Draft Advice’).
    2. An economically viable transition pathway to a net zero emissions economy exists for the
       Southland region using identified mitigation pathways which are complementary to the CCC
       Draft Advice.

Key findings from the physical and economic risk analysis:

    1. Projected changes in the climate are diverse, reflecting geographic variability within the
       region. Changes include (but are not limited to) river and surface flooding in parts of the
       region, increased rainfall, rising surface temperatures, and increased hot days and greater
       risk of drought.
    2. Economic impacts from changes in the climate are most strongly felt in the agriculture and
       tourism sectors. Impacts include fluctuations in crop yields and livestock productivity,
       pasture damage, increased expenditure to minimise flood impacts, infrastructure damage
       (e.g. airports) and loss of natural assets (e.g. walking and hiking trails).
    3. All sectors benefit from acting early to implement emissions reduction strategies and limiting
       climate change impacts.

Key findings from the emissions reduction modelling analysis:

    1. The Southland region can transition to a net zero emissions economy through a diverse
       portfolio of options.
    2. Southland can achieve net zero emissions by 2050 from mitigation pathways with a positive
       net financial outcome using carbon pricing recommended by the CCC Draft Advice.
    3. To give effect to emissions reductions across the region requires that action is embraced
       across all sectors.
    4. Investment requirements are focussed on the sectors in which emissions reduction is
       strongest.
    5. 80% of the abatement potential identified comes from mitigation options which provide a
       positive net financial outcome.
    6. Mitigation options with positive net financial outcomes and low implementation costs include
       mode shift. Mitigation options with long-term economic benefits despite high implementation
       costs include fuel switching light vehicles to electric, fuel switching industrial boilers,
       conversion of livestock to crops and horticulture and biofuel capture from effluent.
    7. Positive net present value mitigation pathways not only provide a financial return but
       contribute to reducing the physical impacts from climate change and deliver co-benefits.

Outcomes from the emissions reduction modelling analysis suggest Southland can achieve net zero
emissions by 2050 with positive financial outcomes. To achieve this, a connected approach
encompassing the social, environmental, and cultural values associated with achieving a net zero
emissions future for Southland must be undertaken.

To give effect to the options modelled in this report it is recommended an effective implementation
plan for Southland is developed.

Great South
Economic Mitigation Pathways Analysis to Net Zero Emissions for Southland                     EY | 6
2. Introduction In Aotearoa, the Government has committed to reaching net zero emissions of long lived gases by 2050, and to reducing biogenic methane emissions by between 24-47% by 2050 (Climate Change Commission, 2021). In addition to the economic benefits from reducing emissions and achieving net zero by 2050, transitioning to a low emissions economy will assist in mitigating the physical impacts of climate change. Whilst not quantitatively modelled, it is expected that physical risks from climate change would significantly affect Southland's economy, from infrastructure damage and the loss of tourism attractions, to productivity losses and increased volatility for the agriculture sector. As tourism and agriculture are Southland's largest contributors to GDP, it is critical to minimise its exposure to climate risks. Southland is leading the way in identifying a future pathway to achieving a net zero emissions future where our environment will thrive, and our people will prosper. To that end, Great South (Southland’s regional development agency) have partnered with The Tindall Foundation and the Ministry for the Environment to deliver the Carbon Neutral Advantage project – a three-year initiative bringing together regional industry leaders and community members to work together towards identifying pathways to achieving a low emissions future for Southland, and by extension New Zealand. One of the project’s deliverables is the establishment of an econometric analysis for the Southland region. Ernst & Young have been engaged by Great South to develop an econometric climate change analysis for the Southland region. This analysis comprises reviewing the current physical changes in the climate and the resulting economic risks to the region and comparing these to modelled emissions mitigation options for achieving net zero emissions (long lived and methane) for the Southland region. Development of the mitigation options was focused on key sectors across Southland (transport, industry and land use and agriculture). The modelled net present value and marginal abatement costs have guided where the greatest opportunities to reduce emissions are, while retaining a stable Southland economy. The Net Zero Southland Report is intended to provide options to aid decision making on the journey to achieving a low emissions future for Southland. Great South Economic Mitigation Pathways Analysis to Net Zero Emissions for Southland EY | 7
3.           Motivation for Analysis
The Paris Agreement is a global agreement on climate change entered into force November 2016.
The Paris Agreement commits all countries to act on climate change. New Zealand submitted a
National Determined Contribution (NDC) under the Paris Agreement, committing to reducing
greenhouse gas emissions by 30% below 2005 levels by 2030, which will apply from 2021.

In 2018, the United Nations Intergovernmental Panel on Climate Change (IPCC) released its special
report Global Warming of 1.5oC. In this report, the IPCC alerted that limiting global warming to 1.5oC
to avoid the worst effects of climate change implies reaching net zero emissions by 2050.

In 2019, the New Zealand government released the Climate Change Response (Zero Carbon)
Amendment Act 2019 which provides a framework by which New Zealand can develop and implement
clear and stable climate change policies to achieve New Zealand’s commitment under the Paris
Agreement, and to allow New Zealand to prepare for, and adapt to, the effects of climate change.

In December 2020, New Zealand declared a state of climate emergency and announced the Carbon
Neutral Government Programme requiring all government organisations to be carbon neutral by
2025.

The Carbon Neutral Advantage project, led by Great South, was established in 2018 with specific
project deliverables linked to the partnership funding with Ministry for the Environment and The
Tindall Foundation. One of these deliverables is the development of an econometric climate change
analysis for the Southland region.

This analysis builds on findings from:

•     The Southland Climate Change Report (NIWA, 2018) prepared by the National Institute of Water
      and Atmosphere (NIWA) for Environment Southland, Invercargill City Council, Southland District
      Council and Gore District Council.

•     The Southland Regional Greenhouse Gas Emissions Inventory (AECOM, 2018) developed by
      AECOM for Great South.

•     Wood Energy South (www.woodenergysouth.co.nz) – a project which Venture Southland1 in
      conjunction with EECA coordinated as an authoritative source of current information and best
      practice aimed at promoting the use, and development of supply chains for clean wood energy in
      Southland.

•     The Southland Dairy Biogas Project (Dairy Green Ltd, n.d.) – a methane recovery project
      facilitated by Dairy Green Ltd on a 950 cow farm in Southland.

•     The Strategy for Sustainable Business in Southland (Venture Southland, Sinclair Knight Merz Ltd,
      2008).

1
    Venture Southland became Great South in March 2019.

Great South
Economic Mitigation Pathways Analysis to Net Zero Emissions for Southland                       EY | 8
4. Approach and Engagement in Development of this
Report
Great South have facilitated a collaborative approach and engaging process in the development of
the Net Zero Southland Report.
Ernst & Young has a demonstrated history of providing expert climate change and economic
modelling services to clients. To that end, Ernst & Young were engaged by Great South to identify,
develop, model, and analyse economically viable mitigation scenarios to assist Southland with
striving towards a net zero emissions future.
Specifically, Ernst & Young were engaged to conduct a review of the physical risks and potential
economic impacts that climate change poses for Southland (Section 8), and to model for emissions
reduction under a business as usual setting (Section 9.1), and under a mitigation scenario setting
(Section 9.2).
A panel of youth (aged 18-25 years’ old) representing the diverse economy, community and
institutions in Southland was established with the purpose of engaging young minds to brainstorm
their idea of what a net zero emissions future looks like for Southland, and the associated co-benefits.
These outputs were used by Ernst & Young in their emissions reduction modelling.
Great South Strategic Projects workshopped mitigation options for Southland, with a focus towards
identifying probable mitigation pathways, where the implementation probability scale correlates with
being able to deliver on some of these options within the next ten years. Like the CCC Draft Advice
released 31 January 2021, these mitigation options are focused on key sectors across the Southland
region, identifying where the greatest opportunities to reduce emissions are.
The Carbon Neutral Advantage Project Steering and Advisory Groups were engaged to provide
governance, technical expertise, and leadership in the development of this foundational report.
Great South
Economic Mitigation Pathways Analysis to Net Zero Emissions for Southland EY | 95. Development of the Mitigation Options and Themes
Ernst & Young and Great South collaboratively developed mitigation options that were used in the
emissions reduction modelling. These options were largely determined from the emissions baseline
and business as usual projection. Ernst & Young also engaged with the youth panel in a workshop
setting to brainstorm and formulate mitigation options. The outputs from this workshop enabled
Ernst & Young to identify a scaffold from which to present these options and the creation of two
themes emerged: Technology and Innovation, and Land Use and Agriculture.
In a second iteration undertaken during the development of this report, Great South further refined
these mitigation options to reflect a probability scale, whereby the probability of implementing the
mitigation option within the next 1-10 years was determined. Great South also linked these probable
mitigation options to the highest emitting sectors for the Southland region: land use and agriculture,
industry, and transport. The results of this are detailed in Table 1.
Table 1: Mitigation options developed for the emissions reduction modelling.
Theme Sector Mitigation Option Description
Floor and ceiling insulation, and double-
Residential space
glazed windows in 80% of existing
heating improvements
residential homes by 2050.
Capture of methane gas produced in
Landfill methane gas
landfills for combustion use primarily, and
capture
to supply electrical as secondary.
Converting all boilers from fossil fuels to
Commercial boiler fuel
biomass, pellets and electricity at planned
Industry transition
replacement year or asset end of life.
Converting all boilers from fossil fuels to
Industrial boiler fuel
biomass and pellets at planned
transition
replacement year or asset end of life.
Capture of methane gas generated from
Biogas capture from food waste, and generation of biogas in an
food waste anaerobic digestion facility to substitute
electricity consumption.
Commuters living less than 5km from work
Technology
shifting mode of transport from car to
and Mode shift
cycling, walking, public transport or shared
Innovation
transport.
Transition heavy vehicles from fossil fuels
Transport Heavy vehicle
to hydrogen, achieving a 60% share by
transition to hydrogen
2050.
Increasing the electric vehicle uptake rate
Light vehicle transition
for light vehicles to achieve a 92% electric
to electric
vehicle share for this class by 2050.
Capture of methane from dairy cattle
Biogas capture from
effluent at 430 Southland dairy farms with
dairy effluent
the energy generated to be used on-farm.
Converting 1,500ha high producing
Land Use
Public Conservation grassland, 18,500ha low producing and
and
Land (PCL) transition 4,500ha with woody biomass from Public
Agriculture
to native forest Conservation Land (“PCL”) to natural
forest by 2050.
Selective breeding of dairy cattle, beef
Selective breeding
cattle and sheep that exhibit low residual
Great South
Economic Mitigation Pathways Analysis to Net Zero Emissions for Southland EY | 10methane production. 30% adoption for
cattle and 80% adoption for sheep.
56,500 ha high producing land, 6,500 ha
low producing land and 2,000 ha grassland
with woody biomass converted to 50%
Grassland2 transition to
natural forest and 50% grassland with
riparian planting
woody biomass. This was modelled as a
piecewise uptake, with 50% of conversion
occurring between 2045-2050.
Land Use
A net conversion of 7% from low producing
and Grassland transition to
farmland to forestry (half exotic and half
Agriculture forestry
native forest).
A net conversion of 4.1% from farmland
Farmland3 transition to
used for livestock raising, to crops and
horticulture
horticulture between 2020 and 2050.
A 10% stock reduction in dairy cattle, beef
Farm stock reduction cattle and sheep applied linearly from 2035
to 2050.
2
‘Grassland’ is categorised by high producing, low producing and woody biomass as defined by the Land Use and Carbon
Analysis System – Satellite imagery interpretation guide for land-use classes report prepared by Ministry for the Environment.
3
‘Farmland’ is defined as being used for livestock raising (Parliamentary Commissioner for the Environment, 2019).
Great South
Economic Mitigation Pathways Analysis to Net Zero Emissions for Southland EY | 116. Alignment with the CCC’s Draft Advice It is important to note that the assumptions underpinning the mitigation options are in alignment with the CCC Draft Advice released in January 2021. Like the CCC Draft Advice, this report notes that current policies do not put New Zealand on track to meet the emissions budget under the Zero Carbon Act. This conclusion is reflected in our business-as-usual modelling. Ernst & Young’s emissions reduction modelling adopted the Transition Pathway One (TP1) carbon price, the most conservative price projection. This projection influenced the land use change observed under business-as-usual. The Climate Change Commission also separated carbon pricing into biogenic methane (ETS2) and all other gases (ETS1), with the biogenic methane price curve differing from all other gases by reducing in price from 2035 on, while the ETS1 continues to climb, resulting in the ETS1 price being six times higher than biogenic methane in 2050. Ernst & Young’s emissions reduction modelling adopted a similar approach, applying the ETS2 carbon price to options with biogenic methane and the ETS1 carbon price to all other options. Under the modelled business-as-usual, agricultural forecasts align with the CCC Draft Advice with a 15% reduction in livestock numbers modelled by 2035. Like the CCC Draft Advice, this analysis includes a similar rate of uptake for light vehicle transition to electric vehicle by 2050. In this analysis a transition to hydrogen fuel for heavy transport was modelled. The reason for this was that Southland acknowledges the real opportunity for this as a mitigation option in the region. This differs from the modelled heavy transport option in the CCC Draft Advice. The conclusions from this report align with key findings from the CCC Draft Advice, which lays out the course for reducing emissions in New Zealand. However, the modelling scope and approach differs, so results may not be directly comparable. Great South Economic Mitigation Pathways Analysis to Net Zero Emissions for Southland EY | 12
7.          Regional Physical Risks Analysis
Flooding and heatwaves are the two most prevalent physical risks Southland is predicted to
experience. Fiordland is forecast to be most significantly impacted by the increase in rainfall, and the
upper centre of Southland to be most affected by drought and an increase in hot days 4. NIWA, 2018
predicts Southland's climate out to 2100 using climate markers such as temperature, precipitation,
and rain frequency. This analysis used four Representation Concentration Pathway (RCP) scenarios,
which indicate the increase in radiative force compared to pre-industrial values. All scenarios are
possible, depending on how little action is taken to mitigate GHG emissions. The most significant
impacts under the RCP8.5 scenario are considered in the analysis below, aligning to 3-4°C of warming
by 2100, significantly over the goals set under the Paris Agreement and the Zero Carbon Act.

Figure 2 provides a high-level overview of Southland's Climate Change Risks in a simple infographic.
With sea level rise affecting the southern coast; increased rainfall in Fiordland and the headwaters of
all Southland’s major rivers (Waiau, Aparima, Ōreti and Matāura); and increased hot days and drought
risk across both the northern, and southern Southland plains.

Figure 2: Infographic demonstrating Southland’s Climate Change Risks (source: Great South).

The differing sub-regional climate risks and key economic industries require localised adaptation
strategies to maximise regional resilience. High level sub-regional summaries are presented in

4
    (NIWA, 2018)

Great South
Economic Mitigation Pathways Analysis to Net Zero Emissions for Southland                       EY | 13
Appendix B and focus on the physical changes in the climate that will have the biggest local economic impact. Great South Economic Mitigation Pathways Analysis to Net Zero Emissions for Southland EY | 14
8.         Quantitative Transition Modelling Results
Future GHG emissions projections are uncertain, encompassing unknowns in population and
economic growth, technological developments, political, social and climate change. Acknowledging
this level of uncertainty and using available data (refer to Appendix A for further detail), Ernst &
Young developed credible mitigation pathways for achieving net zero emissions to assist Great South
with evaluating and prioritising emissions mitigation options.

Carbon Dioxide Equivalent
Results from the emissions reduction modelling are expressed in carbon dioxide equivalent (CO 2e)
using the 100-year Global Warming Potential values.

The Global Warming Potential (GWP) is a concept used in calculating the “carbon dioxide equivalent”
(CO2e) of a mix of greenhouse gases, i.e. carbon dioxide, methane, nitrous oxide. The GWP is used
to represent the effect of a particular gas’s effect on global warming: how strongly it absorbs infrared
radiation and how long it stays in the atmosphere. The GWP describes the number of grams of carbon
dioxide that would provide the same “warming” effect over a certain period of time as one gram of
the gas of interest.

Table 2 shows the GWPs for the different greenhouse gases for a 100-year time horizon.

Table 2: 100 year Global Warming Potentials (IPCC, Fifth Assessment Report)
 Carbon dioxide (CO2)                    Methane (CH4)                      Nitrous oxide (N2O)
 1                                       28                                 265

For example, methane has a 100 year global warming potential of 28, which suggests that for a given
weight of methane released into the atmosphere now, would have 28 times as much effect on global
warming over the next 100 years as would the same amount of carbon dioxide.

8.1        Business as Usual
Modelling a future where no additional mitigation options are implemented, "business as usual", is
an important part of emissions reduction analysis as it provides a baseline against which to assess
the impact of mitigation options. The business as usual scenario assumes that there will be no
significant changes in technology, economics, or policies but current available mitigation options
continue to be deployed. The business as usual scenario models what would happen if we did nothing
beyond the status-quo. The key trends underpinning the Southland region's business as usual
scenario are detailed in Table 3. The modelled assumptions used to support these trends are provided
in Appendix A.

Table 3: Key trends under the business as usual scenario by sector.
 Sector                          Key trends
 Agriculture                     Declining livestock numbers; falling nitrogen fertiliser application.
 LULUCF (Land Use,               Converting low producing land to forestry (at a net conversion of 14%
 Land Use Change, &              from 2020 to 2050).
 Forestry)
 Transport                       Electric and hydrogen fuel cell vehicle uptake in the light and heavy
                                 vehicle classes and in off-road vehicles.
 Residential                     Relatively constant emissions, tied to population forecasts.

Great South
Economic Mitigation Pathways Analysis to Net Zero Emissions for Southland                           EY | 15
Commercial Rising emissions, tied to economic growth forecasts.
Industrial Gradually falling emissions, tied to economic growth forecasts but
offset by expected efficiency improvements; the New Zealand
Aluminium Smelter closure significantly reduces emissions from this
sector.
Industrial Processes Trends follow national emissions projections which sees IPPU
and Product Use (IPPU) emissions rise in the near term and then gradually fall from around
2025; the New Zealand Aluminium Smelter closure significantly
reduces emissions from this sector.
Waste Rising emissions due to constant waste to landfill and rising degradable
organic carbon stock.
The sectoral emissions profile of the business as usual scenario is depicted in Figure 3. By 2050, the
Southland region's net emissions fall from 4.7 MtCO2e in 2018 to 1.3 MtCO2e in 2050, a reduction
of 73%. Southland's gross emissions reduce by 33% from 2018 to 2050 and Southland's land use,
land-use change, and forestry (“LULUCF”) sector is able to sequester nearly 4 MtCO 2e (76% of
Southland's gross emissions) by 2050.
The highest emitting sectors in the Southland region are agriculture, industry, and transport
(AECOM, 2018).
The industrial processes and product use (“IPPU”) sector baseline data is drawn from many sources.
Given limited data to accurately assess the baseline emissions from the IPPU sector, this sector has
been excluded from the following mitigation analysis. The IPPU sector covers greenhouse gas
emissions occurring from industrial processes, from the use of greenhouse gases in products, and
from non-energy uses of fossil fuel carbon.
Great South
Economic Mitigation Pathways Analysis to Net Zero Emissions for Southland EY | 169,000,000
7,000,000
5,000,000 Waste
IPPU
Industrial
3,000,000
Commercial
tCO2e pa
Residential
Transport
1,000,000
Agriculture
LULUCF
2018 2022 2026 2030 2034 2038 2042 2046 2050
-1,000,000 Net Total
-3,000,000
-5,000,000
Figure 3: Business as usual modelled scenario.
Great South
Economic Mitigation Pathways Analysis to Net Zero Emissions for Southland EY | 178.2 Mitigation Pathways Analysis
Two emissions reduction themes were modelled: a Technology and Innovation theme and a Land Use
and Agriculture theme. Both themes achieve net zero emissions by 2050, however, the sectoral and
economic impacts are distinct. It should be noted that whilst mitigation options have been grouped
in this way for the purposes of this analysis, nothing precludes Southland from pursuing its own
portfolio of options.
“Key outcomes” (Table 4 and Table 6) are expressed as:
• Net Present Value (NPV) – is the value of all future cashflows (benefits less costs) discounted
to a present value. Assumptions underpinning these costs are provided in Appendix A.
• Total Abatement – is the total reduction in carbon dioxide equivalent emissions to be realised
by 2050.
• Average Annual Abatement – is the reduction in carbon dioxide equivalent emissions
averaged for each year out to 2050.
• Average cost per tCO2e abated – is the Net Present Value divided by the Total Abatement to
give the average net present value (expressed in dollars) per tonne of carbon dioxide
equivalent that is abated.
8.2.1 Technology and Innovation Theme
This theme relies on a diverse technology mix of options across sectors combined achieving net zero.
It reflects a collaborative approach to emissions reduction, as each sector implements mitigation
options.
This theme includes mitigation options from the land use and agriculture sectors; specifically,
selective breeding, biofuel capture from dairy effluent and Public Conservation Land transformation.
These mitigation options are included in this theme, as they reflect technological improvements and
innovation within the agricultural sector, rather than requiring land-use changes.
The path to net zero emissions under this theme is gradual and the overarching economic outcome
is positive. Only targeting the positive net present value options will be even more favourable.
The key outcomes from this theme are in Table 4 and the mitigation path of all mitigation options are
presented in Figure 4.
Table 4: Key outcomes for the technology and innovation theme.
Average Average cost Net zero
Net present Total
annual per tCO2e emissions
value abatement
abatement abated5 achieved by
788 ktCO2e /
All options $ 788 million 23.1 MtCO2e -$34 / tCO2e 2050
yr
Only positive 777 ktCO2e /
$ 817 million 22.8 MtCO2e -$36 / tCO2e 2050
NPV options yr
5
A negative result represents a financial benefit per tonne of abatement, as opposed to a cost
Great South
Economic Mitigation Pathways Analysis to Net Zero Emissions for Southland EY | 18Landfill gas capture
5,000,000
Food waste to bioenergy
Residential space heating
4,000,000 improvements
switch
Commercial boiler fuel transition
Emissions (tCO2e)
transition
Industrial boiler fuel switch
3,000,000
2050
Mode shift
2,000,000 Heavy vehicle transition to
hydrogen
Light vehicle transition to electric
1,000,000
Selective breeding
Biofuel capture from dairy
Biogas effluent
effluent
0
2018 2022 2026 2030 2034 2038 2042 2046 2050 PCL transition
natural forest transformation
to native forest
Residual emissions
-1,000,000
Year
Figure 4: Modelled mitigation pathways of the technology and innovation theme (all options).
Great South
Economic Mitigation Pathways Analysis to Net Zero Emissions for Southland EY | 19A description of each mitigation option underpinning this theme and their high level assumptions are
listed in Table 5. Appendix A provides the detailed assumptions used in the emissions reduction
modelling.
Table 5: Mitigation options under the technology and innovation theme.
Option High level assumption
Landfill methane gas Capture of methane gas produced in landfills for combustion use
capture primarily, and to supply electrical as secondary.
Diverting 10,000 tonnes of food waste per annum from landfill to use
Biogas capture from
as generation of biogas in an anaerobic digestion facility to substitute
food waste
process heat and electricity consumption.
Residential space Floor and ceiling insulation, and double-glazed windows in 80% of
heating improvements existing residential homes by 2050.
Commercial boiler fuel Converting all boilers from fossil fuels to biomass, pellets or
transition electricity at planned replacement year or asset end of life.
Industrial boiler fuel Converting all boilers from fossil fuels to biomass, pellets or
transition electricity at planned replacement year or asset end of life.
30% of commuters living less than 5km from work shifting mode of
Mode shift transport from car to cycling, walking, public transport or shared
transport.
Heavy vehicle transition Transition heavy vehicles from fossil fuels to green hydrogen,
to hydrogen achieving a 60% share by 2050.
Light vehicle transition Increasing the electric vehicle uptake rate for light vehicles to
to electric achieve a 92% electric vehicle share for this class by 2050.
Selective breeding of dairy cattle, beef cattle and sheep that exhibit
Selective breeding low residual methane production. 80% adoption assumed for sheep
and 30% for dairy and beef cattle.
Biogas capture from Capture of methane from dairy cattle effluent at 430 Southland dairy
dairy effluent farms with the energy generated to be used on-farm.
Public Conservation Converting a net 1,500ha high producing grassland, 18,500ha low
Land (PCL) transition to producing and 4,500ha with woody biomass from Public
native forest Conservation Land to natural forest by 2050.
8.2.1.1 Challenges, Opportunities and Co-Benefits
Challenges
The main barrier for implementing innovative and technology-based options is the large upfront
costs. This is a common barrier to implementing emissions reduction activities, such as switching to
passenger electric vehicles. A review of barriers to electric vehicle uptake by the New Zealand
Government highlighted that the upfront purchase price is the most significant and requires
marketing or financial product innovation to overcome short-sightedness and human nature to
preference smaller-sooner over larger-later rewards6. Capital and behavioural constraints will need
to be overcome, as it is important to allocate capital today to avoid cost blowouts in the future.
Interventions to overcome these barriers will lead to better long-term financial and environmental
outcomes, potentially avoiding future write-offs and stranded assets.
6
(Hearnshaw & Girvan, 2018)
Great South
Economic Mitigation Pathways Analysis to Net Zero Emissions for Southland EY | 20Several options within this theme entail significant fuel switching. For this theme to be feasible, a
long-term secure supply of biomass is needed. Venture Southland in conjunction with Energy
Efficiency & Conservation Authority (EECA) conducted the Wood Energy South project7 which found
that Southland's corporate forest estate is significant, stable, and provides a reliable woodflow
supply. Furthermore, woodflows are planned to increase significantly in the future. This steady
increase in harvest volume provides a secure supply for biomass users, which should be sustained
into the future.
A consideration for selective breeding is the relationship between animals which exhibit low residual
methane production and other favourable characteristics. It is expected that these won't be
correlated, at least not as a general rule. It's therefore critical to determine whether there are
sufficient incentives in place for farmers to choose to breed on the basis of low residual methane
production as opposed to other characteristics, such as high milk production.
Current legislative challenges that reside within the “PCL transition to native forestry” mitigation
option, includes the prevention of planting on Crown owned land administered by the Department of
Conservation and/or local and regional councils.
Opportunities
There is an immediate opportunity to transition existing coal boilers to wood pellets or dried wood
chip now rather than wait to end-of-asset-life. Conversion to wood pellets or dried wood chip would
require changes to the fuel handling, storage infrastructure, and controls, and consideration would
need to be given to the condition of the existing boilers, when they were commissioned, and their
maintenance regime. Notwithstanding the immediate effect to carbon abatement that would be
achieved with transitioning away from coal, the reduction in particulate emissions to atmosphere will
improve air quality and thereby social and human health improvements.
Biogas capture and utilisation represents a significant opportunity for Southland. Methane capture
from organic matter at landfills, wastewater treatment facilities and agricultural production can be
captured and used primarily as process heat, but also to supply as electricity to the local grid.
The “biogas capture from food waste” mitigation option offers additional benefits to that of diverting
food waste from landfill to a dedicated aerobic digestion facility. There is potential to establish biogas
capture facilities on existing processing sites where generated food grade waste can be diverted from
wastewater treatment plants to the onsite biogas facility where the product gas can be directly
utilised.
With 58% of Southland's land either a national park or covered by the Conservation Estate of the
Department of Conservation, there are significant opportunities for the public sector to either create
initiatives or partnerships with private organisations and community groups to increase tree planting
on these estates. Specifically planting to “right tree, right place” within riparian strips, ex-lease
Public Conservation Land, and low marginal lands, with the co-benefits of any income generated from
the regional carbon sink able to be invested back into the local community, plus displacing the
potential for pest weeds to establish.
7
(Wood energy south, n.d.)
Great South
Economic Mitigation Pathways Analysis to Net Zero Emissions for Southland EY | 21Co-Benefits
Alongside the modelled emissions reductions benefits, and corresponding financial benefits, a
number of the mitigation options contribute additional benefits to society and the natural world.
• Most will be linked with air quality improvements, as reducing emissions for climate change
reasons will directly impact this factor as well.
• Commuter mode shift will likely increase social connectivity, reduce congestion, free up
people’s time, and lead to mental and physical health improvements.
• Electrification of the light vehicle fleet will provide added storage capacity and modularity
in the power network, providing real resilience benefits to energy and electricity supply.
• Capturing gas from dairy, industrial and metropolitan effluent, and food waste streams will
allow for the potential of either electricity generation or production of biofuel. Situating
these aerobic digestion plants alongside existing industry can provide significant process
efficiencies, energy sharing and waste reduction through circular use of products.
• Native tree planting will provide additional biodiversity benefits.
• Focussing on innovation and emerging low-emissions technologies will provide potential job
creation and the possibility of new export markets.
8.2.2 Land Use and Agriculture Theme
This theme focuses primarily on transforming Southland's agricultural sector, which accounts for
69% of the region's emissions. The mitigation pathways not only reflect the greatest opportunity for
emissions reduction, but also takes into consideration the wellbeing of the land, with the co-benefits
of improved air and water quality.
The mitigation potential of the modelled pathways starts slowly before accelerating to net zero due
to increasing and maturing forest estate. The combined financial metrics for this theme are less
favourable compared to the Technology and Innovation theme, with a lower NPV of $220 million.
However, this theme is expected to reach net zero earlier at 2045, before going beyond net zero.
Table 6: Key outcomes for the land use and agriculture transformation theme.
Net zero
Average Average cost
Net present Total emissions
annual per tCO2e
value abatement achieved
abatement abated
by
1,074 ktCO2e /
All options $ 220 million 30.7 MtCO2e -$7 / tCO2e 2045
yr
Only positive
$ 514 million 907 ktCO2e / yr 28.0 MtCO2e -$18 / tCO2e 2046
NPV options
Great South
Economic Mitigation Pathways Analysis to Net Zero Emissions for Southland EY | 226,000,000
5,000,000
Emissions (tCO2e)
4,000,000
2045
3,000,000
2,000,000
Farm mix
Farm stock reduction
change and intensity
1,000,000 reduction
Grassland transition
Riparian natural to transformation
forest riparian
planting
0
2018 2022 2026 2030 2034 2038 2042 2046 2050 Farmland to
Livestock transition to horticulture
crops and horticulture
-1,000,000 Grassland transition
Land conversion to forestry
to forestry
Residual emissions
-2,000,000
Year
Figure 5: Modelled mitigation pathways of the land use and agriculture theme (all options).
Great South
Economic Mitigation Pathways Analysis to Net Zero Emissions for Southland EY | 23A description of each mitigation option underpinning this theme and their high-level assumptions are
listed in Table 7. Appendix A provides the detailed assumptions used in the emissions reduction
modelling.
Table 7: Mitigation options under the land use and agriculture theme.
Option High level assumption
Grassland transition to A net conversion of 7% from low producing farmland to forestry
forestry between 2020 and 2050 (using the Motu model8 for land change
under the high carbon price scenario).
Farm stock reduction A 10% stock reduction in dairy cattle, beef cattle and sheep applied
linearly from 2035 to 2050. This acts to increase land used by each
animal.
Farmland transition to A net conversion of 4.1% from farmland used for livestock raising to
horticulture crops and horticulture between 2020 and 2050 (using the Motu
model).
Grassland transition to 56,500 ha of high producing land, 6,500 ha low producing land and
riparian planting 2,000 ha grassland with woody biomass converted to 50% natural
forest and 50% grassland with woody biomass. This was modelled as
a piecewise uptake, with 50% of conversion occurring between 2045-
2050.
8.2.2.1 Challenges, Opportunities and Co-Benefits
Challenges
Under the “Grassland transition to forestry” mitigation option, low producing farmland is converted
equally into pine forest (harvested at 25 years) and native forest (not harvested thus acting as a
carbon bank) and includes the cost of land conversion, planting, pruning and insurance. The inclusion
of agriculture and forestry in the New Zealand Emissions Trading Scheme (NZ ETS) is a large driver
behind this option's financial benefit. However, it is not a silver bullet. The Forestry Reference Group
highlighted in their recent report that the potential of the NZ ETS to encourage afforestation is
confounded by the reluctance of farmers to change land use, uncertainty around carbon prices, high
land prices, and controls on forest establishment and harvesting. Unless these factors are addressed
in ways that fairly spread the sectoral costs, it is unlikely; anything like the area of trees suggested
in zero-carbon models will be planted9.
Whilst farm stock reduction has little economic appeal, there is a growing appetite for sustainably
raised meats. One benefit of reducing farm intensity, in conjunction with other regenerative
measures, may be access to the market for low carbon and sustainable agricultural products. These
8
Motu (a research institute) modelled the interaction between carbon price and land use change for a report commissioned
by the parliamentary commissioner for the environment. This model incorporates the Land Use in Rural New Zealand
(LURNZ) model to simulate how major land use sectors (forestry, horticulture, dairy, sheep and beef farming) change in
response to changes in the carbon price. This is driven by two sub-models that are econometrically estimated. The first
incorporates national level drivers of change (including commodity prices), while the second is a spatial model determining
the spatial location of land use relating to geophysical characteristics of the land (e.g. slope, land use capability) to fin d
proxies for cost of market access and feasibility of conversion. With the spatial projection, the LURNZ model determines land
production, associated emissions and in turn profitability of each parcel of land. Changing the carbon price effects the
optimal distribution of land. Southland’s land transformation theme used the land change associated with a higher carbon
price, capturing the hectares of land that are spatially able to be converted.
9
(Forestry Reference Group, 2018)
Great South
Economic Mitigation Pathways Analysis to Net Zero Emissions for Southland EY | 24products generally earn a price premium to their unsustainable counterparts. This premium has not
been modelled as part of this analysis.
Feasibility studies at the farm-level are needed to realise these opportunities. Considering livestock
to crops and horticulture, these studies will ensure that; crops are selected that suit the land's soil
and climate, costs are known, retail ties are created, and skilled labour is available to assist with the
conversion. Careful consideration of additional inputs required in the conversion to horticultural,
such as fertiliser and water, is required to ensure the conversion will reduce emissions and not
jeopardise other natural resources. Local governments or Government-owned entities, such as
Pāmu, may choose to adopt a leadership position and convert low producing council land into forest
estate or trial new farming low-emissions practices.
Opportunities
A key consideration for “Farmland transition to horticulture” mitigation option is the suitability of
different plants to Southland's climate and terrain. Crops that have been considered as being
commercially viable in Southland include oats, hemp, blueberries and amaranth grain 10. It should be
noted that average earnings before interest and taxes per ha data was used to derive the financials.
As the analysis was high-level and not at the implementation level, we did not look at the feasibility
of individual crops and the potential opportunity that exists for each crop. New Zealand's social
awareness of climate change is increasing with 1 in 3 New Zealanders consciously limiting their meat
consumption11. The conversion of farmland to the production of vegetarian protein alternatives may
allow farmers to position themselves in line with this emerging trend. Furthermore, reduced supply
of meat proteins production may assist in stabilising the profitability of meat farms that choose to
continue operating.
Co-Benefits
The mitigation options identified in the land use and agriculture theme all share some significant key
co-benefits. Water quality, air purification, habitat creation and connectivity, and biodiversity values
are all set to increase. Many of the pathways that include planting trees will contribute to local climate
and microclimate moderation and modification by storing more water in the system and thereby
mitigating against more extreme weather events. Vegetation around riparian zones has the added
benefit of slowing water flows and improving infiltration which helps to prevent and mitigate against
flood events and associated impacts.
Most mitigation options will increase and improve soil quality and soil carbon – notably the land use
change to horticulture will improve the quality of pastoral land. Moreover, forestry products provide
a source of renewable biofuel, an opportunity to achieve long-term sequestration and provide carbon
storage through wood products and construction.
10
(Great South, 2019)
11
(Brunton, 2019)
Great South
Economic Mitigation Pathways Analysis to Net Zero Emissions for Southland EY | 25You can also read