Why Does Emissions Trading Under the EU ETS not Affect Firms' Competitiveness? Empirical Findings from the Literature - Dis cus si on Paper No. 16-062
←
→
Page content transcription
If your browser does not render page correctly, please read the page content below
Discussion Paper No. 16-062
Why Does Emissions Trading Under the
EU ETS not Affect Firms’ Competitiveness?
Empirical Findings from the Literature
Eugénie Joltreau and Katrin Sommerfeld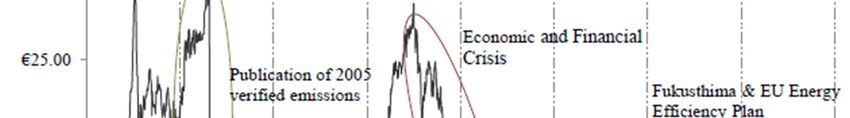
Discussion Paper No. 16-062
Why Does Emissions Trading Under the
EU ETS not Affect Firms’ Competitiveness?
Empirical Findings from the Literature
Eugénie Joltreau and Katrin Sommerfeld
Download this ZEW Discussion Paper from our ftp server:
http://ftp.zew.de/pub/zew-docs/dp/dp16062.pdf
Die Discussion Papers dienen einer möglichst schnellen Verbreitung von
neueren Forschungsarbeiten des ZEW. Die Beiträge liegen in alleiniger Verantwortung
der Autoren und stellen nicht notwendigerweise die Meinung des ZEW dar.
Discussion Papers are intended to make results of ZEW research promptly available to other
economists in order to encourage discussion and suggestions for revisions. The authors are solely
responsible for the contents which do not necessarily represent the opinion of the ZEW.
Why does emissions trading under the EU ETS not affect firms’
competitiveness? Empirical findings from the literature

Eugénie Joltreau* and Katrin Sommerfeld**

Abstract

Environmental policies may have important consequences for firms’ competitiveness or
profitability. However, the empirical literature shows that hardly any statistically significant
effects on firms can be detected for the European Union Emissions Trading Scheme (EU
ETS). On the basis of existing literature, we focus on potential explanations for why the
empirical literature finds hardly any significant competitiveness effects on firms, least
not during the first two phases of the scheme (2005-2012). We also reason why the third
phase (2013-2020) could reveal similar results. We show that the main explanations for this
finding are a large over-allocation of emissions certificates leading to a price drop and the
ability of firms to pass costs onto consumers in some sectors. Cost pass-through, in turn,
partly generated windfall profits. In addition, the relatively low importance of energy costs
indicated by their average share in the budgets of most manufacturing industries may limit
the impact of the EU ETS. Finally, small but significant stimulating effects on innovation have
been found so far. These different aspects may explain why the empirical literature does not
find significant effects from the EU ETS on firms’ competitiveness.

Keywords: Cap and Trade system, EU ETS, firm-level competitiveness

JEL-Codes: Q52, Q58, D22

_____________________

* University of Paris-Dauphine. E-mail: eugenie.joltreau@dauphine.eu

** Corresponding author. Centre for European Economic Research (ZEW), L7, 1, 68161
Mannheim, Germany. E-mail: sommerfeld@zew.de

Acknowledgements: We thank Ulrich Wagner and seminar participants at ZEW for helpful
comments, in particular Robert Germeshausen, Kathrine von Graevenitz, Peter Heindl, Benjamin
Lutz and Philipp Massier. Financial support by ZEW within the project “Employment Effects of
Environmental Regulation” is gratefully acknowledged. All errors remain the authors’
responsibility.

                                               1
1.      Introduction

The European Union Emissions Trading Scheme (EU ETS) is the largest market for greenhouse
gas emissions worldwide covering more than 11,000 manufacturing and power plants and about
45% of the EU’s greenhouse gas emissions in 31 countries (DG CLIMA1). It serves as an
important example for the design of other carbon markets such as the one in China. At the same
time, there are strong concerns that carbon trading may entail negative side effects on
competitiveness and employment of regulated companies. This is because regulated firms seem
to face additional costs either because of abatement or because of purchasing emissions
allowances. However, the empirical literature evaluating the EU ETS finds no significant negative
effects on firm-level indicators for competitiveness, at least not for the first two trading phases.
Therefore, this paper attempts to explain why – against ex ante expectations – no negative side
effects of the EU ETS on firms’ competitiveness have been documented empirically, so far.

Understanding the economic effects of emissions trading well is important for at least three
reasons. First, understanding the economic side effects of environmental policies is vital for
reducing the cost of achieving certain environmental goals. Put differently, efficient climate policy
needs to achieve the policy goals at the least possible cost. Second, emissions trading has
distributional effects such that certain firms or sectors may benefit while others may face
additional challenges (Flues, Thomas, 2015). It is crucial to identify these likely winners and the
sectors in need for additional support, in order to be able to implement a successful ambitious
climate policy and minimise the risk of carbon leakage. Finally, policy-makers often use the
argument of job losses or gains when trying to implement environmental policies. Special interest
groups or lobbies also play a role in shaping concerns about potential job losses. Therefore,
understanding the effects of climate policies on outcomes such as employment is important.

In theory, a cap-and-trade system imposes extra costs on firms (e.g., Deschenes, 2014). This is
because they either have to implement abatement activities or to purchase emissions certificates
unless there is free allocation. In addition, firms face transaction costs and costs for monitoring,
reporting and verification of emissions (MRV). These costs may lead to a loss of competitiveness
depending on the market structure and on the design of the policies, e.g. exemptions. Moreover,
the effects are contingent on who is covered by the policy, e.g. whether it is a unilateral policy. It
is of relevance whether (foreign) competition exists and which regulation competitors underlie.
Notwithstanding, environmental policies could also have positive effects on firms’
competitiveness. For example, these policies might trigger innovation with potentially positive
consequences (Porter, 1995; Porter, van der Linde, 1996). Also, firms might benefit if emissions
certificates are freely allocated and over-allocated, and have a positive value on the emissions
market. Hence, there may be positive and negative partial effects from an emissions trading
scheme where the overall effect is not generally clear.

While for the Clean Air Act Amendments in the US substantial negative effects on firm level
competitiveness have been documented (e.g., Greenstone, 2002, 2012; Becker, Henderson,
2000), it is surprising that the empirical ex post literature on firm-level effects of the EU ETS
shows hardly any significant negative impacts on the competitiveness of regulated firms during
Phase I and II (for overviews see Venmans, 2012; Arlinghaus, 2015; Martin et al., 2016; also
Dechezleprêtre, Sato, 2014; Jaraite, Di Maria, 2016). Still, there appear to be significant
reductions in carbon emissions in manufacturing as a result of the EU ETS (Wagner et al., 2014;
Petrick, Wagner, 2014; Ellerman et al., 2016). Meanwhile, hardly any negative effects on
competitiveness can be detected. For Germany, no statistically significant negative effects of the
EU ETS on employment or gross output or exports can be documented (Petrick, Wagner, 2014).

1
    http://ec.europa.eu/clima/policies/ets/index_en.htm, last retrieved 11/08/2016
                                                             2
There is also no indication that over- or under-allocation of EUAs significantly affects firm revenue
or employment, at least not in the very early period of the EU ETS (Anger, Oberndorfer, 2008).
Preliminary results for France show significant reductions in employment (on the order of -7%,
see Wagner et al., 2014) which may be partly driven by carbon leakage and should be
considered as the upper bound (ibid.). Negligible competitiveness effects have also been shown
in a cross-sector comparison for the entire European Union (Abrell et al., 2011). Even when
focusing on energy intensive industries, no negative effects on firm level competitiveness were
found for cement or iron and steel industries (Chan et al., 2013). In the power sector, despite
rising unit material costs, revenue might even have increased substantially (ibid.).

This study contributes to the literature by trying to determine why researchers do not find
significant negative effects of the EU ETS on firm-level competitiveness between 2005 and 2012.
Although the third trading period (2013-2020) is still running and there is thus no comprehensive
empirical evidence for Phase III, yet, we reason about why this period could also reveal negligible
effects on competitiveness, if any. We limit the analysis to competitiveness at the firm level thus
excluding the country level perspective. By “competitiveness” we mean a firm’s long run profit
performance as measured by turnover, value added or employment (Dechezleprêtre, Sato, 2014,
p. 6). The focus is on direct effects from the EU ETS whereas indirect effects, such as through
rising electricity prices, are covered only briefly. We proceed by presenting and then checking five
potential explanations. As we base all arguments on existing literature, this present study is by
itself also a literature review. While existing literature reviews constitute the starting point of this
study, we go beyond these by screening five hypotheses explaining why almost no
competitiveness effects could be documented so far.

We start from the observation that emissions certificates have so far been mostly allocated for
free. Thus, firms have hardly faced any costs of purchasing EUAs but only transaction costs and
opportunity costs. Second, the results show that there has been a large over-allocation of
emissions certificates leading to a price drop which, in turn, reduced the costs of buying additional
certificates and with it reduced the incentives to abate emissions. Third, firms have been able to
pass-through the costs of emissions trading onto consumers at least in some sectors, most
prominently in the power sector. This fact in combination with large amounts of free allocation of
certificates has generated windfall profits for some firms. Fourth, the energy cost share in
production is on average rather low but this may hide distributional differences on the firm level.
Fifth, small but statistically significant stimulating effects on innovation have been found,
potentially small due to the low price of certificates. These results suggest that the EU ETS has
effectively reduced greenhouse gas emissions without incurring significant negative
competitiveness effects. . However, we leave the question open of whether costs and benefits of
the scheme are balanced.

This paper is structured as follows: The next section gives a brief overview over relevant
institutional aspects of the EU ETS. Then, section 3 presents an overview over the existing
empirical literature on the effects of market-based environmental policies on firm-level
competitiveness. Section 4 checks five hypotheses on the EU ETS, one by one, by collecting
existing empirical findings. These are first free allocation, second over-allocation, third cost pass-
through, fourth energy cost shares and fifth innovation. Finally, section 5 concludes.

                                                   3
2.      Institutional background of the EU ETS

The EU Emissions Trading Scheme was launched by the European Commission in 2005 in the
framework of the Kyoto Protocol (Directive 2003/87/EC2). It constitutes the largest carbon cap-
and-trade system worldwide. The overall amount of carbon emissions is capped by allocating
only a limited amount of emissions certificates called European Union Allowances (EUAs) which
can then be traded. The first trading phase – which was considered a trial phase – ran from 2005
to 2008. Phase II ran from 2009 to 2012. Phase III is running from 2013 to 2020 and is seen as a
reinforcement of the system. Country-specific National Allocation Plans (NAPs) used to define the
cap as well as how allowances are allocated to individual installations, giving the EU ETS a highly
decentralised character during Phase I and II (Kruger et al., 2007; Ellerman et al., 2016). Since
Phase III, an EU-wide cap has been replacing the NAPs system, so as to reduce uncertainty.3 In
addition, auctioning has become the default allocation rule4 replacing grandfathering. Several
aspects of the design of the scheme are relevant for understanding the channels for potential
competitiveness effects.

Figure 1: Past and projected emissions and emissions reduction targets

Source: EU Commission (2015), p. 4.

Figure 1 shows past and projected emissions together with emissions reduction targets. The
initial target was to reduce emissions in CO2 equivalents by 20% by 2020 as compared to 1990
levels. This joint reduction commitment was already over-achieved by the European Member
States in the second period of the EU ETS (2008-2012). According to 2015 projections,
emissions are estimated to be 24% lower by 2020 compared to the levels of 1990 (EU
Commission, 2015), i.e. lower than the initial target of 20%.5 While it is uncertain whether this is
the result of costly abatement and cleaner production or production slowdown, the fact is that now
this constraint may not be binding anymore. In response, the Commission set a more ambitious

2
    http://eur-lex.europa.eu/legal-content/EN/TXT/?uri=CELEX:32003L0087 , last retrieved 24/09/16
3
  Under the NAPs system, each country had to submit its NAP to the Commission for approval. This process turned out to be
very time-consuming and complex as it led to protracted negotiations between the Commission and several Member States.
See http://ec.europa.eu/clima/policies/ets/pre2013/nap/index_en.htm, last retrieved 17/08/2016
4
  However, free allocation still represents about half of allocated permits, since manufacturing sectors are exempted from full
auctioning. See section 4.1 and http://ec.europa.eu/clima/policies/ets/allowances/index_en.htm, last retrieved 06/09/2016
5
  The current long-term target is a 21% reduction by 2020 compared to 2005.
http://ec.europa.eu/clima/policies/ets/index_en.htm, last retrieved 11/08/2016
                                                                4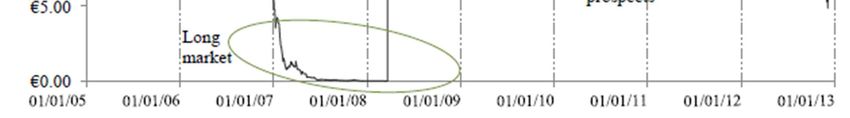
target according to which emissions need to be reduced by 40% by 2030 (compared to 1990
levels).6 As part of this overall target, the emissions cap of the EU ETS will decrease annually by
2.2% from 2021 onwards instead of 1.74% so far. As the figure shows, this will require additional
efforts of abatement.

In order to reach the emissions target, firms owning a regulated installation have to provide the
amount of EUAs corresponding to the amount of emitted carbon dioxide on a yearly basis.
Emission allowances were grandfathered at the beginning of the scheme and later partly
auctioned, as detailed in section 4.1. Regulated industries are energy-intensive industries within
the manufacturing and the power sector, i.e. combustion installations with a rated thermal input
capacity of at least 20 MW, refineries, coke ovens, steel plants, and installations producing
cement clinker, lime, bricks, glass, pulp, and paper. In total, the EU ETS covers about 50% of
Europe’s CO2 emissions and 40% of its total greenhouse gas emissions (Schleich et al., 2007).
Since 2012, the aviation sector has also been added to the EU ETS (Directive 2008/101/EC)
taking into account some peculiarities of this sector.7 While auctioning applies to power
generators since 2013 and is said to represent the default allocation method of the third period,
all manufacturing sectors receive allowances according to benchmarking. The benchmark value
is product-specific and equals the average CO2 emissions of the best performing 10% of
installations for this product (European Commission Climate Action).8,9 Manufacturing industries
receive a decreasing10 share of their historic production needs multiplied by the product
benchmark. At the same time, there are exceptions in order to explicitly “safeguard the
competitiveness of industries covered by the EU ETS” (European Commission Climate Action11).
Since the third trading phase, these exceptions have been regulated according to the estimated
risk of carbon leakage (under an amendment to Directive 2003/87/EC). Accordingly, a sector or
sub-sector is deemed to be exposed to a significant risk of carbon leakage if it meets one of the
following criteria12:

     1) if direct and indirect costs induced by the implementation of the directive increase
        production cost, calculated as a proportion of the gross value added, by at least 5%; and
        the sector's trade intensity with non-EU countries (imports and exports) is above 10%.13
     2) the sum of direct and indirect additional costs is above 30%
     3) the non-EU trade intensity is larger than 30%

Installations in sectors exposed to carbon leakage risk are eligible to 100% free allowances up to
the benchmark (de Bruyn et al., 2013). This preferential treatment concerns 154 out of 258
NACE-4 level sectors, representing 95% of 2005 and 2006 industrial emissions (ibid.).

Firms participating in the EU ETS can shift their unused allowances to subsequent periods. As
defined by the European Commission: “Since phase 2 (2008), if an ETS participant has a surplus
of allowances at the end of a trading-phase it can ‘bank’, or in other words carry forward, these

6
  http://ec.europa.eu/clima/policies/strategies/2030/index_en.htm, last retrieved 11/08/2016
7
  http://ec.europa.eu/clima/policies/transport/aviation/index_en.htm, last retrieved 22/09/2016
8
  http://ec.europa.eu/clima/policies/ets/cap/allocation/index_en.htm, last retrieved 11/08/2016
9
  This system is said to constitute a rewarding mechanism that may enforce incentives for innovation. Indeed, only the most
efficient 10% of installations receive enough allowances to cover their needs. Less efficient firms have to pay for extra permits.
Thus, they face the incentive to reduce their emissions at least up to the benchmark value (de Bruyn et al. 2010b).
10
   80% in 2013 to 30% in 2020 (de Bruyn et al., 2013)
11
   http://ec.europa.eu/clima/policies/ets/allowances/leakage/index_en.htm, last retrieved 11/08/2016
12
   Moreover, sectors close to the threshold levels could ask for a qualitative assessment and potentially being considered at risk
of carbon leakage (De Bruyn et al., 2013)
13
   http://ec.europa.eu/clima/policies/ets/allowances/leakage/index_en.htm, last retrieved 11/08/2016
                                                                5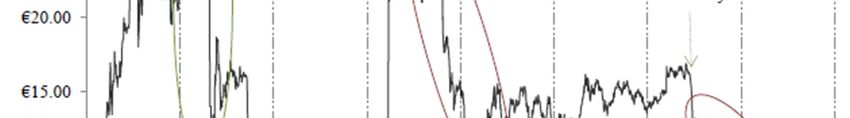
allowances to count towards its obligations in the next phase.” (EU ETS Handbook, Climate
Action, p. 13314). Note that in the first trading period, permits could not be banked beyond 2007.

As an alternative to submitting EUAs according to the amount of verified emissions, installations
could submit alternative offsets from the Kyoto Protocol during Phase II but only to a limited
extent. These alternative offsets were Emission Reduction Units (ERU) generated from Joint
Implementation (JI) activities or Certified Emissions Reductions (CERs) generated from the Clean
Development Mechanism (CDM) project activity. Concerning the emissions reduction target for
2030, the Commission and the Parliament have proposed that using international offsets should
not be a possible option to meet the 40% target (Carbon Market Watch, 2014).

3.    Literature overview on competitiveness effects

Estimating the causal effect of the EU ETS is a difficult empirical challenge due to different
reasons. First and above all, treatment assignment is not random but depends on capacity15, a
treatment assignment variable usually not observed by the researcher. Thus, regulated firms are
systematically different from non-regulated firms. This challenge is often addressed by employing
statistical matching procedures. Second, and equally important, for a methodologically clear
comparison of regulated and non-regulated companies, there must be no spill-over effects, for
example through energy prices. This would violate the stable unit treatment value assumption
(SUTVA; see Rubin, 1978, 1980, 1990; Angrist, Imbens, Rubens, 1996) which is usually required
for the econometric approaches in question. Third, it is difficult to separate the causal effect of the
EU ETS from other policies’ effects especially when introduced at around the same time. These
confounding policies may be country-specific energy policies such as the Renewable Energy
Sources Act (EEG) in Germany. Fourth, data availability and access are of crucial importance.
We will now give a brief overview on empirical ex post evaluation studies. More details on the
competitiveness and other firm-level effects of environmental policies can be found in the
excellent reviews by Venmans (2012), Arlinghaus (2015) and Martin et al. (2016).

The empirical ex post literature on firm-level effects of the EU ETS finds hardly any indication for
negative competitiveness effects, least not for the first two trading periods. Based on firm-level
data for the manufacturing industries, Wagner et al. (2014) and Petrick and Wagner (2014)
compare regulated to non-regulated companies in France and in Germany, respectively. Using
differences-in-differences estimators with matching, they find significant reductions in carbon
emissions in both countries for the first half of the second trading phase. Interestingly, while the
preliminary results for France show significant reductions in employment on the order of 7% for
the early second trading phase, no negative competitiveness effects can be detected in the
analysis of Germany. This holds for employment as well as for gross output and exports. The
effects on gross output and exports in Germany might even be slightly positive. One potentially
important channel for finding negative results for France is carbon leakage as explicitly discussed
by Wagner et al. (2014).16 For Germany, Petrick and Wagner (2014) cannot separate the effects
of the EU ETS from those of the changes made to the German Renewable Energies Act. For
Germany, Anger and Oberndorfer (2008) analyse regulated German companies in the early
period of 2004-2005 taking the ratio of EUAs to verified emissions as explanatory variable of
interest. This indicator for over-allocation shows no statistically significant effects on changes in

14
   http://ec.europa.eu/clima/publications/docs/ets_handbook_en.pdf, last retrieved 11/08/2016
15
   More precisely, “capacity” refers to the rated thermal input for combustion installations and specific capacity thresholds for
plants within specific industrial activities.
16
   According to Martin et al. (2014a), the risk of carbon leakage and thus job loss due to the EU ETS could be substantially
reduced by means of an efficient permit allocation scheme.
                                                                 6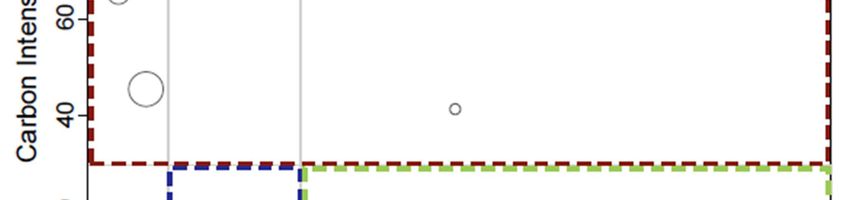
firm revenue or in employment. However, their results could be biased by early abatement
activities. For Lithuania – the most over-allocated country in the EU ETS – Jaraite and Di Maria
(2016) also find no significant economic effects on regulated firms. They stress that this result
also implies that there have not been any huge windfall profits for these firms. For the specific
case of the Lithuanian power sector, they suspect a relevant amount of carbon leakage by means
of closing one large reactor and increasing electricity imports from neighbouring countries. Abrell
et al. (2011) empirically analyse manufacturing firms in the entire European Union. Using
propensity score matching, they compare regulated firms to firms from all non-regulated sectors.
Hence, sectoral trends could confound their results. These show no statistically significant effects
of the EU ETS on firms’ value added or profit margins. Still, for employment they detect a small
but statistically significant effect of -0.9% for the first trading phase which appears to be driven by
the non-metallic mineral sector. Considering only the industry sector for identification of ETS
participation, Commins et al. (2011) report statistically significant negative effects on total factor
productivity (TFP) growth for the first period of the EU ETS. However, keep in mind that treatment
identification is very crude and driven exclusively by cross-sector differences.

Turning from manufacturing to more specific industrial sectors, Chan et al. (2013) study firms in
the power, cement, iron and steel industries in ten large countries comparing ETS-regulated to
non-ETS-regulated companies within these industries. Interestingly, they only find statistically
significant results within the power sector where unit material costs are shown to have increased
by 5% (Phase I) to 8% (Phase II). At the same time, they demonstrate that revenue has
increased by a remarkable amount of 30%. Note that this study detects no negative effects on
competitiveness in the other studied sectors which are very energy-intensive nor does it identify
employment effects in any of the sectors. For major European power companies, also the returns
on the stock market appear to be positively correlated with EUA prices (Veith et al., 2009 and
Bushnell et al., 2013). These results could be an indication of a strong cost pass-through onto
electricity consumers. At the same time, the results of these two studies have to be treated with
caution due to their small samples. Yu (2013) analyses a larger sample of Swedish energy firms
for the first two years of the EU ETS. Applying a differences-in-differences approach to the
energy industry the study shows no significant impact of the introduction of the EU ETS on
profitability in 2005 and a negative significant impact in 2006.

As for the Kyoto Protocol as a whole, Aichele and Felbermayr (2015) demonstrate important
carbon leakage effects on a more aggregated level. They focus on carbon embodied in trade in
the framework of a gravity model which they apply to country or industry level data showing that
some sectors are more prone to carbon leakage than others (also Aichele, Felbermayr, 2012).
Dechezleprêtre et al. (2014) also employ a rather rough identification strategy in order to analyse
carbon leakage effects: They compare EU to non-EU companies based on self-reported survey
data and find no significant carbon leakage from the EU ETS.

Evaluation studies on market-based environmental policies other than the EU ETS show similarly
negligible effects (e.g., Pestel, 2014). Two recent studies focusing on Germany employ a
regression discontinuity design (RDD), thereby comparing firms closely around a policy-relevant
threshold. Using highly reliable large administrative firm census data for the manufacturing sector,
they conclude that neither the electricity tax (Flues, Lutz, 2015) nor the Renewable Energy
Sources Act (Gerster, 2015) exhibit statistically significant effects on firms’ profitability. By
estimating cross-price elasticities between electricity and heterogeneous labour for the German
manufacturing sector, Cox et al. (2014) point to weak substitutability between electricity and
labour when the production level is held constant. This would imply small employment losses due
to the renewable energy surcharge which are inflicted in particular on medium and highly qualified
employees. For the UK, the Climate Change Levy (CCL) has been evaluated by Martin et al.
(2014c) for manufacturing plants, using panel data from the UK production census. While they
                                                  7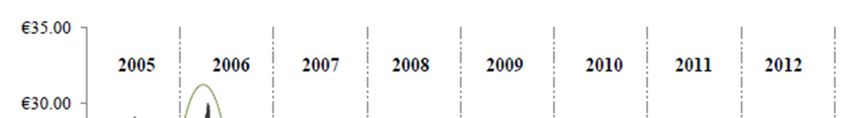
find a strong negative impact of the CCL regulation on energy intensity and electricity use of
firms, they find no negative effects on economic performance or on plant exit.

These findings of small or negligible effects from the EU ETS are surprising given that for other
international environmental policy schemes substantial effects have been documented. One of
the most important policies in the US is the Clean Air Act which has triggered a large amount of
related empirical literature. The early literature often used industry or county-level data finding
inconclusive results or a zero effect of the Clean Air Act on employment (see Jaffe et al., 1995 for
an overview). By means of simple panel methods and firm-level data, Greenstone (2002) finds
significant negative effects of the Clean Air Act amendments on employment, capital stock and
output in pollution-intensive industries. By means of similar methods, Berman and Bui (2001)
analyse a particular air quality regulation in the LA air basin and find hardly any employment
effect of this regulation. If anything, there could be a small positive employment effect. List et al.
(2003), by contrast, stress the importance of using semi- or non-parametric methods and argue
that the effects of the regulation may otherwise be biased upwards (also see Henderson, Millimet,
2007). Deschenes (2012) uses yet another approach by estimating cross elasticities between the
electricity price and labour, finding weak negative effects of an increased electricity price on
employment, which he interprets in light of the Clean Air Act. Concerning the effects of the
stringency of this regulation on other competitiveness-related outcomes, significant negative
effects have been found for total factor productivity (TFP; Greenstone et al., 2012) and plant
births (Becker, Henderson, 2000). Meanwhile, the evidence is mixed for location decisions (Kahn,
Mansur, 2013) and foreign direct investments (FDI; Henderson, Millimet, 2007; List, Co, 2000).
Statistically significant but economically very small effects have been found for wages as a result
of job transitions (Walker, 2013). Overall, modern semi-parametric methods generally show much
weaker effects as compared to simple panel methods.

It remains an important open question why these international environmental policies display
negative effects on firms’ competitiveness whereas such negative effects have not been
documented for the EU ETS? Because of this insight, this present study explores different
reasons for which there may not be any substantial competitiveness effect from the EU ETS.

                                                  8
4. Hypotheses on the question: Why does the EU ETS not significantly affect firms’
competitiveness?
As shown above, the literature finds weak or zero effects of environmental policies on firms’
economic performance. These results run counter to traditional concerns saying that
environmental policies destroy jobs and harm the competitiveness of exporting firms. This raises
another question: Why do empirical researchers not detect any significant negative impact of
market-based instruments on European firms’ competitiveness? We answer this question in the
framework of the EU ETS by analysing several hypotheses. We discuss them and try to find
supporting evidence in empirical and theoretical findings. While the following five hypotheses may
be linked, it is worth discussing their individual particularities and implications in the following.
4.1 Free allocation
Hypothesis No. 1: “Free allocation of emissions certificates reduces the cost burden
of firms, and thus may help reduce negative effects of the EU ETS on
competitiveness and economic performance.”
When faced with the EU ETS regulation, firms have to either abate emissions or buy certificates.
Therefore, firms traditionally consider environmental regulation an onerous economic burden, as
it increases production costs and may have further repercussions on companies’ employment
level and performance. Three types of costs associated with a trading scheme implementation
can be distinguished (following Clò, 2010): abatement costs17, potentially higher electricity prices
and the costs of buying certificates. Free allocation saves firms from bearing this last cost, i.e.
from buying their permits on the carbon market. For this reason free allocation may help
alleviating the potential negative impact on European plants.
Since the beginning of the scheme in 2005, free allocation has been the main allocation
mechanism within the EU ETS. During the first years the cap of certified emissions was also seen
as an adjustment variable so as to introduce the constraint gradually and to figure out how many
allowances countries and industries needed. Allocation was applied according to grandfathering:
emissions certificates were freely distributed according to past emissions. Afterwards, in
particular since the start of the third trading period, allocation has aimed at protecting
manufacturing plants that are globally trade-exposed, while energy firms have had to buy their
permits at auction. In the case of manufacturing, free certificates have been distributed according
to a benchmark figure and historical production data of installations. Most trade-intensive and
carbon-intensive sectors have received 100% free permits up to the benchmark (see section 2.)
Free allocation was the most prevalent and nearly the only method applied between 2005 and
2012, and to a lesser extent also at the beginning of Phase III. The European Commission
authorised EU member states to auction a maximum of 5% of their allowances in Phase I and up
to 10% in the second trading period. Otherwise, free allocation was the default rule. For several
reasons, such as the fierce opposition of European firms against auctioning, only four
governments chose to auction or sell a small share of permits in Phase I (Denmark, Hungary,
Lithuania and Ireland; see Ellerman, Buchner, 2007; Venmans, 2012). In all, auctioning
accounted for an annual average of 0.13% of certified emissions (Ellerman, Buchner, 2007). In
Phase II, only seven countries delivered information on auctioned allowances on the website of
the European Commission.18 The National Allocation Plans (NAPs) only envisaged that 3.1% of
17
For example, firms may buy new equipment so as to adopt an eco-friendly production process and to control their level of
pollution (Gray, 2015).
18
DG CLIMA, Phase II auctions (2008-2012),
http://ec.europa.eu/clima/policies/ets/pre2013/second/index_en.htm, last retrieved 11/08/2016
9total allowances should be auctioned (Schleich et al., 2007; Venmans, 2012). The decentralised
nature of the EU ETS apparently has given countries an incentive to allocate free allowances
generously, as argued by Kruger et al. (2007) and Schmalensee, Stavins (2015).
We have seen that free allocation was clearly dominant in Phase I and II. The main difference
between the first two phases and Phase III is that the electricity sector in general now has to buy
permits at auctions (EU Commission, 2014a; Clò 2010). Manufacturing sectors receive
allowances partially for free under benchmarking. Still, in 2013, manufacturing industries not
classified at risk of carbon leakage received on average 80% of permits for free up to the
benchmark.19 This share is supposed to decrease smoothly to 30% by 2020. As for sectors
“deemed at risk of carbon leakage” they receive 100% free allowances up to benchmark during
the entire Phase III and thereafter, as long as they stay on the carbon leakage list.20 154 out of
258 NACE-4 sectors belong to this list, representing 85% (Martin et al., 2014a) up to 95% (de
Bruyn et al., 2013) of CO2 emissions from manufacturing. Overall, free allocation represents 43%
of the total amount of certificates of Phase III (2013-2020).21
Should it be of concern that a large share of emissions certificates is allocated for free? This
allocation method is challenged by some economists (e.g. Cramton, Kerr, 2002; Hepburn et al.,
2006) who prefer auctioning. Free allocation may not reflect marginal abatement costs and thus
create competitive distortions. Moreover, free allocation is often referred to as a subsidy in the
literature (Jegou, Rubini, 2011; Neuhoff et al., 2006; Böhringer, Lange, 2005). In addition –
depending on the allocation mechanism – free allocation could influenced by pressure from
individual companies or other interest groups more heavily than auctioning. When combined with
cost pass-through, free allocation may increase firms’ profitability (see hypothesis no. 3).
Auctioning could be more environmentally effective than free allocation because its positive price
may induce greater investment in low-carbon technologies (Milliman and Prince, 1989, 1992;
Cramton and Kerr, 2002, p.2). Still, under free allocation the opportunity costs of the emission
certificates remain, thus generating incentives for abatement and investment signals (Requate
and Unold, 2003). In particular, comparing free allocation and auctioning with identical caps, the
difference between both allocation mechanisms is a distributional matter. As far as we know, no
empirical ex post evidence stating that free allocation enables better economic performance than
auctioning has been provided so far. Therefore, we leave this topic to future research. In
conclusion, it is difficult to attribute the large amount of free allocation causally to the empirical
findings which show no negative effects of the EU ETS scheme. Still, we have seen that this
allocation method has prevailed by far since 2005. This result is important to remember for the
subsequent two hypotheses which will be over-allocation and cost pass-through.
19
DG CLIMA, Free allocation based on benchmarks
http://ec.europa.eu/clima/policies/ets/cap/allocation/index_en.htm, last retrieved 11/08/2016
20
Sectors deemed at risk of carbon leakage by the European Commission are defined in an official list (see paragraph
« Carbon leakage list », DG CLIMA, Carbon Leakage http://ec.europa.eu/clima/policies/ets/allowances/leakage/index_en.htm,
last retrieved 17/08/16)
21
DG CLIMA, Free Allocation
http://ec.europa.eu/clima/policies/ets/allowances/index_en.htm, last retrieved 11/08/2016
104.2 Over-allocation
Hypothesis No. 2: “An over-allocation of allowances to regulated firms has occurred
and has largely eased the compliance constraint on these firms. Therefore, we may
not find negative effects of the EU ETS on firms’ competitiveness and economic
performance.”
To what extent has over-allocation been taking place since the implementation of the EU ETS?
Over-allocation would mean that the majority of the ETS firms have many more allowances than
needed. Under auctioning over-allocation could be lower than under free allocation, as rational
firms only buy as many permits as they need. However, depending on uncertainty and price
expectations, there may also exist substantial over-allocation under auctioning. There is a strong
indication for over-allocation of allowances in the EU ETS as we are showing step by step for all
three trading phases.
Note that over-allocation is conceptually different from being long22 (Ellerman, Buchner, 2008). In
this paper we also consider a large-scale long position to be of interest, as it would represent a
lightened burden for regulated firms.
I. Over-allocation in the first trading period (2005-2007)
The first trading period was considered a trial period and of all three trading periods so far, it is
the one for which we have most empirical evidence available. There has been an excess of
allowances at least during the first two years (Grubb et al., 2005). In 2005 the whole market was
long with 95 million tonnes CO2, corresponding to 4.5% of the allocated allowances23 (Kettner et
al., 2008). This average percentage hides disparities between Member States, sectors and
individual firms. On the aggregate level of Member States, Lithuania exhibits the most
pronounced long position with over 100% more allowances than needed (Anger, Oberndorfer,
2008). Ireland and the UK show the most pronounced short position with about 20% less
allowances than needed (ibid.).
Figure 2: Positions by European sectors in 2005
As for disparities between
sectors, Kettner et al. (2008)
show that all sectors were long in
2005 except the power and heat
sector (figure 2). The oversupply
is particularly high for the pulp
and paper as well as for the iron
and steel sector. Some large
companies belonging to these
sectors were referred to as
“carbon fat cats” by Morris and
Source: Data: CITL, National Allocation Plans and List of Installations; Graph
from Kettner et al. (2008), p. 53. Worthington (2011), i.e. heavily
over-allocated companies.
22
A long position corresponds to the state of having more permits than needed. In a trading scheme, it is normal that some firms
are long and others short, as installations have different marginal costs of abatement. Accordingly some chose to abate
(become long) and other to emit and buy permits (become short). Economic conditions also play a role as firms producing less
will need fewer allowances than expected. In contrast, over-allocation is the consequence of a misallocation (too many permits
are allocated). It results in an excessively long position covering the whole market. It results in an excessively long position
covering the whole market. This requires estimating a plausible business as usual (BAU) scenario for comparison (Ellerman,
Buchner, 2008).
23
These figures are based on installations for which data were available for both allocated EUAs and verified emissions for
2005 and 2006, see Kettner et al. (2008).
11By contrast, the power sector is the only one that used more allowances than it received for free
during the first two phases (Abrell et al., 2011). It was short by about 3% in 2005 (Ellerman,
Buchner, 2008). The power sector is assumed to be hardly trade-exposed and governments
believed that potential abatement was larger (Kettner et al., 2008), most likely due to its large
volume of emissions. Therefore, most EU-1524 countries provided a short allocation of EUAs to
the electricity utility sector (Ellerman, Buchner, 2007). Kolshus and Torvanger (2005) indicate that
sectors competing internationally were advantaged in terms of allocation.25
Behind the aggregated statistics on the country or sector level, on the individual firm level most
firms are long but a few are short (see Kettner et al., 2008). On a more disaggregated level, there
are also disparities between individual installations as Anger and Oberndorfer (2008) emphasise.
Indeed, they reveal strong variations of the allocation factor between firms. Kettner et al. (2008)
add distorting distributional impacts among installations according to their size. While small26
plants tend to have a long position but with a high dispersion, large plants tend to be short,
however with a smaller dispersion (ibid.). Possibly, the heterogeneity in long positions described
here is linked to the effect heterogeneity with respect to firm size that the ex-post literature
observes (Abrell et al., 2011; Chan et al., 2013; Martin et al. 2014a).27 Moreover, the initial
allocation of allowances is highly relevant for emissions reduction because firms that are short cut
emissions to a greater extent than long firms and vice versa (Abrell et al., 2011).
Figure 3: Evolution of the spot price of EUAs (2005-2012)
In April 2006, one after another,
most of the EU members
revealed long positions
regarding EUAs, until the EU
Commission released the
complete version of verified
emissions on May 15, 2006. It
showed that in 2005 the whole
market was long with 95 million
tonnes CO2 (Kettner et al.,
2008). As prices reflect
available information, the
disclosures were swiftly
followed by a sharp collapse of
the EUA prices (see figure 3).
Source: Civitelli (2016), p.11.
The EUA price was considered too low to exploit a large abatement potential by Kettner et al.
(2008). At the same time, a low-carbon price reduces costs for those sectors or installations who
are short. Note that the carbon price may still be significantly positive despite over-allocation, in
24
Austria, Belgium, Denmark, Finland, France, Germany, Greece, Ireland, Italy, Luxembourg, the Netherlands, Portugal, Spain,
Sweden and the UK.
25
For example, Czech “exposed sectors” received about 32% more than their past emissions while “non-exposed” sectors
received only 3.5 %. Note that both got less than their BAU emissions. Kolshus and Torvanger (2005) define two aggregate
groups of sectors as follows:
Exposed sectors: refineries, iron and steel, cement, glass, line, ceramics, pulp and paper and others.
Non-exposed sectors: electricity, district heating, energy, combined heat power, power, heat, cogeneration, steam.
26
Small installations account for 5% of emissions in total, whereas the largest installations are responsible for 50% of emissions
(Kettner et al., 2008)
27
In addition, Heindl (forthcoming) documents that costs for monitoring, reporting and verification of emissions (MRV) are
proportionally higher for small than for large firms.
12case participants do not know about the over-allocation, or expect a higher stringency in the
future.28
Next, we discuss whether this overall long position can be attributed to over-allocation (see
footnote 22). Some authors find evidence of over-allocation and abatement at the same time
(Ellerman, Buchner, 2008; Anderson, Di Maria, 2011). While this may sound counterintuitive, the
authors argue that the two may co-exist, as abatement is linked to the CO2 price and not to
allocation.29 To gauge the extent of over-allocation for the years 2005-2006, Ellerman and
Buchner (2008) estimate a BAU scenario and propose a measure of allocation which uses past
and verified emissions. Their thorough inquiry suggests that over-allocation might have reached a
maximum of 125 million EUAs in 2005-2006. According to them, this length cannot be attributed
to abatement or unexpected conditions. Moreover, they demonstrate that firms did abate
emissions by between 50 and 100 million tonnes each year. The results by Ellerman et al. (2010,
estimating 70Mt per year) and Anderson and Di Maria (2011) are well within that range. The latter
estimate net abatement in 2005, 2006 and 2007 to be of around 84, 62, and 28 Mt CO2
respectively, following the declining trend of the EUA prices. Ellerman and Buchner (2008)
underline that over-allocation could have its roots either in an under-estimation of abatement or
an over-estimation of emissions ex ante.
II. Over-allocation in the second trading period (2008-2012)
The second trading period was characterised by a fierce economic downturn. In consequence,
there was once more a large excess of unused allowances as indicated by DG CLIMA (2013).30
Due to the scarcity of studies focussing on the oversupply of allowances in the second trading
period of the EU ETS, we use prices as an indicator. In fact, a low carbon price should reflect
oversupply and vice versa.
Figure 4: EUA and CER price from January 2008 to November 2012.
Figure 4 depicts EUA and
Certified Emissions
Reduction (CER) prices
(from Haita, 2013). The
price decrease started
with the European
Commission’s release,
indicating that 2008
verified emissions were
3% below the 2007
level.31 A first drop
followed right after and
may be largely explained
by the 2008 financial
Source: Haita (2013), p. 2.
crisis (Haita, 2013).
Although the economic downturn seems to have initiated the bearish trend, there may be many
other reasons for its continuing decline such as the overlapping of different climate policies or the
28
Another argument for a positive EUA price despite over-allocation is provided by banking. This was, however, not relevant in
the first trading period.
29
„In a trading system, it is not the allocation to an installation that causes a firm to reduce emissions, but the price that it must
pay, even if in opportunity cost, for its emissions“ Ellerman and Buchner (2008), p. 286.
30
EU ETS factsheet, European Union, October 2013, p.4 “2nd trading period. [H]the economic downturn cuts emissions, and
thus demand, by even more. This leads to a surplus of unused allowances and credits which weighs on carbon price.”
Available at http://ec.europa.eu/clima/publications/docs/factsheet_ets_en.pdf, last retrieved 11/08/2016.
31
http://europa.eu/rapid/press-release_IP-09-794_en.htm?locale=en, last retrieved 11/08/2016.
13mild weather of the period (Haita, 2013). We also observe that the CER price is starting to
decouple with the EUA price, making it cheaper for firms to buy carbon offset credits than
permits. This could exacerbate the oversupply of EUAs. Due to the economic crisis, all BAU
estimations constructed before became out-dated making it hard to pinpoint over-allocation as
opposed to a long position.
What is important is the substantial oversupply of EUAs along with the possibility of banking
these unused allowances to the third trading period. In fact, it can be rational for firms to bank
emission allowances to future periods in order to minimise abatement costs over time (Ellerman
et al., 2015). Morris (2011) reveals that 77% of EU ETS installations had a long position in EUAs
in 2011. He estimates the surplus of allowances to have reached 855Mt CO2 in 2011, of which
672 Mt CO2 would be saved for Phase III. In early 2012, the accumulated surplus accounted for
955 million allowances, i.e. 406 million allowances when excluding international credits32 for
compliance (EU Commission, 2012). At the end of 2013, the overcapacity reached 2 billion
allowances (Carbon Market Watch, 2014). This shows that banking entails the risk of extending a
surplus of allowances to the subsequent period.
III. Over-allocation in the third trading period (2013-2020)
The third trading phase of the EU ETS is still on-going so we cannot provide final results
regarding over-allocation or oversupply for this period. Moreover, we are not aware of any ex post
empirical evidence on competitiveness effects during this period. Still, we document what we
know so far and reason why this period could be similar to the previous ones, in spite of the
Commission’s attempt to make it more stringent.
Figure 5: The build-up of surplus in EU ETS by 2020
As expected, the allowance
surplus of Phase II was banked
into Phase III, which now has to
deal with a massive surplus of 2.1
billion permits (figure 5; Carbon
Market Watch, 2014). This surplus
is expected to increase to 2.6
billion by 2020. According to the
authors, this excess is further
increased by the possibility of
using international credit offsets,
whose price was close to €0 in
2014 and thus lower than the
permit price (around 5€) during
the same period.
Source: Carbon Market Watch (2014), p. 4.
As we observe in figure 6, both prices (CER and EUA) are low, with the CER price close to 0€.
When CERs are cheaper than EUAs, installations rather opt for the CER option (purchase
international offset credits). This frees up their EUAs (either bought or received for free) which
they can shift to Phase IV (2021-2030) or sell on the carbon market and thus achieve windfall
profits. As a consequence, the EUA supply increases and its price falls. Even if the practice of
buying CERs was limited at 1.6 billion CERs for Phase II and III by the Commission (Carbon
32
“An international credit that is used for compliance frees up one allowance that does not need to be used for compliance. As
such the use of international credits for compliance increases the surplus of allowances available to the market” EU Commission
(2012).
14Market Watch, 2014), it would still have significant consequences on the carbon market, as it is
responsible for more than half of the expected 2020 EUA surplus (see figure 5). Note that the
carbon price is far from reaching the price reference of 30 euros that the Commission employed
for calculating which sectors are exposed to carbon leakage risk.
Figure 6: EU Emission Allowances and Certified Emissions Reductions Prices (Jan 2013-Aug
2016)
10,00 €
8,00 €
6,00 €
4,00 €
2,00 €
0,00 €
EUA sett. price CER sett. price
Source: Thomson Reuters Datastream, own graph.
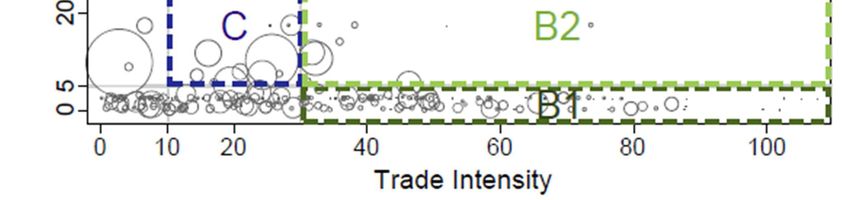
An important characteristic of the third trading period is the application of exemption rules to
sectors with a high risk of relocation. This may lead to an overcompensation of these sectors
deemed at risk (Martin et al., 2014a). Martin et al. (2014a) show that for many firms, the
propensity to relocate does not fluctuate with the amount of free certificates. In turn, this finding
implies that these firms are overcompensated with free permits (Martin et al., 2014a). In addition,
Martin et al. (2014b) show that the trade intensity criterion alone has not been well-suited for
reflecting the carbon leakage risk and that only carbon intensity constitutes a good proxy.
However, 134 out of 140 exempted NACE-4 sectors are exempted for the reason that they are
trade-exposed while not appearing to be carbon intensive at all (Clò, 2010; see also Martin et al.,
2014a,b). These results point to overcompensation if the aim of the exemption rules is to reduce
the risk of relocation.
Summing up, we have documented a substantial surplus of emission allowances for all three
trading phases. This carries three implications: First, plants that have a surplus of allowances
could ignore abatement options but they have an incentive to reduce their emissions in order to
sell the remaining certificates. Second, these firms could sell their excess of permits and thus
increase their profitability (“windfall profits”33). Third, as oversupply causes prices to fall, other
firms could benefit from cheap allowances on the carbon market. In addition, the low price of
emission certificates reduces the scope of feasible abatement options to only the cheapest ones.
These three circumstances may be the reason for not finding harmful effects of the trading
scheme on competitiveness.
33
We define windfall profits as an increasing profitability that can be explained by participation in the EU ETS, either through
selling an allowance surplus or by passing through opportunity costs of the free allowances to consumers (also see hypothesis
no. 3).
154.3 Cost pass-through
Hypothesis No. 3: “When firms can pass-through costs to consumers they may
earn profits from freely allocated emissions certificates. This may explain not finding
negative effects of the EU ETS on firms’ economic performance.”
When firms have the ability to pass ETS costs on to consumers, windfall profits may occur. This
may happen if either one of the following two conditions is fulfilled: On the one hand, if there is
free allocation of emissions certificates and firms use marginal pricing to pass on the opportunity
cost of the certificates to consumers. On the other hand, windfall profits may occur under
auctioning in case the pass-through rate is higher than 100%, i.e. the pass-through
overcompensates for the purchase of the certificates (Sijm et al., 2011). Theory suggests that
firms integrate the opportunity costs and the auction costs in like manner. Thus, in both cases,
the price increase for consumers should be the same (Sorrel, Sijm, 2003; Klemperer, 2008;
Fabra, Reguant, 2014).
The pass-through rate as well as the potential of increasing profitability depends on the market
structure, namely on the number of competitors as well as on the demand and supply price
elasticity (for details see Sijm et al., 2009). Theory suggests that when demand becomes less
price responsive (inelastic) or the market becomes less competitive, the pass-through rate
increases, potentially above 100%. Alternatively, a full pass-through rate (100%) is also expected
in the case of perfect competition, when supply is fully elastic and the demand function linear
(Sijm et al., 2011). Indeed, prices reflect marginal costs under full competition. We assume that if
all firms are subject to these rising costs, none of them will lose competitiveness relative to
others. Otherwise, price distortions may arise and regulated firms could lose market shares
(Alexeeva-Talebi, 2010). Accordingly, the decision of fully passing through costs relies on
strategic behaviour (short-term earnings versus long-term market share loss). To avoid losing
customers in the long-run, firms may cut profit margins when possible, or they may relocate.
Firms as rational profit-maximisers only pass-through costs as long as profits outweigh potential
losses (de Bruyn et al., 2010a). Alexeeva-Talebi (2010) demonstrates that products’
substitutability also plays its part in determining the PTR. In the same context of linear demand
and constant marginal costs, a monopoly is expected to pass-through only 50% of costs. But its
powerful position guarantees the monopolist a rent without losing clients. In addition, the literature
identifies price rigidities as another potential source of incompleteness of passing through costs
(Fabra, Reguant, 2014).
We now study the case of the power sector. Recall that Chan et al. (2013) find significant effects
on increasing unit material cost and total revenues for the power sector in ten European
countries, even though the sector was short as a whole. The authors conclude by saying that
“both findings could reflect utilities passing the cost (from compliance) to consumers” (ibid, p.
1061).
The energy sector is a special case with respect to cost pass-through ability and market structure
for two main reasons. First, electricity distribution is based on a national grid structure which
prevents most international companies from competing (Clò, 2010). Therefore, many power firms
used to have a historical monopoly in delivering electricity. This situation confers utilities a strong
market position, especially on retail markets (Veith, 2009; EU Commission, 2011). Second,
demand for electricity is highly price inelastic where price elasticity is usually lower for households
than for the industry (Fan, Hyndman, 2011; Filippini, Pachauria, 2004; Filippini, 1999). In addition,
low price rigidity facilitates the full pass-through of marginal costs. This is due to the organisation
of electricity markets in the form of an auction. Due to its high market concentration and low price
elasticity, the power sector is well-fitted for cost pass-through.
16You can also read