RAILWAY EFFICIENCY - 12DISCUSSION PAPER 2013 12 ARNE BECK, HEINER BENTE, MARTIN SCHILLING
←
→
Page content transcription
If your browser does not render page correctly, please read the page content below
Railway Efficiency

                          12
                     Discussion Paper 2013 • 12

                     Arne Beck, Heiner Bente,
                     Martin Schilling
                     Civity Management Consultants
                     GmbH & Co., Hamburg, Germany
Railway Efficiency
– An Overview and a Look at Opportunities for
Improvement
Discussion Paper No. 2013-12
Arne BECK / Heiner BENTE / Martin SCHILLING
Civity Management Consultants
May 2013THE INTERNATIONAL TRANSPORT FORUM
The International Transport Forum at the OECD is an intergovernmental organisation
with 54 member countries. It acts as a strategic think-tank, with the objective of helping
shape the transport policy agenda on a global level and ensuring that it contributes to
economic growth, environmental protection, social inclusion and the preservation of
human life and well-being. The International Transport Forum organises an annual
summit of Ministers along with leading representatives from industry, civil society and
academia.
The International Transport Forum was created under a Declaration issued by the Council
of Ministers of the ECMT (European Conference of Ministers of Transport) at its Ministerial
Session in May 2006 under the legal authority of the Protocol of the ECMT, signed in
Brussels on 17 October 1953, and legal instruments of the OECD.
The Members of the Forum are: Albania, Armenia, Australia, Austria, Azerbaijan, Belarus,
Belgium, Bosnia-Herzegovina, Bulgaria, Canada, Chile, China, Croatia, the Czech
Republic, Denmark, Estonia, Finland, France, FYROM, Georgia, Germany, Greece,
Hungary, Iceland, India, Ireland, Italy, Japan, Korea, Latvia, Liechtenstein, Lithuania,
Luxembourg, Malta, Mexico, Moldova, Montenegro, the Netherlands, New Zealand,
Norway, Poland, Portugal, Romania, Russia, Serbia, Slovakia, Slovenia, Spain, Sweden,
Switzerland, Turkey, Ukraine, the United Kingdom and the United States.
The International Transport Forum’s Research Centre gathers statistics and conducts
co-operative research programmes addressing all modes of transport. Its findings are
widely disseminated and support policymaking in Member countries as well as
contributing to the annual summit.
Discussion Papers
The International Transport Forum’s Discussion Paper Series makes economic research,
commissioned or carried out at its Research Centre, available to researchers and
practitioners. The aim is to contribute to the understanding of the transport sector and to
provide inputs to transport policy design. The Discussion Papers are not edited by the
International Transport Forum and they reflect the author's opinions alone.
The Discussion Papers can be downloaded from:
www.internationaltransportforum.org/jtrc/DiscussionPapers/jtrcpapers.html
The International Transport Forum’s website is at: www.internationaltransportforum.org
For further information on the Discussion Papers and other JTRC activities, please email:
itf.contact@oecd.org
This document and any map included herein are without prejudice to the status of or sovereignty over any
territory, to the delimitation of international frontiers and boundaries and to the name of any territory, city or
area.RAILWAY EFFICIENCY – AN OVERVIEW AND A LOOK AT OPPORTUNITIES FOR IMPROVEMENT
TABLE OF CONTENTS
EXECUTIVE SUMMARY ............................................................................................ 4
1. INTRODUCTION ............................................................................................... 5
2. WHAT IS ‘RAILWAY EFFICIENCY’? ...................................................................... 6
2.1 Overview ................................................................................................... 6
2.2 What are external factors that impact railway efficiency?................................. 6
2.3 What are the key cost and revenue drivers that impact railway efficiency? ........ 7
2.4 What does an efficient railway system look like? ............................................ 7
3. BENCHMARKING RAILWAYS: VALUE AND LIMITS ................................................. 9
3.1 Differences in the goals and roles of railways ................................................. 9
3.2 Differences in network and operations characteristics ..................................... 9
3.3 Differences in railway system structures ..................................................... 10
3.4 Differences in railway accounting standards and debt ................................... 10
3.5 Differences in the corporate status of railway companies ............................... 10
3.6 Summary ................................................................................................ 11
4. DIFFERENCES IN RAILWAY EFFICIENCY ............................................................ 11
4.1 Railway efficiency gaps ............................................................................. 11
4.2 Potential Reasons for Efficiency Gaps in Figure 3 .......................................... 13
4.3 Potential reasons for efficiency gaps ........................................................... 18
4.4 Summary ................................................................................................ 26
5. OPPORTUNITIES TO IMPROVE RAILWAY EFFICIENCY .......................................... 26
5.1 Direct efficiency levers: What railway managers can do to improve efficiency .. 26
5.2 Opportunities for lawmakers to improve railway efficiency ............................. 28
5.3 Interface between railway managers and government................................... 32
6. CONCLUSION ................................................................................................ 33
BIBLIOGRAPHY .................................................................................................... 35
ANNEX A: COMMON INDICATORS TO MEASURE RAILWAY EFFICIENCY ....................... 37
ANNEX B: REVIEW OF MCNULTY VALUE FOR MONEY STUDY ...................................... 39
McNulty Value for Money Study ........................................................................ 39
General findings of the Rail Value for Money Study ............................................. 39
Barriers to efficiency due to misalignment ......................................................... 39
Assessment of misalignment ............................................................................ 40
Key recommendations for GB rail ..................................................................... 40
Outlook ......................................................................................................... 41
Arne Beck, Heiner Bente, Martin Schilling — Discussion Paper 2013-12 — © OECD/ITF 2013 3RAILWAY EFFICIENCY – AN OVERVIEW AND A LOOK AT OPPORTUNITIES FOR IMPROVEMENT
EXECUTIVE SUMMARY
Railway efficiency is a topic of interest worldwide for railway managers operating in
competitive markets and for fiscally strained governments. Several recent studies
indicate that European railways differ in terms of their efficiency. Based on a comparison
with some major non-European railway systems, our analysis provides further evidence
that significant efficiency gaps exist.
Indeed, some railways have managed to achieve a high level of efficiency while others,
for reasons controlled by management and/or government, can be classified as relatively
inefficient. Key efficiency benchmarking indicators, further evidence through interviews
with railway efficiency experts and additional research confirm the existence of railway
efficiency gaps between railways. Differences in asset utilization, staff productivity,
freight rates, and cost/revenue ratios are all key indicators highlighted in this discussion
paper that further prove this point.
Moreover, our analysis brought further evidence for why these efficiency gaps exist.
Regulations and infrastructure constraints, such as regulations that impact freight train
length, have a major impact on efficiency. New technologies are also a central driver of
railway efficiency, as effective technology allows for improved and more effective
maintenance of assets, better communication with customers, and automation of
processes. In general, the reasons for efficiency gaps vary widely across countries and
depend on nation or region-specific factors. Further levers to efficiency that can be
implemented by government and regulatory bodies include opening the rail market to
competition and providing steady, reliable funding for rail improvements that improve
public mobility and air quality. It is also critical that the government and railway
managers clearly define the role as chiefly a business or as an organization with the
primary purpose to support public priorities (mobility, environmental and social
priorities).
4 Arne Beck, Heiner Bente, Martin Schilling — Discussion Paper 2013-12 — © OECD/ITF 2013RAILWAY EFFICIENCY – AN OVERVIEW AND A LOOK AT OPPORTUNITIES FOR IMPROVEMENT
1. INTRODUCTION
Railway efficiency is an important topic worldwide for transportation ministers of fiscally
strained governments and railway managers operating in competitive markets. On the
one hand, railways are under pressure to keep costs low, often because of market
pressures or because of the unavailability of public funds as a result of competing
national priorities. On the other hand, increases in railway usage for passenger and
freight have occurred after decades of decline, which necessitates additional investment
in track infrastructure and rolling stock. Under pressure to reduce costs while improving
rail’s level of service and expanding rail capacity, railways and governments continue to
look for ways to improve efficiency.
Political decision makers and railway experts have long believed that the potential exists
for railway efficiency improvement. Benchmarking studies (see McNulty and Cantos et
al., for example) have indicated that European railways systems indeed differ in terms of
efficiency. This discussion paper takes a more global perspective with regards to the
opportunities for improvement in railway efficiency. The paper identifies possible
common barriers to efficiency, identifies “traps” that need to be avoided for improving
efficiency of railways, and derives major recommendations on how to enhance the
railway system from a financial perspective. The study includes findings from selected
international benchmarking analyses and examinations of relevant cross-sectional data.
Additionally, the paper is complemented by important railway restructuring literature, our
own consulting experience out of numerous benchmarking projects and interviews with
industry experts.
Please note that our aim is not to provide a comprehensive and detailed list of efficiency
drivers and reasons for inefficiency – rather, the focus of this document is to summarize
key reasons for railway efficiency and provide recommendations for improvements.
All in all this discussion paper addresses several questions with regard to railway
efficiency. First, we explore what is meant by the term ‘railway efficiency’ in Section 2. In
Section 3 we briefly discuss benchmarking and the limits and values of this analysis tool.
In Section 4, we explore whether railway efficiency gaps really exist at railways around
the world and simultaneously explore some key reasons why these efficiency gaps might
appear. Finally, in Section 5, we review some of the key strategies and actions currently
under discussion by railway managers and regulators to improve railway efficiency.
Section 6 concludes the report.
Arne Beck, Heiner Bente, Martin Schilling — Discussion Paper 2013-12 — © OECD/ITF 2013 5RAILWAY EFFICIENCY – AN OVERVIEW AND A LOOK AT OPPORTUNITIES FOR IMPROVEMENT
2. WHAT IS ‘RAILWAY EFFICIENCY’?
2.1 Overview
Railway systems are viewed positively by citizens and policymakers around the world
because of their impact on mobility, their potential to improve land use and development
in urban centers (i.e. less land allocated to parking and prospects for transit-oriented
development around railway stations), and because of rail’s relatively low environmental
footprint when compared to other transport modes. As a result of these perceived
benefits and others, governments are often highly involved and financially engaged
stakeholders of railways. However, especially in financially-constrained times,
governments are also expected to balance their budgets and invest public funds wisely.
Thus, governments have a genuine interest in making sure that railway systems – under
any given policy targets – deliver the best possible return on invested capital.
These realities help define what ‘railway efficiency’ is from a financial perspective. In
general, outputs and public benefits are of high importance, yet minimization of costs
and public funding is critical. Within this context, efficient railways produce significant
results and outputs given the money invested in operating, maintaining and renewing the
railway. This might be measured by a comparatively high utilization of asset investment,
a relatively high output (i.e. total train-km) to input (i.e. costs) ratio or a relatively high
level of productivity within the organization.
Nevertheless, efficiency is a broad term with many potential definitions. One can focus on
energy efficiency, efficiency in terms of timeliness, etc. Canada, for example, measures
fluidity and reliability to determine efficiency levels. However, this document focuses on
the discussion of railway efficiency from a financial perspective.
2.2 What are external factors that impact railway efficiency?
Each nation and railway is subject to unique characteristics that will undoubtedly impact
efficiency. For one, a nation’s history has shaped the organizational structure of the
railway as well as the physical network. Subsidies for rail and annual deficits may be
acceptable in some nations and not in others. Wars and its repercussions have impacted
rail infrastructure. Topography is another factor. Switzerland and Japan both are nations
with high concentrations of mountainous terrain, which makes the construction and
maintenance of infrastructure more expensive. Settling patterns and population density
also impact efficiency and utilization of trains. France, Sweden and Canada all have low
population densities when compared with Belgium, Germany or Switzerland, which may
impact utilization of costly rail assets.
In those railway systems in the world where generous investment funds are available
because of government support, systems may emerge that lack the cash flows to sustain
operations in the future. In the United States, for example, several State Governors
returned federal seed money for development of ‘higher-speed’ rail partly because those
State governments did not want to be responsible for contributing public funds to support
future operations costs. In China and the United Arab Emirates, governments are
6 Arne Beck, Heiner Bente, Martin Schilling — Discussion Paper 2013-12 — © OECD/ITF 2013RAILWAY EFFICIENCY – AN OVERVIEW AND A LOOK AT OPPORTUNITIES FOR IMPROVEMENT
investing in new railway systems at an unparalleled level. In Europe and in other
countries around the world, many railway operators and infrastructure providers receive
substantial government support because of the perceived importance of a well-
functioning railway system to achieve critical public goals and demands, be they
environmental, social or economic.
It is critical to take such factors into account when understanding differences in railway
efficiency across borders, as these factors undoubtedly impact efficiency but are difficult
(if not impossible) to change.
2.3 What are the key cost and revenue drivers that impact railway
efficiency?
When examining railway efficiency, it is helpful to frame the discussion around two
distinct (and often separate) railway functions: infrastructure (generally related to assets
on and around the track) and operations (generally focused on the train itself and all of
the associated functions). For each of these functions, costs (either investment or
running) and revenues (either from "the market" or from the government) can be
separated. From a public perspective, the height of net subsidies thus depends on the
revenues generated by the market and the level of costs of the railway.
In order to analyze railway financial performance in more depth, rail experts created
several railway efficiency performance indicators that measure efficiency from the
government, passenger/client, infrastructure manager and train operating company
perspectives. Annex A summarizes these indicators, which were derived from several
well-known studies, expert interviews and from civity’s own benchmarking experience. 1
Figure 1 highlights some key cost and revenue drivers for train operations and
infrastructure.
Figure 1: Selected Cost/Revenue Drivers for Train Operations and Infrastructure
Train Operations Infrastructure
Costs Vehicle investments Asset investment
Human resources Maintenance and renewals
Revenues Farebox revenues Track access charges
Public funding (net subsidies) Public funding (net subsidies)
2.4 What does an efficient railway system look like?
An efficient railway from a national perspective (including freight and passenger railways)
maximizes revenues and minimizes costs while providing the desired level of service. In
a recent report, Jan Swier developed a generic cost and revenue model for the entire rail
transport network in the Netherlands using actual earnings and cost data (see Swier). A
generic model of Swier’s chart was derived to provide an overview of the relationship
between costs, revenues and public subsidies for railway systems in general. Based on
1
The indicators shown have been used in studies by civity Management Consultants and
are further used in some form by McNulty, Swier and others
Arne Beck, Heiner Bente, Martin Schilling — Discussion Paper 2013-12 — © OECD/ITF 2013 7RAILWAY EFFICIENCY – AN OVERVIEW AND A LOOK AT OPPORTUNITIES FOR IMPROVEMENT
his findings, our simplified Figure 2 highlights what the cost/revenue model of a railway
may look like from a global perspective – regardless of who owns what segment of the
railway industry, and regardless of whether freight and rail are owned by different
entities. The figure highlights the importance of asset utilization to railway efficiency.
Figure 2: Simplified Representation of Costs/Revenues of a Railway System
Source: civity Management Consultants figure based on Swier
Note: Transport Units = Passenger km + ton km
Please note that Figure 2 is a simplified graph which assumes that revenues increase
linearly as track density increases, which may not be the case in reality. Additionally, in
some nations, freight revenues make up a substantially larger component of total railway
system revenues (e.g. in the U.S.), while Figure 2 mirrors the structure of numerous
European railways more closely.
For one country/railway, “railway efficiency” may be achieved if total revenue is the
same as or equal to total costs (see the point of equilibrium in Figure 2 above). For other
countries/railways, the same may be true, but for them a railway is not efficient unless it
is profitable without public subsidies. In summary, the chart highlights that the higher
the track density, or track utilization (the more individual routes and railway operators
that are located in the right-hand side of the graph), the higher the earnings per
currency unit invested.2
2
Note that the analysis of absolute levels of costs and fares will follow later.
8 Arne Beck, Heiner Bente, Martin Schilling — Discussion Paper 2013-12 — © OECD/ITF 2013RAILWAY EFFICIENCY – AN OVERVIEW AND A LOOK AT OPPORTUNITIES FOR IMPROVEMENT
3. BENCHMARKING RAILWAYS: VALUE AND LIMITS
Before going into more detail on railway efficiency through benchmarking analyses in
Section 4, it is necessary to highlight the value that railway benchmarking analysis in
general brings and what the limits of such analyses are. Benchmarking can be useful for
identifying key differences between nations and for uncovering potential solutions and
“best practice” information to achieve greater railway efficiency (e.g. railway A is more
efficient than railway B because of the results shown in key indicator X). However, this
methodology is only useful as long as the diverse “raisons d’être” of national railway
systems are acknowledged in the analysis. If a narrow “one size fits all” approach is
taken, the usefulness of benchmarking analysis is limited.
Several important points to consider when utilizing benchmarking as a tool are discussed
in this section. As a general rule, the benchmarking analysis must clarify what makes
certain railway systems comparable and, on the other hand, must clarify differences in
railways that blur benchmarking analysis. It is also critical to identify missing and unclear
data.
3.1 Differences in the goals and roles of railways
One of the difficulties with achieving railway efficiency is the challenge for railways and
governments to agree on what the right framework is for achieving efficiency. Definitions
of efficient railways can vary. For one nation, a railway may be efficient only when it is
profitable with minimal public funding. Alternatively, another government may require
the railway to support national economic and mobility policies that deviate from the
direct business performance of the railway (i.e. wide market coverage [beyond what
makes sense from a business standpoint], lower fares [lower than market rate] to
improve mobility of citizens, attract mode share to rail [for environmental or road
congestion purposes], etc.). According to experts, it is thus critical that governments and
railways define goals and objectives of the railways for themselves and then clearly
distinguish roles and responsibilities. When benchmarking railways, these goals and roles
of the railway (however defined) must be observed and adequately understood.
3.2 Differences in network and operations characteristics
Railway systems are diverse in the services that they offer. This applies to the relative
share of passenger versus freight traffic, the network scope (mixed vs. dedicated
operations, densely knit networks, corridor operations) and the mix of market segments
(e.g. long distance high-speed, urban agglomerations). Another important factor in this
regard is the concentration of traffic throughout the system. Many large railway networks
have a significant concentration of total traffic volume located on a small subset of the
overall network, which generate a large proportion of total revenue. Moreover, certain
network characteristics, such as the degree of system electrification and switch density,
have long-term impacts on infrastructure maintenance costs.
Arne Beck, Heiner Bente, Martin Schilling — Discussion Paper 2013-12 — © OECD/ITF 2013 9RAILWAY EFFICIENCY – AN OVERVIEW AND A LOOK AT OPPORTUNITIES FOR IMPROVEMENT 3.3 Differences in railway system structures One factor that may impact benchmarking analysis and railway efficiency is the degree to which the primary functional areas of the railway, particularly operations and infrastructure management, are owned or managed by different organizations. The topic of vertical separation has been widely analyzed in Europe during the past 15 years, with varying benefits for vertically integrated (e.g. the Swiss Railway) or vertically separated (e.g. UK) railways. The European Commission has pursued policy that requires vertical separation between infrastructure management and operations, primarily to ensure open access on the railway networks and to foster competition between train operating companies. However, the most recent draft railway package also supports other structures, such as the holding company structure (see Kallas). For the purposes of benchmarking, it is necessary to understand the structure of the railway, yet it is also important not to place too much emphasis on the structure when attempting to understand differences in efficiency. Another aspect to consider is the degree of separation between freight and passenger rail functions in a given country. 3.4 Differences in railway accounting standards and debt Unified standards of railway financial reporting do not exist. This is particularly noticeable with respect to reporting and accounting for public sector contributions to railways (differences are especially noticeable when reviewing financial documents regarding publicly-funded capital expenditures; also noticeable differences in accounting for public funding for railway operations). Since railways are highly asset intensive businesses, incomplete or missing data with respect to capital costs from balance sheets has an impact on the eventual interpretation of railway efficiency. Suitable data to compare railways on equal financial footing are not always available, which makes it important to make note of such caveats. Differences in the ability or the likelihood of railways to take on debt also impacts how railway efficiency is portrayed. One railway may be operating efficiently on the surface, but may be burdened by debt as a result of previous investments made in the network and technology. Government support for capital projects and government write-offs of long-term debts can quickly change how efficient a railway looks when utilizing key indicators that involve the use of revenue and cost data. 3.5 Differences in the corporate status of railway companies In some nations, railways are government-owned and government-run, while in other nations railways operate as private sector firms, either as monopolistic firms or within a competitive marketplace. Privatization efforts in the past two decades have shown mixed results. In some cases, privatization has resulted in improved performance and higher cost efficiency. In other examples, privatization of railways has resulted in the neglect of rail assets to achieve short term financial improvements, higher refinancing costs and (increased) equity yield rates. Either way, it is important to take the corporate status of railways into account in benchmarking analyses. 10 Arne Beck, Heiner Bente, Martin Schilling — Discussion Paper 2013-12 — © OECD/ITF 2013
RAILWAY EFFICIENCY – AN OVERVIEW AND A LOOK AT OPPORTUNITIES FOR IMPROVEMENT

3.6      Summary

The differences discussed above both limit the effectiveness of benchmarking and
underline the value of benchmarking. It is necessary to be aware of these points when
reviewing the benchmarking data in Section 4. Although data might not be fully
available, accounting standards differ and since there might be inherent differences
between nations that make 1:1 comparisons difficult, the process of benchmarking
creates a discussion around what some railways (and railway regulators) are doing to
improve efficiency, while also highlighting what has hurt railway efficiency in some
regions. Such comparisons eventually allow decision makers to take the necessary steps
to improve railway efficiency.

                        4. DIFFERENCES IN RAILWAY EFFICIENCY

Several studies have indicated that differences in efficiency exist between European
countries (see McNulty and Cantos et al., for example). McNulty highlights that a
significant efficiency gap exists between the U.K. and a group of European comparators,
while Cantos’ analysis highlights efficiency differences when comparing several European
railways.

Using data from a variety of sources, the purpose of this section is to provide further
evidence of efficiency gaps between railways through a broader assessment of additional
ITF member countries and to simultaneously understand some of the primary reasons for
these gaps. This is complemented through relevant literature and additional interviews
with railway efficiency experts from the U.S., China and India. In Section 4.1 we utilize
key efficiency indicators to get an overview of efficiency gaps. In Section 4.2, we build on
these initial indicators and further discuss potential reasons for these efficiency gaps. In
addition, we review railway systems and railway efficiency in three countries to gain
further perspectives on efficiency outside of Europe.

It is important to note that within this chapter we are attempting to understand reasons
for efficiency gaps. However, we are aware that within the context of this broad study,
this is a rather difficult task given the breadth and variety of reasons that lead to railway
inefficiency. As a result, we focus on highlighting the main (probable) causes for
efficiency gaps that have been identified through analysis of high level indicators, our
research and information from rail expert interviews, which have been verified with our
own consulting experience out of numerous benchmarking and restructuring projects.
This will form a good starting point for further evidence through other quantitative
methods in future studies, a work that cannot be done within this study due to the wide
scope of this paper and, currently, limited data availability. Nonetheless, this analysis
reviews key indicators and draws from expert input that provides a useful basis for
political discussion and a framework for country-specific railway efficiency analysis.

4.1      Railway efficiency gaps

Figure 1 in Section 2 highlights some of the key cost and revenue drivers for railways.
Through comparisons of key indicators that compare output (ton-km and passenger-km)

Arne Beck, Heiner Bente, Martin Schilling — Discussion Paper 2013-12 — © OECD/ITF 2013     11
RAILWAY EFFICIENCY – AN OVERVIEW AND A LOOK AT OPPORTUNITIES FOR IMPROVEMENT with key cost/revenue drivers, a clearer picture emerges of efficiency gaps between countries and what some of the potential reasons for the gaps may be. In this subsection we analyze track and train utilization, staff productivity, and a variety of other efficiency indicators that are major efficiency drivers as discussed in Section 2. 4.1.1 Key indicator: track and train utilization High utilization of railway assets (rolling stock and track infrastructure) leads to more efficient railways, given the asset-intensive nature of the industry (see Section 2 above). With high fixed maintenance and depreciation costs for these assets, it is critical to use each kilometer of track as often as possible. Studies have shown that higher utilization of assets through freight operations has a positive impact on efficiency (see Sanchez and Villarova). Figure 3 below combines both dimensions of success-critical asset utilization: the train-density on network infrastructure (x-axis) and the capacity utilization of trains (y-axis). Figure 3: Train Operator and Railway Infrastructure Utilization by Country, 2011 Source: civity Management Consultants benchmarking analysis, based on UIC Railway Data 2011 Note: Transport Units = Passenger km + ton km, a detailed review of passenger versus freight is not possible as the adequate separation of freight- and passenger specific track-km is not possible with available data. Data includes the following carriers: France (RFF, SNCF, VEOLIA); Germany (DB AG); Netherlands (NS, ProRail); Sweden (Trafikverket, GREEN CARGO, SJ AB); UK (ATOC, Eurostar Intl, Eurotunnel, HS1, Network Rail, NIR); Switzerland (BLS, BLS Cargo, SBB CFF FFS); Russia (RZD); USA (Class I Freight RRs, Amtrak); Australia (QR); China (CR); India (IR); Japan (JR); Belgium (SNCB NMBS); Austria (GKB, ÖBB) Figure 3 shows that utilization gaps exist, both for the management of infrastructure and the operation of trains. Regardless of whether freight or passenger rail is the primary user of rail in a particular country, the figure shows differences in the degree of asset utilization. This broadly equates the value of one passenger-km with one ton-km for the 12 Arne Beck, Heiner Bente, Martin Schilling — Discussion Paper 2013-12 — © OECD/ITF 2013
RAILWAY EFFICIENCY – AN OVERVIEW AND A LOOK AT OPPORTUNITIES FOR IMPROVEMENT

purposes of comparison and the definition of a transport unit. The figure also provides a
starting point for examining why some infrastructure managers and train operators are
more efficient than others. The countries on the outer frontier of the graph (the sample
U.K. carriers, China and the U.S.) are the strongest performers in terms of utilization in
the sample. QR in Australia and several Swiss railways are in the second frontier while
the majority of other European railways, IR in India and JR in Japan are in the third and
fourth frontiers, which indicate lower levels of utilization.

A further possible step to better understand reasons for utilization differences would be
to compare only countries/railway systems with similar general characteristics. For
example, this could include comparison on the proportion of traffic that is freight vs.
passenger, terrain (mountainous vs. flat), population density and others. Additionally,
analysis could be undertaken to focus on utilization/efficiency in specific regions, such as
the European Union, East Asian countries or Central/South American countries. This is
not feasible within the scope of this discussion paper, but could bring to light further
reasons for efficiency gaps and highlight additional potential for improvement. 3

4.2      Potential Reasons for Efficiency Gaps in Figure 3

Several clusters and patterns are evident from Figure 3. For one, it is interesting that no
rail system is in the top right-hand corner. For example, the railways in the U.K. and
Switzerland were able to utilize their track infrastructure very efficiently, but were not
able to optimize train utilization in the same way that railways in the U.S. did. China is
able to utilize both relatively efficiently. If a country were to be in the top right-hand
corner of the chart, it would indicate a high degree of both train and infrastructure
utilization (relative to the railways shown in the graph). In other words, the track
infrastructure would constantly be in use by trains, and long, full trains of freight and/or
passenger trains would frequently move on the tracks to fulfill rail demand.

One cluster that becomes visible immediately is the cluster of countries in the top left-
hand corner which utilize trains effectively but do not utilize tracks as well as some
railways in Europe and Japan. China, India, Russia, Australia and the United States are
all large countries (in terms of square-km) and relatively low population density. This
results in longer trips with lower usage of the tracks, particularly in the U.S. The railway
in China, interestingly, utilizes its tracks as effectively as some much smaller countries
such as Germany, Austria and Belgium.

One example is freight train length regulations, which play a significant part in train
utilization. In Germany, for example, no trains longer than 740 meters are allowed to
operate on the majority of the network (see DB Netz AG Richtlinie 408.0711). However,
several tracks in Germany have started to allow longer trains, and the topic of longer
trains is under discussion. Similar regulations exist in most European countries. In

3
         Capacity constraints and pricing/tendering policies also impact the flow and efficiency of
         railways. For example, capacity may exist in a railway system with high demand, yet one
         minor missing piece of infrastructure such as a switch can limit how well the system
         capacity as a whole can be utilized. Under-utilization will exist until this problem can be
         addressed. As it is often a difficult and lengthy process to remove system bottlenecks,
         pricing strategies can be implemented to optimally utilize resources given constraints
         (such as bottlenecks). Regulatory mechanisms that work adequately can also be
         implemented. Countries can deal with such situations differently, which can impact
         efficiency for better or for worse.

Arne Beck, Heiner Bente, Martin Schilling — Discussion Paper 2013-12 — © OECD/ITF 2013           13
RAILWAY EFFICIENCY – AN OVERVIEW AND A LOOK AT OPPORTUNITIES FOR IMPROVEMENT
comparison, the U.S. does not have practical limits on train lengths. Freight trains in
excess of 5.5 km length transport goods on key routes (see Joiner). In Canada, freight
trains are also applying the long-train strategy, with intercontinental intermodal freight
trains for Canadian Pacific Railway having lengths over 3,600 meters in 2011, with
further increases expected in the near future (see Transport Canada). Long trains
traveling longer distances increases the utilization of trains (especially through their
higher capacity), helps reduce costs for the railways and thus makes rail more
competitive with trucks on the marketplace. Figure 4 highlights the low freight carriage
rates that this makes possible in the North American Freight market.
Figure 4: Index of Freight Railroad Rates Charged, 2006-2008 averages
Source: American Association of Railroads (AAR), October 2012
Input from the U.S. interview (see Gray) also confirmed that longer trains are critical for
freight railway efficiency in the U.S. Additionally, China and India have significantly less
track-km than the United States, but China has similar ton kilometers and significantly
higher passenger kilometers, which improves track utilization.
Next, railways in the Netherlands, Switzerland and several railways in the U.K. have high
utilization of tracks. The reasons are not totally clear – however, population density and
the relatively small size of the country are probably contributors to high track utilization.
4.2.1 Contributors to High Track Utilization
In addition to the factors mentioned above, several factors can improve track and train
utilization. For one, focusing rolling stock assets on the most highly-used routes will
improve utilization because higher ridership can be expected on these routes. Fuller
trains by definition indicate higher utilization of rolling stock, which is beneficial to
efficiency and railway revenue. Additionally, optimizing the network by selling off or
decommissioning tracks that are rarely used will reduce maintenance and save costs. Of
course, these are steps that can be difficult to implement politically, and may not serve
the economic interest of the region.
14 Arne Beck, Heiner Bente, Martin Schilling — Discussion Paper 2013-12 — © OECD/ITF 2013RAILWAY EFFICIENCY – AN OVERVIEW AND A LOOK AT OPPORTUNITIES FOR IMPROVEMENT
In summary, the higher the utilization of assets through the movement of goods and
people, the more use is being made of expensive tracks and rolling stock, which benefits
railway efficiency.
4.2.2 Key efficiency indicator: staff requirements
Benchmarking data shows that an average of nearly 40 percent of annual operating
expenses of major western European train operating companies come from personnel
costs.4 They are key drivers of railway cost and efficiency and therefore need to be
included in this analysis. Figure 5 below compares how many employees are required by
railways worldwide in order to provide freight and passenger railway services.
Figure 5: Staff Productivity
Source: civity Management Consultants benchmarking analysis, based on UIC Railway Data 2011
Note: Transport Units = Passenger km + ton km; a detailed review of passenger versus freight is not possible
as personnel data and track-km for freight and passenger railways specifically was not readily available
Personnel data from 2008, 2009 or 2010 (varies by railway) available within the 2011 dataset from UIC
Analysis includes the following carriers: France (RFF, SNCF, VEOLIA); Germany (DB AG); Netherlands (NS,
ProRail); UK (ATOC, Eurostar Intl, Eurotunnel, HS1, Network Rail, NIR); Switzerland (BLS, BLS Cargo, SBB CFF
FFS); Russia (RZD); USA (Class I Freight RRs, Amtrak); Australia (QR); China (CR); India (IR); Japan (JR);
Belgium (SNCB NMBS); Austria (GKB, ÖBB)
It is important to point out that Figure 5 includes freight AND passenger travel. It was
not possible to create separate graphics, as the data available for the study did not break
personnel and track-km down by freight/passenger. Differences in personnel
requirements exist for freight and passenger services, with passenger rail often requiring
4
Derived from civity Management Consultants analysis of operating costs in Austria,
Belgium, Denmark, Germany, Great Britain, the Netherlands Sweden and Switzerland
Arne Beck, Heiner Bente, Martin Schilling — Discussion Paper 2013-12 — © OECD/ITF 2013 15RAILWAY EFFICIENCY – AN OVERVIEW AND A LOOK AT OPPORTUNITIES FOR IMPROVEMENT
more personnel to deal with customer satisfaction, passenger bookings, and other facets
of serving travelers. Figure 6 below highlights how focused various nations are on freight
versus passenger rail. The purpose of the graphic is to highlight how ‘passenger-heavy’
or how ‘freight-heavy’ a country is in light of the figure above. Indian and Chinese
railways move the most passengers in the group, with Japan and Russia in the second
tier. In Figure 5 above, we see that overall personnel efficiency is low, particularly in
India, China and Russia. The rail expert interview in China confirmed that China can
improve in the area of personnel efficiency (see Jian). The figure also highlights that the
U.S., Russia and China move the most freight. Very few passenger trains operate in the
U.S. compared to the other countries with high freight volumes – this may be a key
contributor to high personnel efficiency for the railway system as a whole shown in
Figure 5.
Figure 6: Railway Freight and Passenger Travel in Countries in Figure 5
Source: civity Management Consultants, based on UIC Railway Data 2011
Note: No passenger km data for Australia available in the dataset; No freight ton-km for the Netherlands
available in the dataset
Analysis includes the following freight and passenger carriers: France (RFF, SNCF, VEOLIA); Germany (DB AG);
Netherlands (NS, ProRail); UK (ATOC, Eurostar Intl, Eurotunnel, HS1, Network Rail, NIR); Switzerland (BLS,
BLS Cargo, SBB CFF FFS); Russia (RZD); USA (Class I Freight RRs, Amtrak); Australia (QR); China (CR); India
(IR); Japan (JR); Belgium (SNCB NMBS); Austria (GKB, ÖBB)
In addition to the comparison between freight and passenger movements, other factors
can contribute to high personnel costs. An interview with a rail expert in India (see
Mathur) highlighted that a key contributor to inefficiency are costs from pension liabilities
dating back to the old pension scheme prior to 2004. Additionally, relatively high wages
in some countries as well as the number of productive hours per year fluctuate, which
also has an impact on efficiency. Automation and technology implementation is also a
major driver of efficiency, which has significant concurrent benefits on efficiency with
regards to personnel. Thus, implementation of new technologies has played a significant
role in improving efficiency for freight rail in the U.S. and Canada (see Woodrooffe).
16 Arne Beck, Heiner Bente, Martin Schilling — Discussion Paper 2013-12 — © OECD/ITF 2013RAILWAY EFFICIENCY – AN OVERVIEW AND A LOOK AT OPPORTUNITIES FOR IMPROVEMENT
4.2.3 Additional key efficiency indicators in benchmarking analysis
In addition to track utilization and staff requirements, a variety of other indicators can
help explain why some railways perform better than others in terms of efficiency. These
indicators are related to the key cost and revenue drivers of railways. Figure 7 below
presents the minimum, maximum, average and standard deviation of values in a
benchmarking analysis completed for a variety of European passenger railway operators.
These indicators were selected as they are strong indicators of efficiency as determined
by the authors in Section 2 and, moreover, as a result of data availability. They also
closely measure the key cost and revenue drivers displayed in Figure 1 of Section 2.
Further detail and descriptions can be found in Annex A.
Figure 7: Identification of Gaps in Key Efficiency Indicators
Std
Efficiency Indicator Unit Min Max Avg
Dev*
Passenger’s operator revenue to
cost ratio (excl. public funding and % 43% 129% 77% 28%
financial revenues)A
Infrastructure manager’s revenue
to cost ratio (excl. funding and % 14% 85% 42% 20%
financial revenues)A
Utilization of railway millions train-
3.749 64.819 26.831 16.778
km/track km
infrastructureB
Utilization of freight/passenger millions TU/train
77 2.962 833 924
km
transport operatorsB
Passenger operating expenses per €/train km 12,0 22,5 14,7 3,4
train-kmA
Passenger personnel €/train km 2,5 11,3 5,8 2,7
expenses per train-kmA
Passenger revenues per €/train km 13,7 25,8 18,6 3,6
train-kmA
Farebox revenues per passenger- €/k passenger
64,0 151,7 95,8 27,6
km
kmA
Farebox revenues per train-kmA €/train km 6,9 16,2 11,1 3,0
Freight revenue per ton-kmC €/ton km 0,0041 0,0550 0,0244 0,0170
Infrastructure costs per train-kmA €/train km 5,3 18,1 11,6 3,9
Infrastructure costs per track-kmA €/track km 85,7 261,6 195,1 61,6
* Std Dev = standard deviation
A
High level benchmarking analysis using publicly available data comparing IMs and TOCs from Austria,
Belgium, Denmark, Germany, Great Britain, the Netherlands Sweden and Switzerland. Structural harmonization
of data was not performed, but financial values were adjusted for PPP.
B
Data from UIC in 2011 comparing railway systems in Australia, Austria, Belgium, China, France, Germany,
Great Britain, India, Japan, the Netherlands, Russia, Sweden, Switzerland, and the U.S.
C
Data from the World Bank comparing freight railway data in Belgium, Canada, China, France, India, Japan,
Russia, Switzerland and the U.S. (data from 2004 and 2005)
Arne Beck, Heiner Bente, Martin Schilling — Discussion Paper 2013-12 — © OECD/ITF 2013 17RAILWAY EFFICIENCY – AN OVERVIEW AND A LOOK AT OPPORTUNITIES FOR IMPROVEMENT The variances observed in the indicators in Figure 7 further highlight that efficiency gaps exist among railways. Particularly large gaps are found in passenger operator revenues, utilization and freight revenue per ton-km. This further makes the case that country- specific analysis and/or benchmarking is required to determine where efficiency can be improved. Several of these indicators and their impact on efficiency are discussed in more detail in Section 4.2. 4.3 Potential reasons for efficiency gaps 4.3.1 A European perspective The indicators in Section 4.1 show that there are significant gaps in how well key railway assets and staff are utilized by railway managers. Additionally, financial indicators show that there are significant gaps in normalized costs and revenues at passenger operators in Europe. Why do these gaps exist? For one, the outside factors discussed in Section 2.2 can play a significant role in railway efficiency. We can see from Figure 3 above that large countries have an inherent disadvantage when it comes to utilization of track. A large country with low population density such as Australia will have lower track utilization than a smaller, more densely populated country such as the Netherlands. A more mountainous landscape like in Switzerland will increase the cost of rail as well, as renewal and maintenance costs go up because of the addition of tunnels etc. Several studies have identified reasons for railway efficiency gaps. First, the Office of Rail Regulation (ORR) highlighted that an efficiency gap exists between the U.K. and several European comparators because of differences in contracting and possessions strategy, system renewals, asset condition monitoring, renewal backlogs, workforce protection and effective network size (see Office of Rail Regulation). Sanchez and Villarrova concluded that technical progress is very important to improved productivity at railways. The Swiss public transport association ‘Verband Öffentlicher Verkehr’, or VÖV, highlights that the majority of productivity gains in recent years are primarily attributable to automation at the railway (see Verband Öffentlicher Verkehr). Wetzel highlights in their analysis that technology improvements were by far the most significant driver in efficiency improvements on European railways between 1990 and 2005, which is when the majority of deregulation activity took place (see Wetzel). Below, we highlight several additional key information and indicators that help further explain reasons for efficiency gaps. 4.3.2 Passenger train operating expenses and revenues Operating expenses per train-km is a critical indicator for railway efficiency because it measures the level of financial inputs required per train. This directly showcases where public and private funds go to when supporting rail operations. The higher the number, the more that railway must invest for each train-km. A higher number compared to the peer group implies relative inefficiency at the railway. 18 Arne Beck, Heiner Bente, Martin Schilling — Discussion Paper 2013-12 — © OECD/ITF 2013
RAILWAY EFFICIENCY – AN OVERVIEW AND A LOOK AT OPPORTUNITIES FOR IMPROVEMENT

Figure 8: Western European Passenger Train Operator Costs [EUR/train-km]

Source: civity Management Consultants benchmarking analysis
TAC = Track Access Charges

The figure above highlights that fairly large gaps in unit operating costs exist even in
Europe. Track Access Charges (TAC) vary considerably by country, and personnel
expenses are a large component of total costs. Significant variations exist, however, in
personnel costs of railway operations, which suggests that there is room for
improvement either through improved management and/or regulatory changes that
impact personnel costs. Energy costs, on the other hand, are relatively steady across the
countries. This highlights that a major cost driver for train operating companies in this
sample are personnel expenses, with the significant gap indicating room for improvement
in this expense category.
Unit revenues, particularly farebox revenues per train-km, help discern how much a
passenger railway is able to charge at the farebox for its services. A higher value in this
category indicates that a railway is generating more money for each train-km for which it
generates costs. From Figure 9 we see that farebox revenues differ substantially. For
countries with lower farebox revenue per train-km, the railway could for example make
adjustments to ticket prices on major routes and take price elasticity into account. Figure
9 highlights where revenues come from at a variety of European railways and provides
evidence that there is room for improvement for a number of operators.

Arne Beck, Heiner Bente, Martin Schilling — Discussion Paper 2013-12 — © OECD/ITF 2013    19
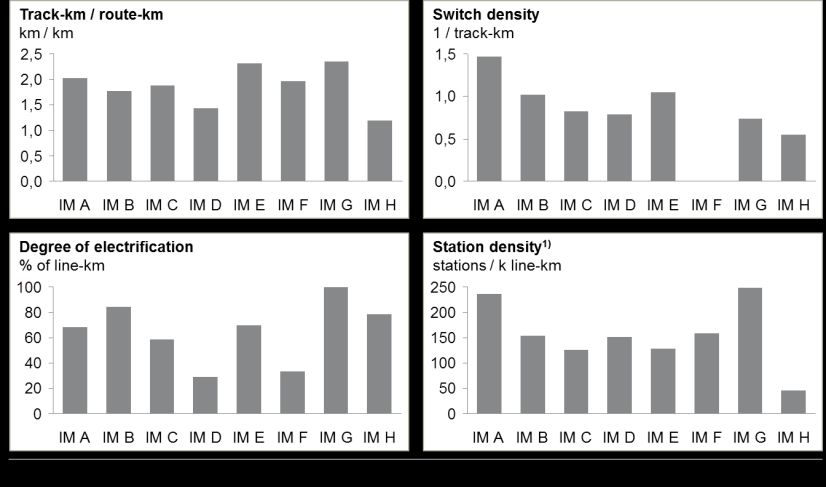
RAILWAY EFFICIENCY – AN OVERVIEW AND A LOOK AT OPPORTUNITIES FOR IMPROVEMENT

Figure 9: Western European Passenger Operator Revenues [EUR per train-km]

Source: civity Management Consultants benchmarking analysis
Note: Transport agreements (e.g. PSO's for operations) can be contractual obligations between varying levels
of government, for example local governments may pay a national rail carrier for utilizing certain tracks.
Subsidies/Funding indicates direct funding from the central government (or regional government) to support
operations costs.

4.3.3     Railway infrastructure costs

As highlighted in Section 2, infrastructure costs are significant cost drivers for railways
and infrastructure managers in particular (often ~50% of total costs). Primary costs
incurred by railway infrastructure managers include maintenance and renewal of track
and all related infrastructure. This requires personnel, material, purchased services, and
asset depreciation costs. Below, normalized costs across several infrastructure managers
in Europe are reviewed. Strong fluctuations exist in terms of normalized personnel costs
and materials costs, which shows that high costs of this nature are further reasons for
efficiency gaps across railways.

20                 Arne Beck, Heiner Bente, Martin Schilling — Discussion Paper 2013-12 — © OECD/ITF 2013
RAILWAY EFFICIENCY – AN OVERVIEW AND A LOOK AT OPPORTUNITIES FOR IMPROVEMENT

  Figure 10: Western European Railway Infrastructure Costs [k EUR/track-km]

Source: civity Management Consultants benchmarking analysis

Additionally, key variables that can create differences in infrastructure costs include the
degree of electrification (higher electrification can result in higher infrastructure
maintenance costs but lower energy costs and potentially lower personnel costs), switch
density (higher switch density indicates more complex systems that lead to increased
costs), track network complexity (measured in track-km/route-km) and station density.
All of these are cost drivers that may have a direct impact on the cost efficiency of a
railroad. Figure 11 highlights these cost drivers for several European infrastructure
managers.
The indicators in Figure 11 measure infrastructure complexity. When viewed
independently, a higher level of infrastructure complexity increases costs. For example, it
is logical to assume that a system with high switch density will have higher maintenance
costs. .When coupled with high utilization of track infrastructure, as is the case in some
nations, the possibility exists to cover these higher infrastructure costs through higher
track access charge revenues as a result of higher traffic (e.g., also possibly due to
electric vehicles that have a better acceleration characteristics).

Arne Beck, Heiner Bente, Martin Schilling — Discussion Paper 2013-12 — © OECD/ITF 2013    21
RAILWAY EFFICIENCY – AN OVERVIEW AND A LOOK AT OPPORTUNITIES FOR IMPROVEMENT

        Figure 11: Western European Infrastructure Network Characteristics

Source: civity Management Consultants benchmarking analysis
Note: Switch density data for IM F was not available.
IM = Infrastructure Manager

4.3.4 Further look at railway efficiency in other major markets

To get a broader view of potential reasons for railway inefficiency, it is necessary to
complement the analysis in Section 4.2, which has its main focus on Europe, through a
further look in other ITF member countries. The OECD and civity determined that a
closer look at a major (additional) developed market, the United States (one of the most
important freight rail markets in the world), would be helpful for understanding efficiency
drivers. Moreover, in comparison, two of the major emerging markets (China and India)
are also included in our analysis to offer further information on railway efficiency from a
different perspective.

4.3.5 Railway efficiency in a major developed market: the case of the United States
The United States is different from China, India and most European nations in that
government involvement is minimal in both regulation and ownership of rail. However, it
should be noted that the primary intercity passenger operator, Amtrak, was created by
Congress in 1970 to handle intercity passenger services and is subsidized by Washington.
No privately owned and operated intercity services exist at this time in the U.S., although
some of the new high-speed lines currently being considered may be operated by private
firms (see Tampa Bay Online). The major party responsible for investment, maintenance
and capacity enhancement of long-distance rail infrastructure is the Class I freight
railroads. These freight railroads account for approximately 69 percent of U.S. freight
mileage, 90 percent of employees and 94 percent of revenue (see American Association

22                  Arne Beck, Heiner Bente, Martin Schilling — Discussion Paper 2013-12 — © OECD/ITF 2013
RAILWAY EFFICIENCY – AN OVERVIEW AND A LOOK AT OPPORTUNITIES FOR IMPROVEMENT
of Railroads, July 2012). They also operate their own rolling stock on these tracks. They
are also vertically integrated private companies. Class I freight railroads are large,
transcontinental railroads that carry the bulk of the nation’s freight, connecting major
ports on the coasts with inland hubs, particularly Chicago. Class II-III railroads (those
with lower operating revenues) usually operate shorter routes, and often act as ‘feeder’
trains for large Class I railroads for further cross-country shipment. These smaller
railroads sometimes own the tracks they use, but often operate on tracks owned by Class
I railroads.
Major Class I railroads maintain their own tracks and make system expansions where
necessary. However, on projects where a major public benefit is also possible,
local/state/Federal governments work with the Class I railroads and may share funding of
the improvements. One example is the CREATE Project in Chicago, where public and
private stakeholders are working together to improve the efficiency of rail in the greater
Chicago area. This project will lead to the construction of over two dozen new
overpasses, freight rail track upgrades, grade-crossing safety enhancements and many
other improvements to improve the safety and timeliness of passenger and freight traffic
in the Chicago region (see CREATE).5
Class I Freight Railroads, primarily because of their ability to operate freely to maximize
revenues and profits, generate profit margins for their owners/investors. As highlighted
earlier, freight rates for customers in the U.S. are also one of the lowest in the world.
These railroads are able to optimize operations by running very long trains (sometimes
stretching to more than 5 km in length), which create economies of scale, necessary to
survive in the highly competitive North American long-distance transport market.
Woodrooffe, in a study analyzing efficiency growth in the North American freight rail
market, attributed strong efficiency gains for Class I railroads to improved management
and system consolidation approaches, improved utilization of labor and resources for
lower density operations, and improved technology (such as more efficient locomotives,
improved switching efficiency, and improved information technology to improve
operations planning) for many facets of the freight rail business (see Woodrooffe).
Amtrak’s cost efficiency is not as positive as that of the freight railroads. The national
intercity and commuter carrier competes less successfully with the automobile and
airplane, and brought in revenues of $2.71 billion in 2011 to support total costs of $3.96
billion (see Amtrak). Amtrak’s “farebox recovery,” i.e. the portion of operating costs
directly covered by ticket revenue, was 79% in fiscal year 2011, compared with 76% in
fiscal year 2010. The portion of operating costs covered by total revenue was 85% in
both fiscal years. This is similar to what is seen in European countries, as shown in
Figure 7 above. Amtrak relies on Federal funding for operating, capital and debt service
costs not covered by revenues (see Amtrak). Amtrak does own track, but pays the
freight railroads “track usage fees … (that cover) the associated incremental cost (rather
than a negotiated market cost) associated with accommodating intercity passenger
services over their tracks (see U.S. Department of Transportation).” In turn, Amtrak
leases its tracks to other commuter railroads for fees.
5
The federal U.S. transportation ministry (the U.S. Department of Transportation) and
local governments are partners in funding major improvements to the network in and
around Chicago. Government representatives and the major private railroads work
together to prioritize and plan improvements that benefit throughput and improve the
quality of life around Chicago.
Arne Beck, Heiner Bente, Martin Schilling — Discussion Paper 2013-12 — © OECD/ITF 2013 23You can also read