CHARGING INDIA'S TWO- AND THREE-WHEELER TRANSPORT - A Guide for Planning Charging Infrastructure for Two- and Three-Wheeler Fleets in Indian ...
←
→
Page content transcription
If your browser does not render page correctly, please read the page content below
An initiative supported by

       CHARGING INDIA’S
    TWO- AND THREE-WHEELER
          TRANSPORT
                A Guide for Planning Charging
          Infrastructure for Two- and Three-Wheeler
                     Fleets in Indian Cities

           Shyamasis Das, Chandana Sasidharan, Anirudh Ray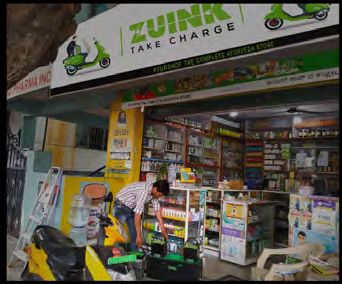
September 2020

CHARGING INDIA’S TWO- AND THREE-WHEELER TRANSPORT - A Guide for
Planning Charging Infrastructure for Two- and Three-Wheeler Fleets in Indian Cities

Suggested citation:
Das, S., Sasidharan, C., Ray, A. (2020). Charging India’s Two- and Three-Wheeler
Transport. New Delhi: Alliance for an Energy Efficient Economy.

About Alliance for an Energy Efficient Economy:
Alliance for an Energy Efficient Economy (AEEE) is a policy advocacy and energy
efficiency market enabler with a not-for-profit motive.

About Shakti Sustainable Energy Foundation:
Shakti Sustainable Energy Foundation seeks to facilitate India’s transition to a
sustainable energy future by aiding the design and implementation of policies in the
following areas: clean power, energy efficiency, sustainable urban transport, climate
change mitigation, and clean energy finance.

Contact:
Shyamasis Das
Principal Research Associate – Power Utility & Electric Mobility
Alliance for an Energy Efficient Economy (AEEE)
New Delhi
E: shyamasis@aeee.in

Acknowledgement:
The authors would like to express their sincere gratitude to Shikha Rokadiya and
Anup Bandivadekar (both from the International Council on Clean Transportation)
and Shilpi Samantray and Aishwarya Raman (both from Ola Mobility Institute) for
their critical feedback on the report.

Disclaimer:
The views/ analysis expressed in this report/ document do not necessarily reflect
the views of Shakti Sustainable Energy Foundation. Furthermore, the Foundation
does not guarantee the accuracy of any data included in this publication or accept
any responsibility for the consequences of its use.

This report is based on the best available information in the public domain. Every
attempt has been made to ensure correctness of data. However, AEEE does
not guarantee the accuracy of any data or accept any responsibility for the
consequences of use of such data.

Copyright:
© 2020, Alliance for an Energy Efficient Economy (AEEE)

*For private circulation only.
CHARGING INDIA’S
TWO- AND THREE-WHEELER
      TRANSPORT
        A Guide for Planning Charging
  Infrastructure for Two- and Three-Wheeler
             Fleets in Indian Cities

  Shyamasis Das, Chandana Sasidharan, Anirudh Ray

                                                    3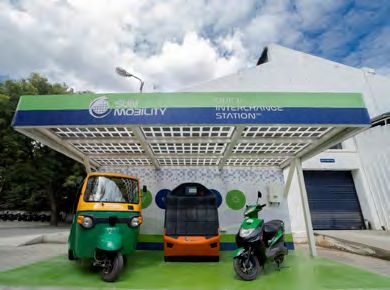
4
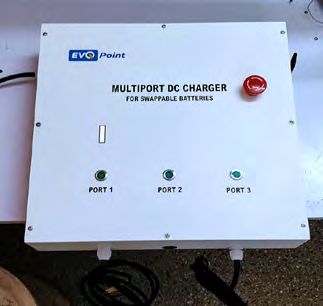
Table of Contents

1.    Introduction                                                                  5
      1.1   Context                                                                 6
      1.2 Recent market developments                                                8
      1.3 Motivation for the study                                                  9
2.    Objective, scope, and approach                                               11
3.    Electric two-wheeler and three-wheeler segments in India                     13
      3.1 Electric two-wheeler segments                                            14
      3.2 Electric three-wheeler segments                                          16
4.    The e-2W and e-3W market in India                                            19
      4.1 Electric two-wheelers                                                    20
      4.2 Electric three-wheelers                                                  23
5.    Electric e-2W and e-3W charging methods                                      27
      5.1 Plug-in charging: battery charging inside EVs                            28
      5.2 Battery swapping: battery charging outside EVs                           32
6.    Salient approaches to e-2W and e-3W charging tested by market players        35
      6.1 Network charging stations for e-2Ws                                      36
      6.2 Kirana store battery swapping solution for e-2Ws                         37
      6.3 Battery swapping facility for e-2W passenger fleet                       38
      6.4 Charging for e-2W and e-3W logistics operations                          39
      6.5 e-3W logistics fleet operation with captive plug-in charging             40
      6.6 e-3W logistics fleet operation with battery swapping                     41
      6.7 Open infrastructure for battery swapping for e-3W .passenger transport   41
      6.8 Fast charging and battery swapping for passenger transport               42
      6.9 Charging for e-rickshaw passenger transport                              44
      6.10 Swapping facilities for e-rickshaw passenger fleet                      44
      6.11 Summary of the case studies                                             46
7.    Different types of e-2W and e-3W charging facilities                         47
      7.1   e-2W passenger fleet charging facilities                               48
      7.2 e-2W logistics fleet charging facilities                                 48
      7.3 e-3W passenger fleet charging facilities                                 49
      7.4 Types of e-2W and e-3W public charging facilities                        50
8.    Stakeholder feedback on charging options                                     53
      8.1 Fleet preferences: Plug-in charging vs. battery swapping                 54
      8.2 e-2W fleet preferences                                                   55
      8.3 e-3W fleet preferences                                                   55
9.    Multi-criteria assessment of public charging facilities                      57
10. Final thoughts                                                                 63
11.   References                                                                   65

                                                                                        1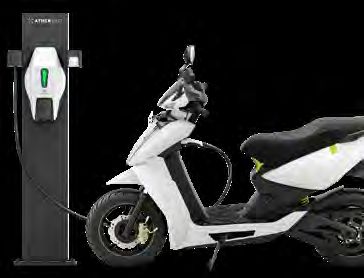
List of Figures
Figure 1: Share of different vehicle categories for all registered vehicles in India (1951-2013) 6
Figure 2: Three-wheeler production statistics from 2001-2017 7
Figure 3: Share of funds (` crores) allocated for demand incentives for different EV
segments under FAME scheme 8
Figure 4: Comparison of electric two-wheeler and electric four-wheeler sales 8
Figure 5: e-2W commercial fleet segments 14
Figure 6: Three-wheeler commercial fleet segments 16
Figure 7: Box plot of battery sizes (kWh) in e-2W models with lithium-ion batteries 21
Figure 8: Battery voltage in e-2W models 22
Figure 9: Battery configuration in e-2W models with lithium-ion batteries 22
Figure 10: On-board charger availability in e-2W models 23
Figure 11: Box plot of passenger transport e-3W battery capacity 24
Figure 12: Box plot of goods transport e-3W battery capacity 25
Figure 13: e-3W battery configuration 25
Figure 14: e-3W battery voltage 26
Figure 15: On-board charger availability in e-3W models 26
Figure 16: e-2W and e-3W charging methods 28
Figure 17: AC vs. DC charging 29
Figure 18: Energy density of FAME-II approved e-2W and e-3W models 32
Figure 19: Individual battery charger for swappable batteries 33
Figure 20: Ather Grid charging point 36
Figure 21: Kirana store battery swapping facility 37
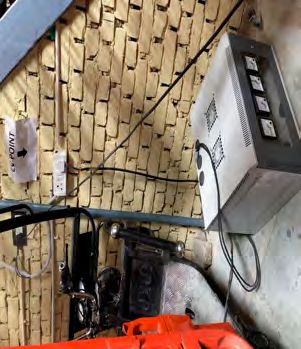
Figure 22: eFleet Logix e-3W charger 40
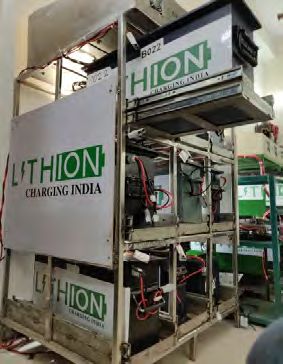
Figure 23: Lithion Power e-3W battery swapping infrastructure 42
Figure 24: SUN Mobility battery swapping facility 43
Figure 25: Bulk battery charger used by Ola Electric in Nagpur 45
Figure 26: Portable battery charger used by Ola Electric in Nagpur 45
Figure 27: Scale used in stakeholder survey 54
Figure 28: Fleet preferences for EV charging and battery swapping 54
Figure 29: Summary of e-2W fleet preferences 55
Figure 30: Summary of e-3W fleet preferences 55
Figure 31: Vehicle downtime scores of charging facilities 58
Figure 32: Space rental cost scores of charging facilities 59
Figure 33: Infrastructure cost scores of charging facilities 59
Figure 34: Electricity cost scores of charging facilities 60
Figure 35: Scores of charging facilities on ease of getting electricity connection 60
Figure 36: Scalability scores of charging facilities 61
Figure 37: Summary of scores of different types of public charging facilities 61
2List of Tables
Table 1: Domestic automobile sales trends 6
Table 2: Technical specifications and cost estimate for portable chargers 29
Table 3: Technical parameters of fixed chargers 30
Table 4: Technical specifications and cost estimates for Bharat chargers 30
Table 5: Technical specifications for stack and individual battery chargers 33
Table 6: Summary of the case studies 46
Table 7: Reference sheet for individual EV charging and battery swapping facilities 50
Table 8: Reference sheet for multiple EV charging and stack battery swapping facilities 52
Table 9: Comparative assessment parameters and significance of the scale 58
34
1. Introduction

                  5
1.1 Context
M otorised road transport in India has two distinct characteristics, as
exhibited in the population’s preferences in the choice of vehicles for
transport (NITI Aayog & World Energy Council, 2018). The first notable
feature is the dominance of two-wheelers (Department of Heavy Industries,
2012). Two-wheelers, constituting the largest share of vehicles in India, are
the preferred mode of personal transport in both rural and urban areas. This
a fact confirmed by the registration statistics (Figure 1) on road transport
vehicles in India from 1951-2013 (MoRTH, 2016). Tracing the domestic
auto sales trend from 2013 (Table 1), it is clear that two-wheelers continue
to maintain their dominance in the vehicular mix (SIAM, 2019). A modelling
exercise by the International Council on Clean Transportation (ICCT)
estimated that two-wheelers were responsible for 60% of annual vehicular
fossil fuel consumption from 2016 to 2019 (Anup & Yang, 2020). Two-
wheelers are also the source of 20% of carbon dioxide (CO2) emissions and
30% of particulate emissions in India (IEA, 2020).
80%
70%
60%
50%
40%
30%
20%
10%
0%
1951 1961 1971 1981 1991 2001 2011
Two-wheelers Others Cars, Jeeps, and Taxis Buses Goods Vehicles
FIGURE 1: SHARE OF DIFFERENT VEHICLE CATEGORIES FOR ALL REGISTERED VEHICLES IN INDIA (1951-2013)
Note:
– Others include auto rickshaws and tractors
– Auto rickshaws were included in the two-wheeler category in 1959-1969. For the remaining years, auto-
rickshaws are included in the Others category, along with tractors, trailers, and other miscellaneous vehicles.
Source: Ministry of Road Transport & Highways (MoRTH, 2016)
TABLE 1: DOMESTIC AUTOMOBILE SALES TRENDS
Domestic Sales
2013-14 2014-15 2015-16 2016-17 2017-18 2018-19
(in thousands)
Two-wheelers 14,807 15,976 16,456 17,590 20,200 21,181
Three-wheelers 480 533 538 512 636 701
Other passenger 3,136 3,216 3,475 3,762 4,145 4,385
and commercial
vehicles
Grand Total 18,423 19,724 20,469 21,863 24,981 26,268
Source: Society of Indian Automobile Manufacturers (SIAM, 2019)
6The second noteworthy feature is the presence of three-wheelers, which serve
as commercial vehicles for passenger and goods transport (Jhunjhunwala,
Kaur, & Mutagekar, 2018). Three-wheelers cater to the mobility needs of
those not using private transport and not being served by the existing mass
transit system (iTrans, 2009). Three-wheelers are also popular for goods
transport for short distances (International Council on Clean Transportation,
2019). Though there are data-related challenges in estimating the historical
penetration of three-wheelers1, the recent sales figures (Table 1) show that
the share of these vehicles is increasing. Within the three-wheeler segment,
the share of passenger vehicles is higher than that of goods vehicles, as
shown in Figure 2 (MoSPI, 2018).
9.0
8.0
7.0
Production in lakhs
6.0
Passenger Carriers Goods Carriers
5.0
4.0
3.0
2.0
1.0
0.0
2001-02
2002-03
2003-04
2004-05
2005-06
2006-07
2007-08
2008-09
2009-10
2010-11
2011-12
2012-13
2013-14
2014-15
2015-16
2016-17
FIGURE 2: THREE-WHEELER PRODUCTION STATISTICS FROM 2001-2017
Source: Ministry of Statistics and Programme Implementation (MoSPI, 2018)
Electrification of two- and three-wheelers is recognised as a low hanging
fruit for clean mobility in India, based on the market readiness, cost-
competitiveness, ease of charging, and emission reduction potential (NITI
Aayog & Rocky Mountain Institute, 2017). It has been estimated that,
together, two-wheelers and three-wheelers constitute 83%2 of all vehicles
in India (NITI Aayog & World Energy Council, 2018). Considering the electric
vehicle (EV) penetration potential in these segments, the second edition of
the Faster Adoption and Manufacturing of (Hybrid and) Electric Vehicles
(FAME) scheme includes significant budgetary allocation for demand
incentives for electric two-wheelers (e-2Ws) and electric three-wheelers
(e-3Ws), as illustrated in Figure 3 (National Automative Board, 2018)
(Department of Heavy Industry, 2020). Incidentally, 99% of all EVs sold in
India are e-2Ws and e-3Ws (Wadhwa, 2019).
1 The data on three-wheeler registration is not available. Auto-rickshaws were included in the two-wheeler category
for 1959-1969. For the remaining years, auto-rickshaws are included in the Others category, along with tractors, trail-
ers, and other miscellaneous vehicles that are not classified separately (MoRTH, 2016).
2 Of all the vehicles on Indian roads, 79% are two-wheelers and 4% are three-wheelers (passenger and goods), based
on sales data.
7The EV sales trend (Figure 4) in the past couple of years shows that the pace
of e-2W adoption is much higher than that of electric four-wheelers (e-4Ws),
even after accounting for the fact that annual two-wheeler sales have been
almost 6-7 times those of four-wheelers in recent years3. Though the
corresponding sales figures for e-3Ws are not documented, the estimated
sales of e-rickshaws were around 90,000 units in fiscal year (FY) 19-20
(SMEV, 2020). The growing adoption
of e-2Ws and e-3Ws is expected to
continue with the right policy elements
2000
focusing on the upfront cost reduction.
For example, NITI Aayog mooted a
proposal to ban sales of internal
3545
combustion engine (ICE) powered
two-wheelers and three-wheelers
starting from 2025 and 2023,
respectively (Ministry of Road 2500
Transport & Highways, 2019). 525
According to NITI Aayog estimates,
80% EV sales penetration is achievable e-2W e-3W e-4W e-bus
in the two-wheeler and three-wheeler
segments by 2030. At this level of FIGURE 3: SHARE OF FUNDS (` CRORES) ALLO-
penetration, e-2Ws and e-3Ws could CATED FOR DEMAND INCENTIVES FOR DIFFERENT
potentially lead to a total reduction of EV SEGMENTS UNDER FAME SCHEME
507.2 million tons of CO2 over the Source: National Automotive Board (National
vehicles’ lifetime (NITI Aayog & Rocky Automative Board, 2018)
Mountain Institute, 2019).
FY 18-19
FY 19-20
0 20 40 60 80 100 120 140 160
Thousands of vehicles sold
e-4W e-2W
FIGURE 4: COMPARISON OF ELECTRIC TWO-WHEELER AND ELECTRIC FOUR-WHEELER SALES
Source: Society of Manufacturers of Electric Vehicles (SMEV, 2020)
1.2 Recent market developments
The e-2W and e-3W segments provide market opportunities in three areas:
vehicle manufacturing, mobility services, and charging services. Not surprisingly,
e-2W and e-3W manufacturing has generated a lot of interest among
the existing local vehicle manufacturers, as well as new entrepreneurs. The
erstwhile ICE two- and three-wheeler manufacturers, such as TVS Motors,
Hero Motorcorp, Mahindra Electric, Hero Electric, and Bajaj Auto, have already
introduced or are at an advanced stage of introducing EV models (TVS Motors,
3 In FY 19-20, a total of 174 lakh two-wheelers and 6.3 lakh three-wheelers were sold domestically (SIAM, 2020).
82019) (Hero Electric, 2019) (Bajaj, 2019) (M, 2019). However, most of the new
e-2Ws on the market are from a range of new players, such as Ather Energy,
Okinawa, Tork, Revolt, and Pure EV (Ather Energy, 2019) (Okinawa, 2019)
(Tork Motors, 2019) (Revolt, 2019) (Pure EV, 2019). Fleet operators are also
venturing into EV manufacturing. DOT and Ola Electric are fleet operators that
are manufacturing/planning to manufacture their own e-2Ws for logistics and
passenger transport, respectively (ET Tech, 2020) (DOT, 2020). In the case of
e-3Ws, there are manufacturers like Kinetic Green focusing on e-rickshaws and
e-autos for passenger transport, and others solely focused on goods carriers,
such as Savy Electric and Gayam Motor Works (Kinetic Green, 2019) (Savy
Electric, 2019) (Gayam , 2019).
Commercial adoption of these vehicles for passenger and goods transport
has been found to be cost-competitive. Pilot programmes indicated that
e-2Ws and e-3Ws have reasonably low total costs of ownership when used
in commercial fleet operations (Arora & Raman, 2019). While some fleet
operators—e.g. DOT, eBikeGo, SmartE, and eFleet Logix—offer transport
services with fully electric fleets (Kashyaap, 2019; Chengappa, 2019; ET
Auto, 2019), many others, such as Bounce, Vogo, Ola Electric, Amazon,
Bigbasket, Flipkart, and GATI, are making efforts to increase the share of
e-2Ws and e-3Ws in their fleets (PTI, 2019; D’Cunha, 2018; Russell, 2019)
(EVreporter, 2020).
1.3 Motivation for the study
e-2Ws and e-3Ws are going to play a central role in achieving “shared,
connected, and electric” mobility in India. To support the rapid pace of
commercial adoption of e-2Ws and e-3Ws, availability of widespread
charging infrastructure will be a crucial factor. The need of the hour is to carry
out research on innovative and practicable “made-in-India” and “made-for-
India” solutions. This study endeavours to help answer the following questions:
• What are the different segments of two-wheeler and three-wheeler
commercial fleets, from the perspective of assessing the charging
requirements of electric variants?
• What are the possible ways to charge e-2W and e-3W batteries, and how
are they currently being charged? Are there any standards for e-2W and
e-3W charging?
• What are the important design aspects of e-2Ws and e-3Ws that impact
their charging?
• What are the infrastructural requirements for setting up a charging or
swapping facility?
• Is battery swapping a practical alternative to normal e-2W and e-3W
charging?
• Going forward, what kind of public charging infrastructure will be required
for commercial light electric vehicles in Indian cities?
910
2.	Objective, scope,
    and approach

                    11
T
his study aims to facilitate the establishment of ubiquitous charging
facilities for commercial e-2W and e-3W fleets in Indian cities. To this
end, this research has two main objectives:
1. To map the charging practices associated with commercial e-2W and
e-3W fleets
2. To provide useful guidance for the establishment of e-2W and e-3W
charging facilities
The study acknowledges that the planning of charging facilities for e-2Ws
and e-3Ws requires an examination of the nuances of the Indian EV
ecosystem. There is a need to understand how various players involved in
e-2W and e-3W commercial operations, such as the vehicle manufacturers,
fleet operators, and charging service providers, are managing the charging
requirements.
THE INVESTIGATION THUS COMPRISES THE FOLLOWING MAJOR STEPS:
Understanding the different segments of commercial e-2W and e-3W
fleets, based on a review of current mobility patterns in Indian cities
Undertaking a market assessment of current e-2W and e-3W models to
understand charging-related aspects
Carrying out an assessment of the charging methods for e-2Ws and e-3Ws
in India
Examining the salient approaches considered by market players for
charging e-2W and e-3W fleets, based on case studies
Identifying the possible kinds of public charging facilities for e-2Ws and
e-3Ws and undertaking a multi-criteria assessment of these options
Carrying out a survey with key stakeholders to understand their
preferences regarding charging infrastructure
The outcome of this exercise should be considered in the context of the
Indian e-2W and e-3W market and is based on an assessment of the current
charging practices observed.
123. Electric 2-wheeler
and 3-wheeler
segments in India
133.1 Electric two-wheeler segments
The operation of a typical commercial e-2W fleet varies significantly based on
the purpose of mobility, trip attraction or generation models, service/ business
catchment area, etc. Based on careful scrutiny of different kinds of operations,
these fleets can be broadly divided into two categories, based on the type of
load they carry, i.e. passengers or goods. Each of these two broad segments is
further categorised, as shown in Figure 5.
2-wheeler
commercial fleet
Passenger fleet Goods fleet
Feeder transport Food and grocery
Bike taxi fleet Bike rental fleet Courier fleet
fleet delivery fleet
FIGURE 5: E-2W COMMERCIAL FLEET SEGMENTS
A. Passenger segment: The operation of this segment entails transportation
of passengers from one point to another. This segment can be further
classified into two categories:
1. Bike taxi fleet: This ride-hailing fleet caters to the mobility demand
of the public in an urban area. This service is mostly available through
apps. The fleets operate in two patterns, as explained below:
f Single node operation: Here, the starting point for a bike
(motorcycle) is fixed and is also the point to which it will return after
completing one or more trip(s) (Vacano, 2017). Usually, people in
need of bike taxi services hail a ride using a mobile application. The
app connects the passenger with a nearby two-wheeler in the fleet.
The bike picks up the passenger, completes the trip, and then waits
for subsequent trips. In the absence of further trips, the bike may
also return to its starting point.
f Double node-buffer zone operation: In this case, a bike’s movement
generally centres around two nodes: the starting point (bike’s initial
location) and ultimate destination (often the resting place, as pre-set
by the bike driver). An individual who wishes to avail of the bike service
also follows similar two-node movement (Riejos, 2019). The bike and
the rider get connected based on the preference of the driver and
requirement of the rider. For example, a driver may wish to go from
point A to point D, and a rider may want to travel from point B to point
C. If the trip from B to C falls within a reasonable buffer zone of the
trip from A to D, the driver first moves from point A to point B to pick
up the rider and then drops the rider at point C. After completing the
trip, the driver continues to point D. Similarly, requests for pick-up and
drop-off that are on the way from A
to D and do not require significant In the Indian context, bike
taxi services are provided by
detours are assigned to the bike
mobility service providers such
(Schiller & Kenworthy, 2017). There as Ola Bike, UberMOTO, and
could be cases where the driver does Rapido in Tier-I cities such as
not set a preferred destination, and, Delhi, Bengaluru, and Mumbai
and Tier-II cities such as Surat,
hence, connection with the
Pune, and Jaipur.
prospective rider becomes simpler.
142. Bike rental fleet: Passengers prefer to
rent bikes to leverage higher flexibility The bike rental segment in
in terms of travel distances and times. India includes private entities
like Bounce, Drivezy, and
Bike rentals, on the supply side, entail Vogo. A majority of the bike
agencies or vendors providing bikes to rental start-ups are located in
the users. These agencies operate Bengaluru but operate across
from rental stations where the bikes multiple cities.
are housed. The users form the
demand side in the rental equation. Users can either pick up (and drop
off) the bike at a rental station or ask for it to be delivered to them at
a specific location in the city. It should be noted that the travel
patterns of these bikes can vary from user to user, based on the travel
demand. Therefore, these bikes are quite similar to privately-owned
two-wheelers, due to their flexible user-determined usage.
3. Feeder transport fleet: This fleet serves public transit operations in
urban areas. In order to facilitate last-mile and first-mile connectivity
for public transport routes, feeder transport fleets are deployed at
different transit nodes/ stations, based on the travel demand/ footfall.
In India, Yulu, Ola Pedal, Zoomcar PEDL, Letscycle, Mobycy, Ofo, and Mobike
are some feeder transport platforms that rely on motorised or non-motorised
two-wheelers to enable first-mile or last-mile connectivity to transit services.
B. Goods segment: The operation of this segment entails the transportation
of goods from one point to another. This segment can be further divided
into the following three categories:
1. Courier fleet: These fleets are used to transport goods from one
point to another in a city. Here, the demand for transport is largely
generated through transactions on e-commerce platforms. The goods
are generally non-perishable items.
The operation is based on a hub-
Various goods delivery service
and-spoke model (Lun, Lai, & Cheng, providers currently offer their
2010), wherein the goods are stored services in India, including
at different levels of warehousing Delhivery, Ecom Express,
hubs (and nodal delivery centres) and GoJavas, and GetGo Logistics.
They rely on hub-and-spoke
transported along different levels4 of models for end-to-end delivery
“spokes” (roads), such as highways and of goods.
arterial roads or collector and local
roads.
2. Grocery and food delivery fleet5: e-2W fleets that are used for
delivering groceries, perishables, household items, and pre-cooked
food in an area fall under this category. It should be noted that
grocery delivery fleets operate between local businesses & local
households (or third-party vendors) and typically cover an area
as large as 15 - 20 neighbourhoods6, whereas food delivery fleets
shuttle between local consumers (offices/ households/ etc.) and
4 The different levels of roads present in urban centres in India are arterial, sub-arterial, collector, and local roads. In
some cities, state or national highways pass through the urban areas.
5 Grocery and food delivery fleets do not explicitly follow a hub-and-spoke model, as the origin and destination points
of each trip/ shift/ delivery vary.
6 Neighbourhoods are defined as socio-spatial residential entities with a population of 10,000 residents (Delhi Development
Authority, 2007). The communities that these residents live in may be gated or not gated, with varying densities. A definite
shape and size (in terms of radius or side length) cannot be predicted, due to variations in density and topography.
15local businesses (restaurants, delivery
A fleet operated by
joints, etc.), to cover about 10 - 15
Grofers, BigBasket,
neighbourhoods. In case a delivery location Zopnow, or Nature’s
falls beyond the catchment area of one Basket will resemble a
fleet and its associated businesses, another grocery delivery fleet, as
fleet from the same mobility service explained above. Zomato,
Swiggy, and Domino’s are
provider serves that location, along with examples of operators of
the relevant local businesses. For a food food delivery fleets.
delivery fleet, the delivery time is generally
in the range of 20-60 minutes.
3.2 Electric three-wheeler segments
In Indian cities, three-wheeler fleets are used for different purposes, and
their operating parameters, such as travel pattern, load type, etc, vary.
Consequently, the charging requirements of these fleets may also differ.
Figure 6 shows the different types of three-wheeler commercial fleets.
3-wheeler
commercial fleet
Passenger fleet Goods fleet
Feeder transport Grocery delivery
Paratransit fleet Courier fleet
fleet fleet
FIGURE 6: THREE-WHEELER COMMERCIAL FLEET SEGMENTS
A. Passenger segment: This segment involves three-wheeler-based
transportation of passengers from one point to another.
1. Paratransit fleet: This category caters to the intermediate mobility
demand of the public in an urban area. The services of this fleet can
be hailed on the street or via a mobile application. It operates in the
following three ways:
f Single node operation: In this case, the starting point (node) for a
three-wheeler is fixed and is also the point to which it will return
after making one or more trip(s) (Rodrigue, Comtois, & Slack,
2013). The operation is such that a driver returns to a set point,
which may be a three-wheeler stand. The travel demand usually
extends beyond the local area and is intra-city in nature.
The auto rickshaws hailed from auto rickshaw stands and halt-and-go
points in Indian cities fall into the above sub-category. E-rickshaws are
rarely used in such a mode of operation, due to their slower speeds and
lower driving ranges.
f Double node-buffer zone operation: Here, a three-wheeler’s
movement generally revolves around two nodes, i.e. its starting
point (the initial location) and ultimate destination (often the last
resting place (in a day), pre-set by the driver). An individual who
wishes to avail of the three-wheeler’s service also follows similar
16two-node movement (Riejos,
2019). The three-wheeler and the In India, such three-wheeler-
rider get connected, usually via based services are provided by
service providers like Ola Auto,
underlying app-based routing UberAuto, and Jugnoo. Here
algorithms, based on the overlap also, e-rickshaws have a very
between the rider’s route and the limited use case, compared to
vehicle’s routes/ nodes. This mode traditional auto rickshaws, due
to their slower speeds and lower
of operation may also be driving ranges.
dependent on roadside ride-
hailing by passengers, in which
case mobile applications are not
involved.
f Fixed route operation: In this case,
the three-wheeler plies on a fixed This mode of operation is
prevalent in the Indian cities of
route between two or more points,
Amritsar, Bhubaneswar, Ranchi,
and passengers availing its and Kochi, where bus- and metro-
services board and deboard along based public transport options
the designated route. The have to compete with three-
wheelers. The three-wheelers are
terminals of the fixed routes
mostly auto rickshaws, rather
usually operate as three-wheeler than e-rickshaws.
stands. This mode of transport is
highly popular in cities lacking
bus- and metro-based public transport options and cities where
three-wheelers offer greater convenience for commuters.
2. Feeder transport fleet: This fleet serves public transit operations in
urban areas. In order to facilitate last-mile and first-mile connectivity
for public transport routes, feeder transport fleets are deployed
at different transit nodes/ stations, based on the travel demand/
footfalls.
Mobility service providers like SmartE in Delhi augment first-and last-mile
connectivity to Delhi’s metro stations, by ferrying passengers to and from
various points in areas surrounding a metro station. The vehicles do not
necessarily operate along fixed routes. In this mode of operation, e-rickshaws
are frequently used.
B. Goods segment: For this segment, the operations entail the transportation
of goods from one point to another.
1. Courier fleet: This fleet supports courier delivery services in a city. The
delivery may result from an e-commerce transaction, intra-city cargo
transport, or traditional mail coming from outside the city. The
operation is based on a hub-and-spoke model (Lun, Lai, & Cheng,
2010), wherein the goods are stored
at different levels of warehousing Companies like Euler Logistics
hubs (and nodal delivery centres) and and GATI rely on three-wheelers
transported along different levels of for intra-city goods deliveries in
“spokes” (roads), such as highways India.
and arterial roads or collector and
local roads.
2. Grocery delivery fleet: Three-wheeler fleets that are used to deliver
groceries, perishables, and related household items in an area fall into
this category. Grocery delivery fleets transport goods between local
businesses & local households (or third-party vendors) and typically
17cover an area as large as 15 - 20
neighbourhoods. In case a delivery A fleet operated by Grofers,
BigBasket, Zopnow, or Nature’s
location falls beyond the catchment Basket is a grocery delivery
area of one fleet and its associated fleet, as explained above. These
businesses, another fleet of the players operate in Indian cities.
same service provider covers that
location, along with the relevant
local businesses. The delivery usually happens in pre-fixed time slots,
as per the convenience of the consumers.
184. The e-2W and
e-3W market in
India
19I
n this study, a market assessment was undertaken as the first step of
investigation to understand the e-2W and e-3W market in India. India’s
e-2W and e-3W market is typically characterised according to two types
of battery chemistries – lithium-ion and lead acid. For commercial operation,
lithium-ion battery packs are more suitable, as their charging time and cycle
life are higher than those of lead acid battery packs7. As the prices of lithium-
ion battery packs are decreasing rapidly, more and more lithium-ion based
EVs are entering the market. Moreover, the policy support in India is targeted
towards lithium-ion batteries. Only EVs with advanced batteries such as
lithium-ion ones are eligible to receive the demand incentives under FAME
II8 (Ministry of Heavy Industries and Public Enterprises, 2019). This report
consequently focuses on e-2Ws and e-3Ws with lithium-ion batteries.
The e-2W and e-3W market is dominated by small original equipment
manufacturers (OEMs), fleet operators, and charging service providers. It
should be noted that often the defined role of each of these players is fuzzy,
i.e. a manufacturer may also operate a commercial fleet or run a plug-in
charging or battery swapping service.
4.1 Electric two-wheelers
As of 25th June 2020, there are approximately 72 e-2W models9 with lithium-
ion batteries, manufactured by 23 different automakers in the Indian market.
The e-2Ws used in commercial operations are mostly electric variants of
scooters. e-2Ws are typically classified based on their average speed, i.e. low-
speed or high-speed.
• Low-speed10: Low-speed e-2Ws, which do not require registration,
represent 90% of the total market share of e-2Ws in FY 2020 (SMEV,
2020). Two-wheeled battery-operated EVs, including pedal assisted
vehicles, with a maximum speed of 25 kilometres per hour (kmph) and
motor power of less than 250 watts (W), are not defined as motor vehicles
(MoRTH, 2014).
• High-speed: As per the Central Motor Vehicle Rules (CMVR), high-
speed e-2Ws are broadly classified into the same groups as their ICE
counterparts (National Informatics centre, 2020) (Vahan, 2020), which
are:
f L1: Motorcycle with maximum speed not exceeding 45 kmph and motor
power not exceeding 0.5 kilowatts (kW) if fitted with an electric motor
f L2: Motorcycle that does not meet the criteria for Category L1
e-2Ws for logistics
The study found that there are limited e-2W models that are custom built for
logistics operations11 (Kashyaap, 2019). There is no common template among
manufacturers for reporting e-2W specifications, especially with respect to
7 Typically, the charging time and cycle life of lithium-ion batteries are better than those of lead acid batteries by a factor
of two (Keshan, Thornburg, & Utsun, 2016).
8 Phase-I of the FAME scheme provided subsidies to EVs with both lead acid and advanced batteries (Anup & Yang,
2020).
9 Source: AEEE internal analysis. Out of these models, only 19 e-2W models with lithium-ion batteries are eligible for
demand incentives under FAME II (Department of Heavy Industry, 2020).
10 The low-speed vehicles do not qualify for demand incentives under the FAME II scheme (Ministry of Heavy Industries
and Public Enterprises, 2019).
11 DOT manufactures a goods carrier model that is used for their fleet operations, and other manufacturers like Hero
Electric and Jitendra New EV Ventures have showcased models capable of retrofits for logistics operations.
20the battery and charging. The battery capacity is reported for all available
models in their corresponding websites, but for analysis of other battery-
charging related aspects, the report takes into account 15 e-2W models
based on stakeholder consultation and the availability of information in the
public domain. The major findings are summarised in the following section.
Battery capacity
The charging requirement depends on the battery capacity. Figure 7 maps
the battery sizes for e-2Ws currently on the market. Most e-2W models have
battery capacities between 1.2 and 2.2 kilowatt-hours (kWh).
Emflux 9.7
Super Eco 6.0
Ultraviolette 4.2
3.3
2.2
1.344
1.2
0.3
FIGURE 7: BOX PLOT OF BATTERY SIZES (KWH) IN E-2W MODELS WITH LITHIUM-ION BATTERIES
Battery voltage
Battery voltage is important, as it determines the charging voltage for the
battery. The study of e-2W batteries found that the battery voltage varies
between 48 volts (V) (lower limit) and 72 V (upper limit). This is an important
observation, since the current guidelines specify 48 V as the output voltage
for e-2Ws and e-3Ws (Ministry of Power, 2019). The reason for adoption of
48 V as the standard voltage is linked to previous EV designs with lead acid
batteries12. It was easier to retrofit models that had 48 V lead acid battery
packs with corresponding lithium-ion battery packs. But as new EV models
are emerging with lithium-Ion battery packs, it is important to consider the
reality that there will be e-2Ws with higher voltage battery packs on the
market. High voltage battery packs are more energy-efficient, as the higher
the voltage, the lower the current and corresponding thermal losses. A
sampling study of 15 EV models on the market showed that there are vehicle
models with 60 V and 72 V battery packs (Figure 8). There is therefore a
need to develop standards and deploy charging facilities suitable for e-2Ws
with battery voltages above 48 V.
12 Lead acid battery banks are manufactured in packs of 12 V, and the 48 V pack (4 x12 V) was common in EVs.
21New dra
Tec V
E
DOT
Jiten
h
al
He ctri
El
nw
ro c
e
Tu
72V
Ba re
tt:R pe
E Am
48V
60V
Pure Battery
Energy voltage Bounce
Pu
olt En re
Rev erg
le
y
Ava ot
ilab
N
Ok
r
he
in
aw
At
Energ
x
s
Orxa
a
Emflu
Motor
ies
FIGURE 8: BATTERY VOLTAGE IN E-2W MODELS
Battery configuration
The batteries in these vehicles are either fixed or detachable. Figure 9 shows
the prevalence of fixed and detachable batteries across OEMs. The choice of
charging technologies or methods depends primarily on battery configuration.
For instance, if the battery is detachable, battery swapping appears to be a
preferred charging option, according to feedback from stakeholders. Hence,
for the purpose of studying charging technologies, classification should
be based on whether the vehicles have fixed batteries or not. In the case
of e-2Ws with fixed batteries, plug-in charging is the only possible way of
charging the vehicle, whereas both plug-in charging and battery swapping are
possible for e-2Ws with detachable batteries.
lette
Ather
Ultravio
Te ew
Em otor
EV r a N
M
ch
flu s
x
nd
Jie
Ok
ina al
Fix
wa nw
Tu
de
Revolt Batt:RE
Battery
configuration
o Am
adig per
Dab e
able
ach
xa es Det Bo
Or rgi un
ce
e
En
Pu
Hero Electric
re E
T
DO
ner
gy
FIGURE 9: BATTERY CONFIGURATION IN E-2W MODELS WITH LITHIUM-ION BATTERIES
22Another interesting observation is that on-board chargers13 are not a
common technology for e-2W charging in India. Survey results reveal that
there are very few vehicles with on-board chargers, as shown in Figure 10.
Many manufacturers provide portable chargers, which perform the same
function as that of on-board chargers.
EV Te ew
Ultrav
ch
ra N
iolette
Jiend
al
At
nw
h
er
Tu
Em
Mo flux tt:R
E
tor Ba
Ye
s
s
Okinawa re
Ampe
On-board
chargers
lt Bou
Revo nce
No
o Pu
ig re
d Ene
ba rgy
Da
He
ro
s
rgie
Ene a
Ele
Orx
DOT
ctr
FIGURE 10: ON-BOARD CHARGER AVAILABILITY IN E-2W MODELS ic
4.2 Electric three-wheelers
Electric three-wheelers aid in passenger and goods transport. In comparison
with e-2Ws, the penetration of lithium-ion batteries is relatively low in the
e-3W segment. Nevertheless, there is an increasing trend of retrofitting
e-3Ws with lithium-ion batteries. The change in battery electrochemistry has
reduced the charging time and improved earnings (Arora & Raman, 2019).
There are currently more than 30 e-3W models with lithium-ion batteries14
on the market. Based on publicly available data and extensive stakeholder
consultation, the study has identified several important aspects of the e-3W
sector, which are summarised below.
e-3W classification
The e-3W models for commercial use can be e-rickshaws or e-autos suitable
for passenger or logistics transport. As of 25th June 2020, there were roughly
35 e-3W models with lithium-ion batteries, of which 75% were e-rickshaw
models. Only 20 e-3W models are eligible for demand incentives under FAME
II (Department of Heavy Industry, 2020). These e-3Ws are classified into the
following categories, as per the CMVR:
• E-rickshaw: An e-rickshaw is a special-purpose battery-powered vehicle
with power not exceeding 4 kW, having three wheels for carrying either
goods or passengers (Ministry of Road Transport and Highways, 2015)
(Shandilya, Saini, & Ghorpade, 2019). These vehicles are not mandated by
law to be equipped with regenerative braking systems (Ministry of Heavy
Industries and Public Enterprises, 2019).
13 On-board chargers are chargers that are mounted onto the vehicles themselves.
14 Source: AEEE internal analysis
23• E-cart: E-rickshaws for goods transport are called e-carts (Vahan,
2020).
• E-auto: A three-wheeled motor vehicle with maximum speed exceeding 25
kmph and motor power exceeding 0.25 kW, if fitted with an electric motor,
is an e-auto (ARAI, 2018). E-autos for passenger transport are classified
as L5M.
• E-cargo: E-cargo vehicles are e-autos for goods transport. They are
classified as L5N (Vahan, 2020).
Battery capacity
A mapping of battery capacities for goods and passenger e-3Ws is presented
in Figure 11. It is interesting to note that the battery capacity is not the same
for passenger and goods vehicles. In the case of e-3Ws, battery capacity is
determined by the vehicle application.
• The e-rickshaws used in passenger transport have battery capacities
between 2.8 kWh and 6.6 kWh. E-autos have a higher battery capacity,
3.8-7.4 kWh. The average difference in capacity between them is around 2
kWh (refer to Figure 11).
• The goods carrier e-carts have battery capacities between 4.2 kWh and
5.2 kWh. E-cargo goods carriers have batteries between 4.8 and 7 kWh.
The average capacity difference between them is about 1.5 kWh (refer to
Figure 12).
8
7.4
7
6.6 6.6
6
Battery Capacity in kWh
5.4
5
4.7 4.6
4
3.7 3.8
3
2.8
2
1
e-rickshaw e-auto
FIGURE 11: BOX PLOT OF PASSENGER TRANSPORT E-3W BATTERY CAPACITY
2411
10.5
10
9
8.3
8
Battery Capacity in kWh
7
6.8
6 6.2
5.2
5 5.0
4.8
4.3
4 4.1
3
e-cart e-cargo
2
FIGURE 12: BOX PLOT OF GOODS TRANSPORT E-3W BATTERY CAPACITY
Other highlights
As observed in the case of e-2Ws, other than battery capacity, the
specifications of batteries used in e-3Ws are not commonly reported
by manufacturers. Hence, these details have been captured based on
stakeholder consultation and publicly available information. On many fronts,
the market characteristics of the e-3W segment are similar to those of the
e-2W segment, as highlighted below:
• Similar to e-2Ws, e-3Ws also have fixed or detachable batteries (refer to
Figure 13).
ga
eF gix
i
Seik
Ome
Lo
lee
t
e
n
nc
hio
Lit wer
ige
Po
n
ch
Ffili
Te
xxeedd
Battery
configuration
SmartE SmartE
ble
ha
tac
De
Sa ctri
El
vë c
T
e
DO
Gayam
Motor
Works
FIGURE 13: E-3W BATTERY CONFIGURATION
25• The voltage of the battery packs is between 48 V and 60 V (see
Figure 14).
igence
DOT
Techn
Ka ture
El avë
Ve
c
tri
lin s
n
S
ec
ga
Sa i
eik
EV hara ga
S
OL
S me
60
O
V
a
TVS indr
Moto
rs Mah tric
Elec
Battery
voltage 48 V Lithion
Saarthi Power
t
No ble
a ila
y
tor l av Kin
e
Vic trica Gre tic
c en
Ele
Ga
M yam
cle c
hi tri
W oto
Ve Elec
or r
ks
YC
eFle ix
or s
Best Way
Agencies
M ot e
Log
Nib
et
FIGURE 14: E-3W BATTERY VOLTAGE
• On-board chargers are not commonly used (refer to Figure 15).
Gayam
Motor
Works
Pow ion
er
h
Lit
DO
T
Ye
s
EV
Motors SmartE
On-board
chargers
Te
ch
vë ls
No
nige
Sa rica n
ct ce
Ele
eFleet
Logix
FIGURE 15: ON-BOARD CHARGER AVAILABILITY IN E-3W MODELS
265. e-2W and e-3W
charging methods
27E
-2Ws and e-3Ws are distinct in design from the other classes of EVs
in both their powertrain and battery related aspects. There are hardly
any international standards governing the design of e-2Ws and e-3Ws.
Hence, there is no standardisation of charging practices worldwide for these
vehicles. The regional charging standards15 in prominent EV markets such
as the US, Europe, and China are mostly associated with e-4W charging.
In contrast, India has two standards16 for EV charging that are applicable
to low voltage e-4Ws, e-3Ws, and e-2Ws. The Indian market presents an
opportunity to develop effective home-grown charging solutions for e-2Ws
and e-3Ws. Hence, it is useful to understand how these light EVs are currently
being charged in India.
As highlighted above, e-2Ws and e-3Ws have fixed or detachable batteries,
which can be charged inside or outside the EV. Both fixed and detachable
batteries can be charged inside EVs with fixed or portable chargers. This
method of EV charging through a plug-in connection17 is called plug-in or
conductive charging. If the vehicle has an on-board charger, it can be plugged
into the nearest power outlet to charge the battery. An alternative for vehicles
without on-board chargers is to use off-board fixed or portable chargers.
If the battery is detachable, there is an additional option for charging, namely,
battery swapping. Battery swapping entails removing the depleted battery
from the EV, replacing it with a spare recharged battery, and recharging
the depleted battery outside the EV with a battery charger. The battery
recharging can be done individually using a portable charger or in a pack
using a fixed stack battery charger. The e-2W and e-3W charging methods
are presented in Figure 16.
Plug-in Charging Battery Swapping
(Fixed or Detachable Battery)* (Detachable Battery)#
Portable Individual Battery Stack Battery
Fixed EVSE
EVSE Charging Charging
FIGURE 16: E-2W AND E-3W CHARGING METHODS
* Charging inside EV #
Charging outside EV
5.1 Plug-in charging: battery charging inside EVs
The selection of charging options for e-2Ws and e-3Ws depends on the
following four key considerations:
• On-board vs. portable charger: Typically, EVs have on-board chargers
that can be plugged into any suitable outlet for charging. Quite frequently,
e-2Ws and e-3Ws do not have on-board chargers. As an alternative,
portable chargers provided by the manufacturers can serve the same
purpose.
• Alternating current (AC) vs. direct current (DC) charging: Plug-in EV
charging is further classified as AC or DC charging (Figure 17). AC
charging entails charging EVs using on-board or portable chargers
plugged into AC power sockets. In the e-2W and e-3W categories,
portable chargers are more prevalent than on-board chargers. The other
15 For details on the regional standards, please refer to An overview of EVSE classification practices worldwide.
16 For more details, refer to Bharat AC 001 and Bharat DC 001.
17 Alternatively, it is also possible to charge batteries inside EVs wirelessly through induction. However, there are current-
ly no reported use cases for this technology in the e-2W and e-3W segments. Hence, inductive charging technology is
not considered here.
28method of charging uses off-board fixed DC chargers. DC charging
is gaining momentum in this segment, as it enables faster charging in
comparison with AC charging. However, the DC charging rate depends on
the thermal management capability and ambient temperature conditions.
Alternating Direct Current (DC)
Current (AC)
DC rapid
On-board charging
charger station
Battery
FIGURE 17: AC VS. DC RAPID CHARGING
• Battery thermal management: e-2Ws and e-3Ws generally do not have
active cooling mechanisms or heating, ventilation, and air conditioning
(HVAC) systems. Charging the batteries produce heat, and the charging
rate of these batteries is often limited by the thermal management
capability. This is particularly important given the tropical climatic
conditions in India. There are only a few vehicles18 that can be charged to
up to 80% of their battery capacity in under an hour.
• Battery voltage: Chargers are designed to cater to the required battery
voltage. 48 V batteries need chargers that can provide 48 V output, and,
similarly, 72 V batteries require chargers that can provide 72 V output.
Charging a low voltage battery with a high voltage charger could damage
the battery.
Portable chargers for e-2Ws and e-3Ws
Fleet operators commonly use portable chargers for e-2W and e-3W
batteries. These chargers typically have AC input and DC output. The output
power of these chargers varies depending on the EV battery capacity. In this
category, two types of chargers are available -- programmable and non-
programmable. The programmable chargers19 have advanced charging control
and protection functions. The non-programmable chargers are relatively
simple and inexpensive. The use cases for programmable chargers are mostly
for e-3Ws with bigger batteries, rather than e-2Ws. The typical power
capacity and costs associated with these chargers are given in Table 2.
TABLE 2: TECHNICAL SPECIFICATIONS AND COST ESTIMATE FOR PORTABLE CHARGERS
Non-programmable
Specification Programmable charger
charger
Input/ Output AC/DC AC/DC
Input Voltage (V) 230/415 230/415
Output Voltage Range (V) 40 – 72 40 – 72
Maximum Output Current (A) 30 50
Output Power Range (kW) 1–2 1 – 3.3
Cost of Charging Equipment (₹) 3,000 – 10,000 25,000 – 50,000
18 EV Motors and Emflux Motors manufactured vehicles are capable of getting fully charged within 36 minutes.
19 These chargers enable different modes of charging, such as Constant Current (CC) and Constant Voltage (CV), based on
the state of charge of the battery.
29Fixed off-board chargers
Fixed off-board chargers for e-2Ws and e-3Ws are quite common in the
market. The applicability of this type of charger depends on the EV design.
These chargers are generally wall-mounted chargers. The rated output power
and other technical parameters are different for e-2Ws and e-3Ws. The
connectors used for such chargers are sometimes different, because some
manufacturers only allow the use of proprietary connectors. The technical
specifications for these chargers are presented in Table 3. Cost estimates for
such chargers are not available in the public domain.
TABLE 3: TECHNICAL PARAMETERS OF FIXED CHARGERS
Specification e-2W charger20 e-3W charger21
Input/ Output AC/AC or AC/DC AC/DC
Input Voltage (V) 230 230 / 415
Output Voltage Range (V) 48 – 72 42 – 58
Maximum Output Current (A) 6022 187
Output Power Range (kW) 1 - 2.5 6-9
Indian standards for e-2Ws and e-3Ws
In 2017, a committee was constituted by the Department of Heavy Industries
to develop Bharat standards for public EV charging. These standards –
Bharat AC 001 and Bharat DC 001 – are for plug-in or conductive charging
via AC and DC power, respectively. Both standards are applicable to e-2W
and e-3W charging (DHI, 2017).
Bharat AC 001
Bharat AC 001 (BAC) is a special type of AC charging point that requires a
three-phase input but has a single-phase output, which is suitable for e-2Ws
and e-3Ws. AC charging entails plugging in the EV to an AC power outlet.
With a 10 kW input power supply, Bharat AC 001 can charge three EVs at
the same time at an output power of 3.3 kW. The technical specifications
and cost estimates for this charger are presented in Table 4 (DHI, 2017).
The BAC charger is a wall-mounted charger with three industrial plug output
connectors. The ancillary equipment needed to install this charger includes a
suitably rated electrical cable and circuit breaker.
TABLE 4: TECHNICAL SPECIFICATIONS AND COST ESTIMATES FOR BHARAT CHARGERS
Specification Bharat AC 001 Bharat DC 001
Input/Output AC/AC AC/DC
Input Voltage (V) 415 415
Output Voltage (V) 230 48 - 72
Maximum Output Current (A) 16 200
Output Power Range (kW) 3.3 3.3 /10/15
23
Cost of Charging Equipment (₹) 40,000 - 50,000 1,80,000 - 2,60,000
20 Specifications of Ather home and grid chargers
21 Specifications for Exicom make Ultima chargers
22 Estimated for 48 V, 2.5 kW charger for 1C rate
23 Applicable for e-2Ws
30Specification Bharat AC 001 Bharat DC 001
Cost of Ancillary Infrastructure (₹) 1,800 - 2,500 2,800 - 3,500
Total Cost of Charging Equipment (₹) 41,800 - 52,500 2,02,800 - 2,63,500
It is important to remember that the maximum charging rate is more
restricted by the charger’s power capacity than the power output that can be
provided by the socket in this EV segment. For example, e-2W chargers are
typically ~1 kW, and the charging rate will therefore correspond to 1 kW, even
if the charger is plugged into a 3.3 kW power outlet.
Bharat DC 001
Bharat DC 001 is a special category of electric vehicle supply equipment
(EVSE) that is specifically designed for India. This charger is designed with
two output power levels suitable for charging the existing EV models24 in
India. One of the standard outputs is 3.3 kW and meets the requirements
of e-2Ws and e-3Ws25. These chargers are wall-mounted and have a high
current output at a low voltage. The ancillary equipment needed for these
chargers is similar to Bharat AC 001 chargers, but the costs are higher due
to higher capacity. The technical specifications, along with the cost of the
charger and ancillary equipment, are given in Table 4.
Upcoming charging standards for small EVs
Recognising the delay in development of international standards26 for
small electric vehicles, the Department of Science and Technology (DST)
is spearheading a campaign to formalise Indian standards in FY 2020.
These standards are intended to aid in the development of cost-effective
charging infrastructure, without compromising on the communication27
and safety aspects. The main idea is to ensure the installation of charging
points with low-cost connectors suitable for e-2Ws and e-3Ws. Many of the
vehicle manufactures, including TVS Motors and Bajaj Auto, are piloting the
connectors under the ‘Normal Charging Standard Initiative’28. The maximum
charging power under this standard will be 22 kW, in accordance with the
electricity infrastructure in India (DST-PSAO, 2020) (DST, 2020).
Recognising the significant opportunity to focus on AC charging and
considering factors unique to India, such as use condition, infrastructure,
affordability, and environment, there is a rapid push to develop the standards
to uniquely cater to Indian customers. The focus is on developing a safe and
economical AC power supply point for public deployment that will enable easy
charging of e-2Ws and e-3Ws. These ‘Low Power AC Charging Points’ are
designed with a power level of 3.3 kW. These chargers will have basic over
voltage, overcurrent, short circuit, surge, and ground fault protection (DST-
PSAO, 2020) (DST, 2020).
24 There are e-4Ws in India with battery voltage ≤72V. However, typically, the e-4W battery voltages are well above 150 V
in established EV markets.
25 These types of chargers are currently not used for e-2Ws and e-3Ws, primarily because connectors have not been
developed for these chargers.
26 International standards are expected in FY 2022.
27 These chargers are expected to follow the existing Combined Charging System (CCS) or CHArgedeMOve (ChadeMO)
protocols for DC charging.
28 Initiative to develop charging standards for Light Electric Vehicles, i.e. e-2Ws and e-3Ws. These may include AC or DC
charging points.
315.2 Battery swapping: battery charging
outside EVs
Battery swapping entails the swapping of depleted vehicle batteries with
fully charged batteries. Battery swapping is a charging method that can be
effectively applied for e-2Ws and e-3Ws, as many of the e-2W and e-3W
models already have detachable, lightweight batteries. The battery swapping
system consists of the battery charging system and battery swapping
mechanism. In the case of e-2W and e-3W battery swapping systems, the
swapping can be done manually, which enables less complex and more cost-
effective swapping operations than in the case of e-4Ws or e-buses.
The weight of the battery pack is an important factor when it comes to
swapping operations. This weight depends on the battery capacity and
energy density of the battery pack. Battery pack energy density is not a
parameter that is commonly reported by manufacturers in their product
brochures. The specific battery energy densities of FAME-II approved e-2W
and e-3W models (Department of Heavy Industry, 2020) are plotted in
Figure 18. The plot shows that energy densities of 200 Wh/kilogramme (kg)
and 125 Wh/kg are good representative indicators of the FAME-II approved
e-2W and e-3W models, respectively. The FAME guidelines have set a density
of 70 Wh/kg as the minimum threshold for eligibility for demand incentives
(Department of Heavy Industry, 2020).
300
250
Battery deensity in Wh/kg
200
150
100
50
0
e-2W e-3W
FIGURE 18: ENERGY DENSITY OF FAME-II APPROVED E-2W AND E-3W MODELS
With higher energy density and lower battery capacity, the e-2W battery
packs are typically lighter than the e-3W battery packs. A typical 2 kWh
e-2W battery weighs anywhere between 8.8 and 11.4 kg29. The lower the
battery weight, the easier it is to manually lift it. It is also possible to split a
battery into two smaller battery packs of 1 kWh each; this improves the ease
of battery lifting and handling.
In the case of e-3Ws, the battery size is around 3 kWh for passenger
e-rickshaws and 5 kWh for goods carriers. The associated weights of
these batteries are 20 - 3030 kg and 33 - 5031 kg, respectively. The weight
29 Calculated with 175 Wh/kg and 225 Wh/kg as lower and upper limits, respectively.
30 Calculated with 100 Wh/kg and 150 Wh/kg as lower and upper limits, respectively.
31 Calculated with 100 Wh/kg and 150 Wh/kg as lower and upper limits, respectively.
32You can also read