A Window on the Quality of New Zealand's Health Care

Page created by Grace Barrett
 
CONTINUE READING
A Window on the Quality of New Zealand's Health Care
A Window on the
Quality of New Zealand’s
      Health Care
A Window on the Quality of New Zealand's Health Care
Acknowledgements

Seeking to prepare a report which describes a subject as vast as New Zealand’s health care system
is no easy task, and would have been impossible without the support and advice of many people.
In particular we would like to acknowledge the wise and insightful commentary that Diane Watson,
Martin Marshall, Robin Gauld, Jackie Cumming and the Health Quality & Safety Commission’s clinical
leads group gave on earlier drafts of this report.

                            © Health Quality & Safety Commission 2015
          Prepared for publication in July 2015 by the Health Quality & Safety Commission,
                          PO Box 25496, Wellington 6146, New Zealand.
                                 ISBN 978-0-908345-06-9 (print)
                                ISBN 978-0-908345-07-6 (online)
                       This document is available online at www.hqsc.govt.nz
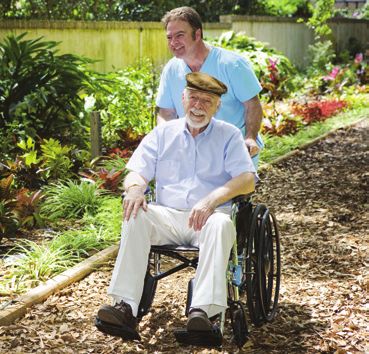
A Window on the Quality of New Zealand's Health Care
Contents

Executive summary                                                                    7
    Purpose of this report                                                           7
    Findings                                                                         8
1   Understanding the quality of our health care system                             10
    1.1   What does a high-quality health care system look like?                    10
    1.2 Why do we measure?                                                          11
    1.3 The challenges of measurement                                               11
    1.4 Our complex health system                                                   15
    1.5 How can we judge quality?                                                   15
2 Is our health care safe?                                                          17
    2.1 Broken hip (fractured neck of femur) after a fall in hospital               18
    2.2 Health care associated infections                                           20
    2.3 Complications associated with surgery                                       28
    2.4 Polypharmacy and its avoidance                                              31
    2.5 Conclusion                                                                  33
3 Is our health care a good experience?                                             34
    3.1 International comparison                                                    35
    3.2 Conclusion                                                                  38
4 Is our health care the right kind of care?                                        39
    4.1 Ultimate outcomes of care – reducing death and disability where we can      39
    4.2 Measures of integration and effectiveness                                   44
    4.3 Doing the right thing – following good health care practice                 47
    4.4 Conclusion                                                                  48
5 Is health care fairly available to all?                                           49
    5.1 Ethnicity                                                                   49
    5.2 Socioeconomic deprivation                                                   55
    5.3 Conclusion                                                                  58
6 Is our health care good value for money?                                          59
    6.1 What is value in health care? And do we have it?                            59
    6.2 Increasing value in health care                                             61
    6.3 Opportunities for further improvement                                       65
    6.4 Value for money conclusion                                                  68

                             A Window on the Quality of New Zealand’s Health Care        1
A Window on the Quality of New Zealand's Health Care
Contents continued

    7 Conclusions                                                                             69
       7.1   What does this mean for patients and the public?                                 69
       7.2 What does this mean for individual health professionals?                           70
       7.3 What does this mean for health service leaders?                                    70
    Appendix 1: Sources                                                                       71
    Appendix 2: Why this framework? Why these measures? What is missing?                      76
    Appendix 3: Commission data and reports                                                   78

2                                      A Window on the Quality of New Zealand’s Health Care
A Window on the Quality of New Zealand's Health Care
Tables

Table 1:    Measures selected inside a framework, based on the level of the measures and the elements
            of quality                                                                                  12
Table 2:    In-hospital falls with fractured neck of femur per 100,000 admissions aged 15 and over,
            New Zealand and international comparators, 2013                                             20
Table 3:    CLAB rate per 1000 line days, New Zealand and international comparators                     23
Table 4:    Hand Hygiene New Zealand programme WHO Five Moments for Hand Hygiene                        24
Table 5:    Compliance with the WHO Five Moments for Hand Hygiene, New Zealand and
            international comparators                                                                   25
Table 6:    S aureus bacteraemia rate per 1000 bed-days, New Zealand and international comparators,
            2013–14                                                                                     26
Table 7:    Polypharmacy among older people, New Zealand and international comparators                  32
Table 8:    Average inpatient rating out of 10 for the four domains of experience, New Zealand,
            August and November 2014                                                                    34
Table 9:    Highest- and lowest-scoring questions (percentage of responders giving the most positive
            response), November 2014                                                                    35
Table 10: Comparison of survey results (identical questions only) of the most recently published
          New Zealand and England inpatient surveys                                                     36
Table 11:   Performance against selected Elective Services Patient Flow Indicators, March 2015          37
Table 12: Occupied bed-days associated with people aged 75 and over admitted to hospital
          as an emergency two or more times, New Zealand and international comparators                  45
Table 13: Mental health patients followed up in the community within seven days of discharge,
          New Zealand and international comparators, 2012–13                                            46
Table 14: Childhood immunisation rates for indigenous and overall populations, New Zealand
          and international comparators                                                                 50
Table 15: Equity of access, New Zealand and international comparators, 2013                             57
Table 16: Elective operations cancelled after admission, New Zealand and international comparators, 2013 64
Table 17: Potentially avoidable expenditure on hospitalisation of older people with multiple acute
          admissions, 2008–09 and 2013–14                                                               66

                           A Window on the Quality of New Zealand’s Health Care                               3
A Window on the Quality of New Zealand's Health Care
Figures

    Figure 1:   In-hospital falls leading to a fractured neck of femur (FNOF) in people aged 15 and over,
                by month, 2012–14                                                                           19
    Figure 2: Central line insertions in ICUs compliant with the insertion bundle, by month, 2012–14        21
    Figure 3: CLAB rate per 1000 line days, by month, 2012–14                                               22
    Figure 4: New Zealand overall hand hygiene compliance rate and qualifying DHBs reaching
              threshold level, by month, 2012–15                                                            24
    Figure 5: S aureus bacteraemia rate per 1000 bed-days, by month, 2012–14                                26
    Figure 6: Hip and knee operations where good practice in antibiotic prophylaxis and skin preparation
              was followed, 2013–14                                                                         27
    Figure 7: Surgical site infection for hip and knee operations, by month, 2013–14                        28
    Figure 8: Postoperative sepsis per 1000 at-risk admissions, by quarter, 2005–15                         29
    Figure 9: Postoperative sepsis per 100,000 discharges – OECD calculation, 2011                          30
    Figure 10: Postoperative DVT/PE per 1000 at-risk admissions, by quarter, 2005–15                        30
    Figure 11: Postoperative DVT/PE per 100,000 discharges – OECD calculation, 2011                         31
    Figure 12: Population dispensed multiple medications in three out of four quarters, 2011                32
    Figure 13: Population dispensed both an antipsychotic and a benzodiazepine in the same quarter, 2011    33
    Figure 14: Patients admitted, discharged or transferred from an emergency department within six hours   37
    Figure 15: Age-standardised amenable mortality rates for people aged under 75 years, by country,
               1997–98 and 2006–07 (Nolte/McKee definition)                                                 40
    Figure 16: Deaths in children and young people aged 28 days to 24 years, 2003–13                        41
    Figure 17: Perinatal related mortality per 1000 births, 2007–13                                         42
    Figure 18: Disability adjusted life years lost per 1000 population, by country, 2012                    43
    Figure 19: Occupied bed-days associated with people aged 75 and over admitted twice or more
               as an emergency per 1000 population, 2008–09 to 2013–14, national average and highest
               and lowest DHB values                                                                        44
    Figure 20: Discharges from acute inpatient units where a community mental health contact with
               client participation was recorded in the seven days immediately following that discharge,
               2009–10 to 2013–14, national average and highest and lowest DHB values                       46
    Figure 21: People with gout who received allopurinol regularly per 1000 population (quarter 2, 2011),
               national average and highest and lowest DHB values                                           47
    Figure 22: People with diabetes aged 25 and over regularly receiving insulin or metformin, 2011–13      48
    Figure 23: Immunisations at 24 months, New Zealand European and Māori, change between
               June 2009 and March 2015                                                                     50
    Figure 24: People with gout per 1000 population, by ethnicity, 2011                                     51
    Figure 25: People with gout who received allopurinol regularly per 1000 population, by ethnicity
               (quarter 2, 2011), national average and highest and lowest DHB values                        52
    Figure 26: Allopurinol and colchicine dispensing, by ethnicity, 2011                                    53
    Figure 27: New Zealand residents identified as having diabetes, by ethnicity, 2013                      54

4                                        A Window on the Quality of New Zealand’s Health Care
A Window on the Quality of New Zealand's Health Care
Figure 28: People with diabetes aged 25 and over regularly receiving insulin or metformin,
           by ethnicity, 2013                                                                          54
Figure 29: People with diabetes tested for HbA1c levels at least once a year, by ethnicity, 2013       55
Figure 30: Per capita expenditure on health care (US$), 2011                                           59
Figure 31: Expenditure on health care (source OECD) and disability adjusted life years lost per 1000
           population (source WHO), by country, 2011                                                   60
Figure 32: Cost and expected cost of CLABs in ICUs, 2012–14                                            61
Figure 33: Ventilation tube insertions, 2011–14                                                        63
Figure 34: Operations cancelled after admission, 2008–13                                               64
Figure 35: Cost and expected cost of in-hospital falls with fractured neck of femur, 2012–14           65
Figure 36: People admitted per 1000 patients with diabetes for ketoacidosis and hypoglycaemia,
           by DHB, 2013                                                                                67
Figure 37: People admitted per 10,000 patients with gout, by DHB, 2011                                 67

                           A Window on the Quality of New Zealand’s Health Care                             5
6   A Window on the Quality of New Zealand’s Health Care
Executive summary

Purpose of this report

New Zealanders expect and deserve safe health care of the highest quality. We have a complex health care
system that helps prevent and treat illness every day, and provides care to those reaching the end of their life.

This report looks at currently available measures within a framework for understanding quality and considers
‘How good is New Zealand’s health care?’ It seeks to create debate around the meaning and interpretation of
the data presented, with a view to stimulating initiatives to improve our health and disability services.

Five specific questions are explored.

   •   When our patients most need to be safe, are they?
   •   Is the experience of patients being cared for in our system good?
   •   Is care effective, with the right care providing good outcomes?
   •   Do we provide an equitable system with good health care for all, regardless of sex, ethnicity, age
       or income?
   •   Does our system provide good value for money – does it avoid waste and deliver good outcomes for
       the resources used?

The report draws on data from:

   •   the Health Quality & Safety Commission’s (the Commission’s) quality and safety indicator set (see
       Appendix 3)
   •   the Commission’s Atlas of Healthcare Variation (see Appendix 3)
   •   the Organisation for Economic Co-operation and Development’s (OECD) health care quality indicator
       data set
   •   Ministry of Health data
   •   the Commonwealth Fund’s international survey series.

Online references for this data are included in Appendix 1.

A window in time
The title of this report – A Window on the Quality of New Zealand’s Health Care – has been carefully chosen.
The report uses a framework similar to other system-wide framework approaches, such as the OECD’s health
care quality indicator data set, to provide a snapshot or ‘window’ into the quality of health care in New Zealand
at a particular point in time.

This ‘partial view’ is built using previously published, reliable, validated data. However, while the best available,
this data is not always complete or perfect. In the same way light through windowpanes changes and creates
different patterns and shades, the view through the window will change over time as new data is added and
interpretations change. Appendix 2 provides further information about why we chose the individual measures
included in the report.

New Zealand health and disability support services have started to monitor quality of care more systematically
in recent years. The quality accounts, published for the last two years by all district health boards (DHBs), are

                            A Window on the Quality of New Zealand’s Health Care                                        7
an important step in this journey. To really make quality the centre of our health services we now need a
    consistent ‘dashboard’ of comparable measures covering all aspects of quality, used by providers across
    the whole system to track their progress.

    The framework described in this report is a starting point for this. Many of the measures can easily be
    replicated locally. Monitoring, reporting and responding to these measures should drive improvement,
    transparency and accountability.

    Findings

    The evidence in this report indicates New Zealand’s health and disability system is as good as, or better than,
    the health systems in most other similar developed countries for 7 out of the 10 measures where robust
    international comparison is possible. Most of the measures are improving or maintaining their position. A high
    proportion of patients report they were treated with dignity, respect, kindness and compassion in our hospitals.
    International comparisons show our health care system provides good value for money and helps people live
    longer, healthier lives.

    Specifically:

        •    Disability adjusted life years lost1 (DALYs) per 100,000 population in New Zealand is seventh lowest
             of those OECD nations measured by the World Health Organization (WHO) – similar to Australia and
             lower than most western European countries, the US and Canada. This shows our health system is
             effective in helping people live longer, healthier lives.
        •    Early results from a new national patient experience survey for inpatients show positive results
             compared with jurisdictions such as England, Sweden and Canada. Patients generally have a good
             experience in hospital, and feel they are treated with dignity, respect, kindness and compassion.
        •    The system has addressed inequity in some targeted areas – notably immunisation, in which large
             disparities between Māori and non-Māori child vaccination rates have been almost eliminated in
             five years.
        •    Our health system is relatively inexpensive compared with similar countries – New Zealand is the
             18th highest of 34 OECD countries in per capita expenditure on health care. Less is spent than in nearly
             all comparable English-speaking and northern European countries. This, combined with results similar
             to or better than these countries for most quality measures, suggests a system which provides good
             value for money.
        •    Specific process measures2 have improved over the past three years. For example:
             – the use of insertion bundles to prevent central line associated bacteraemia (CLAB) is now routine
               in intensive care units (ICUs), and generally in other settings as well. This is comparable with the
               State of Michigan and better than most other countries
             – New Zealand’s compliance with best practice hand hygiene requirements has increased from
               62 percent in 2012 to 77 percent in 2015. This is similar to recent data for Australia and Canada.
        •    Outcomes3 are more variable:
             – The rate of CLAB infection in ICUs has fallen from 3.3 per 1000 line days in 2011 to 0.37 in 2014
               and is now very rare. New Zealand performs well internationally on this measure.

    1. Years of life lost or disabled, based on expected years of healthy life.
    2. Process measures show whether or not desired changes in practice have occurred at a local level (eg, giving older patients a falls risk assessment
       and developing a care plan for them).
    3. Outcome measures focus on harm and cost that can be avoided.

8                                                     A Window on the Quality of New Zealand’s Health Care
– Rates of Staphylococcus aureus bacteraemia (a common bacterial infection in hospitals) have not
           changed. New Zealand’s rates are slightly higher than Australia’s and lower than Scotland’s.
         – There has been an increase in postoperative sepsis in recent years. The cause is unclear and further
           work is needed to understand and address this increase. New Zealand does not compare well with
           other countries in this measure.

There are three clear areas for improvement:

    •    Inequity in access. New Zealanders report economic barriers in access to health care second only to
         the US. This data precedes recent initiatives to provide free access to general practitioners (GPs) for
         children aged under 13. However, the Atlas of Healthcare Variation provides several other examples
         of variation between ethnic groups in use of the most appropriate care.
    •    Harm to patients – as illustrated by the Commission’s annual report of serious adverse events.4
    •    Variation in patterns of care, even when taking into account the different needs of populations, or the
         wishes of individual patients.

4. Health Quality & Safety Commission. 2014. Making health and disability services safer: Serious adverse events reported to the Health Quality &
   Safety Commission 1 July 2013 to 30 June 2014. Wellington: Health Quality & Safety Commission. URL: http://www.hqsc.govt.nz/publications-
   and-resources/publication/1832 (accessed July 2015).

                                    A Window on the Quality of New Zealand’s Health Care                                                            9
1       Understanding the quality of our health care system

     1.1 What does a high-quality health care system look like?

     Our aim in producing this report is to enable evaluation of the quality and performance of our health care
     system and inform initiatives to improve the experiences and outcomes of patients across the country.

     To do this, we need to understand what a good health care system looks like, and what measures might help us
     judge our system.

     Quality in health care is not static. New Zealand already has a high-quality health care system from many
     perspectives, but as with all health care systems there is room for improvement. A major reason for measuring
     the performance of the system is to drive and track improvement over time. The New Zealand Triple Aim
     provides a focus for this improvement:

         •   improved quality, safety and experience of care for the individual
         •   improved health and equity for all populations
         •   best value for public health system resources.
                                                                               Im
                                                                           e
                                                                        car

                                                                               pro
                                                                     of

                                                                                  ved
                                                                  ce
                                                                en

                                                                                    he
                                                             eri

                                                                                     alt
                                                          exp

                                                                                        h&
                                                                                PO
                                                                   AL
                                                             &

                                                                                         eq
                                                          ty

                                                                                    PU
                                                                 DU

                                                                                           uit
                                                       afe

                                                                                              yf
                                                                                    LA
                                                            VI
                                                   y, s

                                                                                                or
                                                                                      TIO
                                                         DI

                                                                    QUALITY
                                               alit

                                                                                               all
                                              IN

                                                                                         N
                                             qu

                                                                                                 po

                                                                  IMPROVEMENT
                                                                                                     pu
                                             ved

                                                                                                     lat
                                          pro

                                                                                                      ion
                                        Im

                                                                                                          s

                                                                        SYSTEM
                                             Best value for public health system resources

     The Triple Aim balances the needs of individuals (for care responsive to their needs and preferences), the
     population (by recognising the needs of all) and the economy (by seeking an affordable and sustainable system).

     The US Institute of Medicine has defined six dimensions of quality:

         •   Safety – When the patient most needed to be safe, were they?
         •   Patient experience – How did it feel to be cared for in our system?
         •   Effectiveness – The right care providing good outcomes.
         •   Equity – Good health care for all, regardless of gender, ethnicity, age or income.
         •   Timeliness/Access – Did the system provide care quickly once a need was recognised?
         •   Efficiency – Does the system avoid waste – and thus cost – in supplies, equipment, space, capital, ideas,
             time and opportunity?

10                                          A Window on the Quality of New Zealand’s Health Care
These feed into the Triple Aim:

               INDIVIDUAL                                         POPULATION                                             SYSTEM

   SAFETY                 EXPERIENCE                            EQUITY                           EFFECTIVENESS                    EFFICIENCY

                                                                     ACCESS

These headings group various measures of the quality of our system, at a high level and in more detail.

Our various measures of harm, such as infections or injury from falls, provide information about the safety of
our health care in relation to individuals, while measures of mortality amenable to health care and many of
our measures of equity provide information about the health of the population. Our measure of potentially
avoidable expenditure on hospitalisation of older people with multiple admissions provides an insight into the
value provided by the system.

1.2 Why do we measure?

Measuring the right things well and publicising the results stimulates improvement in quality.5,6,7 Measurement
is very important in improving health care. Our health care workers want to do the best they can, but to direct
their efforts and monitor progress they need to know how well they are doing now, what to improve and
whether or not their efforts are working. Fairness and transparency are also important – the public pays for
health care and has a right to know how good it is.

1.3 The challenges of measurement

Health quality measures tend to be either very general and high level – such as mortality rates – or very
focused on the individual – such as the rate of falls in hospital causing injury. It can be hard to attribute reasons
for performance for high-level measures (for example, a high mortality rate may reflect the underlying health
of a population, access to health care, the quality of the health care once accessed or other reasons). Lower-
level measures may be unrepresentative of the wider situation – a hospital may do well on one indicator (rate
of falls, for example) and poorly on another (the rate of S aureus infections, for example). For this reason we
have chosen a selection of measurements at both levels (sometimes referred to as system level measures and
contributory measures, or more colloquially ‘big and little dots’8) to populate our framework.
This report uses only measures which are currently publicly available, have been through testing and
development somewhere in the world, and have been shown to be useful.
Table 1 shows the measures we have selected inside a framework based on the level of the measures and
the elements of quality.

5. Marshall MN, Shekelle PG, Leatherman S, et al. 2000. The public release of performance data: what do we expect to gain? A review of the
   evidence. JAMA 283(14): 1866–74.
6. Hibbard JH, Stockard J, Tusler M. 2005. Hospital performance reports: impact on quality, market share, and reputation. Health Aff (Millwood)
   24(4): 1150–60.
7. Marshall MN, Shekelle PG, Davies HT, et al. 2003. Public reporting on quality in the United States and the United Kingdom. Health Aff
   (Millwood) 22(3): 134–48.
8. Doolan-Noble F, Lynton M, Hau S, et al. 2015. How well does your health care system perform? Tracking progress toward the triple aim using system
   level measures. NZMJ 128(1415).

                                    A Window on the Quality of New Zealand’s Health Care                                                               11
The window on quality
                                                            Table 1: Measures selected inside a framework, based on the level of the measures and the elements of quality

                                                                      Safety                                                                                             Experience

                                                                      Adverse events in hospital (academic) 2002                                                         Scores out of 10 for the four domains of patient experience (QSI) 2014
                        Overall harm estimates
System measures

                                                                                                                                           Inpatient experience survey
                                                                      DALYs lost to adverse health events (MoH) 2013

                                                                      In-hospital falls with fractured neck of femur (QSM) 2014                                          Highest and lowest scoring questions in the patient experience survey
                                                                                                                                                                         (QSI) 2014

                                                                      Central line insertions using bundle (QSM) 2014
Contributory measures

                        Common individual harms and their avoidance

                                                                      CLAB (QSM) 2014

                                                                      Compliance with WHO Five Moments of Hand Hygiene (QSM) 2014

                                                                      Staphylococcus aureus bacteraemia rates (QSM) 2014

                                                                      Postoperative sepsis (QSM) 2014

                                                                      Postoperative DVT/PE (QSM) 2014

                                                                      Polypharmacy among older people (Atlas) 2011
                        Protecting prescribing risks

                                                                      Older people prescribed with an antipsychotic and a benzodiazepine
                                                                      (Atlas) 2011
Symbols
          INTERNATIONAL COMPARISON
          Green globe – best (3–5 countries), best or 2nd best (6–7 countries), top quartile (more than 7 countries); Red globe – worst (3–5 countries), worst or 2nd worst
          (6–7 countries), bottom quartile (more than 7 countries); Yellow globe – performance between green and red; Grey globe – fewer than 3 countries had data.
          DIRECTION OF TRAVEL
          Green arrow – statistically significant improvement; Yellow arrow – no statistically significant change; Red arrow – statistically significant deterioration;
          Grey arrow – insufficient data.
          VARIATION
          Green dots – variation smaller than 1.5-fold between top and bottom; Yellow dots – variation 1.5–2-fold; Red dots – variation greater than 2-fold; Grey dots – no data.

                            Effectiveness                                                    Equity                                                                                                    Efficiency

                            Age standardised amenable mortality rates                        We have taken the approach of looking at a                                                                DALYs per 100,000 population against
                            (academic) 2006                                                  range of measures by different groups rather                                                              per capita expenditure on health care

                                                                                                                                               Overall cost per capita
                                                                                             than one overarching equity measure                                                                       (OECD) 2010
Ultimate outcome
    measures

                            DALYs per 100,000 population (WHO) 2012

                            Occupied bed-days associated with people                         Childhood immunisation by ethnicity (QSI)                                                                 Estimated cost of CLAB (QSM) 2014
                            aged 75 and over who admitted to hospital as                     2013
                            an emergency two or more times (QSI) 2014
     Coordination of care

                                                                                                                                               Costs of harm
                            Community follow-up of mental health                             People with gout who received allopurinol                                                                 Estimated cost of in-hospital falls with
                            patients (QSI) 2013                                              regularly by ethnicity (Atlas) 2011                                                                       fractured neck of femur (QSM) 2014
                                                                           Ethnicity

                            People with gout who received allopurinol                        People with diabetes who received insulin or                                                              Estimated potentially avoidable expenditure
                            regularly (Atlas) 2011                                           metformin regularly (Atlas) 2013                                                                          on hospitalisation of older people with multiple
recommended medication

                                                                                                                                               Costs of uncoordinated care and unwarranted variation

                                                                                                                                                                                                       admissions (QSM) 2014
    Patients receiving

                            People with diabetes who received insulin or                     People with diabetes tested for HbA1c levels at                                                           Potentially unwarranted variation in care:
                            metformin regularly (Atlas) 2013                                 least once a year by ethnicity (Atlas) 2013                                                               grommets 2011–12 to 2013–14

                                                                                             Access to health care by income group                                                                     Potentially unwarranted variation in care:
                                                                           Economic status

                                                                                             (Commonwealth Fund) 2013                                                                                  hospital admissions for diabetes 2013; hospital
                                                                                                                                                                                                       admissions for gout 2011 (Atlas)

                                                                                                                                                                                                       Cancelled operations (QSI) 2013
Abbreviations

     CLAB = central line associated bacteraemia
     DALYs = disability adjusted life years
     DVT/PE = deep vein thrombosis/pulmonary embolism
     HbA1c = glycated haemoglobin
     WHO = World Health Organization

     Sources

     Academic – Academic study published in peer-reviewed journal
     Atlas – Health Quality & Safety Commission Atlas of Healthcare Variation
     Commonwealth Fund – Commonwealth Fund comparative study of international health systems
     MoH – Ministry of Health published report
     OECD – Organisation for Economic Co-operation and Development health statistics
     QSI – Health Quality & Safety Commission quality and safety indicator set
     QSM – Health Quality & Safety Commission quality and safety markers
     WHO – World Health Organization global burden of disease study

     Full sources are available in Appendix 1.

14                                        A Window on the Quality of New Zealand’s Health Care
1.4 Our complex health system

Every day across our 20 DHBs, 3000 patients enter New Zealand’s hospitals. Thousands more see a GP or
primary health care nurse, use diagnostic and screening services, or consult with pharmacists, physiotherapists
and other health care professionals. At such a scale (health care made up 10 percent of New Zealand’s
economy in 2011),9 experiences and outcomes vary widely.

    Box 1: The scale of New Zealand’s health sector, 2013–14

    Cost: $14.7 billion
    Employees: 250,000 (10 percent of the national workforce)
    Hospital admissions (inpatient cost-weighted discharges): 800,000
    Outpatient discharges: 250,000
    Prescriptions dispensed each year: over 50 million

1.5 How can we judge quality?

This report evaluates quality in three ways.

    •   We compare New Zealand’s health system with health systems in similar countries.
    •   We see whether New Zealand’s health system is getting better or worse over time.
    •   We look at variation in practices or outcomes between different parts of the country and between
        different groups of patients.

International comparisons
We have used international comparisons where we can, but these need cautious interpretation. Different
countries often measure the same things in slightly different ways. Differences in the way health care is
organised may make a measure useful in one country and irrelevant in another. International comparisons are
not always possible or valuable.

This report uses a comparison set for Australia, Canada, Sweden, the UK and the US. As well as having more
published comparable measures than most other countries, all except Sweden are English-speaking with many
cultural similarities to New Zealand. Not all measures can be reported for all countries. Where data is taken
from OECD or WHO international comparative data, all countries included are reported. Where confidence
intervals (CIs) (explained in Box 2) are available these are reported and the statistical inference highlighted.
In many cases these are not available, as data is not reported in a scientific format.

Change over time
Measuring change over time can show whether processes or outcomes are getting better or worse. However, we
need to distinguish genuine change from random variation, or ‘noise’ (see Box 2). There are some techniques for
this, which we refer to later.

9. OECD Data. Health resources: Health spending. 2013. URL: https://data.oecd.org/healthres/health-spending.htm (accessed July 2015).

                                  A Window on the Quality of New Zealand’s Health Care                                                  15
Change also needs to be considered in context. The fact something has improved does not necessarily mean it is
     now good. The biggest improvements may be in areas where performance was worst and improvement is easiest
     to make. The reverse is also true: if a result is already very good, further improvement may be very difficult.

        Box 2: When does a change count? Statistical process control, special and common
        cause variation

        Rates go up or down a little every time they are measured. Commentators may portray these apparent
        changes as evidence of improvement or deterioration when in fact they may just be a reflection of
        random variation. There are well-established statistical methods that identify which changes are
        meaningful. In this document we use one of these – statistical process control – to differentiate
        sustained, meaningful changes (or special cause variation) from this random ‘noise’, also known as
        common cause variation.

        The simplest form of this analysis is known as a run chart. By plotting data for each time period
        (normally in this case a month) against the median value for the whole period we can identify trends in
        data. In particular we note ‘shifts’ in data when there are six or more consecutive points above or below
        the median line. This identifies a statistically significant sustained change in performance. Once a shift
        is observed the median line can be moved to reflect the post-shift median. Figure 1, which looks at the
        rate of in-hospital falls over time, shows a run chart where no statistically significant sustained change
        in performance is shown.

        A control chart is a more sophisticated version of a run chart. It sets the average (mean) level and shows
        control limits (set 3 sigma away from the mean) to show when a process is literally ‘out of control’. Points
        outside of the control limits are described as outliers – that is, they have a difference from the average so
        great that this cannot be ascribed to chance alone. There are also rules concerning shifts; in this case eight
        points one side or other of the mean demonstrates a sustained shift up or down.

        We use 95 percent CIs to denote significant differences between population groups or countries, wherever
        these are available or calculable. These show the range where we believe a true value to lie. If two values
        (eg, the infection rate in two countries) are different and their CIs do not overlap, we can be confident the
        values are likely to be different and that this is not a result of chance. The word ‘significant’ is only used
        when this denotes a statistically significant difference.

        A full statistical appendix for this report is available at www.hqsc.govt.nz.

     Variation in New Zealand
     Understanding where and why variation in health care exists is important. Variation based on differences
     between patients is appropriate. Variation based on differences in practice between providers or institutions is
     usually inappropriate, but unfortunately this type of variation is common in health care. Variation may point to
     geographical areas or groups of people receiving poorer care than others.

     Variation may reflect a lack of evidence or consensus about what best care is for certain conditions. Typically,
     variation shows underuse, overuse or both. Underuse is obviously undesirable, but overuse is also a concern
     when resources are limited. Overuse places patients at unnecessary risk of harm from treatments that are
     not really warranted. It also uses money that could be spent on providing services to those in greater need.
     Reducing inappropriate variation in health care tends to improve quality overall. Very wide variation is usually
     a sign that improvements can be made and should stimulate discussion over best practice and how to ensure
     everyone is receiving appropriate care.

16                                         A Window on the Quality of New Zealand’s Health Care
2           Is our health care safe?
The Health Quality & Safety Commission promotes simple interventions to improve patient safety and
the quality of care, including in these four areas: falls, healthcare associated infections, surgical harm and
medication safety.

In this section we consider progress in reducing harm in these areas and ask: Why does this matter? What do
we know? Has there been any change? How do our results compare internationally?

For the most part, New Zealand delivers safe patient care. However, all health care carries some risks, and
patients are still being harmed in New Zealand, sometimes with serious and long-term consequences. The
total extent of this is unclear. In 2002, Davis and colleagues10 found that 12.9 percent of hospital admissions
were associated with an adverse event, although nearly a fifth of these occurred outside a public hospital and
most adverse events had only minor patient impact.

This is in line with reports on health care systems worldwide.11,12,13 This figure has been the basis of further work
as part of the burden of disease project and the Ministry of Health has estimated that, in 2006, 30,000 DALYs
were lost as a result of adverse health care events (see Box 3).14

     Box 3: Disability adjusted life years

     The Ministry of Health report Health Loss in New Zealand15 sets out DALYs as a measure.

     DALYs measure the gap between the population’s current state of health and that of an ideal population
     in which everyone experiences long lives free from illness or disability. This definition comprises years
     of life lost – based on expected years of life at each age compared with the lowest observed death rates
     for each age across all countries – and years lived with disability – time spent in less than full health.

This figure of 30,000 DALYs lost gives some indication of the need to improve the safety of our health care
system, but it is an estimate based on an extrapolation made from a study which had certain limitations (as all
such studies do) nearly 15 years ago. The study has not been repeated, so a more recent and relevant figure is
not available. However, the annual reports of serious adverse events show there is still room for improvement
in the safety of our hospital services, at least. We know less about the safety of primary health care or disability
services in New Zealand.

10. Davis P, Lay-Yee R, Briant R, et al. 2002. Adverse events in New Zealand public hospitals I: occurrence and impact. NZMJ 115(1167): U271.
11. Kohn T, Corrigan J, Donaldson M (eds). 2000. To Err Is Human: Building a Safer Health System. Washington: National Academy of Sciences.
    URL: http://www.nap.edu/catalog/9728/to-err-is-human-building-a-safer-health-system (accessed July 2015).
12. Wilson RM, Runciman WB, Gibberd RW, et al. 1995. The Quality in Australian Health Care Study. Med J Aust 163(9): 458–71.
13. Department of Health. 2000. An organisation with a memory. London: Department of Health.
14. Ministry of Health. 2013. Health loss in New Zealand: a report from the New Zealand Burden of Disease, Injuries and Risk Factors Study 2006–16.
    Wellington: Ministry of Health. URL: http://www.health.govt.nz/system/files/documents/publications/health-loss-in-new-zealand-final.pdf
    (accessed July 2015).
15. Ministry of Health. 2013. Health Loss in New Zealand: A report from the New Zealand Burden of Diseases, Injuries and Risk Factors Study, 2006–2016.
    Wellington: Ministry of Health. URL: http://www.health.govt.nz/publication/health-loss-new-zealand-report-new-zealand-burden-diseases-
    injuries-and-risk-factors-study-2006-2016 (accessed July 2015).

                                    A Window on the Quality of New Zealand’s Health Care                                                                  17
2.1 Broken hip (fractured neck of femur) after a fall in hospital

     Why does this matter?
     We know around half of all serious adverse events reported in New Zealand’s hospitals involve patients falling.
     Just under half of the serious falls reported result in a patient breaking his or her hip (ie, in a fractured neck of
     femur). Many patients fall and injure themselves in the community, but each week, two patients break their
     hips in New Zealand’s hospitals, where events of this type should be rare. These injuries can lead to long-term
     loss of mobility, loss of confidence and social function, and greater risk of dying within a year of the fall.16 In
     addition, each patient who falls stays an average of a month longer at hospital, at a minimum cost of around
     $30,000.

     What do we know?
     Around 100 falls with a fractured neck of femur have been recorded in New Zealand hospitals each year since
     2008–09. Expressed as a rate, this represents around 11 patients for every 100,000 hospital admissions for
     patients aged 15 and over since July 2011.

     To put this in context, more than 3000 patients in total are treated for broken hips each year – obviously, most
     occur out of hospital.

     Has there been any change?
     Since July 2012 the rate of in-hospital falls resulting in a fractured neck of femur has averaged just over 10 per
     100,000 admissions for people aged 15 and over, or just under two per week. Random variation can be seen,
     but no evidence of a systemic change.

     16. Osteoporosis New Zealand. 2012. Bone Care 2020. Wellington: Osteoporosis New Zealand.

18                                                A Window on the Quality of New Zealand’s Health Care
Figure 1: In-hospital falls leading to a fractured neck of femur (FNOF) in people aged 15 and over,
by month, 2012–14
                                                                                                                                                                                                                                         Falls with FNOF per 100,000 hospital admissions
                                                                                                                                                                                                                                         Median

                                          20

                                          18
In-hospital falls with FNOF per 100,000

                                          16
     hospital admissions aged 15+*

                                          14

                                          12

                                          10

                                           8

                                           6

                                          4

                                           2

                                          0
                                               Jul-12

                                                        Aug-12

                                                                 Sept-12

                                                                           Oct-12

                                                                                    Nov-12

                                                                                             Dec-12

                                                                                                      Jan-13

                                                                                                               Feb-13

                                                                                                                        Mar-13

                                                                                                                                 Apr-13

                                                                                                                                          May-13

                                                                                                                                                   Jun-13

                                                                                                                                                            Jul-13

                                                                                                                                                                     Aug-13

                                                                                                                                                                              Sept-13

                                                                                                                                                                                        Oct-13

                                                                                                                                                                                                 Nov-13

                                                                                                                                                                                                          Dec-13

                                                                                                                                                                                                                   Jan-14

                                                                                                                                                                                                                            Feb-14

                                                                                                                                                                                                                                     Mar-14

                                                                                                                                                                                                                                              Apr-14

                                                                                                                                                                                                                                                       May-14

                                                                                                                                                                                                                                                                Jun-14

                                                                                                                                                                                                                                                                         Jul-14

                                                                                                                                                                                                                                                                                  Aug-14

                                                                                                                                                                                                                                                                                           Sep-14

                                                                                                                                                                                                                                                                                                    Oct-14

                                                                                                                                                                                                                                                                                                             Nov-14

                                                                                                                                                                                                                                                                                                                      Dec-14
                                                                                                                                                                                Month

*The rate is directly standardised for the age, gender and admission method of patients, using 2011–12 as a reference year for these variables

International comparison
International comparisons are not straightforward as relatively few countries collect and publish this measure
systematically. The UK National Health Service (NHS) hip fracture database is the closest equivalent to a
national collection, but even this requires combination with routine administrative data. From this we can make
no conclusion about how New Zealand compares with other countries.

                                                                                             A Window on the Quality of New Zealand’s Health Care                                                                                                                                                                              19
Table 2: In-hospital falls with fractured neck of femur per 100,000 admissions aged 15 and over, New Zealand and
     international comparators, 2013

      Country                                                                   Falls per 100,000 admissions (2013)

      New Zealand                                                               11.0

      Australia                                                                 N/A

      England*                                                                  17.717,18,19

      Scotland                                                                  N/A

      United States                                                             N/A

      Canada                                                                    N/A

      Sweden                                                                    N/A

     *England and Wales

     2.2 Healthcare associated infections

     Why does this matter?
     Infections associated with health care are common worldwide. The Commission’s patient safety programmes
     have included improving hand hygiene, preventing surgical site infections (SSIs) and preventing CLAB
     (a bacterial infection of the blood) in ICUs.

     S aureus bacteraemia is the most common healthcare associated infection in New Zealand hospitals, and is
     linked to having to spend more time in hospital, disability and even death. Good hand hygiene is one way of
     reducing the risk of this infection.

     CLAB in very sick patients in ICUs has long been a problem in healthcare. It can produce severe illness, prolong
     hospital stay and may sometimes be fatal. A certain rate of CLAB has previously been considered inevitable.
     Recent evidence, however, shows that the introduction of a small and low-cost bundle of interventions can
     virtually eliminate these infections. New Zealand established a collaborative20 – Target CLAB Zero – bringing
     together all DHBs in the country to do this.

     17. Royal College of Physicians. 2014. National Hip Fracture Database Annual Report 2014. p61 – numerator. London: Royal College of Physicians.
         URL: http://www.nhfd.co.uk/20/hipfractureR.nsf/vwcontent/2014reportPDFs/$file/NHFD2014ExtendedReport.pdf?OpenElement (accessed
         July 2015).
     18. Health and Social Care Information Centre (HSCIC). 2014. Provisional Monthly Hospital Episode Statistics for Admitted Patient Care,
         Outpatients and Accident and Emergency Data – April 2013 to December 2013. Denominator England. URL: http://www.hscic.gov.uk/
         searchcatalogue?productid=14416&q=HES+online&topics=1%2fHospital+care%2fAdmissions+and+attendances&kwd=H&sort=
         Relevance&size=10&page=1#top (accessed July 2015).
     19. NHS Wales Informatics Service Information Services. nd. Patient Episode Database for Wales (PEDW) Statistics – data for the period 1st April
         2012 to 31st March 2013. NHS Hospital in-patients – All Welsh Providers – Denominator Wales. URL: http://www.infoandstats.wales.nhs.uk/
         documents/869/WA%20Providers.pdf (accessed July 2015).
     20. In a collaborative, teams of health care providers work independently to test out changes in how they deliver care that seeks to implement best
         practices and accepted standards for the collaborative’s topic area. Teams use a common set of indicators to measure the quality of the care
         processes the collaborative is trying to improve and, where possible, the desired health outcomes. The collaborative organises regular sharing
         of results among teams through learning sessions in which teams learn from each other about which changes have been successful and which
         have not. This results in a dynamic improvement strategy in which many teams working on related problem areas can learn from each other in
         a way that facilitates rapid dissemination of successful practices. In its emphasis on spread and scale-up of improvements, the improvement
         collaborative model offers a powerful new tool in the arsenal of proven quality improvement methods. See: http://www.hqsc.govt.nz/our-
         programmes/infection-prevention-and-control/projects/prevention-of-central-line-associated-bacteraemia/.

20                                                   A Window on the Quality of New Zealand’s Health Care
SSIs can cause serious illness, longer hospital stays, long-term disabilities, emotional and financial stress, and
loss of life. A significant number of SSIs are preventable through the right interventions:

                           •             timely and appropriate antibiotic prophylaxis
                           •             skin preparation
                           •             clipping, not shaving, of surgical sites.

What do we know?

Central line associated bacteraemia

The introduction of the Target CLAB Zero collaborative to prevent CLAB has been a major success. The use of
the insertion bundle is now routine (used in more than 95 percent of cases in the last six months, see Figure 2)
with the result that CLAB infection in ICUs is now a very rare event.

Since April 2012, the national CLAB rate has been 0.37 cases of CLAB per 1000 line days (see Figure 3),
compared with 3.32 in 2011. The baseline figure was collected as part of the collaborative over three months,
but is shown as just one point on the run chart.

Figure 2: Central line insertions in ICUs compliant with the insertion bundle, by month, 2012–14

                                         100

                                         90
 Compliant central line insertions (%)

                                         80

                                         70

                                         60

                                         50

                                         40

                                         30

                                         20

                                          10

                                          0
                                               Jan-12
                                                        Feb-12
                                                                 Mar-12
                                                                          Apr-12
                                                                                   May-12
                                                                                            Jun-12
                                                                                                     Jul-12
                                                                                                              Aug-12
                                                                                                                       Sept-12
                                                                                                                                 Oct-12
                                                                                                                                          Nov-12
                                                                                                                                                   Dec-12
                                                                                                                                                            Jan-13
                                                                                                                                                                     Feb-13
                                                                                                                                                                              Mar-13
                                                                                                                                                                                       Apr-13
                                                                                                                                                                                                May-13
                                                                                                                                                                                                         Jun-13
                                                                                                                                                                                                                  Jul-13
                                                                                                                                                                                                                           Aug-13
                                                                                                                                                                                                                                    Sept-13
                                                                                                                                                                                                                                              Oct-13
                                                                                                                                                                                                                                                       Nov-13
                                                                                                                                                                                                                                                                Dec-13
                                                                                                                                                                                                                                                                         Jan-14
                                                                                                                                                                                                                                                                                  Feb-14
                                                                                                                                                                                                                                                                                           Mar-14
                                                                                                                                                                                                                                                                                                    Apr-14
                                                                                                                                                                                                                                                                                                             May-14
                                                                                                                                                                                                                                                                                                                      Jun-14
                                                                                                                                                                                                                                                                                                                               Jul-14
                                                                                                                                                                                                                                                                                                                                        Aug-14
                                                                                                                                                                                                                                                                                                                                                 Sep-14
                                                                                                                                                                                                                                                                                                                                                          Oct-14

                                                                                                                                                                                                Month

                                                                                               A Window on the Quality of New Zealand’s Health Care                                                                                                                                                                                                                21
Figure 3: CLAB rate per 1000 line days, by month, 2012–14
                                                                                                                                                                                                                                                                                                                                  CLAB rate
                                                                                                                                                                                                                                                                                                                                  Median

              3.0

              2.5

              2.0

              1.5

              1.0

              0.5

             0.0
                    Jan-12
                             Feb-12
                                      Mar-12
                                               Apr-12
                                                        May-12
                                                                 Jun-12
                                                                          Jul-12
                                                                                   Aug-12
                                                                                            Sept-12
                                                                                                      Oct-12
                                                                                                               Nov-12
                                                                                                                        Dec-12
                                                                                                                                 Jan-13
                                                                                                                                          Feb-13
                                                                                                                                                   Mar-13
                                                                                                                                                            Apr-13
                                                                                                                                                                     May-13
                                                                                                                                                                              Jun-13
                                                                                                                                                                                       Jul-13
                                                                                                                                                                                                Aug-13
                                                                                                                                                                                                         Sept-13
                                                                                                                                                                                                                   Oct-13
                                                                                                                                                                                                                            Nov-13
                                                                                                                                                                                                                                     Dec-13
                                                                                                                                                                                                                                              Jan-14
                                                                                                                                                                                                                                                       Feb-14
                                                                                                                                                                                                                                                                Mar-14
                                                                                                                                                                                                                                                                         Apr-14
                                                                                                                                                                                                                                                                                  May-14
                                                                                                                                                                                                                                                                                           Jun-14
                                                                                                                                                                                                                                                                                                    Jul-14
                                                                                                                                                                                                                                                                                                             Aug-14
                                                                                                                                                                                                                                                                                                                      Sep-14
                                                                                                                                                                                                                                                                                                                               Oct-14
                                                                                                                                                                                                                                                                                                                                        Nov-14
                                                                                                                                                                                                                                                                                                                                                 Dec-14
                                                                                                                                                                              Month

     International comparisons

     Programmes to reduce cases of CLAB have not happened everywhere. CIs are inconsistently published on
     this data, limiting our ability to tell if differences are significant. New Zealand’s raw reported CLAB rate is
     nonetheless lower than those reported by most other countries, and this figure for New Zealand as a whole
     performs as well as the best sites in the US.21

     21. Institute for Healthcare Improvement (IHI). nd. Memberships: Central Line Bundle. URL: http://www.ihi.org/Engage/Memberships/
         MentorHospitalRegistry/Pages/CentralLineBundle.aspx (accessed July 2015).

22                                                                                                    A Window on the Quality of New Zealand’s Health Care
Table 3: CLAB rate per 1000 line days, New Zealand and international comparators

 Country                                                                   CLAB per 1000 line days

 New Zealand                                                               0.37 (0–0.71)

 Australia*                                                                0.3522

 England                                                                   1.48 (2010)23

 Scotland
Table 4: Hand Hygiene New Zealand programme WHO Five Moments for Hand Hygiene

                               When:
                               •             Moment 1: before patient contact
                               •             Moment 2: before a procedure

                               Why:
                               To protect the patient against harmful germs, including the patient’s own, from entering his/her body

                               When:
                               •             Moment 3: after a procedure or body fluid exposure risk
                               •             Moment 4: after patient contact
                               •             Moment 5: after contact with patient surroundings

                               Why:
                               To protect yourself and the health care environment from harmful patient germs

     There has been a gradual increase in the New Zealand average of audited ‘moments’ compliant with hand
     hygiene good practice over the last year. The programme currently has a target of 75 percent of observed
     moments to be compliant. This has been achieved in New Zealand since October 2014, with 77 percent of
     moments currently compliant, and 15 out of 20 DHBs meeting this threshold (Figure 4).

     Figure 4: New Zealand overall hand hygiene compliance rate and qualifying DHBs reaching
     threshold level, by month, 2012–15
                                                                                                                                                                                                                                                                               DHBs reaching threshold level
                                                                                                                                                                                                                                                                               % of observed moments compliant

                                             100                                                                                                                                                                                                                                                                                                               20
                                                                                                                                                                                                                                                                                                                                                                    DHBs meeting hand hygiene threshold level* (/20)
                                             90                                                                                                                                                                                                                                                                                                                18
      Compliant hand hygiene ‘moments’ (%)

                                             80                                                                                                                                                                                                                                                                                                                16

                                             70                                                                                                                                                                                                                                                                                                                14

                                             60                                                                                                                                                                                                                                                                                                                12

                                             50                                                                                                                                                                                                                                                                                                                10

                                             40                                                                                                                                                                                                                                                                                                                8

                                             30                                                                                                                                                                                                                                                                                                                6

                                             20                                                                                                                                                                                                                                                                                                                4

                                              10                                                                                                                                                                                                                                                                                                               2

                                              0                                                                                                                                                                                                                                                                                                                0
                                                   1/10/12
                                                             1/11/12
                                                                       1/12/12
                                                                                 1/01/13
                                                                                           1/02/13
                                                                                                     1/03/13
                                                                                                               1/04/13
                                                                                                                         1/05/13
                                                                                                                                   1/06/13
                                                                                                                                             1/07/13
                                                                                                                                                       1/08/13
                                                                                                                                                                 1/09/13
                                                                                                                                                                           1/10/13
                                                                                                                                                                                     1/11/13
                                                                                                                                                                                               1/12/13
                                                                                                                                                                                                         1/01/14
                                                                                                                                                                                                                   1/02/14
                                                                                                                                                                                                                             1/03/14
                                                                                                                                                                                                                                       1/04/14
                                                                                                                                                                                                                                                 1/05/14
                                                                                                                                                                                                                                                           1/06/14
                                                                                                                                                                                                                                                                     1/07/14
                                                                                                                                                                                                                                                                               1/08/14
                                                                                                                                                                                                                                                                                         1/09/14
                                                                                                                                                                                                                                                                                                   1/10/14
                                                                                                                                                                                                                                                                                                             1/11/14
                                                                                                                                                                                                                                                                                                                       1/12/14
                                                                                                                                                                                                                                                                                                                                 1/01/15
                                                                                                                                                                                                                                                                                                                                           1/02/15
                                                                                                                                                                                                                                                                                                                                                     1/03/15

                                                                                                                                                                                               Month

24                                                                                                                                    A Window on the Quality of New Zealand’s Health Care
Table 5 shows that New Zealand’s performance on this measure remains 5 percent lower than Australia’s –
a statistically significant difference. Scotland’s recorded compliance is exceptionally high.

Table 5: Compliance with the WHO Five Moments for Hand Hygiene, New Zealand and international comparators

 Country                                                                      Compliance with the WHO Five Moments for Hand Hygiene

 New Zealand (March 2015)                                                     77.4% (77.0–77.8%)27

 Australia (March 2015)                                                       82.2% (82.1–82.3%)28

 England                                                                      N/A

 Scotland (August 2013)                                                       96% (95–97%)29

 United States                                                                N/A

 Canada* (2011)                                                               72% before patient contact, 83% after patient contact30

 Sweden                                                                       N/A

*Ontario
95% CIs in parenthesis

We measure the S aureus bacteraemia rate per 1000 bed-days to track progress against infection. This rate
has remained consistent, at just over 0.12 cases of S aureus bacteraemia per 1000 bed-days, for two and a half
years, with little sign as yet of a sustained reduction (see Figure 5).

27. Health Quality and Safety Commission. 2015. Hand Hygiene New Zealand. National Hand Hygiene Performance Report 1 November 2014 to 31 March
    2015. Wellington: Health Quality & Safety Commission. URL: http://www.handhygiene.org.nz/images/stories/HHNZDOWNLOADS/National%20
    Hand%20Hygiene%20Report%2001%20November%202014%20to%2031%20March%202015%20Final.pdf (accessed July 2015).
28. Hand Hygiene Australia. 2015. National Data Period One, 2015. Heidelberg: Hand Hygiene Australia. URL: http://www.hha.org.au/
    LatestNationalData.aspx (accessed July 2015).
29. National Hand Hygiene NHS Campaign. 2013. Compliance with Hand Hygiene - Audit Report. 27th Bi-monthly Report (September 2013). Glasgow:
    Health Protection Scotland. URL: http://www.documents.hps.scot.nhs.uk/hai/infection-control/national-hand-hygiene-campaign/audit-
    report-2013-09-25.pdf (accessed July 2015).
30. Health Quality Ontario. 2012. Quality Monitor 2012: Report on Ontario’s Health System. Toronto: Health Quality Ontario. URL: http://www.hqontario.ca/
    portals/0/Documents/pr/qmonitor-full-report-2012-en.pdf (accessed July 2015). (NB: uses a slightly different measure of before and after patient
    contact rather than the full five moments.)

                                     A Window on the Quality of New Zealand’s Health Care                                                                   25
Figure 5: S aureus bacteraemia rate per 1000 bed-days, by month, 2012–14
                                                                                                                                                                                                                                      S aureus bacteraemia rate per 1000 bed-days
                                                                                                                                                                                                                                      Median

              0.25

             0.20

              0.15

              0.10

             0.05

             0.00
                     Jan-12
                              Feb-12
                                       Mar-12
                                                Apr-12
                                                         May-12
                                                                  Jun-12
                                                                           Jul-12
                                                                                    Aug-12
                                                                                             Sept-12
                                                                                                       Oct-12
                                                                                                                Nov-12
                                                                                                                         Dec-12
                                                                                                                                  Jan-13
                                                                                                                                           Feb-13
                                                                                                                                                    Mar-13
                                                                                                                                                             Apr-13
                                                                                                                                                                      May-13
                                                                                                                                                                               Jun-13
                                                                                                                                                                                        Jul-13
                                                                                                                                                                                                 Aug-13
                                                                                                                                                                                                          Sept-13
                                                                                                                                                                                                                    Oct-13
                                                                                                                                                                                                                             Nov-13
                                                                                                                                                                                                                                      Dec-13
                                                                                                                                                                                                                                               Jan-14
                                                                                                                                                                                                                                                        Feb-14
                                                                                                                                                                                                                                                                 Mar-14
                                                                                                                                                                                                                                                                          Apr-14
                                                                                                                                                                                                                                                                                   May-14
                                                                                                                                                                                                                                                                                            Jun-14
                                                                                                                                                                                                                                                                                                     Jul-14
                                                                                                                                                                                                                                                                                                              Aug-14
                                                                                                                                                                                                                                                                                                                       Sept-14
                                                                                                                                                                Month

     International comparisons

     Only a few countries consistently report rates of S aureus bacteraemia. New Zealand’s S aureus bacteraemia
     rate is significantly higher than Australia’s and lower than Scotland’s. To give a sense of the effect of this, if
     New Zealand was to achieve Australia’s reported level of S aureus bacteraemia, there would have been 71 fewer
     infections in the country in 2013–14, although had the rate been the same as Scotland’s, New Zealand would
     have had 412 more infections.

     Table 6: S aureus bacteraemia rate per 1000 bed-days, New Zealand and international comparators, 2013–14

      Country                                                                                                                                                S aureus bacteraemia rate per 1000 bed-days

      New Zealand                                                                                                                                            0.13 (0.12–0.15)

      Australia                                                                                                                                              0.1 (0.09–0.11)31

      England                                                                                                                                                N/A

      Scotland                                                                                                                                               0.31 (0.29–0.33)32

      United States                                                                                                                                          N/A

      Canada                                                                                                                                                 N/A

      Sweden                                                                                                                                                 N/A

     95% CIs calculated by the Commission using published data

     31. National Health Performance Authority. 2015. Hospital performance: Healthcare-associated Staphylococcus aureus bloodstream infections
         in 2013–14. Sydney: National Health Performance Authority. URL: http://www.myhospitals.gov.au/docs/default-source/our-report-pdfs/hp-
         if_sab_2013_14_rpt.pdf (accessed July 2015). (Calculated from benchmarked results).
     32. Health Protection Scotland. 2015. HPS Weekly Report 49(2015/02). URL: http://www.hps.scot.nhs.uk/documents/ewr/pdf2015/1502.pdf
         (accessed July 2015).

26                                                                                             A Window on the Quality of New Zealand’s Health Care
What do we know?

Surgical site infection

In 2012 the Commission launched the Surgical Site Infection Improvement Programme to reduce SSIs. Hip and
knee arthroplasty surgery was the first procedure focus – these operations are performed in high numbers and
the consequences of an SSI in an arthroplasty are serious. All 20 DHBs are collecting and reporting local data
and driving improvement against the recommended practice interventions within their DHB. Over the last 18
months there has been a significant increase in recommended antibiotic prophylaxis and skin preparation for
hip and knee patients across the country as a whole (see Figure 6). In particular there has been a widespread
increase in the dosage of the preferred antibiotic given (from 1g to 2g or greater of cefazolin). A year ago only
85 percent of operations which used cefazolin used 2g or more; now 96 percent do.

Figure 6: Hip and knee operations where good practice in antibiotic prophylaxis and skin
preparation was followed, 2013–14
                                                                                                                              Timely antibiotics*
                                                                                                                              >_ 2g cefazolin
                                                                                                                              Appropriate skin preparation

                                    100

                                    90

                                    80
  Hip and knee arthroplasties (%)

                                    70

                                    60

                                    50

                                    40

                                    30

                                    20

                                     10

                                     0
                                          Jul-13

                                                           Oct-13

                                                                              Jan-14

                                                                                                        Apr-14

                                                                                                                     Jul-14

                                                                                                                                            Oct-14

* Timely antibiotics = antibiotic given 0–60 minutes before first incision
≥2g cefazolin = two or more grams of cefazolin used as the antibiotic
Appropriate skin preparation = clorhexidine plus alcohol or povidone iodine plus alcohol used for skin preparation

                                                   A Window on the Quality of New Zealand’s Health Care                                                      27
So far, as Figure 7 shows, there has been no significant change in the rate of SSIs.

     Figure 7: Surgical site infection for hip and knee operations, by month, 2013–14
                                                                                                                                                                                                                 SSI rate per 100 operations
                                                                                                                                                                                                                 Median

                                        2.0

                                        1.8

                                        1.6
        Infections per 100 operations

                                        1.4

                                        1.2

                                        1.0

                                        0.8

                                        0.6

                                        0.4

                                        0.2

                                        0.0
                                              Mar-13

                                                       Apr-13

                                                                May-13

                                                                         Jun-13

                                                                                  Jul-13

                                                                                           Aug-13

                                                                                                    Sept-13

                                                                                                              Oct-13

                                                                                                                       Nov-13

                                                                                                                                Dec-13

                                                                                                                                         Jan-14

                                                                                                                                                  Feb-14

                                                                                                                                                           Mar-14

                                                                                                                                                                    Apr-14

                                                                                                                                                                             May-14

                                                                                                                                                                                      Jun-14

                                                                                                                                                                                               Jul-14

                                                                                                                                                                                                        Aug-14

                                                                                                                                                                                                                  Sep-14

                                                                                                                                                                                                                           Oct-14

                                                                                                                                                                                                                                    Nov-14

                                                                                                                                                                                                                                             Dec-14
                                                                                                                                          Month

     2.3 Complications associated with surgery

     Why does this matter?
     The 2002 Davis study on adverse events in hospital found almost 60 percent of those adverse events were
     associated with surgery. Such events can be traumatic for the patient and costly for the service provider.

     The Commission’s perioperative harm prevention programme focuses on preventing the adverse events which
     can harm patients undergoing surgery.33 Effective teamwork and communication are key to safe surgical care,
     and the programme has a focus on improving communication between health professionals, and between
     health professionals and patients.

     A 2008 study34 and a substantial literature show surgical harm (mortality and morbidity) could be reduced
     through consistent and reliable implementation of the WHO Surgical Safety Checklist. Here we report on two
     of these harms: postoperative sepsis and deep vein thrombosis/pulmonary embolism (DVT/PE).

     What do we know?

     Postoperative sepsis

     There has been a clear statistically significant increase in postoperative sepsis in New Zealand in recent years,
     as shown in Figure 8. The rate has risen from around 7 per 1000 at-risk admissions between 2005 and 2009
     to around 11 per 1000 in 2013, and continues to rise.

     33. Davis P, Lay-Yee R, Briant R, et al. 2003. Adverse events in New Zealand public hospitals II: preventability and clinical context. NZMJ 116(1183): U624.
     34. Haynes AB, Weiser TG, Berry WR, et al. 2009. A surgical safety checklist to reduce morbidity and mortality in a global population. N Engl J Med
         360(5): 491–9.

28                                                                                             A Window on the Quality of New Zealand’s Health Care
Figure 8: Postoperative sepsis per 1000 at-risk admissions, by quarter, 2005–14
                                                                                                                                                                                                                          Sepsis per 1000 at-risk admissions                                                                                            Upper control limit
                                                                                                                                                                                                                          Average                                                                                                                       Lower control limit

        16

        14

        12

        10

        8

        6

        4

        2

        0
             Q3 2005
                       Q4 2005
                                 Q1 2006
                                           Q2 2006
                                                     Q3 2006
                                                               Q4 2006
                                                                         Q1 2007
                                                                                   Q2 2007
                                                                                             Q3 2007
                                                                                                       Q4 2007
                                                                                                                 Q1 2008
                                                                                                                           Q2 2008
                                                                                                                                     Q3 2008
                                                                                                                                               Q4 2008
                                                                                                                                                         Q1 2009
                                                                                                                                                                   Q2 2009
                                                                                                                                                                             Q3 2009
                                                                                                                                                                                       Q4 2009
                                                                                                                                                                                                 Q1 2010
                                                                                                                                                                                                           Q2 2010
                                                                                                                                                                                                                     Q3 2010
                                                                                                                                                                                                                               Q4 2010
                                                                                                                                                                                                                                         Q1 2011
                                                                                                                                                                                                                                                   Q2 2011
                                                                                                                                                                                                                                                             Q3 2011
                                                                                                                                                                                                                                                                       Q4 2011
                                                                                                                                                                                                                                                                                 Q1 2012
                                                                                                                                                                                                                                                                                           Q2 2012
                                                                                                                                                                                                                                                                                                     Q3 2012
                                                                                                                                                                                                                                                                                                               Q4 2012
                                                                                                                                                                                                                                                                                                                         Q1 2013
                                                                                                                                                                                                                                                                                                                                   Q2 2013
                                                                                                                                                                                                                                                                                                                                             Q3 2013
                                                                                                                                                                                                                                                                                                                                                       Q4 2013
                                                                                                                                                                                                                                                                                                                                                                 Q1 2014
                                                                                                                                                                                                                                                                                                                                                                           Q2 2014
                                                                                                                                                                                                                                                                                                                                                                                     Q3 2014
                                                                                                                                                                                                                                                                                                                                                                                               Q4 2014
                                                                                                                                                                                             Quarter

The cause of this is not immediately clear, although it may reflect an increase in the proportion of patients with
more and greater risk factors undergoing surgery, in particular an increase in patients with diabetes (who are
more at risk of sepsis). Further work is required to understand and address this increase.

International comparisons

The OECD comparisons show New Zealand in the worst quartile of OECD member states. In Figure 9 our
comparator group is shown in green, New Zealand in red and the OECD average in yellow.

                                                                          A Window on the Quality of New Zealand’s Health Care                                                                                                                                                                                                                                                                           29
Figure 9: Postoperative sepsis per 100,000 discharges – OECD calculation, 2011

                                                    1800
      Postoperative sepsis per 100,000 discharges

                                                    1600

                                                                                                                                                                                                                                                                                                                                                                                                                                    1427
                                                    1400

                                                                                                                                                                                                                                                                                                                                                                                           1068
                                                    1200

                                                                                                                                                                                                                                                                                                                                                                         1052
                                                    1000

                                                                                                                                                                                                                                                                                                784
                                                                                                                                                                                                                                                         716
                                                    800

                                                                                                                                                                                615
                                                                                                                                          527

                                                    600

                                                    400

                                                    200

                                                      0
                                                               Israel

                                                                                 Switzerland

                                                                                                     Poland

                                                                                                                         Belgium

                                                                                                                                          United States

                                                                                                                                                              Italy

                                                                                                                                                                                Canada

                                                                                                                                                                                                  Finland

                                                                                                                                                                                                                      Germany

                                                                                                                                                                                                                                       Denmark

                                                                                                                                                                                                                                                         United Kingdom

                                                                                                                                                                                                                                                                              Norway

                                                                                                                                                                                                                                                                                                OECD20

                                                                                                                                                                                                                                                                                                                    Slovenia

                                                                                                                                                                                                                                                                                                                                     France

                                                                                                                                                                                                                                                                                                                                                       Spain

                                                                                                                                                                                                                                                                                                                                                                         Australia

                                                                                                                                                                                                                                                                                                                                                                                           New Zealand

                                                                                                                                                                                                                                                                                                                                                                                                                   Portugal

                                                                                                                                                                                                                                                                                                                                                                                                                                    Sweden

                                                                                                                                                                                                                                                                                                                                                                                                                                                      Ireland
                                                                                                                                                                                                                                                 Country

     DVT/PE

      In contrast to postoperative sepsis, postoperative DVT/PE has remained relatively stable over the last 10
     years, showing no special cause variation (see Figure 10).

     Figure 10: Postoperative DVT/PE per 1000 at-risk admissions, by quarter, 2005–14
                                                                                                                                                                                                                                                                             DVT/PE per 1000 at-risk admissions                                                                                                     Upper control limit
                                                                                                                                                                                                                                                                             Average                                                                                                                                Lower control limit

                                                      6

                                                       5

                                                      4

                                                       3

                                                       2

                                                       1

                                                      0
                                                           Q3 2005
                                                                     Q4 2005
                                                                               Q1 2006
                                                                                           Q2 2006
                                                                                                     Q3 2006
                                                                                                               Q4 2006
                                                                                                                          Q1 2007
                                                                                                                                    Q2 2007
                                                                                                                                               Q3 2007
                                                                                                                                                          Q4 2007
                                                                                                                                                                    Q1 2008
                                                                                                                                                                              Q2 2008
                                                                                                                                                                                        Q3 2008
                                                                                                                                                                                                  Q4 2008
                                                                                                                                                                                                            Q1 2009
                                                                                                                                                                                                                       Q2 2009
                                                                                                                                                                                                                                 Q3 2009
                                                                                                                                                                                                                                           Q4 2009
                                                                                                                                                                                                                                                     Q1 2010
                                                                                                                                                                                                                                                                  Q2 2010
                                                                                                                                                                                                                                                                            Q3 2010
                                                                                                                                                                                                                                                                                      Q4 2010
                                                                                                                                                                                                                                                                                                Q1 2011
                                                                                                                                                                                                                                                                                                          Q2 2011
                                                                                                                                                                                                                                                                                                                     Q3 2011
                                                                                                                                                                                                                                                                                                                               Q4 2011
                                                                                                                                                                                                                                                                                                                                         Q1 2012
                                                                                                                                                                                                                                                                                                                                                   Q2 2012
                                                                                                                                                                                                                                                                                                                                                             Q3 2012
                                                                                                                                                                                                                                                                                                                                                                       Q4 2012
                                                                                                                                                                                                                                                                                                                                                                                 Q1 2013
                                                                                                                                                                                                                                                                                                                                                                                           Q2 2013
                                                                                                                                                                                                                                                                                                                                                                                                         Q3 2013
                                                                                                                                                                                                                                                                                                                                                                                                                    Q4 2013
                                                                                                                                                                                                                                                                                                                                                                                                                              Q1 2014
                                                                                                                                                                                                                                                                                                                                                                                                                                        Q2 2014
                                                                                                                                                                                                                                                                                                                                                                                                                                                  Q3 2014
                                                                                                                                                                                                                                                                                                                                                                                                                                                            Q4 2014

                                                                                                                                                                                                                                                 Quarter

30                                                                                                                                                            A Window on the Quality of New Zealand’s Health Care
You can also read