Studie zum deutschen Innovationssystem | Nr. 4-2021 - Patent Applications - Structures, Trends and Recent Developments 2020 Peter Neuhäusler ...
←
→
Page content transcription
If your browser does not render page correctly, please read the page content below

Studie zum deutschen
Innovationssystem | Nr. 4-2021

Peter Neuhäusler, Oliver Rothengatter, Alexander Feidenheimer

Patent Applications –
Structures, Trends and Recent
Developments 2020

Herausgeberin: Expertenkommission Forschung und Innovation (EFI)
Diese Studie wurde im Auftrag der Expertenkommission
Forschung und Innovation (EFI) erstellt. Die Ergebnisse
und Interpretationen liegen in der alleinigen Verantwortung
der durchführenden Institute. Die EFI hat auf die Abfassung
des Berichts keinen Einfluss genommen.

Durchführendes Institut
Fraunhofer Institut für System-
und Innovationsforschung (ISI)
Breslauer Straße 48, 76139 Karlsruhe
www.isi.fraunhofer.de

Studien zum deutschen Innovationssystem
Nr. 4-2021
ISSN 1613-4338

Stand
Februar 2021

Herausgeberin
Expertenkommission Forschung und Innovation (EFI)

Geschäftsstelle
Pariser Platz 6 | 10117 Berlin
www.e-fi.de

Alle Rechte vorbehalten, insbesondere das Recht auf Vervielfältigung und Verbreitung sowie die
Übersetzung. Kein Teil des Werkes darf in irgendeiner Form (durch Fotokopie, Mikrofilm oder ein
anderes Verfahren) ohne schriftliche Genehmigung der EFI oder der Institute reproduziert oder
unter Verwendung elektronischer Systeme gespeichert, verarbeitet, vervielfältigt oder verbreitet
werden.

Kontakt und weitere Informationen
Dr. Peter Neuhäusler
Fraunhofer Institut für System-
und Innovationsforschung (ISI)
Breslauer Straße 48, 76139 Karlsruhe
T + 49 (0) 721 68 09 33 5
M Peter.Neuhaeusler@isi.fraunhofer.de
Contents

Contents

0   Summary ......................................................................................................... 1

1   Introduction .................................................................................................... 4

2   Data and Methods........................................................................................... 4

3   Indicators and their Interpretation .............................................................. 7

4   Core indicators................................................................................................ 9

    4.1              International Comparisons............................................................. 9

    4.2              Technology Profiles and Specialization Patterns ........................ 13

5   International Co-Patenting Trends............................................................. 17

6   Patent Activities of the German Federal States ......................................... 25

7   Patenting Trends in Public Research ......................................................... 34

    7.1              The Applicant Perspective ........................................................... 35

    7.2              Academic Patents ........................................................................ 39

8   Trends in EUIPO trademarks ..................................................................... 45

9   References ..................................................................................................... 58

                                                                                                                                 I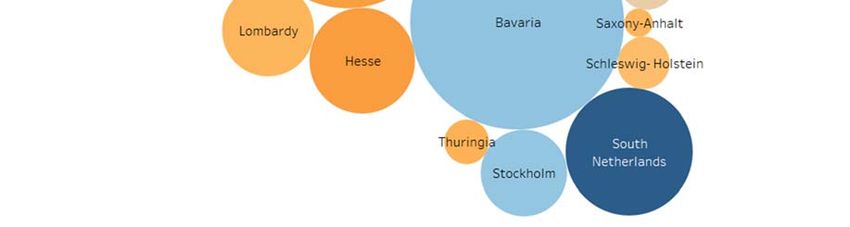
Contents

Figures
Figure 1:       Absolute number of transnational patent applications for selected
                countries, 1995-2018 .......................................................................... 10
Figure 2:       Shares of high-tech patent applications in total patent applications for
                selected countries, 1995-2018 ............................................................ 12
Figure 3:       Germany’s technological profile, 2008-2010 vs. 2016-2018 ............. 16
Figure 4:       Shares of transnational co-patents in all transnational filings of the
                respective country............................................................................... 19
Figure 5:       Transnational co-patents in technological areas as a share on all
                transnational co-patents of respective country, 2015-2017 ................ 24
Figure 6:       Number of transnational filings by German federal states (upper
                panel) and European regions (lower panel) ........................................ 26
Figure 7:       Shares of transnational filings by federal states ................................. 27
Figure 8:       Patent intensities of the German federal states (per 1 million
                employees).......................................................................................... 28
Figure 9:       Patent shares and growth rates of the German federal states and
                European regions, 2017 ...................................................................... 30
Figure 10: Number of transnational patent filings by NUTS-2 regions in
           Germany, 2005-2007 and 2015-2017 ................................................. 31
Figure 11: Shares of patents by technology domains in German federal states,
           2005-2007 vs. 2015-2017 ................................................................... 32
Figure 12: Shares of patents by technology domains in European regions, 2005-
           2007 vs. 2015-2017 ............................................................................ 33
Figure 13: Number of transnational filings by German research organizations and
           shares of universities and PROs ......................................................... 36
Figure 14: Patent intensities (patents per 1,000 R&D employees, full-time
           equivalents) by German research organizations (3-years moving
           average) .............................................................................................. 37
Figure 15: Shares of filings by public research organizations in all PRO filings
           (3-years moving average) ................................................................... 38
Figure 16: Number of academic patents by German research organizations (3-
           years moving average), transnational ................................................. 40
Figure 17: Shares of academic patents by universities and public research
           institutes in all filings by research organizations (3-years moving
           average) .............................................................................................. 41
Figure 18: Patent intensities (patents per 1,000 R&D employees, full-time
           equivalents) by German research organizations for academic patents
           (3-years moving average) ................................................................... 42
Figure 19: Shares of academic patents from public research organizations in all
           academic patents by PRO (3-years moving average) ......................... 42

II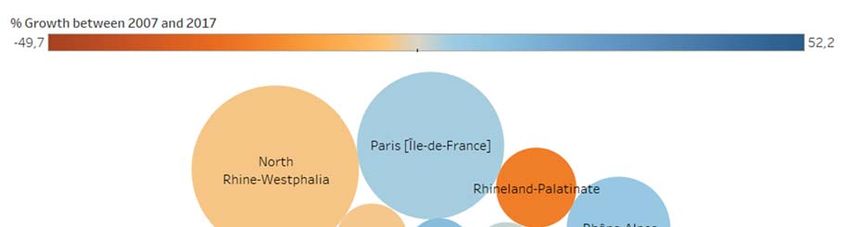
Contents
Figure 20: Academic patents by type of patent applicant .................................... 45
Figure 21: Absolute number of EU trademark filings and shares by trademark
types, 2000-2018 ................................................................................ 46
Figure 22: Absolute number of EU trademark filings for selected countries, 2000-
2018 .................................................................................................... 47
Figure 23: Shares in EU trademark filings for selected countries, 2000-2018 .... 48
Figure 24: Growth in EU trademark filings for selected countries between 2009-
2013 and 2014-2018 ........................................................................... 49
Figure 25: Shares of trademark types within the countries' portfolios, 2018....... 49
Figure 26: EU trademark related profiles Germany and China, 2018 ................. 52
Figure 27: EU trademark related profiles Germany and the U.S., 2018 .............. 53
Figure 28: Trademark classification at Level I, World, 2018, absolute numbers 54
Figure 29: Shares of trademarks in total trademarks at classification level I,
China, Germany and the U.S., 2018 ................................................... 55
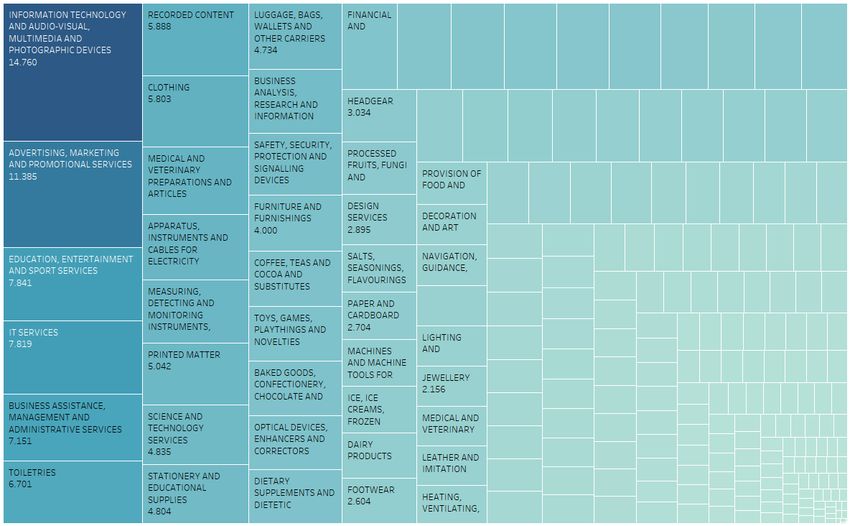
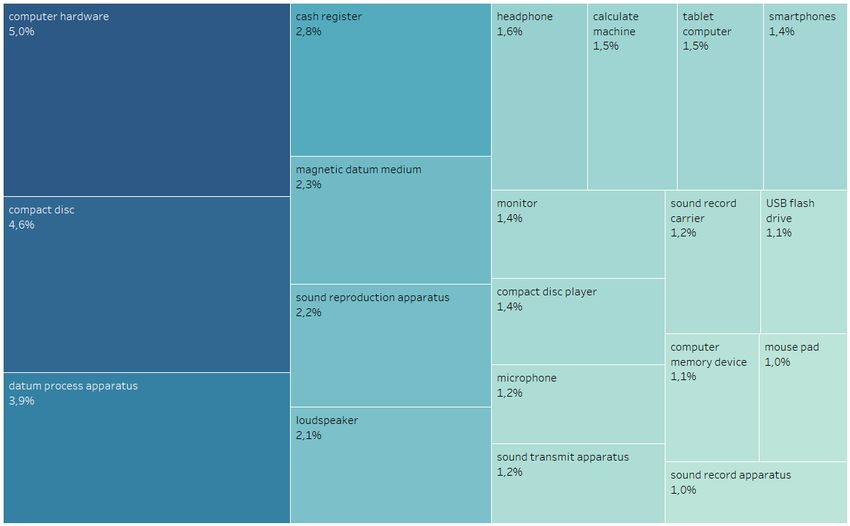
Figure 30: Shares of trademarks within level I class "information technology and
audio-visual, multimedia and photographic devices" at level 5, world,
2018 .................................................................................................... 56
Figure 31: Shares of trademarks within level I class "information technology and
audio-visual, multimedia and photographic devices" at level 5,
Germany, 2018 ................................................................................... 57
Tables
Table 1: Definition of technology and knowledge-intensive NICE-classes ....... 6
Table 2: Patent intensities (patent applications per 1m employees) and shares
of technological areas, 2018 ............................................................... 11
Table 3: Transnational Patent applications of Germany according by high-
technology sectors (absolute, specialization, and growth), 2016-
2018 .................................................................................................... 14
Table 4: Absolute number of transnational co-patents and shares in total
transnational co-patents, 2015-2017 ................................................... 22
Table 5: Share of co-patenting partners within the transnational co-patenting
portfolio of a given country, 2015-2017 ............................................. 23
Table 6: Patent filings and patent intensities by university applicants ............. 38
Table 7: Number of academic patents and patent intensities by universities ... 43
Table 8: Trademark intensities (EU trademark filings per 1m employment) and
shares of trademarks by types, 2018 ................................................... 50
III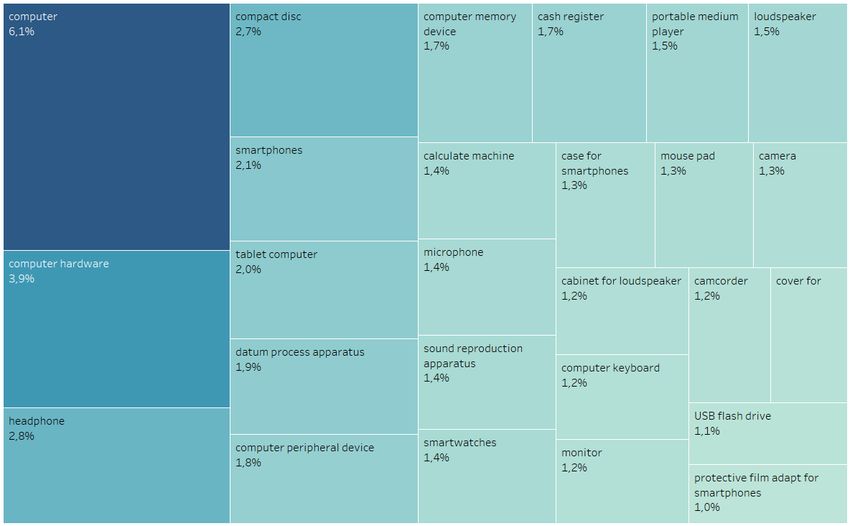
Summary
0 Summary
Core indicators
Over the past years, the number of transnational patent filings has been growing steadily -
except during the financial crisis, when a considerable drop in the filings figures occurred.
After 2010, however, the growth resumed with filing numbers in 2010 already being above
the pre-crisis level. The largest country at the international level in terms of patent filings is
the U.S. where a growth of patent filings could be observed in the recent years. China, which
has shown very large growth rates over the last few years is at a slightly higher level than
Japan in the number of transnational filings in 2018. However, the growth of Chinese filings
has slowed down a bit. Japan, also showing a growth in the number of patent filings lately,
scores third followed by Germany, where also an increase in filing figures can be observed
after 2015. In 2018, however, the number of filings is at a similar level as in 2017. In terms
of patent intensities, smaller countries like Switzerland, Sweden and Finland are at the top
of the list. Japan, though outranked by China in absolute terms, scores third in terms of patent
intensities, even ahead of Finland. South Korea and Germany are fifth and sixth within the
comparison of patent intensities, followed by Denmark and Israel.
A closer look at high-tech patent filings shows that worldwide 62% of total patents are pa-
tents in high-technology. Since 2015, however, the shares have slightly declined. Germany
has increased its high-tech shares in recent years and is now at the same level with France.
Denmark, Germany. Japan and Austria are the countries that show the strictest focus on high-
level technologies, while many other countries are more active in leading-edge technologies.
When looking at Germany's country-specific technology profile, the largest growth rates
between the periods 2008-2010 and 2016-2018 can be found in "agricultural machinery",
"units and equipment for automatic data processing machines", followed by "power genera-
tion and distribution", "rubber goods", "communication engineering", "electrical machinery,
accessory and facilities" and "optics".
International Co-Patenting Trends
The shares of transnational co-patents in all transnational patents of the respective inventor
country is highest in smaller countries which generally tend cooperate more often – for 2017
i.e. Switzerland (35%) as well as Great Britain and Sweden (both 24%). In Germany, this
value is around 14%, and in U.S. 13%. Regarding cooperation patterns, the U.S. appears to
be the most frequent partner among all countries in comparison. Germany is also a highly
significant collaboration partner among all countries as it is ranked second after the U.S. in
many cases. In terms of technological areas, western countries tend to cooperate more often
in less-R&D intensive technologies, while eastern countries cooperate more often in leading-
edge technologies.
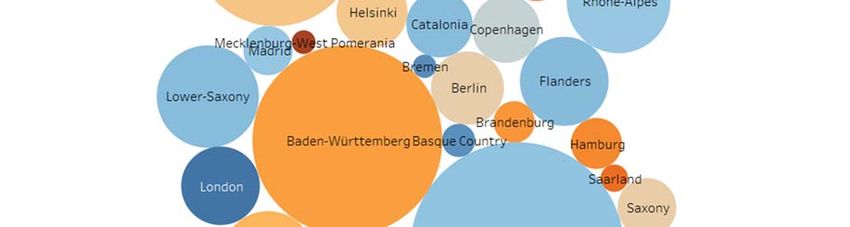
1Summary Patent Activities of the German Federal States The largest number of transnational filings within the German comparison can be found in Bavaria, followed by Baden-Württemberg and North Rhine-Westphalia. The three states to- gether are responsible for slightly more than two thirds of all German transnational filings. Since only about half of the German employees are located in these states, the patent inten- sity there is comparably high. In sum, however, we see a decline in patent filings and con- sequently also patent intensities across nearly all of the German federal states since 2007. Broken down by NUTS-2 regions it can be found that Oberbayern, followed by Stuttgart, Karlsruhe, Düsseldorf, Darmstadt and Köln are the largest regions in terms of patent filings When looking at the filing figures of the European regions compared to the German federal states, it is clearly Paris with the largest number of transnational filings, though the figures only grew slightly over the years since 2005. Paris is followed by Southern Netherlands, where - after a sharp decline due to the financial crisis - a major increase can be observed after 2012. The Rhône-Alpes region is the third largest region in our comparison, followed by Lombardy, Flanders and Stockholm. Patenting Trends in Public Research The analysis of filings by universities and public research institutes (PROs) shows that the number of transnational patent filings has been stagnating for universities in recent years while it has increased for PROs. This trend is mirrored in the shares of filings by universities and PROs in total filings by German research organizations, i.e. after a convergence of fil- ings in the 2000's the figures now are once again starting to slightly drift apart. Still, nearly 50% of all filings of German research organizations have a university listed as an applicant. The patent intensities for the universities and PROs are lower than in the 2000's, with PROs in sum still being more patent intensive than universities. When analyzing academic patents, i.e. patents filed by universities plus patents on which university personnel is named as an inventor, the picture slightly changes. Nearly 40% of patents from universities are "hidden" when only taking the applicant perspective into ac- count, while this number is much lower for the PROs (about 8%). This also has an effect on the patent intensities, i.e. the difference between universities and PROs is much smaller when taking academic patents into account. In interesting further effect can be observed when looking at the distribution of applicants of academic patents to see who "owns" an academic patent. For universities, a major shift between the 2000's and the recent years can be observed. The share of single inventors has decreased while the university files a much larger share of patents itself, which can be seen as a result of the abolishment of the "Hochschullehrerprivileg" in the early 2000's. Apart from that, a slight growth in firms being applicants of academic patents can be observed, which is especially true for large enterprises. 2
Summary

Trends in EUIPO trademarks
The general trends in trademark filings show a rather constant increase across the whole time
period - except during the financial crisis. The largest group of filings are the marks on
goods, followed by mixed goods/services and pure service marks. For non-European coun-
tries, the share for product marks is much higher than for European countries (except Italy).
This can be attributed to the fact that cross-border trade is less common for services than for
goods.
The trademark intensities show that the Scandinavian countries have the highest values (Swe-
den, Finland and Denmark), followed by Austria. Germany, France and Great Britain. The
specialization profiles show that Germany's activities are spread across the whole range of
NICE classes. Germany thus shows positive specialization values in most of the fields. How-
ever, a rather clear specialization to the fields related to machines and metals as well as
rubber goods can be observed. Among the service related classes, Germany is most specialized
in "treatment of materials", "building construction" and "telecommunications".
Based on our newly developed bottom-up classification approach, we can investigate trade-
marks applications even in much more detail comparing to NICE classes. From this perspec-
tive, the largest class for Germany is "information technology and audio-visual, multimedia
and photographic devices", followed by "Advertising; marketing and promotional services",
"IT services" and "Business assistance, management and administrative services".

                                                                                             3
Introduction 1 Introduction Patent applications as well as patent grants, which can be seen as the major output indicators for R&D processes (Freeman, 1982; Grupp, 1998), are a commonly used tool to assess the technological performance of countries or innovation systems. Patents can thereby be ana- lyzed from different angles and with different aims and the methods, while also the defini- tions applied for analyses using patent data do differ (Moed et al., 2004). Prior art searches as well as the description of the status of a technology can be carried out from a technological point of view. Seen from a micro-economic perspective, the evaluation of individual patents or the role of patent portfolios in technology-based companies might be in focus. A macro- economic perspective, on the other hand, offers an assessment of the technological output of national innovation systems, especially in high-tech areas. In the current report, we focus on the macro-economic perspective by providing information on the technological capabilities and the technological competitiveness of economies as a whole. Patents are hereby used as an output indicator of R&D processes. However, R&D processes can also be measured by the input – for example, in terms of expenditures or hu- man capital. In order to achieve a more precise approximation of the "black box" of R&D activities (Schmoch and Hinze, 2004), both perspectives – i.e. input and output – are needed. The input side, however, has been widely analyzed and discussed in other reports, also in this series (Gehrke et al., 2020). Therefore, we strictly focus on patents as an indication of output (Griliches, 1981, 1990; Grupp, 1998; Pavitt, 1982). In the report, we provide a brief overview of the developments of transnational patent appli- cations since 1996. For the interpretation, however, we especially focus on the recent trends and structures. Besides providing the most recent general patenting trends, we additionally analyze international cooperation structures in terms of co-patents. Moreover, we will pro- vide a more differentiated look at the German technology landscape at the level of regions, i.e. the German "Bundesländer" and we will analyze patents by German universities and pub- lic research institutes to gain insights into the technological performance of the German sci- ence system. Finally, as a complementary innovation indicator to patents, we analyze trade- mark filings in an international comparison. 2 Data and Methods The patent data for this study were extracted from the "EPO Worldwide Patent Statistical Database" (PATSTAT), which provides information about published patents collected from more than 80 patent authorities worldwide. The list of research-intensive industries and goods (NIW/ISI/ZEW-Lists 2012) are used for the differentiation of 38 high-technology fields (Gehrke et al., 2013). By using PATSTAT as the basis of our analyses, we are able to apply fractional counting of patent filings. We do this in two dimensions: on the one hand, we fractionally count by inventor countries and, on the other hand, we also fractionally count by the 38 technology fields of the high-tech list, implying that cross-classifications are taken 4
Data and Methods
into account. The advantages of fractional counting are the representation of all countries or
classes, respectively, as well as the fact that the sum of patents corresponds to the total, so
that the indicators are simpler to be calculated, understood, and more intuitive.
The patents in our analyses are counted according to their year of worldwide first filing,
which is commonly known as the priority year. This is the earliest registered date in the
patent process and is therefore closest to the date of invention. As patents in this report are
seen – first and foremost – as an output of R&D processes, using this relation between in-
vention and filing is appropriate.
At the core of the analysis, the data applied here follows a concept suggested by Frietsch and
Schmoch (2010), which is able to overcome the home advantage of domestic applicants, so
that a comparison of technological strengths and weaknesses becomes possible – beyond
home advantages and unequal market orientations. In detail, all PCT applications are
counted, whether transferred to the EPO or not, and all direct EPO applications without pre-
cursor PCT application. Double counting of transferred Euro-PCT applications is thereby
excluded. Simply speaking, all patent families with at least a PCT application or an EPO
application are taken into account.
In addition to the absolute numbers, patent intensities are calculated, which ensures better
international comparability. The figures for the patent intensity are calculated as the total
number of patents per 1 million workers in the respective country.
For the analyses of patents in different technological fields, patent specializations are calcu-
lated. For the analysis of specializations, the relative patent share (RPA1) is estimated. It
indicates in which fields a country is strongly or weakly represented compared to the total
patent applications. The RPA is calculated as follows:
RPAkj = 100 * tanh ln [(Pkj/j Pkj)/(k Pkj/kj Pkj)]
P kj
where stands for the number of patent applications in country k in technology field j.
Positive signs mean that a technology field has a higher weight within the country than in
the world. Accordingly, a negative sign represents a below-average specialization. Hereby,
it is possible to compare the relative position of technologies within a technology portfolio
of a country and additionally its international position, regardless of size differences.
For the analyses of community trademarks, the data provided by the EUIPO was used. Based
on their flat files, we created an offline SQL database containing registered community
trademarks from 1996 onwards. This data allows differentiated analyses of EUIPO trade-
mark filings over time and across countries. However, using the EUIPO data means a slight
break in the series as we have used data from the German Patent and Trademark Office in
earlier reports. Especially because the EUIPO database does not include all information re-
garding country codes, which leads to lower filings figures in the country-wise statistics in
1 Revealed Patent Advantage.
5Data and Methods
general, yet with highly similar trends. In addition to country-wise statistics and international
comparisons, trademarks can be differentiated by NICE classes. The NICE classification is
an international classification of goods and services that is utilized for the registration of
trademarks. It has been established by the Nice Agreement in 1957 and comprises 45 classes.
The classes 1 to 34 refer to goods, while classes 35 to 45 are services. The classes define the
scope and the context of each trademark filing and are provided by the applicants themselves.
Since several classes are assigned to one trademark, each trademark is counted once for each
NICE class it has been assigned to, i.e. the sum of trademarks across NICE classes is larger
than the total amount of trademarks filed (whole-count method). Since the applicant provides
the classes and has the option of assigning a multitude of classes, the classification, however,
only offers limited insight. A description of the content of the trademark, like an abstract, as
in the case of patents, is not available.
In order to overcome this issue, we have generated an in-depth classification of trademarks
with more than 8.000 classes. It is the result of a matching of the trademark descriptions
provided by the applicant upon registration with the pre-defined list of keywords the appli-
cant can choose from the online platform "TMClass". In sum, we were able to assign at least
one class to 85% of all EUIPO trademark filings. For more details on the construction of the
classification see Neuhäusler et al. (2019).
Table 1: Definition of technology and knowledge-intensive NICE-classes
Nr. Name NICE classes
1 Chemistry 1, 2, 3, 4, 13
2 Pharmaceuticals 5
3 Metals 6
4 Machines 7, 8
5 Electronics (components, instruments) 9, 14
6 Medical technologies 10
7 Electronic devices 11
8 Vehicles 12
9 Management 35
10 Finance 36
11 Repair 37
12 Telecommunications 38
13 Transport 39
14 Material treatment 40
15 Entertainment 41
16 Other services 42 (43, 44, 45)
Source: Schmoch and Gauch (2009)
In sum, the differentiation of trademarks across NICE classes has to be made with caution.
In addition to the NICE classes and our own in-depth classification, we will further apply a
differentiation of product marks, service marks and mixed marks, i.e. marks that are assigned
NICE classes referring to goods as well as NICE classes referring to services. In a more fine-
6Indicators and their Interpretation
grained disaggregation, we further resort to the definition of "research-intensive services"
with regard to service marks by Schmoch and Gauch (2009), where the classes 35, 36, 38,
41, 42, 43, 44, 45 are regarded as research-intensive services. In the case of products, we
will concentrate on eight fields that have been defined as having a high technology related-
ness, i.e. they can be seen as potentially research-intensive. The definition of these eight
fields can be found in Table 1.
In parallel to the analyses of patent filings, we will calculate not only absolute numbers of
trademark filings but also trademark intensities - defined as the number of trademark appli-
cations per 1 million labor force - to account for size effects. On the basis of the NICE
Classification, also specialization profiles (RPA) for EU trademarks are presented.
3 Indicators and their Interpretation
International Co-patents
The cooperation structures in international patenting resemble the internationalization of
R&D activities and are able to indicate the extent to which countries are cooperating with
each other. This is based on the assumption that each collaboration that leads to a cooperative
patent application is associated with the exchange of knowledge about the patented inven-
tion. The analysis of cooperation structures in patenting thus allows us to draw conclusions
about international knowledge flows. It is assumed that usually implicit or experiential
knowledge is exchanged (Polanyi, 1985), which will later "explicitly" be stated in the form
of a patent application. By analyzing patent applications, however, our focus remains on the
explicable and explicit knowledge (Grupp, 1998).
In sum, we will focus on the transnational co-patent filings of the countries under analysis.
As for the general patent trends, we will apply fractional counting by inventor countries, i.e.
a country is only assigned the fraction of a patent depending on the number of inventors
from the given country.
Patent filings by German federal states
With the help of the regionalization of patent filings from Germany, we aim to answer the
question, which of the federal states contribute most strongly to the patent activities of Ger-
many as a whole. Economic activities, and thereby also innovative activities are not equally
distributed over geographical space. A regionalized patent statistic therefore allows taking a
closer look at the structural composition of the German innovation landscape, which enables
us to identify regional technology trends as an important precondition for the composition
and framing of regional innovation policies in Germany.
As with the general patent trends, we will apply fractional counting by inventor countries.
For the identification of the German federal states in patent filings, we use the NUTS-code
information from the OECD REGPAT database, complemented with address information
obtained from the German Patent and Trademark Office (DPMA). Filings for which we
7Indicators and their Interpretation could not assign a NUTS code with the help of these two data sources, we resorted to the patent family information within the PATSTAT database. In the case that address infor- mation could be obtained from any other than the transnational filing, this address infor- mation was assigned to the transnational filing. In its current version, the OECD REGPAT database does not contain full regionalized information for the year 2016. In order to be able to provide figures for 2016, we used the average trend of the last three years of patent growth in Germany to estimate the filing number for the federal states for 2016. For the final version of the report, update figures will be provided. Patent filings by German Universities and Public Research Institutes We will analyze patents filed by German universities and public research institutes (PRI). In addition, we will look at academic patents, i.e. patents filed by universities and PRI plus university-invented patents. Patents filed by universities and public research institutes (PRI) help us to assess the tech- nological output of research organizations in Germany. Patents filed by universities and PRI were identified within the PATSTAT database with the help of keyword searches, including the names of the universities with different spelling variations and languages as well as a search for the names of the respective cities, also including spelling variations and languages. In the case of the Technical University of Munich, for example, patents are filed under the names “Research TECHNICAL UNIVERSITY OF MUNICH”, “TECHNISCHE UNIVERSITAET MUENCHEN”, or “TU MUENCHEN”. All different spelling variations are taken into account. The approach for the identification of the whole set of academic patents, including univer- sity-invented patents, is based on the examination of name matches of authors of scientific publications from the Scopus database and inventors named on a patent filing. Publications list the authors’ affiliation and enable us to identify academic inventors and the patents they have contributed to. We do not only identify academic patents for universities but also for public research institutes, to find out whether the effect described for universities can also be found for the PROs. Based on a keyword search and manual correction, the German universities and PROs were identified within Scopus. The author-/inventor names from these two tables were matched and, to ensure a high precision, complemented with additional selection criteria, especially to avoid homonyms, i.e. different persons having identical names. A more detailed descrip- tion of the name matching and its validation can be found in Dornbusch et al. (2013) . For the evaluation of the algorithm a recall and precision analysis has been applied (Baeza- Yates and Ribeiro-Neto, 2011).The recall was estimated using a benchmark (gold standard) 8
Core indicators

set of 200 author/inventor records.2 The precision of the algorithm was validated by an
online-survey covering authors for whom academic patents have been identified.3 Due to the
large datasets with imperfect data, 100% for both recall and precision are impossible. How-
ever, in order to obtain the best fit between the two, the F-score4 was calculated, which rep-
resents the harmonized mean between recall and precision. However, as a concession to high
precision we have to accept a reduced recall, i.e. the retrieved results are likely to underesti-
mate the amount of academic patents and our results so to say are only able to reflect a lower-
bound estimate of academic patents.
The number of academic patents cannot easily be compared to the report from earlier series.
This has to do with the fact that the most recent version of Scopus (version 2019) was used
for the matching, which has a better coverage of scientific journals (across all years) and
research organizations in general. In addition, a new regionalization (geocoding) algorithm
was used for a better identification of author addresses in Scopus. This has led to slightly
lower numbers of academic patents in general, yet with a higher precision of the matching
algorithm.
The figures for the patent intensities are calculated as the total number of patent filings per
1,000 employees (full-time equivalents) in the respective universities. The data on university
employees were extracted from the German Federal Statistical Office as well as the Federal
Report on Research and Innovation 2020. Gaps within the data for certain years were esti-
mated on the basis of the values of the preceding and following years.

4             Core indicators
In this section, we will describe the recent trends of transnational patent filings since 1995.
All our analyses were carried out for a selected set of technology-oriented countries5, alt-
hough, for reasons of presentation, not every country is displayed in each figure. Besides a
country-specific view, we will provide a distinction between low- and high-technology areas
(Gehrke et al., 2013). In addition, we will provide more in-depth technology field analyses.

4.1           International Comparisons
The absolute number of transnational patent filings by inventor countries is displayed in
Figure 1. The USA is the largest technology-providing country at the international level in

2     Recall: CR/(CR + CM), where CR is Correct Recall and CM is Correct Missing (error type I or false
      negative); Precision: CR/(CR + IR), where IR is Incorrect Recall (errors type II or false positive).
3     The survey addressed 1681 persons with 2782 patent applications at the German patent office. 435 ex-
      ploitable answers amounting to 678 patents have been received, equaling a response rate of 26%.
4     F-Score: Fß = (1+ß²) (p*r)/(ß²*p*r); p = precision = tp/(tp+fn) and r = recall = tp/(tp+fp) where tp means
      true positive, fn false negative and fp false positive.
5     These are: Belgium, Denmark, Germany, Finland, France Israel, Italy, Japan, Canada, Korea, The Neth-
      erland, Austria, Poland, Sweden, Switzerland, Spain, United Kingdom, USA, Brazil, Russia, India, China,
      South Africa as well as the group of EU-28 member states.

                                                                                                              9
Core indicators
2018, although there has been a slight decline in the last year. China, however, has managed
to catch up to the U.S. and has slightly surpassed Japan in terms of absolute number of
filings. Yet, a slowdown in the growth of filings in the last two years becomes visible. China
is followed by Japan, where a growth in filings can be observed in the recent years, resulting
in more than 55,000 transnational patent filings in 2018. Germany follows at rank four, how-
ever, with a much smaller number of filings than the U.S., China and Japan. Following be-
hind these four countries is a large group of countries led by Korea, France and Great Britain.
In the latter two countries, the figures have pretty much stagnated after 2014. Korea has
grown strongly in terms of patent filings since 2000 onwards and has thus managed to leave
behind France and Great Britain in the total number of transnational applications since 2009.
Sweden and Switzerland follow Great Britain with more than 4,000 transnational filings in
2018 and a slight growth in filings over the years.
Figure 1: Absolute number of transnational patent applications for selected countries,
1995-2018
80
70
60
50
40
in thousands
30
20
10
0
95 96 97 98 99 00 01 02 03 04 05 06 07 08 09 10 11 12 13 14 15 16 17 18
US JP DE GB FR CH SE KR CN
Source: EPO – PATSTAT; Fraunhofer ISI calculations
The absolute filing figures we have seen so far is affected by size effects. An adjustment to
these size effects is shown in Table 2. Here, patent intensities per one million employees are
provided, which draws a completely new picture of the country ranks. Although the U.S. is
the largest country in absolute terms, it only scores thirteenth in terms of patent intensities.
China is located at the nineteenth rank. Smaller countries like Switzerland, Sweden and Fin-
land are at the top of the list of the technology-oriented countries analyzed here. Japan scores
third in terms of patent intensities, even ahead of Finland. South Korea and Germany are
fifth and sixth within the comparison of patent intensities, followed by Denmark and Israel.
These high patent intensities resemble a strong technology orientation and technological
10Core indicators
competitiveness of these countries. However, it is also a sign of a clear international orien-
tation and an outflow of the export activities as patents are an important instrument to secure
market shares in international technology markets (Frietsch et al., 2014).
Table 2: Patent intensities (patent applications per 1m employees) and shares of
technological areas, 2018
Total Less R&D-intensive High-Tech
of which are: Leading-edge High-level
technologies technologies
SUI 966 498 52% 488 51% 167 17% 321 33%
SWE 846 293 35% 572 68% 331 39% 242 29%
JPN 836 363 43% 490 59% 185 22% 305 36%
FIN 772 342 44% 437 57% 263 34% 173 22%
KOR 728 304 42% 445 61% 201 28% 244 33%
GER 715 317 44% 416 58% 141 20% 276 39%
DEK 688 271 39% 430 63% 118 17% 312 45%
ISR 636 241 38% 415 65% 235 37% 180 28%
AUT 619 298 48% 325 53% 106 17% 219 35%
NED 564 273 49% 297 53% 164 29% 132 23%
BEL 431 214 50% 225 52% 87 20% 137 32%
FRA 428 183 43% 255 60% 111 26% 145 34%
USA 400 147 37% 261 65% 134 34% 127 32%
EU-28 356 160 45% 204 57% 82 23% 122 34%
ITA 254 140 55% 121 48% 32 13% 89 35%
GBR 249 109 44% 148 59% 72 29% 76 31%
CAN 196 81 41% 118 60% 65 33% 54 27%
ESP 141 72 51% 72 51% 28 20% 44 31%
CHN 73 25 34% 51 70% 29 40% 21 29%
POL 52 26 49% 27 51% 10 19% 17 33%
RSA 19 12 60% 8 42% 4 18% 4 23%
RUS 17 8 49% 9 51% 4 26% 4 25%
BRA 9 5 56% 4 46% 2 18% 3 28%
IND 7 3 38% 5 64% 3 34% 2 30%
Source: EPO – PATSTAT; OECD, The World Bank, Fraunhofer ISI calculations
Note: In a few cases, shares of patents in certain IPC-classes are assigned to leading-edge as well as high-
level technologies, which might lead to double-counts. The shares therefore might slightly exceed 100%.
In addition to the general patent intensities, Table 2 offers a differentiation of patent inten-
sities by technological areas and displays the respective shares on total patent filings. China,
Sweden, the U.S., Israel, India, Denmark, Korea, Canada, and France show the largest shares
of patents in high-technology fields. This pattern has already emerged in earlier reports of
this series. Regarding Sweden, China, Israel, the U.S., Canada and to a slightly lesser extent
also Finland and India, this mostly is the result of large shares of patents in leading-edge
technologies. In the case of India and Israel, this can mostly be explained by a high orienta-
tion towards the U.S. market. For Denmark, Germany, Japan and Austria, on the other hand,
the large shares in high-tech fields are much more an effect of large shares in high-level
technologies than in leading-edge technologies. In less R&D intensive fields, the largest
shares can be observed for South Africa, followed by Brazil, Italy, Switzerland, Spain Bel-
gium and Poland.
11Core indicators
Figure 2: Shares of high-tech patent applications in total patent applications for selected
countries, 1995-2018
70%
65%
60%
55%
50%
45%
40%
95 96 97 98 99 00 01 02 03 04 05 06 07 08 09 10 11 12 13 14 15 16 17 18
USA JPN GER FRA ITA
80%
75%
70%
65%
60%
55%
50%
45%
40%
95 96 97 98 99 00 01 02 03 04 05 06 07 08 09 10 11 12 13 14 15 16 17 18
Total FIN KOR CHN
Source: EPO – PATSTAT; Fraunhofer ISI calculations
Figure 2 (upper and lower panel) shows the trends in high-tech shares within the national
profiles of selected large countries. As can be seen from the picture, the average share of
total transnational high-tech patent applications rose from about 58% in 1995 to 62% in
2018. Since 2015, however, the shares have slightly declined. The single countries under-
went considerable change of their patenting patterns in high-tech areas. The USA has long
12Core indicators
been at the top of the countries under observation with regard to high-tech shares. It showed
constantly increasing trends over the years until 2006. From 2006 onwards, we see a slightly
rising trend in high-tech shares, with stagnation and even a slight decline after 2015. For
China, which now has the largest high-tech shares of the countries in our comparison, the
high-tech shares have started to grow significantly after it joined the WTO and the TRIPS
agreement in 2001. This growth is especially visible between 2003 and 2006. Since then, a
moderate growth until 2010 and a stagnation afterwards can be found. Since 2015, however,
we see a rather strong decline in the Chinese high-tech shares which continues in 2018. Yet,
with 69%, it still has the largest share of high-tech patents in our comparison.
Japan and Korea were the second and third most high-tech active countries in terms of trans-
national patenting before the shares of China significantly increased. However, both have
clearly lost ground compared to the U.S. at the end of the 1990s and beginning of 2000s.
Though they have managed to catch up afterwards, a decreasing trend in Japanese high-tech
shares after 2011 could be observed, which can also be found for Korea. However, both
countries still show comparably large shares in high-tech patents. France was able to increase
its high-tech share over the years, although we see a slight decline after 2013, which has
become less pronounced in the last two years. Germany has encountered a growth in high-
tech shares until 2002. After that year, a decline until 2005 became visible. From 2006 on-
wards, the German high-tech shares stabilized at a rather high level. Especially since 2013,
a growth can be observed which led to a similar high-tech share as France in 2018. Each
year, the high-tech shares of Germany increased up to a level of 58% in 2018. Italy encoun-
tered increases up to 2012, but from then a decrease similar to Japan can be found. Finland,
on the other hand, shows decreasing shares since 2006. Yet, in the last two years it seems
that the Finish high-tech shares stagnated at a lower level.
4.2 Technology Profiles and Specialization Patterns
In this section, we provide a deeper insight into the transnational patent applications by Ger-
man inventors according to the classification of 38 technology fields of the high-tech sector
(Gehrke et al., 2013). The absolute number, specialization and the percentage growth of
German transnational patent applications by technology fields are displayed in Table 3. The
largest growth rates between the periods 2008-2010 and 2016-2018 can be found in "agri-
cultural machinery", "units and equipment for automatic data processing machines", fol-
lowed by "power generation and distribution", "rubber goods", "communication engineer-
ing", "electrical machinery, accessory and facilities" and "optics". Thus, especially "com-
munication engineering" and "units and equipment for automatic data processing machines"
have grown at a quicker pace then in the recent years. The fields that are growing most
slowly in Germany are three rather small fields, namely "photo chemicals", "nuclear reactors
and radioactive elements", weapons" but also "pesticides, "technical glass/construction
glass" and "pharmaceuticals". Here, a declining trend has already been observed in earlier
reports of this series.
13Core indicators
Table 3: Transnational Patent applications of Germany according by high-technol-
ogy sectors (absolute, specialization, and growth), 2016-2018
Technology Field Abs. RPA % Growth
(08-10=100)
agricultural machinery 980 75 214.6
units and equipment for automatic data processing machines 961 -73 163.5
power generation and distribution 2586 34 140.4
rubber goods 372 13 137.3
communications engineering 5421 -46 134.5
electrical machinery, accessory and facilities 657 12 130.3
optics 693 -44 129.6
mechanical measurement technology 1361 30 124.0
aeronautics 844 -23 114.1
lamps, batteries etc. 1982 -3 113.7
rail vehicles 314 70 112.8
optical and electronic measurement technology 2983 -13 111.6
automobiles and engines 5757 68 110.4
pumps and compressors 785 38 109.3
electrical appliances 698 10 107.9
optical and photooptical devices 73 -82 106.3
machine tools 2627 62 105.4
computer 2028 -63 105.1
medical instruments 2669 -18 103.5
electrical equipment for internal combustion engines and vehicles 1172 60 100.9
air conditioning and filter technology 1922 30 99.9
special purpose machinery 3346 19 93.7
broadcasting engineering 602 -87 92.7
Scents and polish 32 -45 91.7
power machines and engines 3179 55 87.4
electronic medical instruments 876 -54 86.4
other special chemistry 890 1 83.2
electronics 1312 -31 83.1
office machinery 58 -63 82.6
organic basic materials 1364 5 79.0
inorganic basic materials 318 -18 77.4
biotechnolgy and agents 1380 -59 77.3
pharmaceuticals 1055 -49 76.7
technical glass, construction glass 70 -100 71.8
pesticides 395 6 65.0
weapons 184 30 59.0
nuclear reactors and radioactive elements 8 -84 39.2
photo chemicals 0 -98 7.2
Source: EPO – PATSTAT; Fraunhofer ISI calculations
Yet, also further chemistry related fields, e.g. "inorganic basic materials", "biotechnology
and agents", "organic basic materials and "other special chemistry", can be seen as compa-
rably slowly growing fields within the German technology profile, followed by the ICT and
electrical engineering related fields of "electronics", "power machines and engines", "elec-
tronic medical instruments" and "broadcasting engineering".
In general, it can be found that many electronics related fields, certain fields in mechanical
engineering (especially agricultural machinery, electrical machinery as well as power genera-
tion and distribution but also rail vehicles) as well as aeronautics, and optics are growing rather
14Core indicators
strongly, whereas chemistry and pharmaceuticals and certain ICT related fields do not show
very high growth rates. In electrical engineering, there seems to be a split as some fields are
growing rather strongly while other only show negative growth rates. Some fields related to
the mechanical engineering sector, where Germany has its particular technological strengths,
e.g. "automobiles and engines", "machine tools", "special purpose machinery" show moderate
to low growth rates in recent years. In the case of "special purpose machinery" even a decline
becomes visible.
The specialization (RPA) of the German technology profile of the years 2008-2010 and
2016-2018 is shown in Figure 3. Germany has positive specialization values in three main
areas: transport (automobiles and engines, rail vehicles), machinery (agricultural machinery,
machine tools, power machines and engines, pumps and compressors) and some areas of
electrical engineering, especially electrical equipment for internal combustion engines,
which is a trend that already emerged in earlier years.
An average activity rate in patenting can be found in chemistry (organic basic materials,
other special chemistry, pesticides), where there has been a positive development in terms
of the German technology specialization compared to the 2008-2010 period. Comparative
disadvantages, reflected in negative specialization indices, can especially be found in smaller
fields like technical glass, photo chemicals, broadcasting engineering, nuclear reactors and
optical and photo-optical devices, but also in computers, units and equipment for automatic
data processing and office machinery, implying that Germany does not have an outstanding
profile in these sectors in international technology markets. Yet, there is still a major growth
in automatic data processing equipment. All of these trends can be found in both time peri-
ods, i.e. the specialization profile of Germany is rather stable over time. Major changes can
be found in "agricultural machinery", "power generation and distribution", "rubber goods",
"organic basic materials", "pesticides" and "electrical machinery", where Germany has be-
come more specialized, whereas in "aeronautics", "electronic medical instruments", "elec-
trical appliances", "weapons" and "nuclear reactors" and "photo chemicals" Germany has
become less specialized.
15Core indicators
Figure 3: Germany’s technological profile, 2008-2010 vs. 2016-2018
agricultural machinery
rail vehicles
automobiles and engines
machine tools
electrical equipment for internal combustion…
power machines and engines
pumps and compressors
power generation and distribution
weapons
air conditioning and filter technology
mechanical measurement technology
special purpose machinery
rubber goods
electrical machinery, accessory and facilities
electrical appliances
pesticides
organic basic materials
other special chemistry
lamps, batteries etc.
optical and electronic measurement technology
2008-2010
inorganic basic materials
2016-2018
medical instruments
aeronautics
electronics
optics
Scents and polish
communications engineering
pharmaceuticals
electronic medical instruments
biotechnolgy and agents
computer
office machinery
units and equipment for automatic data…
optical and photooptical devices
nuclear reactors and radioactive elements
broadcasting engineering
photo chemicals
technical glass, construction glass
-100 -80 -60 -40 -20 0 20 40 60 80 100
Source: EPO – PATSTAT; Fraunhofer ISI calculations
16International Co-Patenting Trends
5 International Co-Patenting Trends
International co-patenting plays a crucial role in analyzing cooperation structures of R&D
activities between countries. A cooperative patent application is therefore not only an indi-
cation of knowledge exchange about an underlying technology (i.e. patent) but also an indi-
cation of general cooperation and knowledge flows on international level.
However, analyzing and – even more importantly – interpreting international co-patents
comes with a few pitfalls that need to be considered. First, a co-patent as such is an interme-
diate outcome of a collaborative R&D activity that captures a specific aspect of it. On the
one side, it is only an eventual technological result of a successful inventive process, which
does not provide a picture of other beneficial outcomes such as skill improvement and con-
ceptual learning, especially of not very successful collaboration activities. On the other side,
it is always unclear which of the partners benefits more from the collaboration, i.e. one can-
not estimate the direction and amount of the knowledge flow between two countries. Fur-
thermore, an international co-patent may involve inventors from the same company located
around the world across its various branches or subsidiaries (ADL, 2005). Thus, the data
may reflect inter- as well as intra-firm international collaboration (Fraunhofer ISI et al.,
2009; Guellec and Pluvia Zuniga, 2007).
Another predictive factor of international collaboration is the size of a country. Early studies
suggest that smaller countries tend to collaborate comparably more often than bigger coun-
tries since the later one have more domestic partners available (Narin et al. 1991; Schubert
and Braun 1990; Frame and Carpenter 1979). However, these findings have been discussed
quite controversially (Luukkonen et al. 1992; Luukkonen et al. 1993; Narin et al. 1991).
Further collaboration influencing factors can be attributed to the overall heterogeneity be-
tween countries as e.g. geopolitical, historical and language related factors as well as social,
intellectual, cognitive and economic factors (Frame and Carpenter 1979; Glänzel and Schu-
bert 2004; Luukkonen et al. 1992). Beyond these country specific predictors, there are also
differences in collaboration patterns that are based on technological profiles. Liu et al.
(2012), for example, have shown that there is more international collaboration in basic re-
search compared to applied research. Furthermore, Frietsch (2004) as well as Schmoch
(2005; 2006) argue that strategic aspects should also be taken into account, as e.g. obtaining
access to privileged research facilities, or unique resources. On the contrary, protective po-
sitions might hamper the willingness to cooperate, if a disadvantage is expected from
knowledge sharing. Last but not least, the geographic proximity might also determine the
extent of collaboration (Katz 1994; Hong and Su 2012). Other studies, however, argue that
this factor becomes less important due to prolonged advances in mobility and communica-
tion technologies (Hoekman et al. 2010). Especially the latter one might be expedite consid-
erably by the global corona crisis. However, there is no hard evidence in this regard at the
moment.
17International Co-Patenting Trends In sum, it can be stated that there is a multitude of collaboration influencing factors and mechanisms. However, the causalities are not always as clear as it is desirable. Thus, evi- dence of collaborative activities should always be interpreted carefully. Regarding the choice of indicators, it is also crucial to present a preferably balanced picture that sheds light on various aspects instead of focusing on specific measures that might be biased by e.g. country specific characteristics and other influencing factors. Hence, our approach is not only to show the total numbers of international co-patents, but also to relativize them over various aspects by providing shares as well as looking precisely at collaboration patterns between each country in our set. Figure 4 depicts the cooperation intensities of countries presented, i.e. the share of transna- tional co-patents (with OECD countries) in all transnational patent filings. Large shares on this indicator allude a higher degree of international cooperation efforts of a given country. However, lower shares do not necessarily pinpoint to a lack of effort in cooperating, but it also might reflect a higher availability of national cooperation partners, which renders inter- national collaboration less important. Furthermore, a lower degree of international co-pa- tents can also reflect a highly protective innovation policy in a given country, or a lower number of big international companies with dispersed location of R&D laboratories over the globe. However, it is rather difficult to reflect these kind of causalities reliably based on general numbers. Nevertheless, one have to keep such possibilities in mind while drawing conclusions. The total share of co-patents in all transnational filings is has been continuously increasing from 4.4% in 1995 to 6.4% in 2007. The total numbers (not shown here) approve that this upwards trend is due to a higher growth rate of transnational co-patents related to all trans- national filings, confirming the gain of importance of international collaboration over the years. During the economic crisis between 2007 and 2011, both numbers have dropped dras- tically while the share was only slightly affected with a decrease down to 6.2%. Afterwards, however, we can observe a more accelerated downwards trend on this indicator until the end of the observation period, not only with respect to the total share, but also in several countries (U.S., Great Britain, France). Looking at total numbers as well as the growth rates again, we can confirm that indeed much less co-patents are filed after the crisis than before, while total transnational filings still increase after 2011, although with a lower growth rate. It is also noteworthy that the economic crisis had different effects on this indicator, if looking at it at the county level. In Germany, for example, we can observe a drop in 2008. However, after- wards the share stabilized and remained at a rather constant level until 2014, where it began to rise again. This is also quite similar to the progress in Switzerland. In the U.S., on the other hand, the share kept rising fast until 2011 (13.5%), dropped to 11.8% in 2013 and started to rise again afterwards. A similar trend can be observed in Great Britain and – partially – in Sweden. Whereas Asian countries (Korea and Japan) show a prolonged decline over the whole observation period and the economic crisis seem not have affected 18
You can also read