Community profile - City and County of Denver
←
→
Page content transcription
If your browser does not render page correctly, please read the page content below
connectivity and mobility
  urban design equity and access
              thriving region
competitive landscape        F E B R U A R Y 3 , 2 0 17

                 community profile
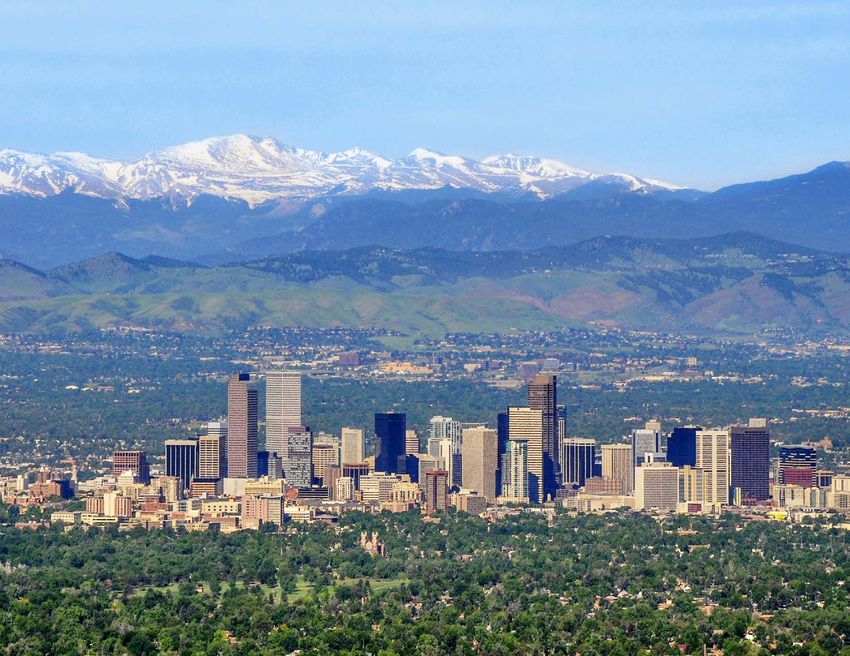
Table of Contents
List of Tables                                                                                                                                                                       i

List of Figures                                                                                                                                                                      ii

Section 1: Introduction                                                                                                                                                         1
  Background .................................................................................................................................................................. 2
  Project Overview .......................................................................................................................................................... 2
  Denveright Effort (Game Plan, Denver Moves: Transit, Denver Moves: Ped and Trails)......................................... 4
  Existing Plans, Policies and Goals .............................................................................................................................. 4

Section 2: Denver Today                                                                                                                                                 5
  Denver by the Numbers................................................................................................................................................ 6
  Households and Housing.............................................................................................................................................. 6
  Race and Ethnicity........................................................................................................................................................ 10
  Age................................................................................................................................................................................. 10
  Education....................................................................................................................................................................... 11
  Income........................................................................................................................................................................... 11
  Employment.................................................................................................................................................................. 12
  Growing Industries........................................................................................................................................................ 12
  Shrinking Industries...................................................................................................................................................... 12
  History and Organization of Neighborhoods............................................................................................................. 15
  Denver’s Neighborhood Contexts.............................................................................................................................. 15

Section 3: The Competitive Landscape                                                                                                                                                 17
  Comparable City Snapshot.......................................................................................................................................... 18
Section 4: The Center of a Thriving Region                                                                                                                                       27
  Overview of the Metropolitan Area............................................................................................................................. 28
  DRCOG’s Metro Vision Plan and Other Regional Planning Efforts.......................................................................... 28
  Comparison of Denver to the Region Now................................................................................................................ 29

Section 5: Built Form and Urban Design                                                                                                                                           35
  Overview........................................................................................................................................................................ 36
  Overall Built Form......................................................................................................................................................... 36
  Tree Canopy.................................................................................................................................................................. 44
  Park and Open Spaces................................................................................................................................................. 46
  Ground Floor Activation: Restaurant and Retail........................................................................................................ 48
  New Development by Neighborhood........................................................................................................................ 48
  Transit Oriented Development.................................................................................................................................... 48

Section 6: Connectivity and Mobility                                                                                                                                               51
  Overview........................................................................................................................................................................ 52
  People Riding Transit.................................................................................................................................................... 56
  People Walking............................................................................................................................................................. 59
  People Biking................................................................................................................................................................ 60
  People Driving.............................................................................................................................................................. 63

Section 7: Equity and Access within Denver                                                                                                                                       67
  Neighborhood Snapshot............................................................................................................................................. 68

Section 8: Next Steps                                                                                                                                                            73

Appendix
  Existing Plans, Policies and Goals Summaries
  In the Press: Best and Worst Lists
List of Tables
Table 1: Denver Households and Tenure, 2000 to 2014.................................................................................................. 9

Table 2: Denver Population by Race and Ethnicity, 2014................................................................................................ 10

Table 3: Denver Population by Age, 2014........................................................................................................................ 10

Table 4: Denver Population by Educational Attainment, 2014....................................................................................... 11

Table 5: Denver Household and Per Capita Income, 2014............................................................................................. 11

Table 6: Peer City Population, 2005 to 2014..................................................................................................................... 18

Table 7: Peer City Median Home Value to Income, 2005-2014....................................................................................... 22

Table 8: Peer City Median Household Income Change, 2005-2014............................................................................... 23

Table 9: Peer City Employment Change, 2002 to 2014................................................................................................... 25

Table 10: Peer City Housing and Transportation, 2010 to 2014...................................................................................... 26

Table 11: Mode Share (All Types)...................................................................................................................................... 52

Table 12: Mode Share Change, 2000 to 2014.................................................................................................................. 52

Table 13: Percent of Households, Employees and Parcels within ¼ mile of Transit..................................................... 56

Table 14: Percent of Streets with Sidewalks..................................................................................................................... 59

Table 15: B-Cycle Stations by Neighborhood.................................................................................................................. 62

Table 16: Centerline Street Miles in Denver..................................................................................................................... 63

Table 17: Change in Vehicle Miles Travelled (VMT), 2005 to 2014.................................................................................. 63

Table 18: Percent of Major Roadways Congested by Hours per Day ........................................................................... 65

Table 19: Shared Transportation Economy....................................................................................................................... 65
                                                                                                                                                                            List of Tables | i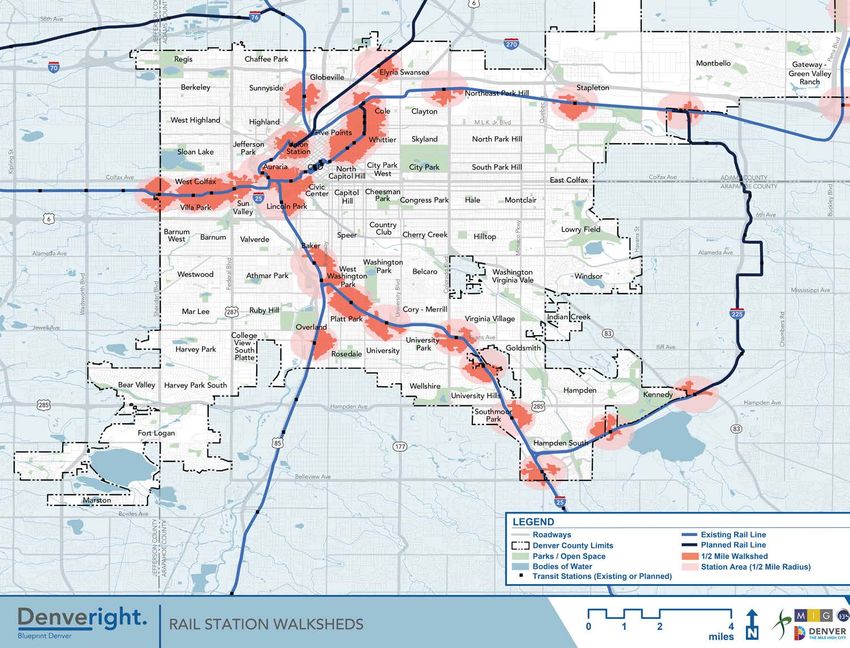
List of Figures
          Figure 1: Denver Region.................................................................................................................................................... 3

          Figure 2: Denver Population Change by Decade, 1880 to 2015.................................................................................... 7

          Figures 3-6: Population Density Maps 1950; 1970; 1990; and 2010................................................................................ 8

          Figure 7: Denver Permitted Residential Units, 2002 to 2014.......................................................................................... 9

          Figure 8: Change in Employment (2002-2014).................................................................................................................13

          Figure 9: Neighborhood Contexts Map...........................................................................................................................14

          Figure 10: Peer City Change in Population by Age, 2005 to 2014.................................................................................19

          Figure 11: Peer City Housing Units Permitted, 2002 to 2015......................................................................................... 20

          Figure 12: Peer City Freddie Mac Housing Price Index, 2010 to 2016.......................................................................... 21

          Figure 13: Peer City Zillow Rent Rate Index, 2010 to 2016............................................................................................. 21

          Figure 14: Peer Cities Educational Attainment 25+, 2005-2015.................................................................................... 24

          Figure 15: City of Denver and Denver MSA Population Change, 2002 to 2014........................................................... 30

          Figure 16: City of Denver and Denver MSA Permitted Residential Units, 2002 to 2015............................................. 30

          Figure 17: City of Denver and Denver MSA Permitted Multifamily Housing, 2002 to 2015........................................ 31

          Figure 18: City of Denver and Denver MSA Wage and Salary Employment Change, 2002 to 2015.......................... 31

          Figure 19: Denver MSA Employment Capture by Major Center, 2005 to 2013............................................................ 32

          Figure 20: City of Denver and Denver MSA Office Inventory and Rental Rates, 2002 to 2015................................... 33

          Figure 21: City of Denver and Denver MSA Retail Inventory and Rental Rates, 2002 to 2015.................................... 33

ii | List of Tables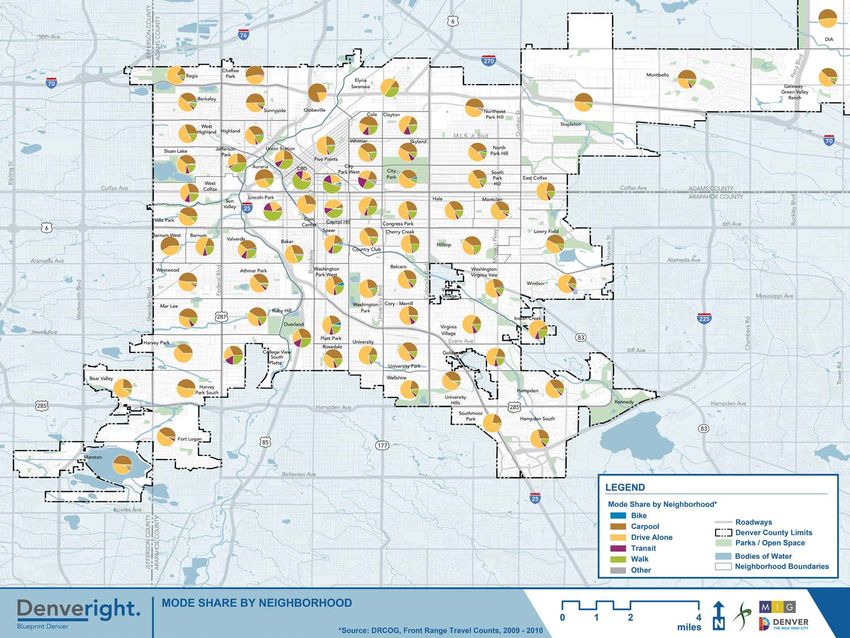
Figure 22: City of Denver and Denver MSA Industrial Inventory and Rental Rates, 2002 to 2015.............................. 34
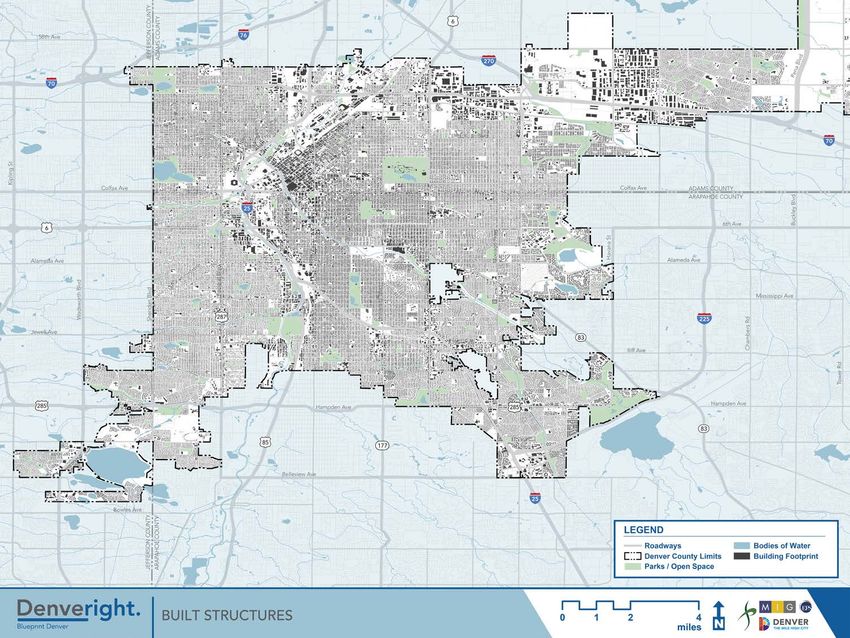
Figure 23: Built Structures Map........................................................................................................................................ 37
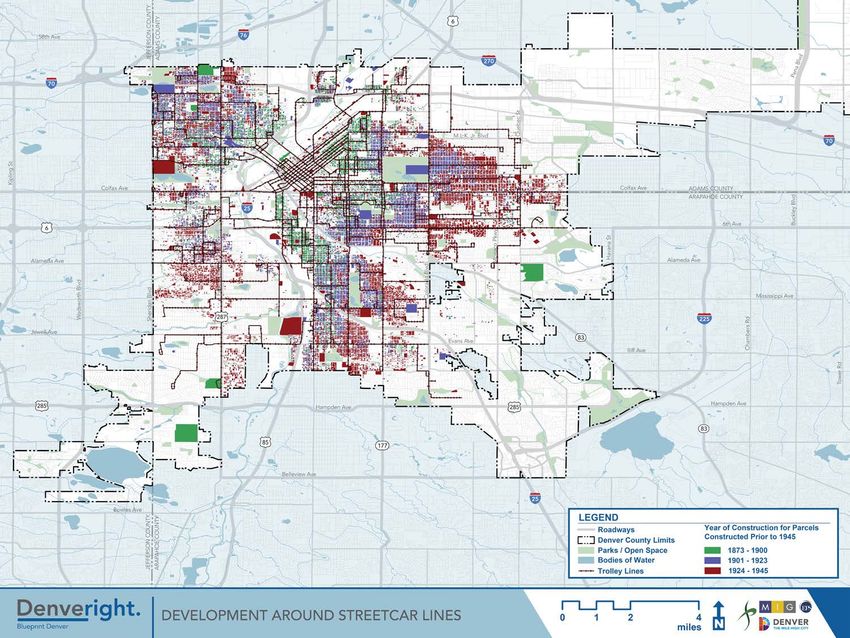
Figure 24: Streetcar Development Map.......................................................................................................................... 39
Figure 25: Building Coverage Map.................................................................................................................................. 41
Figure 26: Impervious Surfaces Map................................................................................................................................ 43
Figure 27: Tree Canopy Coverage Map........................................................................................................................... 45
Figure 28: Park Acreage Map............................................................................................................................................47
Figure 29: New Development, Redevelopment, Additions, and Expansions by Neighborhood. Map..................... 49
Figure 30: Rail Station Walksheds Map............................................................................................................................ 50
Figure 31: Mode Share by Neighborhood Map............................................................................................................. 53
Figure 32: Intersection Density Map................................................................................................................................ 55
Figure 33: Average Weekday Transit Boardings Map.................................................................................................... 57
Figure 34: Transit Frequency: Weekday Midday............................................................................................................. 58
Figure 35: Percent of Households within ¼ mile of High Ease of Use Facility............................................................. 60
Figure 36: Existing and Proposed Bicycle Facilities........................................................................................................ 61
Figure 37: Bike Lane Miles Per Year................................................................................................................................. 62
Figure 38: Vehicles per Household by Neighborhood................................................................................................... 64
Figure 39: Daily Vehicle Miles Travelled (VMT) Per Capita by Neighborhood............................................................. 66
Figure 40: Neighborhood Matrix .................................................................................................................................... 70-72
List of Figures | iii
1
                                                       DOCUMENT ORGANIZATION
SECTION 1                                              The Community Profile is organized into eight sections and is accompanied

Introduction
                                                       by an appendix. The sections of the document include:

                                                       • Section 1: Introduction – Background on the Blueprint Denver effort and
                                                         the larger Denveright planning initiative;

                                                       • Section 2: Denver Today – City and County of Denver demographics
Overview                                                 and neighborhood structure;

                                                       • Section 3: The Competitive Landscape – Compares U.S. cities as
This document is a first step in helping to identify     benchmarks to gauge Denver’s progress;

areas where the Blueprint effort and coordinating      • Section 4: The Center of a Thriving Region – Explores Denver’s place in
                                                         the larger metropolitan area and looks at its evolution over time;
Denveright plans can help continue to shape
                                                       • Section 5: Built Form and Urban Design – Indicators and characteristics
Denver’s future. The document serves as a                of Denver’s built form, how that form has changed over time, and what
                                                         patterns have emerged as a result of various factors;
community profile, identifying Denver’s current
                                                       • Section 6: Connectivity and Mobility – How residents, employees and
vision, as well as assessing its performance and         visitors get around in Denver and what infrastructure exists to support
                                                         those choices;
highlighting its assets and areas of opportunity.
                                                       • Section 7: Equity and Access within Denver – Denver’s neighborhoods
                                                         across a variety of demographic, transportation, park and neighborhood
                                                         amenity indicators;

                                                       • Section 8: Next Steps – Next steps in the Blueprint Denver process; and
                                                       • Appendix – The appendix includes a brief history of Denver, summaries
                                                         of several relevant plans and studies that were considered in the creation
                                                         of the Community Profile and that will be used as a foundation moving
                                                         forward in the planning process, and a sample list of Denver rankings.

                                                                                                              Community Profile | 1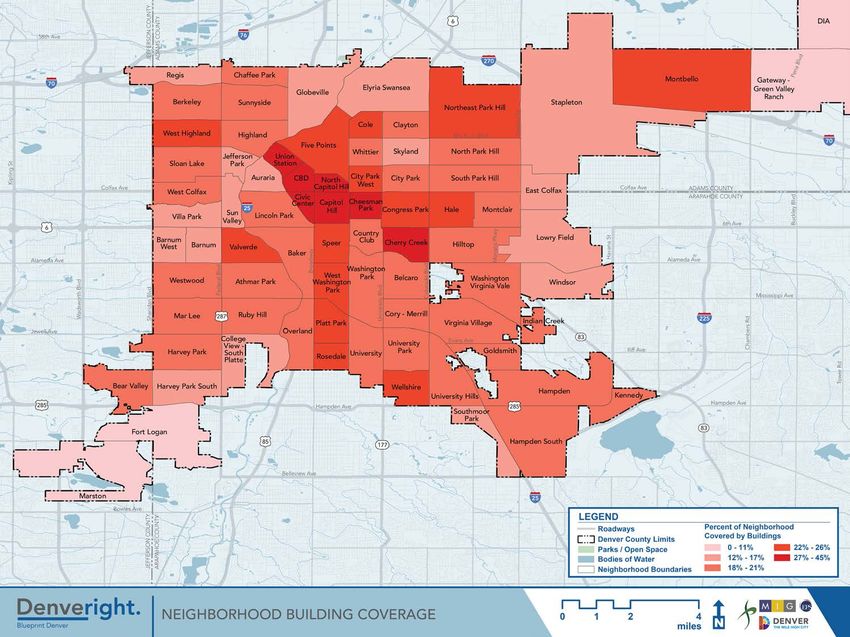
Background                                                                 Project Overview
In 2000, Denver developed a Comprehensive Plan with a specific vision,     Blueprint Denver is an update of our city’s 15-year-old guide for land
goals and objectives to lead Denver into 2020. A core component of         use and transportation. It will direct how our city evolves, ensuring
that plan was the call for a separate document, Blueprint Denver, that     that our communities feel and function in ways that make life better
identified in detail how Denver would grow. In response to increased       and more enjoyable for those who live and work in Denver. With the
growth and what was perceived as threats to the character of existing      nearly complete build-out of FasTracks, Stapleton and Lowry, as well as
neighborhoods, Blueprint was intended to address and integrate             significant population growth, now is the time to look to the future and
planning for land use and transportation at a citywide scale while         think about what we want our communities and the entire city to be
establishing the tools for small area planning. Prior to the creation of   like in the next 20 years. As part of Denveright, the update of Blueprint
Blueprint, Denver never had a document that specified an overarching       Denver will convene community conversations to shape how certain
growth approach, identified compatible future land uses, or a desired      areas of our city will change and how other areas can remain stable and
transportation system that moved people and not just cars.                 vibrant. It will also help us decide how our city’s road, bus, rail, bicycle
                                                                           and pedestrian systems should evolve to meet the needs of the Denver
Blueprint Denver was adopted by the Denver City Council in 2002            of tomorrow.
as a supplement to the Comprehensive Plan. With the adoption of
Blueprint, Denver was able to identify and direct growth to Areas of       Why Update Blueprint Denver?
Change, preserve community character in Areas of Stability, prioritize
the development of multi-modal streets and mixed-use developments,         Now is the time
and develop building blocks to characterize and support appropriate        Denver has changed considerably since 2002. More transportation
land use.                                                                  options, thriving neighborhoods and improved planning tools position
                                                                           us well to address our continued population and employment growth.

                                                                           A people-driven plan
                                                                           It will take all of us to get this right. Blueprint Denver is by, for, and
                                                                           about the people. It will give everyone in Denver a voice in what we
                                                                           want our city to be like.

                                                                           Making a difference in daily life
                                                                           Blueprint Denver will shape the future of our communities in ways that
                                                                           make them unique and enjoyable places to live and work.

2 | Blueprint Denver Update
Figure 1: Denver Region
Community Profile | 3Denveright Effort (Blueprint Denver, Game Plan, Denver Existing Plans, Policies and Goals
Moves: Transit, Denver Moves: Ped and Trails) Blueprint Denver builds upon and references numerous previous
Our community is undertaking an effort that builds upon our successes successful Denver planning efforts. Land use, multimodal connectivity,
and proud traditions to shape the future of Denver. Encompassing parks and greenways, parking, street categories, and housing diversity
four distinct citywide plans and guided by input from the community, and choice are all important aspects of the update process. The
Denveright will establish a vision for Denver for the next 20 years. following citywide plans inform all four Denveright plans:
Denveright will shape Denver’s future in the areas of land use, mobility, • Denver Comprehensive Plan (2000)
parks and recreational resources, by coordinating, for the first time, the • Blueprint Denver (2002)
planning processes for:
• Parks Game Plan (2003)
• The update of Blueprint Denver; • Pedestrian Master Plan (2004)
• The update of The Game Plan, the 2003 citywide parks and • Moving People: Denver Strategic Transportation Plan (2008)
recreation master plan; • Denver Moves: Making Bicycle and Multi-Use Connections (2011)
• The development of Denver Moves: Transit, a new mobility plan for • Denver Moves: Enhanced Bikeways (2016)
transit in Denver; and
• Denver Strategic Parking Plan (2010)
• The development of Denver Moves: Pedestrians and Trails, a new
mobility plan for sidewalks, crossings and trails. • Living Streets Initiative (2014)
• Transit Oriented Denver (2014)
• The Climate Adaptation Plan (2014)
• The Climate Action Plan (2015)
• Housing Denver – A Five-year Plan (2015-2019)
• Small Area Plans/Next Step Studies/Neighborhood Plans/Transit
Oriented Development (TOD) Plans
• Denver Community Health Improvement Plan (2013-2018)
Each of these plans is addressed more fully in the Appendix of this
document.
4 | Blueprint Denver Update2
KEY OBSERVATIONS
SECTION 2 • Denver has grown steadily since its inception in 1858, and has increased in
population every decade since with the exception of the 1970s and 80s;
Denver Today • The population growth through 2020 projected by DRCOG at the time of
2002 Blueprint Denver was for an additional 109,000 residents;
• Since the 2002 Blueprint Denver, the city has grown by 121,000 residents.
65 percent of this population growth (78,000 people) occurred in the last
five years (2010 to 2015);
• Denver was the fifth fastest-growing large city (population > 250,000) in the
nation in 2014 and the third fastest city in the U.S. from 2005-2014;
Overview • Despite significant population growth, Denver was denser in 1950 than it is
Denver is a great place to live and work – it today;
• Denver is nearly evenly split between owner-occupied and renter-occupied
boasts an active outdoor lifestyle, proximity to the units but renter households accounted for over 75 percent of the new
mountains, phenomenal restaurants, and diverse households since 2000;
• Denver has permitted at least 5,500 housing units annually since 2012,
neighborhoods and cultural experiences. The city which is 30 percent more annually than from 2000 to 2008;
is experiencing unprecedented growth. Denver’s • Denver is not very racially diverse as the population is predominately white
(78%);
population in 2015 was 682,545 (US Census • 31 percent of the residents are Hispanic or of Latino origin;
Population Estimates). The resurgence of growth • Denver is a young and educated city with a median age of 34 and 44
percent of residents with a bachelor’s degree or higher; and
in Denver in the 1990s spurred the city to update
• Total employment in Denver was approximately 473,000 in 2014,
its comprehensive plan and develop the original according to the Bureau of Labor and Statistics. Industries with significant
employment growth since 2002 include: accommodations and food
Blueprint Denver. Denver is now on pace to grow service, professional services, health care, management of companies, and
by 150,000 new residents in a ten-year period. This oil and gas.
rate of growth in Denver is again spurring the city to KEY FINDINGS
reconsider its plan for growth. • While Denver has had periods of significant growth, the amount of
population growth in Denver over the past five years is more than the city
has ever experienced in that amount of time and is expected to continue;
• The new housing development since 2010 has shifted to become primarily
multifamily as opposed to single family (4:1 ratio). This trend is likely to
continue as Denver’s larger areas for single family home development
(Green Valley Ranch, Lowry, and Stapleton) are mostly built out;
• Denver’s economy is growing and has become more diverse; and
• Denver’s distinct set of neighborhoods attracts a wide range of residents.
The regionally-centered location of the neighborhoods and resurgence of
small neighborhood business districts have increased the city's desirability.
Community Profile | 5Denver by the Numbers Households and Housing
Population There were 281,928 households (occupied housing units) in Denver in
2014 (ACS). Denver increased in households by an annual rate of 1.2
Denver is experiencing unprecedented growth. Denver’s population percent from 2000 to 2014, which equates to 42,693 new households in
in 2015 was 682,545 (US Census Population Estimates). The city has the city (See Table 1). Despite an almost even split of owner-occupied
grown steadily since its inception in 1858, with the exception of two versus renter-occupied units for the city as a whole, the recent growth
decades (See Figure 2). The population decreased in the 1970s and was predominately in renter occupied households. In that time frame,
1980s by 47,000 residents. The resurgence of growth in Denver in the there were over 32,000 renter households added to the city compared
1990s spurred the city’s update to its comprehensive plan and the to 9,976 owner occupied households. Renter households accounted for
development of the original Blueprint Denver. Since the 2002 Denver over 75 percent of the new households, resulting in a shift in the tenant
Blueprint, Denver has grown by 121,000 residents at an annual rate mix towards renters.
of 1.5 percent. Two-thirds of this population growth (78,000 people)
occurred in the last five years (2010 to 2015). The largest population The City of Denver permitted approximately 6,000 residential units
increase in a decade was 93,374 people in the 1940s. Denver is now on in 2014. Between 2002 and 2008, the city permitted between 3,000
pace to grow by 150,000 new residents in a ten-year period. and 4,000 annually. From 2009 to 2011, permit activity reduced as the
city and the nation felt the impacts of the economic recession. As
Denver was the fifth fastest-growing large city (population greater than housing development has returned, the number of units permitted has
250,000) in the nation in 2014 and the third fastest city in the U.S. from increased year over year and is permitting units at a higher rate than
2005-2014. during the early part of the 2000s. The City of Denver has permitted
over 5,500 units annually since 2012, with over 6,000 units permitted
Population Density in 2013 and 2014 (See Figure 7). In total, the City of Denver permitted
While Denver’s population has increased steadily since the mid-1800s, 48,408 units from 2002 to 2014 with 32 percent of these units in single
save for a twenty-year period in the late 1900s when Denver saw a family dwellings and 68 percent in multi-family dwellings.
population loss, the city was denser in 1950 than it is today (See Figures
3-6). This in part is due to the expansive outward growth occurring post
1950s that redistributed our population from the traditional core to the
newly acquired land in the southeast.
6 | Blueprint Denver UpdateFigure 2: Denver Population Change by Decade, 1880 to 2015
700,000
682,545
10-Year Change in Population
Denver Total Population
600,000
500,000
400,000
300,000
200,000
100,000 93,374 89,128
79,522 78,101 77,666
71,084
43,110 48,141
27,146 31,370 34,551 20,791
-21,984 -25,084
0
-100,000
1880 1890 1900 1910 1920 1930 1940 1950 1960 1970 1980 1990 2000 2010 2015
Source: US Census; Colorado Department of Local Affairs
Community Profile | 7Figures 3-6: Denver’s Population Density 1950; 1970; 1990; and 2010
1950 1970
Citywide Statistics Citywide Statistics
Area: 66 sq mi Area: 99 sq mi (+ 49%)
Population: 416,000 Population: 515,000 (+24%)
Population density: 9.8 pers/acre Pop. density: 8.1 pers/acre
Persons per Persons per
Note: 1950 census data unavailable for housing unit: unavilable Note: Areas without shading were missing housing unit: 2.7
areas surrounding Denver. population values in source datasets.
1990 2010
Citywide Statistics Citywide Statistics
Area: 154 sq mi (+56%) Area: 154 sq mi (+0%)
Population: 468,000 (-9%) Population: 600,000 (+28%)
Pop. density: 6.3 pers/acre * Pop. density: 8.1 pers/acre *
Persons per Persons per
housing unit: 2.0 ? housing unit: 2.1
* Does not include DIA * Does not include DIA
Source: City and County of Denver; University of Minnesota-Minnesota
Population Center NHGIS; U.S. Census Bureau
8 | Blueprint Denver UpdateTable 1: Denver Households and Tenure, 2000 to 2014
2000 2014
# % # %
Housing Units 251,435 298,880
Occupied Housing Units (Households) 239,235 95% 281,928 94%
Change
Owner in Building
Occupied Permits from 2002
Households 125,631 53% 135,607 48%
Renter Occupied Households 113,604 47% 146,321 52%
Vacant Housing Units 12,200 5% 16,952 6%
Source: US Census 2014 ACS 1-Year Estimates
Source: US Census 2014 ACS 1-Year Estimates
\\COBO-FRIGATE\project_files\Blueprint-Denver\04_Reports\Community Profile\_Draft\9-20-16 Draft to Task Force\Comments\[153106-BluePrint Denver_ForMIG_10.11.2016.xlsx]T1_DenverHHsandTenure_Update
Figure 7: Denver Permitted Residential Units, 2002 to 2014
Total Residential Permits Single Family Multi-Family
7,000
6,000 4,929 4,411
4,748
5,000
4,000
2,598
2,356 2,611
1,948 2,714
3,000 1,792 1,436
2,060
2,000
1,875
1,555 1,691 1,691
1,000 1,444 1,444 779
1,191 1,269
801 419 843
627 693
0 483
2002 2003 2004 2005 2006 2007 2008 2009 2010 2011 2012 2013 2014
Source: Denver County Assessor; U.S. Census Bureau; Economic & Planning Systems
Source: Denver County Assessor; U.S. Census Bureau; Economic & Planning Systems Community Profile | 9
\\COBO-FRIGATE\project_files\Blueprint-Denver\04_Reports\Community Profile\Tables\EPS revised 10-11-16\[153106-Race and Ethnicity Age
Race/Ethnicity Number %
White 520,398 78%
The population of Denver is predominately white (78%) (See Table 2). The
Blackmedian
or Africanage of residents in Denver is 34 (See Table 3). The
American largest9%
62,757
Nine percent of the residents are African American, four percent Asian, age
Asiangroup is 25 to 34 years old, with 22 percent of the residents.
24,784The 4%
and one percent American Indian. The remaining seven percent are second
Americanlargest
Indian age group is 35 to 44 years old, with 15.5 percent7,326of 1%
another race or two or more races. Approximately 31 percent of the residents. 11 percent of residents are 65 years old or older, and 18 4%
Some Other Race 25,896
Two or More Races 22,701 3%
residents are Hispanic or of Latino origin. percent are under 15 years old.
Hispanic or Latino Origin 204,375 31%
Source: US Census 2014 ACS 1-Year Estimates
Table 2: Denver Population by Race and Ethnicity, 2014 Table 3: Denver Population by Age, 2014
Race/Ethnicity
Race/Ethnicity Number
Number %% Age %
White
White 520,398 78%
520,398 78% Under 5 years 6.8%
Blackor
Black orAfrican
AfricanAmerican
American 62,757
62,757 9%
9% 5 to 14 years 11.4%
Asian
Asian 24,784
24,784 4%
4% 15 to 24 years 11.3%
AmericanIndian
American Indian 7,326
7,326 1%
1% 25 to 34 years 22.1%
SomeOther
Some OtherRace
Race 25,896
25,896 4%
4% 35 to 44 years 15.5%
Twoor
Two orMore
MoreRaces
Races 22,701
22,701 3%
3% 45 to 54 years 11.7%
Hispanicor
Hispanic orLatino
LatinoOrigin
Origin 204,375 31%
204,375 31% 55 to 64 years 10.5%
Source: 65 to 74 years 6.3%
Source:US
Source: USCensus
US Census2014
Census 2014ACS
2014 ACS1-Year
ACS 1-YearEstimates
1-Year Estimates
Estimates
75 to 84 years 3.0%
85 years and over 1.6%
Age
Age %% Median Age 34.2
Under55years
Under years 6.8%
6.8% Source:
Source: US
US Census 2014 ACS
Census 2014 ACS 1-Year
1-Year Estimates
Estimates
55to
to14
14years
years 11.4%
11.4%
15to
15 to24
24years
years 11.3%
11.3%
25to
25 to34
34years
years 22.1%
22.1%
35to
35 to44
44years
years 15.5%
15.5%
45to
45 to54
54years
years 11.7%
11.7%
55to
55 to64
64years
years 10.5%
10.5% Income 2014
65to
65 to74
74years
years 6.3%
6.3% Average Household Income $81,880
75to
75 to84
84years
years 3.0%
3.0% Median Household Income $54,941
85years
85 yearsand
andover
over 1.6%
1.6% Per Capita Income $35,967
MedianAge
Median Age 34.2
34.2 Source: US Census 2014 ACS 1-Year Estimates
Source:US
Source: USCensus
Census2014
2014ACS
ACS1-Year
1-YearEstimates
Estimates
Educational Attainment %
Less than high school graduate 14.5%
10 | Blueprint Denver Update High school graduate 17.6%
Income
Income 2014
2014 Some college or associates degree 23.7%Under 5 years 6.8%
75 to 84 years 3.0%
5 to 14 years 11.4%
85 years and over 1.6%
15 to 24 years 11.3%
Median Age 34.2 25 to 34 years 22.1%
Source: US Census 2014 ACS 1-Year Estimates 35 to 44 years 15.5%
45 to 54 years 11.7%
55 to 64 years 10.5%
65 to 74 years 6.3%
75 to 84 years 3.0%
Education
Income 2014 Income
85 years and over 1.6%
Average Median Age 34.2
Over 85Household Income
percent of residents age 25 or older have a $81,880
high school degree The average household income in Denver is $81,880 (See Table 5).
Median Household Income $54,941
(See Table 4). Forty-four percent of residents have a bachelor’s degree. The median
Source: household
US Census income
2014 ACS 1-Year is $54,941 and the per capita income is
Estimates
Per Capita Income $35,967
$35,967.
Source: US Census 2014 ACS 1-Year Estimates
Table 4: Denver Population by Educational Attainment, 2014 Table 5: Denver Household and Per Capita Income, 2014
Educational Attainment % Income 2014
Less than high school graduate 14.5% Average Household Income $81,880
High school graduate 17.6% Median Household Income $54,941
Some college or associates degree 23.7% Per Capita Income $35,967
Bachelor's degree or higher 44.3% Source:
Source:US
USCensus
Census2014
2014ACS
ACS1-Year Estimates
1-Year Estimates
Source: US Census 2014 ACS 1-Year Estimates
Source: US Census 2014 ACS 1-Year Estimates
Educational Attainment %
Less than high school graduate 14.5%
High school graduate 17.6%
Some college or associates degree 23.7%
Bachelor's degree or higher 44.3%
Source: US Census 2014 ACS 1-Year Estimates
Community Profile | 11Employment There were also six other sectors that increased by over 1,000
jobs or more. These sectors include: Administration and Support;
Total employment in Denver is 600,900 (BEA 2014), which includes
Waste Management and Remediation; Public Administration; Arts,
both sole proprietors and wage and salary jobs. Wage and
Entertainment, and Recreation; Utilities; and Transportation and
salary employment accounts for 77 percent of employment and
Warehousing.
sole-proprietors account for 23 percent. Wage and salary employment
grew by 22,456 jobs since 2002 at an annual rate of 0.4 percent. Over
47 percent of employed Denver residents work in Denver. As a major Shrinking Industries
employment hub attracting workers from throughout the Denver Three sectors lost more than 1,000 jobs (See Figure 8). Information lost
Metro Area and Front Range of Colorado, nearly 70 percent of people 9,259 jobs at an annual rate of -4.1 percent. Manufacturing lost 4,946
employed in Denver live outside the city. jobs at an annual rate of -1.7 percent, and Construction lost 2,532 jobs
at an annual rate of -1.1 percent during the period 2002 to 2014.
Growing Industries
There were five employment sectors that increased by over 5,000 jobs
from 2002 to 2014. Accommodation and Food Services added 11,625
jobs at an annual rate of 2.4 percent. This represents the most jobs
added out of all sectors and the fifth fastest annual growth rate. Health
Care and Social Assistance, another industry that primarily serves the
local economy, added the fourth most number of jobs at 7,032 and
grew at the eighth fastest annual rate at 1.1 percent.
Professional, Scientific, and Technical Services; Management of
Companies and Enterprises; and Mining, Quarrying, and Oil and Gas
Extraction are three sectors that primarily represent export or traded
industries and, thus, are key to driving Denver’s overall economic
growth. Professional, Scientific, and Technical Services added 9,392
jobs and grew at an annual rate of 1.8 percent, the seventh fastest rate.
Management of Companies and Enterprises added 7,553 jobs and grew
at an annual rate of 7.8 percent, the second fastest rate. Finally, Mining
Quarrying, and Oil and Gas Extraction added 5,768 jobs at an annual
rate of 8.2 percent, the fastest rate out of all industries during the
period 2002 to 2014.
12 | Blueprint Denver UpdateName
Change in Employment (2002-2014)
Figure 8: Change in Employment (2002-2014)
-15,000 -10,000 -5,000 0 5,000 10,000 15,000
Accommodation and Food Services 11,625
Professional, Scientific, and Technical Services 9,392
Management of Companies and Enterprises 7,553
Growing
Health Care and Social Assistance 7,032
Mining, Quarrying, and Oil and Gas Extraction 5,768
Administration & Support, Waste Management and Remediation 3,596
Public Administration 3,582
Arts, Entertainment, and Recreation 1,906
Utilities 1,508
Transportation and Warehousing 1,496
Other Services (excluding Public Administration) 1,445
Retail Trade 940
Agriculture, Forestry, Fishing and Hunting 182
Wholesale Trade -283
Stable
Finance and Insurance -378
Educational Services -476
Real Estate and Rental and Leasing -791
Shrinking
Construction -2,532
Manufacturing -4,946
Information -9,259
Source: Bureau of Labor and Statistics; Economic & Planning Systems
Source: BLS; Economic & Planning Systems
H:\153106-Denver Blueprint Plan Update\Data\[153106-Demg&Emp3-mp.xls x]T-Denver Employment_rank
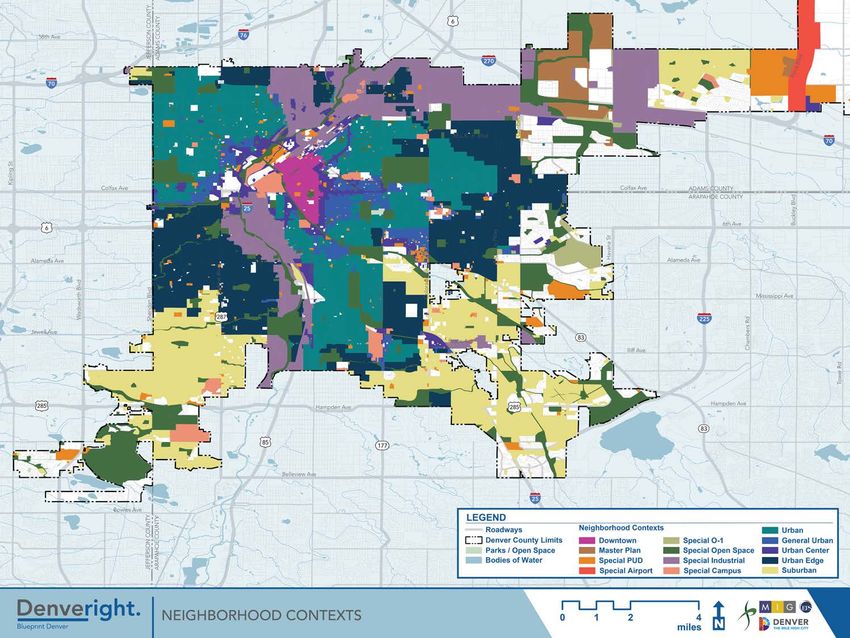
Community Profile | 13Downtown, Urban Center,
Urban and General Urban
neighborhood contexts
are concentrated within
approximately 5 miles of
downtown, then transition to
Urban Edge and Suburban.
*Source: Denver Zoning Code; adopted in 2010
Note: For properties that were not included in the
Figure 9: Neighborhood Contexts comprehensive update in 2010, zoning is governed
by Former Chapter 59 of the Denver Revised
Municipal Code, 1956.
14 | Blueprint Denver UpdateHistory and Organization of Neighborhoods Denver’s Neighborhood Contexts
Part of Denver’s appeal and reputation as a desirable city rests upon Neighborhoods and residential areas are a key building block
its great neighborhoods. The city has 78 statistical neighborhoods of Blueprint and were utilized as an organizing factor in the 2010
that were established along census tract lines in the 1970s. The form-based update to Denver’s zoning code which identifies six
data and comparisons presented in this profile are based on these neighborhood contexts and other special contexts and districts
neighborhoods. In addition, we have a robust culture of Registered (See Figure 9). The context-based approach helps set standards for
Neighborhood Organizations (RNOs) formed by residents and property compatible development throughout the city. The neighborhood
owners that play an active role in the ongoing effort to make Denver a contexts are distinguished from one another by their physical and
great place to work and live. functional characteristics including but not limited to: street, alley and
block patterns; building placement and height; diversity, distribution
Denver’s diverse variety of neighborhoods includes historic districts, and intensity of land uses; and diversity of mobility options.
more contemporary infill, apartment and condominium areas, quiet
residential streets with more traditional single family homes, and, in Denver’s neighborhood contexts and typical characteristics are:
some cases, neighborhoods that combine several of these qualities as
they evolve and change. • The Suburban Neighborhood Context consists of curving streets
with varied block shapes and sizes. It is predominantly single-family
While suburban-style neighborhoods comprise many areas of the residential with commercial uses accommodated in shopping
city, Denver also has the unique advantage of numerous established centers.
neighborhoods very close to the downtown core. In many cases these
• The Urban Edge Neighborhood Context is characterized by a mix
areas developed around Denver’s early streetcar system that had, of elements from both the Suburban and Urban contexts, including
at its peak, approximately 260 miles of tracks throughout the city curving and grid street patterns, single family residential uses and
with 31 lines of service. Although the streetcar lines were completely commercial shopettes.
discontinued by the mid 1950s, the small business districts that formed
around them at key nodes are still visible today. Indeed, several of • The Urban Neighborhood Context is primarily characterized by a
these areas are at the core of our city’s most popular neighborhoods. regular street grid, single-unit and two-unit residential uses, small-
scale multi-unit residential uses and embedded commercial areas
including main streets and corner stores.
• The General Urban Neighborhood Context consists of primarily
multi-family residential in a variety of building forms (e.g. urban
houses, rowhouses, and apartment buildings), as well as single-family
and two-family residential uses. A grid and alley block pattern
predominates; these areas offer better multi-modal options, and
commercial areas are both embedded in the neighborhood and
located along busier, mixed-use arterials.
Community Profile | 15• The Urban Center Neighborhood Context consists primarily of mixed-use areas, containing both multi-family residential and commercial uses, often within the same building or same block. Urban Centers are found along major corridors, at transit station areas, or near and around downtown, and support high pedestrian activity, multi-modal transportation. • The Downtown Neighborhood Context consists of mixed-use residential, office, commercial and retail uses in large buildings, including the area’s historic districts. The Downtown context functions as a transit hub and supports high pedestrian activity. • Special Contexts and Districts are areas that typically serve a principal purpose such as industrial, open space, campus, or master planned areas. The most prominent neighborhood contexts in Denver today are Urban, Urban Edge, Suburban and Special Industrial. Not surprisingly, the Downtown neighborhood context is concentrated in the central city and is largely surrounded by General Urban and Special Industrial contexts. The I-70 and I-25 corridors traverse Special Industrial and Urban Edge contexts through the core of Denver, but then move through Urban to the west and Suburban context to the south, respectively. Of the six primary neighborhood contexts, Urban Center is the least prevalent and is largely concentrated along historical commercial corridors and at emerging RTD rail station areas.
3
                                                         KEY OBSERVATIONS
SECTION 3                                                • The annual rate of population growth in Denver, (2.2%) was higher than
                                                           the Denver Metropolitan Statistical Area (MSA) (1.9%) from 2005 to 2014;

The Competitive                                          • Denver was the fifth fastest-growing large city (population > 250,000) in
                                                           the nation in 2014 and the third fastest city in the U.S. from 2005-2014;

Landscape                                                • The distribution of residents by age in Denver is almost identical to the
                                                           comparison cities;
                                                         • Residents’ age 25 to 34 years is the largest age group in all comparison
                                                           cities and accounts for over 20 percent of residents in all those cities but
                                                           one, Salt Lake City;
                                                         • Denver increased by approximately 60,000 residents’ age 25 to 34 years
Overview                                                   old, which is over half the total amount of population growth in the city;
                                                         • Denver permitted the third most residential units amongst its peer cities
Denver, like many other large cities in the U.S., is       with 7,900 units in Denver in 2015;
experiencing an urban renaissance as more people         • Unlike recent population growth, employment growth in the comparable
                                                           cities, including Denver, has been slower in these cities than their
are choosing to live and work in the primary city of a     surrounding MSA;
region. The primary cities in the U.S.’s largest metro   • Employment in Denver grew at the fifth slowest rate of the six cities;

areas grew by a faster rate in recent years than         • The average housing price in the Denver metro area has increased by the
                                                           highest percent (60%) since 2010 of all cities and their MSAs;
their surrounding suburbs, which is the first time       • The average rental rate in Denver has grown by the highest percentage
                                                           than any of the comparable cities; and
this has happened since the 1920s. To understand
                                                         • Despite the large increase in housing costs in Denver, the median home
how Denver compares to its peer cities in the U.S.,        value in Denver is 40 percent lower than it is in Seattle.
an analysis of a variety of measures was completed
                                                         KEY FINDINGS
to understand Denver’s strengths and what trends
                                                         • Denver has very similar attributes to its peer cities as all have seen a
Denver may need to address within the Blueprint            recent resurgence in desirability as a place to live, especially for younger
                                                           people;
Denver. Denver’s comparable U.S. cities include          • Despite the recent growth in residents in central cities, employment
Austin, Minneapolis, Portland, Salt Lake City, and         growth is faster in the surrounding suburbs in each city’s MSA. This is true
                                                           for Denver as the rate of employment growth is slower than the metro
Seattle.                                                   area and slower than all but one of the comparison cities. However,
                                                           employment growth in Denver in the past two to three years has
                                                           accelerated; and
                                                         • Denver was previously relatively low cost compared to some of its peer
                                                           cities, but the rapid growth in housing costs for both for-sale homes and
                                                           for-rent homes, faster than all peer cities, has begun to turn Denver into
                                                           one of the more expensive cities.

                                                                                                                  Community Profile | 17
Comparable City Snapshot
Population
The rate of population growth in Denver (2.2%) was higher than the
Denver Metropolitan Statistical Area (MSA) (1.9%) from 2005 to 2014.
Four of the cities, including Denver, grew at a faster rate than their
metro areas in terms of population. Austin and Salt Lake City grew at
a slower rate. However, Austin was the fastest growing city by total
population and rate of growth, despite growing slightly slower than its
surrounding communities. Denver was the third fastest-growing city
from 2005 to 2014 (See Table 6).
Table 6: Peer City Population, 2005 to 2014
2005-2014
Description 2005 2014 Total Ann. # Ann. %
Cities
Austin, TX 678,457 912,798 234,341 26,038 3.4%
Seattle, WA 536,946 668,337 131,391 14,599 2.5%
Denver, CO 545,198 663,862 118,664 13,185 2.2%
Portland, OR 513,627 619,445 105,818 11,758 2.1%
Minneapolis, MN 350,260 407,181 56,921 6,325 1.7%
Salt Lake City, UT 182,670 190,873 8,203 911 0.5%
MSAs
Austin-Round Rock, TX Metro Area 1,406,364 1,943,299 536,935 59,659 3.7%
Seattle-Tacoma-Bellevue, WA Metro Area 3,133,715 3,671,478 537,763 59,751 1.8%
Denver-Aurora, CO Metro Area* 2,327,901 2,754,258 426,357 47,373 1.9%
Portland-Vancouver-Beaverton, OR-WA Metro Area* 2,063,277 2,347,127 283,850 31,539 1.4%
Minneapolis-St. Paul-Bloomington, MN-WI Metro Area 3,076,239 3,495,176 418,937 46,549 1.4%
Salt Lake City, UT Metro Area 1,017,572 1,153,340 135,768 15,085 1.4%
Source: U.S. Census Bureau; Economic & Planning Systems
Source: Census; Economic & Planning Systems
18 | Blueprint Denver UpdateDenver’s distribution of residents by age is almost identical to the
comparison cities. Residents 25 to 44 years-old is the largest age group
in all cities and accounts for over 20 percent of residents in all cities
except Salt Lake City. The 25 to 44 age group also grew by the largest
amount between 2005 and 2014 - approximately 60,000 residents (See
Figure 10) - which is over half the total amount of the city’s population
growth. Only Austin increased in population in this age group more
due to its millennial population increase.
Figure 10: Peer City Change in Population by Age, 2005 to 2014
Source: U.S. Census Bureau; Economic & Planning Systems
Community Profile | 19Housing Population growth in these cities has increased housing demand and,
therefore, housing costs. The average housing price in the Denver
Denver’s annual number of residential permits matched closely with
metro area has increased by the highest percent (60%) since 2010 of
most of the comparison cities from 2002 to 2011. Between 2002 and
all cities and their MSA’s (See Figure 12). Prior to 2010, Denver lagged
2015, Austin and Seattle had the highest permit rate (See Figure 11).
behind its comparable cities in the rate of price increases prior to the
Denver’s permit rate began to catch up with the rates in these cities in
recession. Denver also had a lower rate of price decreases due to the
2012 to 2015, but is still lower. Denver permitted approximately 7,900
recession.
Total
units inPermitted Units
Denver in 2015. Austin- permitted
City 10,000 units and Seattle
permitted 11,300.
The average rental rate in Denver has increased the greatest compared
to the other six cities. Rental rates have increased by over 50 percent
since 2010, slightly lower than the increase of home prices (See Figure
13).
Figure 11: Peer City Housing Units Permitted, 2002 to 2015
Change from 2002
Denver, CO Austin, TX Minneapolis, MN Portland, OR Seattle, WA Salt Lake City, UT
14,000
12,000
10,000
8,000
6,000
4,000
2,000
0
2002 2003 2004 2005 2006 2007 2008 2009 2010 2011 2012 2013 2014 2015
Source: U.S. Census Bureau; Economic & Planning Systems
20 | Blueprint Denver UpdateDenver vs. Nation - Housing Price Index, 2010-2016
Figure 12: Peer City Freddie Mac Housing Price Index, 2010 to 2016
Denver-Aurora-Lakewood, CO Austin-Round Rock, TX
Minneapolis-St. Paul-Bloomington, MN-WI Portland-Vancouver-Hillsboro, OR-WA Home Price Index
Salt Lake City, UT Seattle-Tacoma-Bellevue, WA (Base Year 2010)
National
170%
160%
150%
140%
130%
120%
Denver vs. Nation - Rental Price Index, 2010-2016 110%
100%
90%
80%
2010 2011 2012 2013 2014 2015 2016
Source: Freddie Mac; Economic & Planning Systems
Figure 13: Peer City Zillow Rent Rate Index, 2010 to 2016
Rental Price Index
Denver, CO Seattle, WA Salt Lake City, UT Austin, TX Portland, OR Minneapolis, MN (Base Year 2010)
160%
150%
140%
130%
120%
110%
100%
90%
2010 2011 2012 2013 2014 2015 2016
Source: Zillow; Economic & Planning Systems
Community Profile | 21The comparison of housing costs in a community to income is one
measurement of housing affordability in a city. In 2014, Denver’s median
home value was $283,100 and its median income was $54,941; the
ratio of median home value to median income was 5.15, down from a
2005 value of 5.47. Using this metric, Denver is more expensive than
Minneapolis with a ratio of 4.02 and Austin with a ratio of 4.38 and has
similar level of affordability to Salt Lake City with a ratio of 5.11. Denver
is less expensive than Portland with a ratio of 5.7 and Seattle, the most
expensive peer city, with a ratio of 6.67 (See Table 7).
Table
Denver vs. Nation - Median Home Value to Income, 2005 - 2014
153106-Denver
Table Blueprint
7: Peer City Median Plan
Home Update
Value to Income, 2005-2014
2005-2014
Description 2005 2014 Total Ann. # Ann. %
Cities
Austin, TX 3.91 4.38 0.47 0.05 1.3%
Portland, OR 5.34 5.71 0.37 0.04 0.7%
Salt Lake City, UT 4.84 5.11 0.27 0.03 0.6%
Denver, CO 5.47 5.15 -0.32 -0.04 -0.7%
Seattle, WA 7.81 6.67 -1.14 -0.13 -1.7%
Minneapolis, MN 5.42 4.03 -1.40 -0.16 -3.3%
MSAs
Austin-Round Rock, TX Metro Area 3.19 3.43 0.24 0.03 0.8%
Portland-Vancouver-Beaverton, OR-WA Metro Area* 4.64 4.60 -0.04 0.00 -0.1%
Salt Lake City, UT Metro Area 3.63 3.80 0.17 0.02 0.5%
Denver-Aurora, CO Metro Area* 4.36 4.14 -0.22 -0.02 -0.6%
Seattle-Tacoma-Bellevue, WA Metro Area 5.28 4.70 -0.58 -0.06 -1.3%
Minneapolis-St. Paul-Bloomington, MN-WI Metro Area 3.95 3.13 -0.82 -0.09 -2.6%
Source: US Census; Economic & Planning Systems
Source: Census; Economic & Planning Systems
22 | Blueprint Denver Update
\\COBO-FRIGATE\project_files\Blueprint-Denver\04_Reports\Community Profile\_Draft\9-20-16 Draft to Task Force\Comments\[153106-BluePrint Denver_ForMIG_10.11.2016.xlsx]T-Home Value to IncomeIncome
From 2005, Denver’s median household income grew by an annual
rate 2.9 percent; a growth rate only surpassed by Austin at 3.3 percent
and Seattle at 2.9 percent. In 2014, Denver’s median household income
was $54,941, again only behind Austin and Seattle, with Seattle having
a significantly higher median income of $70,975. While city median
income still lags behind the median income of their corresponding
MSA, income growth in all peer cities - except Salt Lake City - outpaced
the MSA. The Denver MSA grew at an annual rate of 2.2 percent (See
Table8).
Table
Devner vs. Nation - Median Houshold Income Change, 2005-2014
153106-Denver
Table 8: Peer CityBlueprint Plan Update
Median Household Income Change, 2005-2014
2005-2014
Description 2005 2014 Total Ann. # Ann. %
Cities
Seattle, WA $49,297 $70,975 $21,678 2,409 4.1%
Austin, TX $43,731 $58,458 $14,727 1,636 3.3%
Denver, CO $42,370 $54,941 $12,571 1,397 2.9%
Portland, OR $42,287 $54,624 $12,337 1,371 2.9%
Salt Lake City, UT $37,287 $46,711 $9,424 1,047 2.5%
Minneapolis, MN $41,829 $50,791 $8,962 996 2.2%
MSAs
Seattle-Tacoma-Bellevue, WA Metro Area $54,962 $71,273 $16,311 1,812 2.9%
Austin-Round Rock, TX Metro Area $50,484 $63,603 $13,119 1,458 2.6%
Denver-Aurora, CO Metro Area* $54,896 $66,870 $11,974 1,330 2.2%
Portland-Vancouver-Beaverton, OR-WA Metro Area* $49,227 $60,248 $11,021 1,225 2.3%
Salt Lake City, UT Metro Area $48,993 $62,642 $13,649 1,517 2.8%
Minneapolis-St. Paul-Bloomington, MN-WI Metro Area $59,691 $69,111 $9,420 1,047 1.6%
Source:
Source: US Census;
Census; Economic
Economic & Planning
& Planning Systems
Systems
\\COBO-FRIGATE\project_files\Blueprint-Denver\04_Reports\Community Profile\_Draft\9-20-16 Draft to Task Force\Comments\[153106-BluePrint Denver_ForMIG_10.11.2016.xlsx]T-Peer City Income
Community Profile | 23Education
Denver vs. Nation - Educational Attainment 25+ Population
Denver has similar educational attainment as its peers, with the
Change, 2005-2014
percent of residents 25 or older with a bachelor’s degree or higher
in the mid-40s. Seattle represents an outlier with 58.9 percent of its
residents over 25 having a bachelor’s degree or higher. Since 2005, the
population of residents with at least a bachelor’s degree has increased
by 40 percent or by over 60,000; only Austin and Portland had a larger
percentage increase. While Denver’s education levels are comparable
to its peers, it does have the highest percentage of residents with less
than a high school education at 14.5 percent (See Figure 14)
Figure 14: Peer Cities Educational Attainment 25+, 2005-2015
Change in Population
Less than high school graduate High school graduate Some college or associates degree Bachelor's degree or higher
120,000
100,000
80,000
60,000
40,000
20,000
0
-20,000
Denver, CO Austin, TX Minneapolis, MN Portland, OR Salt Lake City, UT Seattle, WA
Source: U.S. Census; Economic & Planning Systems
24Source: Census;
| Blueprint Economic
Denver Update& Planning Systems
\\COBO-FRIGATE\project_files\Blueprint-Denver\04_Reports\Community Profile\_Draft\9-20-16 Draft to TaskYou can also read