The 30 billion dollar whim - A review of the Reserve Bank consultation paper: 'How much capital is enough' - Tailrisk Economics
←
→
Page content transcription
If your browser does not render page correctly, please read the page content below
The 30 billion dollar whim
A review of the Reserve Bank
consultation paper: ‘How much capital
is enough’

                                        1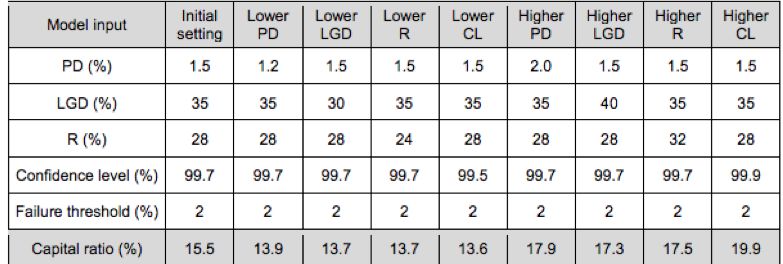
About Tailrisk economics
Tailrisk economics is a Wellington economics consultancy. It specialises in the
economics of low probability, high impact events including financial crises and
natural disasters. Tailrisk economics also provides consulting services on:

  The economics of financial regulation

  Advanced capital adequacy modelling

  Stress testing for large and small financial institutions

  Regulatory compliance for financial institutions

  General economics.

  Principal Ian Harrison (B.C.A. Hons. V.U.W., Master of Public Policy SAIS Johns
Hopkins) has worked with the Reserve Bank of New Zealand, the World Bank, the
International Monetary Fund and the Bank for International Settlements. In his time
at the Reserve Bank Ian played a central role in developing an analytical approach to
financial system risk issues.

Contact: Ian Harrison – Principal Tailrisk economics

  e-mail:harrisonian52@gmail.com

  Ph: 022 175 3669

                                                                                    2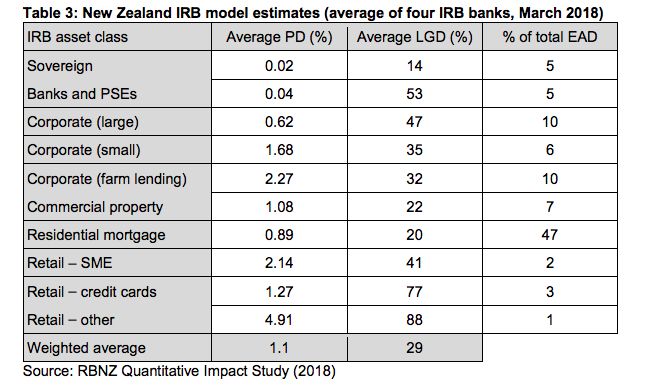
The 30 billion dollar whim
A review of the Reserve Bank consultation paper
‘How much capital is enough’

“We are going to build a great big beautiful capital wall - and Australia
is going to pay for it”

Part one: Introduction

On 14 December 20181 the Reserve Bank of New Zealand released a discussion
document ‘How much capital is enough’, which proposes an increase in the
minimum common equity tier one (CET1) capital ratio to 16 percent. As banks will
need to hold a buffer over that minimum, the practical effect will be to increase the
banks’ average capital ratio from the current level of around 11 percent to around
18 percent, a seven percentage point increase2. There will also be an increase in
capital calculation floors and adjustment ratios that will further increase required
capital.

The justification for the higher capital ratio is based on what is represented as a new
approach to setting the regulatory capital ratios - ‘the risk appetite framework’. The
Reserve Bank says that this follows from a consideration of the words in part 68 of
the Reserve Bank Act, which reads:
The powers conferred on the Governor-General, the Minister, and the Bank by this Part shall
be exercised for the purposes of—
    (a) promoting the maintenance of a sound and efficient financial system

The Bank argues that the financial system is ‘sound’ if ‘there is enough capital in the
system as a whole to cover losses that are so large that they might only occur very

1 On 25 January 2019 the Reserve Bank issued an updated version of the consultation paper but there do not
appear to be any changes that would affect the analysis in this paper.
2 The bank may be able to reduce some of their current tier one capital that no longer counts for regulatory
purposes but some of it will be ‘stranded’. We have assumed that half will recalled so the net effect of the policy
changes will be a 6 percentage point capital increase.

                                                                                                                  3
infrequently’. Infrequently is quantified as a one in 200 probability. It is claimed that
regulatory capital of 16 percent is required to reduce the probability to this level.
The capital implication of word ‘efficient’ in the Act is considered separately. It is
considered in more conventional terms, requiring a balancing of the costs of the
higher capital and the benefits from having higher capital.

If the ‘soundness’ and ‘efficiency’ analyses generate different answers, then the
soundness criteria rules, and some inefficiency should be tolerated for the sake of an
appropriate level of soundness.

But, happily, according to the Bank, there is no such conflict – there are
improvements from both a soundness and efficiency perspective, so there is a ‘win-
win’ situation.

The costs of the policy receive little attention. It is admitted that the higher capital
requirements could make it more expensive for New Zealanders to borrow, but the
Bank claims that the impact will be ‘minimal’ and that they have taken it into
account. However, even on the Bank’s own assessment of 8.2 basis points3 for each
percentage point increase in the capital ratio, the cost to New Zealand will not be
minimal. It is likely to cost around $1.5 billion per year, and possibly more.
The present value of the cost of the policy could reasonably be assessed at $30
billion.

A medium size business with a loan of $5 million could be paying $50,000 additional
interest a year. A homeowner with a $400,000 mortgage could be paying an
additional $1,000 or more a year. The Reserve Bank has not taken borrowers direct
costs into account. The ‘soundness’ test which is driving the policy explicitly excludes
any consideration of cost. The foreign cost benefit analyses, which the bank seems
to have relied on in its ‘efficiency’ assessment, also ignore borrowers’ increased
costs.

 $30 billion is a lot of money, and Australia is not going to pay for it. It could fund for,
example: huge improvements in the national roading system; $10,000 subsidies for
three million electric cars; or, if you are quite detemined to waste the money, a 1000
km wall on the southern US border. Given competing claims on scarce resources the
capital increase should only proceed if you are reasonably sure that the benefits will
well exceed the costs. The burden of that proof should sit with the Reserve Bank.

3 This is the number that appears in the decision document. A figure of 6 basis points appears in the consultation
document but there is no explanation for the difference. Assuming a 5-percentage point increase and $430
billion of bank lending the annual cost is $1763 million.

                                                                                                                4
The central question that is addressed in this paper is whether the benefits, (‘being
more resilient to economic shocks’) are worth more than $30 billion. Our assessment
is that very clearly, they are not. New Zealand could secure nearly all of the benefits
of higher capital by increasing tier two capital, as the Australians are proposing to
do, at about one fifth of the cost of the Reserve Bank’s proposal. The Reserve Bank
does not appear to have considered this option.
The key driver behind the 16 percent capital ratio proposal is the Bank’s assessment
that the banking system is ‘unsound’ because the risk of failure is worse than 1:200,
which is at odds with rating agencies and informed analysts’ assessments. However,
the Bank now says it has alternative facts.
The Bank trumpets the breadth and dept of their analysis supporting their decision.
One of the purposes of this paper is to ‘fact check’ the Reserve Bank’s claims. We
have made ‘Pinocchio’4 assessments of the Bank’s more public statements on the
capital adequacy proposals in an accompanying paper.
This paper proceeds as follows. Part two sets out the key conclusions from our
analysis. Part three looks at the logic of the ‘risk appetite’ approach, and considers
the evidence presented by the Bank that a 16 percent minimum capital ratio is
necessary to reduce the probability of a ‘crisis’ to one in two hundred years.
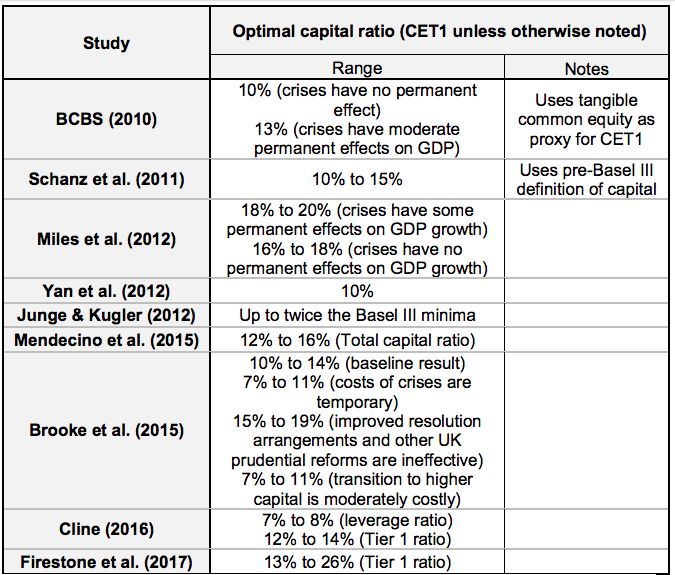
Part four examines the evidence on the ‘efficient’ level of capital, and in particular it
revisits the Reserve Bank’s analysis presented in its 2013 Regulatory Impact
Statement on the application of the Basel III rules to New Zealand. This analysis
suggested that the optimal (tier one) capital ratio was 13 percent, which is about
where the banking system is now. Part five looks at the Reserve Bank’s discussions
of its stress test results, and what this tells us about the soundness of the New
Zealand banking system. The next part takes a closer look at the benefits, in the
New Zealand context, of increasing CET1 capital from 11 to 18 percent, focusing on
the costs of financial crises. Part seven briefly considers the Australian approach of
increasing tier two capital.
The Reserve Bank also says that it is inclined to introduce a new minimum capital
requirement based on the leverage ratio. Here the Bank has made a 180 degree turn
from its initial position. When a leverage ratio was proposed by the Basel Committee
just after the GFC, the Bank made a submission opposing its introduction. It then
declined to apply it to New Zealand banks when it became part of the Basel
framework. The Reserve Bank was supported in this (privately) by APRA, who also
4 The Pinocchio assessments broadly follow the Washington Post fact Checker methodology. The assessment
document is available at tailrisk.co.nz
5
opposed the leverage ratio, but had to go along because they were a member of the
Basel Committee. Put briefly and bluntly, the leverage ratio is a silly idea. It will
achieve nothing, but might confuse members of the public and analysts if they were
to look at it. We will set out the arguments in a subsequent paper.

Part two: Key conclusions

1. The ‘risk tolerance’ approach is a backward step that ignores a consideration
   of both the costs and benefits of the policy
   The soundness test is based on an arbitrarily chosen probability of bank failure
   that ignores the cost of meeting the target. The Bank has ignored its own cost
   benefit model which did take the probability of bank failure, the costs of a
   failure, the interest rate costs of higher capital and societal risk aversion into
   account.

 2. Bank decision based on fabricated evidence
    The Banks’s decision to pursue a 1:200 failure target was purportedly based on
    evidence from a version of the Basel advanced model. It was manipulated to
    produce the right answer. Initially, a 1:100 target was proposed, but when this
    couldn’t generate a capital increase, the target was switched to 1:200 at the last
    minute.

    The Bank’s model inputs were not credible. It was assumed that all loans were
    higher risk business loans and that the probability of loan default, a key model
    input, was more than two and a half times the estimates the Reserve Bank has
    approved banks to use in their capital modelling.

    The Bank’s analysis was embarrassingly bad, so it attempted to cover this up
    with a subsequent information paper that was written after the decision was
    made, and after the Consultation paper was released. It reached the same
    conclusion on the required level of capital, but only by assuming a 1:333 failure
    probability, and by using model inputs that were still not credible.

3. A 1:200 target can be met with a capital ratio of around 8 percent
   If the Basel model were rerun using credible inputs if would probably show that
   a 1:200 failure rate can be met with a capital ratio of around 8 percent.

                                                                                        6
4. The policy will be costly
The Bank has down played the interest rate impact of the policy, saying any
increases will be ‘minimal’. Based on its own assessment of the interest rate
impact, the annual cost will be about $1.5-2 billion a year. The present value of
the cost of the policy could be in excess of $30 billion.
A homeowner with a $400,000 mortgage could be paying an additional $1,000 a
year. A business with a $5 million loan could be paying an additional $50,000.
5. The Bank’s assessment that the banking system is currently unsound is at odds
with rating agency assessments and borders on the irresponsible
The rating agancies’ assessment of the four major banks is AA-, suggesting a
failure rate of 1:1250. The Bank is now saying that, at current capital ratios, the
banking system is ‘unsound’ because the failure rate is worse than 1:200. Or in
other words the New Zealand banking system is not too far from ‘junk’ status.
The international evidence does not support the Bank’s contention that the
probability of a crisis is worse than 1:200. The Bank has ignored the fact that
banks will need to hold an operating margin over the regulatory minimum, and
has not adjusted New Zealand capital ratios to international standards to make a
fair like-for-like comparison.
6. The Bank‘s analysis ignores the fact that the banking system is mostly foreign
owned
Foreign ownership increases the cost of higher capital because the borrowing
cost increases flow to foreign owners. Foreign owners will support their
subsidiaries in certain circumstances, which reduces the probability of a bank
failure. There is little point in having a higher CET1 ratio than Australia, because
if a parent fails then it is highly likely that the subsidiary will also fail, because of
the contagion effect. A New Zealand subsidiary might still appear to have plenty
capital, but depositors will run and the Reserve Bank and government will have
to intervene.
7. The Australian option of increasing tier two capital has been ignored
APRA is proposing to increase bank capital by five percentage points, but will
allow banks to use tier two capital to meet the higher target. This provides the
same benefits, in a crisis, as CET1 capital, but at about one fifth of the cost. New
Zealanders will be required to spend an additional $1.2 billion a year in interest
costs for almost no benefit in terms of more resilience to a severe crisis.
78. The benefits of higher capital are modest
Most of the costs of a banking failure are due to borrowing decisions made before
the downturn. This will impose costs regardless of the amount of capital held.
With current levels of bank capital failures will be rare, with the main cost likely to
be a government capital injection. The experience with most banking crises, in
countries most like New Zealand, is that governments have recovered most of
their costs when the bank shares are subsequently sold.
9. The Bank is mis-selling insurance
The Bank is selling a form of insurance to the New Zealand public, but it vague
about the premium costs and has exaggerated the benefits. The premium is the
$1.5-2 billion. The benefit would be around a 10 percent reduction in the
economic cost of a financial crisis, with an expected return of a few tens of
millions.
An informed, rational public would not buy this policy.
10. New Zealand banks already well capitalised compared to international norms
A recent PricewaterhouseCoopers report argued that if New Zealand bank capital
ratios were calculated using international measurement standards they would be
6 percentage points higher, placing New Zealand in the upper ranks of well
capitalised banking systems. The Reserve Bank critised some details in the report,
but has not produced is own assessment as Australia’s APRA has done.
11. The Bank has forgotten about the OBR
The Open Bank Resolution (OBR) bank failure mechanism, was originally
conceived as a substitute for higher capital to reduce fiscal risk, and to reduce
the costs of a bank failure. While banks are been required to spend almost $1
billion on outsourcing policies to supportthe OBR, it does not appear in the
capital review at all - despite the Governor’s arguments that the main
justification for capital increases is to reduce fiscal risk.
8Part three: The risk appetite framework
The soundness test
The distinctive feature of the soundness test in the risk appetite framework is that it
does not require a consideration of the costs and benefits of bank capital. A
probability of crisis is chosen, and as long as it can be reasonably described as
‘sound’, it will do. The Bank just happen to have choosen 1:200, but they could just
as reasonably have chosen, say, 1:100, or a higher number. Different numbers will
delivering very different minimum capital results. The word ‘sound’ does not
naturally link to any particular probability.
The arbitrariness of the Bank’s choice of 1:200 is obvious. In the risk appetite paper5
that went to the Banking Steering Group for decision, a ratio of 1:100 was suggested,
with 1:200 appearing as an alternative, but just in a footnote. In the event 1:200 was
chosen6 apparently on the Governor’ whim, because it was more ‘conservative’ than
1:100. This is obviously true, but that does not get us very far. A probability of
1:1000 or 1;1000,000 are both more conservative than 1:100 but that does not
mean that they should be adopted. There is no evidence of any analysis on the
relative costs and benefits of the 1:100 and 1:200 options. With a 1:100 target the
tier one capital ratio, even on the Bank’s modelling, would have been 12-13 percent,
suggesting no change in policy settings. Which is probably why the 1:100 target was
dropped at the last minute.
The efficiency test
Under the ‘efficiency’ test, however, the Bank should consider all of the risks, costs
and benefits (which involves a consideration of the probability and costs of avoided
crises) of different capital levels, which, in principle, should lead it to the right
answer. The separate ‘soundness’ test adds nothing to the exercise, because the
probability of a financial crisis is already considered under efficiency.
Soundness trumps efficiency
However, because the soundness test ‘trumps’ the efficiency test if the latter
delivers a lower result, it is only the soundness test that matters. Efficiency only
comes into play if it delivers a higher ratio, and the Bank is not making that claim.
5 Susan Guthrie ‘Risk Appetite framework used to set capital requirements’ Paper to FSG. 30 October 2018
6 Susan Guthrie ‘Capital ratio calibration’ Memorandum for Financial Oversight Committee
9The Reserve Bank’s ‘risk appetite’ approach simply doesn’t make sense. Why would
anyone make a decision based on a balancing ot cost, benefits and risk, then ignore
all that in favor of an arbitrarily chosen probability of having a crisis?
What is interesting here is just how late the ‘risk appetite’ framework was in making
an appearance. After more than two years of consideration of the regulatory capital
ratio, it first appears on 7 November 20187, a little more than a month before the
consultation paper was released. As for the paper, we won’t get into the detail here,
but we found it a combination of muddle, unsubstantiated assertions and vacuity.
The following statement illustrates the point.
“Soundness” and “efficiency” have a reasonably clear meaning in everyday language – if it
was applied to the family car it would mean it doesn’t break down and filling the tank fits
easily within the weekly budget
A family car that doesn’t break down too often and doesn’t use to much petrol could
cost anywhere from $5,000 to $60,000. The ‘sound and efficient’ metric doesn’t
help in making the purchase decision. It ignores the vital cost element – as in
practice does the Reserve Bank’s risk tolerance framework.
It appears that the risk tolerance framework is someones, late, ‘bright idea’, and that
the staff have then scrambled to wrap some ‘intellectual substance’ and ‘analytical
and empirical’ support around it.
New Zealand banking system is currently unsound?
If we accept the Bank’s assertion that a regulatory capital ratio of 16 percent, and an
actual ratio of closer to 18 percent8 is required to deliver ‘soundness’, then it follows
that the New Zealand banking system, with a CET1 ratio of around 11 percent is
currently unsound.
As recently as November 2018, in its Financial Stabilty report the Bank said
(repeating its public assessments in all of its RSR reviews) that the system was sound.
But now, apparently, on the basis of the analysis presented in the consultation
document the Bank has come to a different view. The system is unsound.
The Bank does not say what the current probability of a crisis is with the current
level of capital, but assuming that it is, say, 1:125, this would equate to a credit
rating of somewhere between BBB and BBB-9. However, based on the AA- credit
7 ‘Risk appetite framework used to set capital requirements’ paper to FSO.
8 We have assumed that banks will maintain an operating margin over the minimum of 2 percentage points.
9 Widdowson D. Wood A. 2008 ‘A users guide to credit ratings’
10ratings of the four large banks, New Zealand had a AA- system with an implied failure
rate of 1:1250. Of course the banks’ stand alone ratings are lower, and it would be
legitimate to ‘deduct’ the implied support from the New Zealand government, but
the implied support from the Australian parents is obviously relevant to an
assessment of financial strength of the system. Stripping out the New Zealand
government support might give us an A rating, with a implied failure rate of 1:750,
stil well ahead of the Bank’s assessment.
The Reserve Bank Governor attemped to address this issue in a recent speech10
Banks also hold more capital than their regulatory minimums, to achieve a credit rating to do
business. The ratings agencies are fallible however, given they operate with as much ‘art’ as
‘science’.
Bank failures also happen more often and can be more devastating than bank owners – and
credit ratings agencies – tend to remember.
The inference here is that rating agencies’ default probability assessments are
understated because they have forgotten about historic defaults is simply untrue.
Say what you will about the agencies’ rating methodologies, but they are assiduous
about long-term data collection. They haven’t forgotten past history.
The question is, who is right. Is the New Zealand banking system uncomfortably
close to ‘junk’ status, as the Bank seems to be suggesting, or are the rating agencies
more or less right in their assessments?
The Bank provided two sets of evidence to support its new perspective on banking
system risk. The first is evidence from the international ‘literature’ on the probability
of financial crises. The second is, evidence from its ‘portfolio modelling’ of New
Zealand bank risk.
The international evidence
The Bank concluded that on the basis of the international studies it has reviewed
that:
‘there is a consistency in the findings that suggest that Tier 1 capital equal to or exceeding 16
percent of RWA is needed to limit the probability of a crisis to 1 in 200 years or thereabouts’.
RBNZ Bulletin Vol. 71 No. 3
10 Address to Business NZ CEO forum 30 November 2018
11We have reviewed these studies in detail, first making two adjustments to the
measurement of capital in our assessments.
Actual capital not regulatory minimum
All of the studies cited consider the actual level of bank capital, not the regulatory
minimum, so we have to adjust the proposed minimum to the actual amount of
capital banks are likely to hold. If we assume that banks will hold a 2 percentage
point operating buffer over the minimum, then this implies an 18 percent actual
ratio is required to meet the 1:200 standard.
Adjust New Zealand capital to international standards
We have to compare like-with-like when applying the international default evidence
to New Zealand. So we need to adjust the reported New Zealand capital ratios to
international capital measurement standards when looking at foreign studies based
on historical capital ratios.
A recent comprehensive study by PricewaterhouseCoopers (PWC)11 argued that if
New Zealand banks’ capital ratios were restated using international measurement
conventions, they would be 6 percentage points higher. The Reserve Bank12 went to
considerable effort to discredit the PWC analysis, on matters of detail, but, unlike
APRA, they did not produce their own ‘official’ version to put the technical
arguments to rest. One of the points the Bank made in their review was that PWC
conducted a comparitive exercise for Australia that produced an adjustment figure
that was one percentage point higher than the APRA estimate. To account for
possible upward bias in the PWC adjustment estimate we have reduced it by two
percentage point to four percentage points.
The Reserve Bank also argued that some of the higher capital accounts higher risk
characteristics of the New Zealand financial system that are not captured by the
Basel risk measurement framework. The Bank has often made this claim but has
never substantiated it with any analysis. On the empirical and analytical evidence it
does not appear to be true.
11PricewaterhouseCoopers “International comparability of the capital ratios of New Zealand’s major banks’
October 2017
12 ‘International comparison of capital ratios (PwC report)’. Information paper 6 December 2017. ‘2017PwC
(NZ) study’. Information paper with more details. 8 May 2018.
12Taking the two adjustments together the appropriate test of the 1:200 standard
against the international evidence, is a 22 percent capital ratio.
The Basel Committee on Banking supervision (BCBS) evidence
The first set of evidence the Bank used is from the 2010 BCBS report, later adjusted
by the Bank of England to put the numbers on a tier one capital basis. The adjusted
BOE numbers are presented in table one.
The estimates do not go up to the 22 percent ratio, but if we extrapolate the
downward trend, it is reasonably clear that the probability at 22 percent is well
below the 0.5 percent level needed to support the Bank’s argument.
Table 1 : BCBS crisis probability estimates
Tier one capital Probability of crisis %
8 8.3
11 2.9
14 1.2
16 0.8
A second point is that the numbers presented by the BOE are not actually Basel
Committee estimates. Rather, they an average of seven different studies. We went
back to the original studies and adjusted them, individually, to a tier one basis. The
highest reported capital ratios were 15 percent, which translates to 18 percent of
tier one capital. The results were as follows.
Table 2: Individual studies reported in BCBS 2010 appendix.
18 percent capital ratio
Study Prob. Crisis
percent
FSA 0.5
Bank of Japan (1) 0
Bank Japan (2) 0.1
“bottom up” 0
BOE 0
BIS 0.7
Bank of Canada 0
13The average at the18 percent capital ratio is less than 0.2. At a 22 percent ratio, the
number would be lower again, say, less than 0.1 percent. The failure rates are roughly
in line with the implied rates from the credit ratings of the New Zealand banking
system.
Our conclusion here is that using the appropriate test, and looking at the actual
studies, the results from the seven models are not oven close to 0.5 percent failure
rates that would support the Bank’s claims.
The Bank of England (BOE) modelling
The BOE’s used a bottom-up model 13(using individual bank loss data) and a top -
down model (which estimates the relationship between financial crises and country
banking system capital ratios) Their results are as follows. On the BOE’s reported
numbers they clearly do not provide support for a 0.5 crisis rate at a 22 percent
capital ratio.
Table 3: BOE probability of a crisis
Tier 1 capital ratio Bottom up prob % Top-down prob % Topdown
leverage ratio
8 0.5 1.8 3
11 0.4 0.6 3
14 0.3 0.5 5
16 0.3 0.4 6
And there are issues with the analysis. Due to data constraints the estimation period
for the bottom-up model was very short (from 1993 to about 2013), a period that
captured the most turbulent period in post war banking. If the data period was
stretched back to, say, 1970 and forward to 2018, the measured probability of a
crisis would likely fall quite sharply. Similarly, for the top-down model (see the
discussion of the Firestone model below). The top-down model was estimated using
the leverge ratio and then converted to a tier one ratio using the UK average tier
one/leverge ratio ratio of 2.63. If the New Zealand ratio of about 2 had been applied
to the results, tier one ratio corresponding to a leverage ratio of 6 percent would
have been 12 percent, a difference of 4 percentage points from the BOE’s 16
13 Financial Stability Paper No. 35 – December 2015 Measuring the macroeconomic costs and benefits of higher
UK bank capital requirements Martin Brooke, Oliver Bush, Robert Edwards, Jas Ellis, Bill Francis, Rashmi
Harimohan, Katharine Neiss and Caspar Sieger
14percent. This demonstrates that our 4 percentage point adjustment for
measurement differences was almost exactly right in this case.
There is clearly no support for increasing capital ratios in the BOE analysis. It
suggests that New Zealand banks are already solidly meeting a 1:200 target.
The IMF analysis14
The IMF paper does not make an assessment of the relationship between the
probability of a crisis and capital ratios, so it is not altogether clear why the Bank
presented it. Presumably it was an opportunity to present the IMF table on non-
performing loans together with some additional high nonperforming loan rates,
which we have reproduced below.
All the IMF analysis is, is a listing of the peak non-performing ratios for countries that
have experienced finanicial crises. It assumed that the loss rate on non-performing
loans is 50 percent, which is a crude estimate which will overstate loss rates in most
crises. For example, we checked the Italian non-performing loan rate 15. It was 9.5
percent in 2009, not the 18 percent presented by the IMF. The Italian banking
system was modestly profitable in 2009 and did not record a disasterous loss
implied by the IMF methodology.
The IMF then arbitrarily assumed that the 85th percentile has some special
significance and that the ‘optimal’ capital ratio is therefore 15 percent.
Figure 1 Non performing loan rates in financial crises
14 Benefits and Costs of Bank Capital Jihad Dagher, Giovanni Dell’Ariccia, Luc Laeven, Lev Ratnovski, and Hui
Tong SDN 16/04
15 Banco d’Italia Financial Stability Report No. 1 2010
15The implied assumption behind the IMF analysis is that because the banks in some
countries had a high level of losses at a particular point in their history, this outcome
is relevant to banking systems everywhere, at all times. This doesn’t make much
sense.
Take the case of Korea, which sits near the 85th percentile. Korean banks did incur
heavy losses in the Asian crisis because:
Korea had a crony-capitalist system, rife with corruption.
Banks were lending to business groups (Chaboels) with debt to equity ratios
of 500 percent.
Many loans were in US dollars which were taken out when the Korean
currency was fixed to the dollar at an overvalued exchange rate (sharply
increasing the value of loans when the currency eventually devalued).
None of these circumstances are relevant to New Zealand. The Korean experience
(and most of the other high loss experiences) is not necessarily some kind of
relevant cautionary tale of what could happen to New Zealand, that justify a
regulatory capital ratio of 16 percent.
Similarly the Icelandic, Greek, Cypriot and Irish experiences16 generally have little or
no relevance to present day New Zealand.
16 The Irish banking disaster was primarily driven by very loose commercial property lending. The loss on this
lending was ¢40 billion on a portfolio of ¢70 billion, compared to Irish housing loan losses that peaked at ¢10
billion before subsequent recoveries. The report ‘The Irish Banking Crisis Regulatory and Financial Stability Policy
2003-2008 A Report to the Minister for Finance by the Governor of the Central Bank’ sets out some of the main
reasons fo the losses: High LVR limits (80 percent), which were frequently exceeded; statements of net worth
accepted at face value; no assessment of impact of lening on propoerty supply; a political imperative to expand
the banking system. These factors were not present in New ealand in 2008 so the losses were moderate. They
are not present today.
16The Bank also took the opportunity to present some evidence that is closer to home,
inserting the maximum nonperforming loan ratios for two Australian banks (the ANZ
at about 10 percent and Westpac at 15 percent) and the BNZ at around 25 percent
(all in the early 1990s), in the IMF table. The inference again, presumably, is that big
losses are possible, and that if it happened once in recent times, then it can happen
again. However, the actual Australian loss outcomes were less scary and show that
simply assuming that 50 percent of peak non-performing loans translates into losses
is a poor way to estimate bank losses. Marianne Gizycki and Philip Lowe17 report that
total losses by privately owned Australian banks through the recession amounted to
16 percent of bank capital at the starting point in 1989, when capital ratios were
substantially lower than they are now.
The Reserve Bank’s claim that the BNZ’s non-performing loans ratio reached 25
percent appears to be overstated. According to the BNZ 1991 annual report the
number is more like 17 percent. Over half of those bad loans were in Australia. The
New Zealand peak bad loan rate was more like 10 percent.
The BNZ story is well known to bankers, if not to the Reserve Bank. The BNZ had a
heavy exposure to property and investment company lending in the midst of a
building boom that resulted in a massive oversupply of commercial properrty space
and a subsequent collapse in prices. The BNZ rushed into Australia and got involved
with a large number of bad deals to boost their lending. There was little or nothing
in the way of robust underwriting standards and effective credit controls and
reporting. In its 1989 annual report the BNZ Chair reported “little regard was paid
to effective monitoring of the exposures to each sector, a situation compouned by
suspect judgments and a serious lapse in security administration” and “the rapid
growth of the BNZ in recent years has unfortunately been accompanied by some
undisciplined corporate lending practices”
This is not the situation in the New Zealand banking sector today. Commercial
property lending is only about 8 percent of total lending; there is no evidence of an
commercial property overbuilding boom; and New Zealand banks are not flinging
their money at very marginal Australian lending propositions. The Australian banks’
subsidiaries are subject to parental and APRA oversight. It is worth noting too that
bank capital ratios were much lower than they are today. After its first capital
injection the BNZ proudly stated that its tier one risk adjusted capital ratio was 5
percent.
17 ‘The Australian Financial System in the 1990s’ Marianne Gizycki and Philip Lowe17
17The relatively moderate losses in the GFC attests to the effective change in New
Zealand underwriting standards and risk culture. Total nonperforming loans peaked
at 2 per cent of lending and no bank recorded a loss in any year. Over the two peak
years of the recession total credit losses amounted to 1.2 percent of lending, one of
the lowest rates in the OECD.
Federal Reserve Board (Firestone et al., 2017)18
The Bank describe the substance of Firestone bottom up approach as follows.
The authors concluded that when Tier 1 capital was 8 percent of RWA the probability of a
financial crisis was 3.8 percent. The authors estimated that, in order to reduce the probability
of a crisis to 1 percent or less, Tier 1 capital would need to be 17 percent of RWA or more.
The first part of the statement is not accurate. The authors did not conclude that the
probability of a crisis, with risk weight of 8 percent was 3.8 percent. They actually
assumed this result to line up with an estimate they claim was reported by Laeven
and Valcenia 19, and used it to calibrate their model. All of the results for the higher
risk weights follow from this calibration.
Laeven and Valcenia did not calculate a crisis rate of 3.8 percent. Rather, in the cited
paper, they listed all identified financial crises over 1970-2011. Firestone calculated
the default rate using only the period from 1989 to 2011, leaving out the earlier
more benign years. We calculated a crisis rate of around 1.5 percent for advanced
economies, based on the data in the latest, 2018, Laeven paper. We think that the
longer data period is more appropriate guide to future failure rates as it captures a
more conservative banking period as well as the higher risk strategies that lead to
high loss rates in the GFC.
If a 1.5 percent financial crisis probability calibration had been used in the Firestone
model the calculated numbers for different capital ratios would have been lower. It
is not possible to say by how much without a rerun of their model, but the difference
would probably have been quite significant given the difference between a 3.8
percent and a 1.5 percent calibration.
18 ‘An Empirical Economic Assessment of the Costs and Benefits of Bank Capital in the US’ Simon Firestone, Amy
Lorenc and Ben Ranish 2017. US Federal Reserve Board
19
Laeven L., and F. Valencia (2012), “Systemic banking crises database: An update”, International Monetary Fund
Working Paper No. 12/163.
18The second step in the Firestone model is to adjust for enhancements in liquidity
management regulations and improved resolvability post the GFC. These estimates
are the most appropriate to the New Zealand system where similar improvements
have been made. The results are set out in table four below which shows the
probabilities from both the bottom up and top down models.
The top-down approach is a standard regression on the relationship between
financial crisises, capital and other risk drivers. Two models were specified but in
specification 1, capital was not statistically significant and the results should be
ignored. Capital was (weakly) statistically significant in specification 2.
Table 4: Firestone crisis probabilities
Tier 1 RWA Bottom-up Top-down
model % Spec 2 %
8 2.6 4.7
11 1.3 2.3
14 1.0 1.1
17 0.7 0.5
21 0.5 0.2
25 0.5 0.1
The relevant capital ratio for the 1:200 test is between 21 and 25 percent. The
reported bottom-up result was 0.5 percent but as discussed above it would have
been materially lower, using a default probability from a longer historical data
period. The top-down result, at between 0.1 and 0.2 percent, clearly didn’t support
the 0.5 percent test.
Summary of historical experience cited by the Bank.
1.BCBS
Only one of seven studies support the 0.5 percent crisis rate.
2. Bank of England
Clearly doesn’t support 0.5 percent crisis rate.
3. IMF
No information on the crisis rate.
4. Firestone
19The bottom-up estimates were exaggerated by the short data period and do not
provide credible support for a 0.5 percent crisis rate. The top-down approach clearly
does not provide support.
New Zealand evidence
We should not lose sight of the fact that we are dealing with New Zealand banks
here, and that it is New Zealand evidence that it is most relevant. Taking a 100 year
perspective, New Zealand has experienced many economic shocks that would have
lead to bank failures in many other jurisdictions. Reddell and Sleeman discussed20 six
such events in a 2008 Bulletin article and if we add the GFC that makes seven.
Through that time there was one bank failure, the BNZ, (which actually failed twice,
but to the same event). It is difficult to count the number of banks (there were
twelve trustee savings banks though much of the 100 years) in New Zealand times
the number of years they have been operating, but if we assume an average of say
16 that gives us 1600 bank years, or a failure rate of 1:1600.
Of course, caution should be exercised when applying this number to a forward
looking risk assessment of the New Zealand banking system. There have been many
economic, institutional, legal and behavioral changes over 100 years. But equally,
caution should be exercised when applying the international evidence to New
Zealand, where those differences from modern day New Zealand are just as
pronounced, and probably more so. Several of the countries that whose experience
is captured in the data are poor comparators for New Zealand and there is always a
risk in using foreign outcomes, when the history and institutional environment is
poorly understood by the Bank’s analysts.
Portfolio modelling of New Zealand bank risk
The Bank says:
In order to incorporate the New Zealand context in our analysis, and as a complement to our
review of overseas findings, we used a portfolio risk model. We used the model to explore
what level of Tier 1 capital might be sufficient to ensure the sector retained the confidence of
the market after a large shock.
But on the results, we are just told
Based on our range of input values for PD, LGD and correlation R, our conclusion from our
risk analysis is that Tier 1 capital equal to 16 percent of RWA is sufficient to cover credit-
20 Some perspectives on past recessions Michael Reddell and Cath Sleeman
RBNZ Bulletin Vol. 71. No. 2. June 2008
20related losses (after taking account of provisions) and operational and market trading-
related risk. In other words, a Tier 1 capital ratio of 16 percent of RWA is needed to ensure
our banking sector retains creditor confidence after enduring an extreme shock
This is a vague statement, which could mean anything. It depends on what they
mean by “ensuring our banking system retains creditor confidence after an extreme
shock”, and, of course, what inputs were fed into the model.
The consultation document was also very vague about the structure and outputs of
the model.
No working paper is presented in the bibliography.
They do not explain what model input values were used to generate the 16
percent capital ratio requirement.
There is no information on where the critical correlation coefficient inputs
came from.
The Bank has belatedly disclosed a relevant technical paper21. It is dated 25 January
2019, so it did not exist when the consultation document was released. A reader
might think that this was the writeup of the analysis the Bank relied on to make its
decision on the 1:200 target and the related capital requirement. But this is not so.
The analysis that really provided the basis for the 16 percent capital ratio decision
was presented in a decision paper to the Financial Oversight Committee dated 13
November 2018. The results, which seemed to support the 16 percent capital ratio,
were clearly fabricated. Mostly implausible assumptions were fed into what was
probably the wrong Basel IRB model to get the ‘right’ result. In particular, the
average probability of default was assumed to be 2.8 per cent, when the average PD
used by banks in their capital models is 1.1 percent. The Reserve Bank has accepted
those estimates as appropriately conservative. However, to the Bank’s decision
making committee, which is not close to the numbers, and knows little about bank
risk, the analysis would have looked sophisticated and plausible. They would have
had no idea that they were being duped.
On reflection the Bank obviously thought that the original analysis was
embarrassingly bad and that they would need something better to put out for public
consumption, when the inevitable OIA requests came. Hence the later paper. The
hope, presumably, was that no one would spot the real analysis amongst the host of
papers the Bank released.
21 Explanatory note on portfolio risk modelling in the New Zealand Context 25 January 2019
21As the 25 January paper is the Bank’s best shot at explaining themselves, we have
analysed it here.
In the paper there is a table, reproduced below, that sets out some results. The 16
percent capital ratio was derived from the column on the left – Initial setting.
Table 5: Model inputs and outputs
There are some obvious problems with the Bank’s analysis.
IRB Model appears to have been inappropriately selected to generate higher capital
requirements
The Bank initially said that they used a variant of the Basel IRB model, but did not
provide more detail in the Consultation paper. In the Explanatory paper we are told
that they used the corporate loan model. But on the Bank’s data presented in table
5 these loans account for only 11 percent of total lending. In makes little sense to
assume all bank loans are corporate loans. One of the advantages, we presume,
from the Bank’s perspective, is that the corporate model has a couple of moving
parts that can be inappropriately tweaked, if the objective is to cheat in order
increase the measured capital requirement.
1:200 event not modelled
The confidence interval reported in their table 4 is 99.7%, which means that the
Bank was modelling a 1:333 year event, not a 1:200 event. If a 1:200 event had been
22modelled all of the calculated capital ratios would have been materially lower. The
Bank’s excuse is that the outcomes are uncertain and that using a 1:333 probability
somehow accounts fthis. The uncertainty is analysed through their sensivity
analysis. The use of a higher confidence interval is not legitimate.
Note that in the analysis presented to FSO they used the 1:200 calibration with no
mention of a different calibration being necessary to account for ‘uncertainty’.
Single representative asset approach not appropriate
The Bank uses a single representative asset approach that does not suit the Basel
modelling framework. There are several models depending on the risk characteristics
of the subportfolios. The correlation coefficients range from 0.04 to 0.24. It is
difficult then to assess the appropriateness of the Bank’s aggregate numbers without
breaking them down into the component estimates.
Further, the aggregated approach does not work when estimating the probability of
default (PD) from historical data because there have been such large changes in
portfolios structures over their data period. To illustrate the point assume that
historically a bank had 85 percent of its portfolio in high risk commercial property
and business loans, with a measured probability of default of 5 percent, and 15
percent in low risk housing loans with a default probability of 0.4 percent. Its
average PD is 4.31 percent. The bank then changes its portfolio structure to 60
perecent housing loans, and 40 percent high risk loans. Its average default rate falls
to 2.24 percent. The bank would not describe its current average PD as 4.31 percent
based on its historical portfolio experience.
Operating margin forgotten
Again the bank has forgotten to allow for an operating margin above the regulatory
minimum. The model works on actual capital, not on the regulatory minimum.
Assuming an operating margin of two percentage point would, by itself, reduce the
capital requirement by that amount.
The following are more specific comments on the model inputs.
Probability of default: Mean estimate 1.5 percent
The Bank could have used the advanced bank PDs, which, as noted above, it has
already approved as being reasonable and conservative representations of long run
default rates (these are set out in their table 3 reproduced below). All it would have
to do is adjust the reported housing PD of 0.89 percent, which is not a bank driven
estimate and which substantially overstates the ‘true’ long run PD. A number more
like 0.4 percent, which would still account for some as yet unobserved large housing
shock, would be more appropriate. A reasonable portfolio average would be 0.8-0.9
23percent. The reported advanced bank portfolio average PD of 1.1 percent was one of
the inputs they ‘considered’, but this is diluted by their consideration of four other
sets of ‘information’. All of them are poor proxies for a long run PD estimate. They
are:
1. Impaired assets to total loans - 2.0% estimate.
It significantly overstates PD rates because nonperforming assets were held
in portfolio for years in the early 1990s.
It is dominated by the BNZ 1989-93 experienced, which, as discussed above
has limited relevance for a forward looking assessment.
Average default experiences over 1989-93 will not be applicable now
because portfolio structures have changed radically from that period. For
example housing loans BNZ’s were about 15 percent of the loan portfolio in
1991, but about 60 percent in 2018.
2. Impaired asset expenses: 0.3 to 0.4%.
Again, this estimate is dominated by BNZ experience.
There is an inference that the impaired asset expense can be converted to a
PD estimate by dividing it by an assumed LGD of 20 percent to give a PD of
1.5 to 2 percent. But the reported impaired asset expenses are dominated by
commercial lending with significantly higher LGDs, so the implied default
rates would be much lower (more like 0.8-1percnt) than the Bank implies.
3. Impaired and past due assets to total assets: 1.4 percent
This doesn’t provide any more information than 1. It just uses a different
denominator.
4. Stress tests 2.7-2.8 percent
An average default rate over a stress test scenario is not a long run average PD
estimate, which will also include default rates from benign periods. The stress test
number appears to be there just to introduce a high number into the mix.
Note that a PD of 2.8 percent was used in the modelling that was presented to the
FSO. This was clearly a gross overstatement and one of the embarrassments that the
Bank attempted to coverup by reworking the analysis.
LGD: mean estimate 35 percent
There are two data sources.
The weighted average advanced bank reported LGD of 29 percent.
The stress test outcomes for 2014 and 2017 of 37 and 31 percent
respectively. The 2017 result is more relevant as it accounts for a more up to
24date portfolio structure, but even taking the straight average this gives an
estimate of only 32 percent. A mean estimate of 30 percent is more
appropriate.
The FSO modelling assumed a 40 percent LGD based on the same information.
Correlation coefficient: Mean estimate 0.28
From the January paper we are told that the correlation was derived from the Bank’s
TUATARA22 23model which was built in 2011 as a cost benefit model that would have
particular regard to key structural features of the New Zealand banking system (in
particular its substantial foreign ownership). The correlation coefficient was a ‘made-
up’ number designed to fatten the tail (by a factor of 10) of the Basel model, which
assumes that default rates follow a normal distribution. While it was appropriate to
make some adjustment to the Basel model, the TUATARA estimate did not have any
empirical or analytical support and is overstated. While this might be acceptable in a
the original ‘proof of concept’ cost benefit model, we would expect the Bank’s
current modelling, which is driving a 30 billion dollar plus decision to be backed by
much more substantive analysis, and properly documented.
From the Bank’s consulation paper, and the information provided to the FSO, it is
clear that the modeller(s) did not understand what the Basel correlation coefficient
is. They thought that it was (presumably in the context of estimating housing loan
capital) an estimate of the statistical correlation between GDP and house prices. It is
not. It is a measure of how defaults within a housing portfolio are correlated. The
higher this correlation the more loans will fail together and the higher the capital
requirement. It is difficult to estimate empirically24, but it cannot be read off a
GDP/house price correlation. However, on the basis of an GDP/house price
correlation presented to them, the FSO Committee was probably lead to believe that
the Basel calibrations were nowhere near conservative enough for New Zealand
conditions.
Table 6 : RBNZ IRB bank estimate table
22 TUATARA is an acronym that stood for ‘Teaching Uninformed Australians To Assess Risk Appropriately’. This is
unfair to Australians. The reader might wish to substitute, according to circumstance and taste: Americans,
Authorities, Amateurs, Assess or Adrian.
23 Disclosure: the author of this paper built The TUATARA model.
24There was an empirical estimate of .025 before the Basel housing model was calibrated, but this was based on
pre-GFC data. A figure of 0.15 was adopted on the basis of some reverse engineering of Federal Reserve Board
housing loss modeling with a margin for conservatism thrown in.
25Re-estimating the model
We do not have access to the full suite of Basel IRB models that would allow us to
rerun the model using reasonable input estimates. However, the Bank did a
sensitivity analysis that provides some guidance. The lowest set of inputs (PD =1.0
percent; LGD =30 percent; correlation = 0.24), might be a reasonable best estimate.
These assumptions generate a capital ratio of 10-11 percent at a probability of
1:333, suggesting a ratio of around 8 percent might be about right for a 1:200
probability. It could be lower again if the Bank manipulted the corporate model to
produce higher results.
Sensitivity analysis
The information paper reported on a sensitivity analysis which showed how the
capital requirement respond to changes in the model inputs. The technical issue
here is that they used a uniform distribution to estimate the ‘true’ distributions of
the inputs. This is an extreme assumption, which assumes that the highest and
lowest inputs have the same probability as the best estimate. The uniform
distribution assumption has the effect of blowing out the tails of the distribution,
making it appear that there is a relatively high risk that the ‘true’ capital requirement
could be significantly higher than the mean estimate. A distribution that is more
centred around the best estimates should have been used.
A back filling exercise
The Bank’s modelling exercise looks to be an obvious ‘backfilling’ exercise. A decision
had been made to have 16 percent CET1 regulatory minimum, and this had to be
consistent with a 1:200 failure rate. But there was no New Zealand evidence to
26support it, so they ignored what relevant New Zealand evidence that was available,
and trumped up some to suit their story.
We understand that The Reserve Bank has briefed bank risk managers on their
modelling, and have said they will be providing more information in March. The
bankers were told that the Reserve Bank was not interested in the the banks’ views
on the model inputs because the Bank was going to use inputs which are ‘good for
New Zealand’. This is admitting that they will ignore any facts or analytical evidence
that doesn’t suit. Apparently, the Reserve Bank is operating in a post-fact world.Ifthe
bank says an inpit is ‘good for New Zealand ‘ then it is a fact.
The portfolio risk modelling ‘analysis’ should not be taken seriously and should be
withdrawn by the Bank, before they further embarrass themselves. The exercise
modelling exercise was a sham and they might as well admit that the 16 percent
ratio is mostly based on gut feel, or, perhaps, a revelation from the tree god.
Part four: Stress testing evidence
On the face of it the Reserve Bank’s stress testing results do not support higher
capital ratios. The banks get through a pretty severe stress test with a substantial
capital buffer in hand. The Bank’s response, in the consultation paper and
elsewhere, is to downplay these results, suggesting that the outcomes are really too
optimistic, and that losses could be much worse.
Our view is that the Bank’s concerns are overstated, and that they have artificially
boosted some outcomes to paint a more negative picture. A fair assessment of the
2017 stress tests is that the more likely outcomes are actually significantly more
favorable than the results presented in the consultation document. Our assessment
is based on the description of the stress test in two 2018 RBNZ Bulletin articles 25.
Some of the more obvious issues are as follows.
Dairy lending losses overstated
It is assumed that the dairy payout falls to $4.90. No information is given on the
magnitude of the assumed commodity price and exchange rate falls that should have
driven this result. However, we are told that the exchange rate fall, that is used to
generate losses from a counterparty failure, is ‘substantial’.
On plausible assumptions on the size of the dairy commodity price and exchange
rate shock, it is likely that the dairy payout shock would be much less than assumed,
25 Dunstan and Lilly
27or even be positive. The Bank probably did the numbers, which would have shown
these kinds of results. Which is probably why the key commodity and exchange rate
assumptions were not presented.
Bank mitigating actions not taken into account
In the 2017 stress tests banks estimated that mitigating actions would improve their
capital positions by 1.1 percent. While the Bank presented this information in the
stress test write-up, it was not part of the ‘headline’ results that are presented in the
consultation document. Most of the banks’ actions are plausible and should have
been used, at least in part, to give a balanced picture of the stress test outcomes.
Increase in risk weights partially unnecessary.
An increase in risk weights decreased capital by 1.5 percent. The main reason is that
banks using the advanced capital models are marking their collateral to market,
which pushes loans into higher risk weight classes as asset prices fall. This
‘procyclicality’ is an undesirable and mostly unnecessary characteristic of a capital
adequacy regime. It appears to be partially mitigated in the Basel framework by the
simple expedient of applying a minimum advanced/standardized capital ratio of 72.5
percent. If the measured ratio is, say, 50 percent and this increases to 65 percent in
a cyclical downturn then this has no impact on the actual capital requirement, which
is still determined by 72.5 percent.26The New Zealand regime could, and should, be
set up to reduce the systemic price effect. It already does so, in part, on the upside
of the cycle. Banks cannot mark the value of their housing collateral to market as
prices increase.
Operational risk loss is implausible
It is assumed that banks will be subject to a successful class action suit (costing 0.6
percent of capital) because of inappropriate lending, and that this will impact on
capital in the third year of the stress test. The prospect of a successful suit in New
Zealand, which does not have a class action friendly legal environment, is a stretch
(what for – advising home buyers that house prices never fall or that they will never
become unemployed?), but the likelihood that it will impact in the third year must
be close to nil. A case would take years to get organised and court action would drag
on for more years.
Housing default rate is 12 percent
This looks to be implausible given the severity of the house price and unemployment
shocks, which are the main drivers of housing mortgage defaults. This was forced on
the stress test to increase the loss rate and is not a fair mean estimate.
26 There will still be a cyclical element in the Standardised model
28You can also read