2021 State Wage Case - Western Australian Industrial ...
←
→
Page content transcription
If your browser does not render page correctly, please read the page content below
Submission to the Western Australian
  Industrial Relations Commission

2021 State Wage Case
    Western Australian Council of Social Service Inc.
    Level 2, 3 Loftus Street, West Leederville 6007
                  www.wacoss.org.au
                 Phone: (08) 6381 5300
     Email: Chris Twomey - chris@wacoss.org.au
      Graham Hansen – graham@wacoss.org.au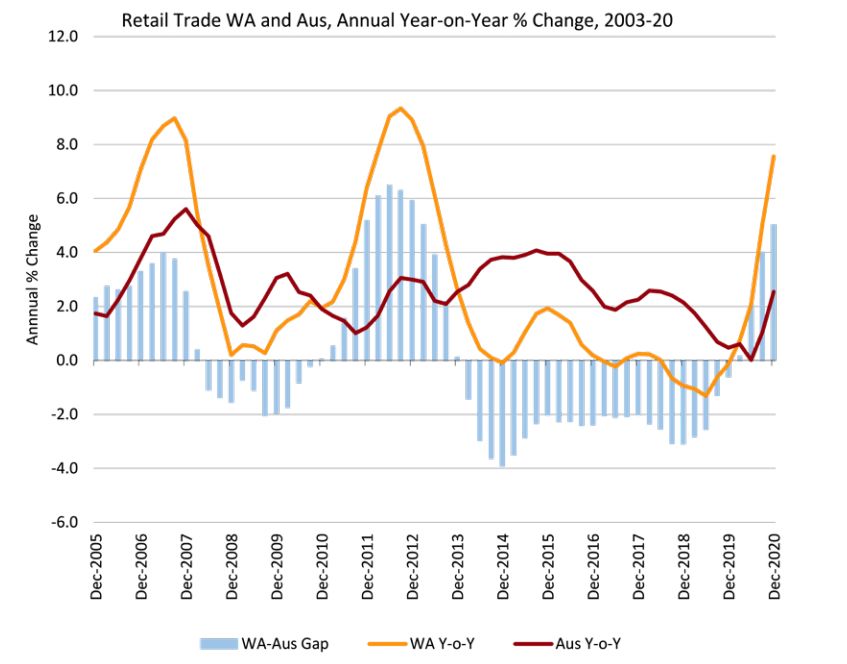
Contents
About WACOSS ...................................................................................................................... 2
1.0          Introduction ............................................................................................................ 3
2.0          WACOSS’s claim....................................................................................................... 3
3.0          The Cost of Living in WA........................................................................................... 5
                   3.1 Housing ............................................................................................................ 6
                   3.2 Food ............................................................................................................... 13
                   3.3 Energy ............................................................................................................ 17
                   3.4 Costs in the Regions ....................................................................................... 22
                   3.5 Financial Stress and Hardship ........................................................................ 26
4.0          Inequality and Poverty ........................................................................................... 30
                   4.1 Relative Poverty ............................................................................................. 30
                   4.2 The Impacts of Poverty on Children .............................................................. 32
                   4.3 Income Inequality .......................................................................................... 34
                   4.4 Gender Wage Gap.......................................................................................... 37
                   4.5 Case Study – Dalia’s Story .............................................................................. 40
                   4.6 Young People ................................................................................................. 41
5.0          WA’s Economic Environment ................................................................................. 43
6.0          Conclusion ............................................................................................................. 46

About WACOSS
The Western Australian Council of Social Service is the peak body for the community services sector
and works to create an inclusive, just and equitable society. We drive social change with communities,
through collective action and policy formulation, strengthening community services and influencing
decision makers to ensure justice and equity.

With WACOSS members and the broader sector, we advocate with and on behalf of those who are
the furthest from levers of power and influence, to amplify their concerns and seek justice, to create
a society that genuinely works for the benefit of all and not just the few.

Tackling difficult issues, systems, behaviours and attitudes that contribute to inequality and exclusion,
WACOSS develops evidence-based social policy and research to inform and influence government
decision-making to change the lives of those facing adversity.

                                                                                                                                                 2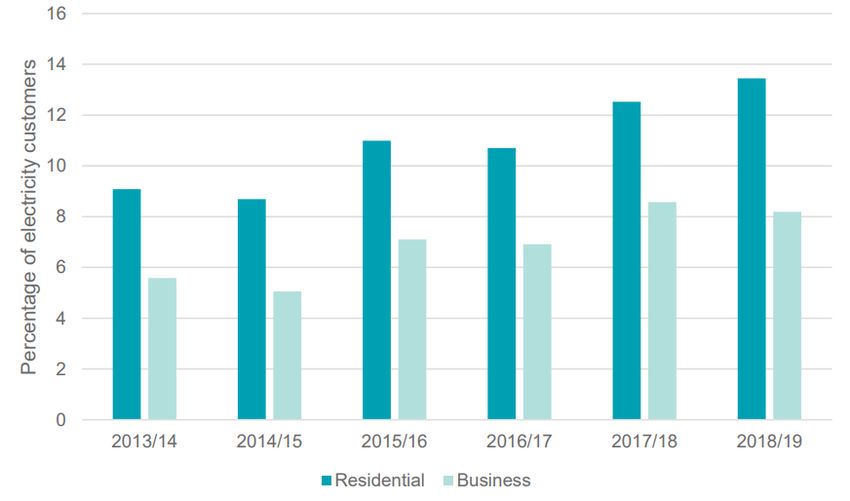
1.0            Introduction
The Western Australian Council of Social Service (WACOSS) considers the minimum wage to be a
vital means of protecting low-income workers from poverty, which also delivers economic benefits
to the wider Western Australian community. An adequate and appropriate minimum wage level
supports a decent standard of living for working people and their families. It ensures a fair and
inclusive economy that enables us all to thrive. As the peak body for the community service sector
in WA, and as an advocate for people experiencing marginalisation, disadvantage and hardship,
WACOSS has a particular interest in the adequacy of living standards and quality of life experienced
by Western Australians living on low incomes.

WACOSS’s submission to the 2021 State Wage Case relies on the provisions in the Industrial
Relations Act 1979, at Clause 50A(3)(a) for the Commission to consider in its determination of
minimum rates of pay the need to:
          i.        ensure that Western Australians have a system of fair wages and conditions of employment;
                    and
          ii.       meet the needs of the low paid; and
          iii.      provide fair wage standards in the context of living standards generally prevailing in the
                    community; and
          iv.       contribute to improved living standards for employees; and
          v.        protect employees who may be unable to reach an industrial agreement; and
          vi.       encourage ongoing skills development; and
          vii.      provide equal remuneration for men and women for work of equal or comparable value.1

In preparing this submission, WACOSS has carefully considered the changing economic and
workplace environment for low-wage workers, and the health of the wider economy. We have
reviewed the state of knowledge in related areas and considered the latest research and analysis to
ensure our submission is up to date and directly relevant to the lived experience of minimum wage
workers in WA. We do so in order to provide the Commission with the best available data and
analysis upon which to base its deliberations. This year we have also analysed the latest data on the
impacts of the COVID-19 pandemic and associated economic impacts on employment conditions.

2.0            WACOSS’s claim
WACOSS submits that an increase to the State Minimum Wage rate of 4 per cent or $30.40 per
week is consistent with the need to meet the needs of the low paid and to contribute to improved
living standards for employees; and is a sensible and measured increase in the context of the state
of the Western Australian economy.

Western Australia is back in business. That is the unavoidable message from State Government
media statements, and S&P Global Ratings and Moody’s credit reports. Our state has certainly been
successful in weathering many of the economic impacts of COVID-19 that have been seen
elsewhere, and on a number of metrics is even performing more strongly than it had been prior to
the pandemic.

1   Industrial Relations Act 1979 (WA)
                                                                                                                 3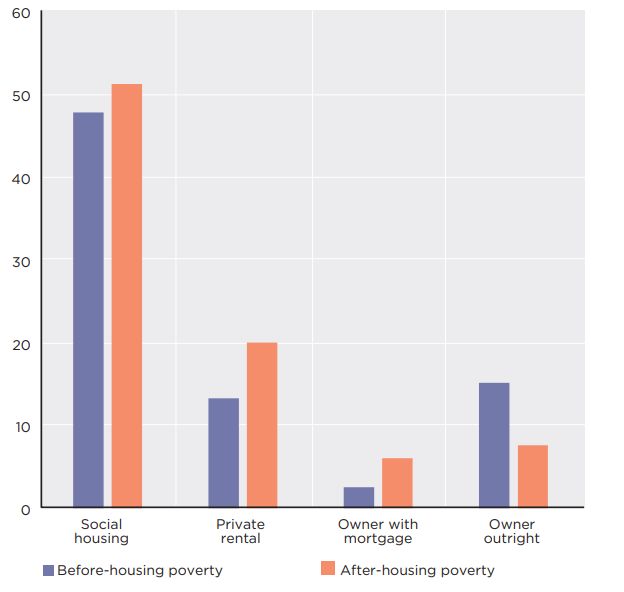
At the same time, however, many Western Australians and in particular those who are low paid, are
facing significant living cost pressures and increased financial hardship.

The primary basis for WACOSS’s claim, as a result, is that our proposed increase to the State
Minimum Wage is needed in order to in order to meet the needs of the low paid and to contribute
to improved living standards for employees.

For low paid workers in WA, the cost of housing has skyrocketed, leading to a significant affordability
crisis. The median rent for a unit now accounts for over 51 per cent of the State Minimum Wage,
while the median rent for a house is nearly 57 per cent. Community service organisations are
inundated with calls from people seeking assistance to address their rental situation.

At the same time, households have faced increasing costs in other areas, such as food and
beverages, which add to the financial burden low paid workers are facing. The evidence shows that
low income households who experience a sudden additional expense are likely to lower their food
budget, or skip meals, to compensate. Increasing the minimum wage and the purchasing power of
low-wage working families can help protect households against food insecurity, help low-wage
earners afford a more nutritious and sufficient diet, and may help alleviate the growing trend of food
insecurity across the state.

Child poverty rates in WA have also continued to increase, rising almost five percentage points over
the last decade. 94,000 children in WA are growing up in families living below the poverty line. In
this submission, we have highlighted many examples where single parents on the minimum wage
are unable to meet their living costs, including a real life example from someone who was kind
enough to share their story with WACOSS.

By increasing the minimum wage so that workers are provided with a decent standard of living, well
above poverty levels, we can make our economy more inclusive and sustainable, and ensure its
benefits are shared more broadly. The evidence from the COVID-19 crisis shows very clearly that the
stimulus boost to lower income households in 2020 provided by JobKeeper Payments and JobSeeker
Supplements had a significant impact on the strength and resilience of our economy.

WACOSS recognises that, as a result of the high level of uncertainty faced by the WA community last
year, the WA Industrial Commission determined that it was necessary to delay the increases to the
state minimum wage and award rates until the first pay period after 1 January 2021. It is the
contention of WACOSS that Western Australia is now in a significantly more secure position than it
was 12 months ago, meaning that the necessity for such a further delay is not present. WACOSS
further contends that the data and analysis in this submission demonstrates why an increase from 1
July 2021 is necessary in order to meet the needs of low paid workers in Western Australia.

With clear evidence of Western Australians experiencing significant living cost pressures, WACOSS
considers a 4 per cent or $30.40 per week increase to be essential in meeting the needs of the low
paid and to contribute to improved living standards for employees.

                                                                                                       4
3.0 The Cost of Living in WA
The ability of low-income households in WA to achieve and maintain a basic standard of living is the
focus of the annual WACOSS Cost of Living Report, which has been produced since 2007. Through
this research, we seek to provide a picture of the challenges low-income households face year by
year as they endeavour to ensure their living costs do not exceed their income.
The 2020 Cost of Living Report modelled five low-income household-types, and examined the
adequacy of their income to afford a basic standard of living in line with agreed community
standards during the previous financial year. The 2020 Report, which included the period in which
the Federal and State Governments introduced a range of financial supports, demonstrated the
significant impact that an increase in income has on low-income household’s capacity to be able to
meet the living standards generally prevailing in the community.
As their income is represented as a weekly figure, averaged out across the financial year, it should be
recognised that this extra financial support means the households’ income would have been much
lower in the first part of the year and much higher in the second. Food and beverage costs rose
sharply for the model households, as did rental payments for the second year in a row. Without the
coronavirus supplements and economic support payments, these cost increases would have left
these households in a highly precarious position.
Weekly income and expenditure of our model households
Income Expenditure Net Position
Single Parent Family $1,070.11 $958.86 $111.25
Two Parent Family $1,524.07 $1,322.75 $201.29
Unemployed Single $378.37 $330.52 $47.85
Age Pensioners (Renters) $786.72 $709.60 $77.11
Age Pensioners
$721.58 $609.74 $111.84
(Home Owners)
Source: WACOSS Cost of Living Report 2020
At the time of this State Wage Case, WA finds itself in the position that those increases in costs
remain present, but the financial supports have been removed. In the following we present data
demonstrating the impact of these cost of living increases, with a particular focus on the areas of
housing, food and energy. As noted by WACOSS in previous SWC submissions, while it is a valuable
indicator, CPI is fundamentally a measure of the changes in the prices of a fixed basket of goods and
services, rather than changes in the minimum expenditure needed to maintain a certain standard of
living. As a result, there are inherent limitations in using CPI and inflation measures alone to draw
inferences about the real living cost pressures faced by low-income households. We consider it
particularly important to separate out and highlight the key areas of expenditure for minimum wage
households this year due to the volatility in the Perth CPI figures, resulting in particular from the WA
Government’s $600 electricity credit, as noted by the ABS.2
2 Australian Bureau of Statistics (2021) ‘Capital city highlights,’ Consumer Price Index, Australia, March 2021
53.1 Housing
Access to safe, secure and affordable shelter is essential for people to be able to fully engage in our
community. Stable tenancies are crucial to support positive outcomes in areas like health and
wellbeing, education and employment. Conversely, insecurity and instability in housing creates the
circumstances for increased hardship and entrenched disadvantage.
Median rents in Perth have been increasing since the end of 2018, with 2020 seeing a sizeable
uptick. At the same time, the rental vacancy rate has been in freefall since 2017. Adding to this
pressure, the COVID crisis saw a significant number of Western Australians returning home in 2020.
Median Rent and Vacancy Rate
$440 8%
$420 7%
6%
$400
5%
$380
4%
$360
3%
$340
2%
$320 1%
$300 0%
Jun-17
Jun-16
Jun-18
Jun-19
Jun-20
Mar-17
Mar-16
Sep-16
Dec-16
Sep-17
Dec-17
Mar-18
Sep-18
Dec-18
Mar-19
Sep-19
Dec-19
Mar-20
Sep-20
Dec-20
Mar-21
Median house rent Median unit rent Vacancy rate
Source: REIWA data
The weekly median rent for a unit accounts for over 51 per cent of the State Minimum Wage, while
the median rent for a house is nearly 57 per cent. Households are considered to be in “housing
stress” when their housing costs exceed 30 per cent of their income and their earnings are in the
bottom 40 per cent of equivalised disposable income (which is the case for minimum wage earners).
If a household earning a minimum wage is paying over 51 per cent of their income on rent in a
median rental property, then they most certainly qualify as being in severe housing stress.
6Median Rent and the State Minimum Wage
58%
56.58%
56%
54%
51.32%
52%
50%
48%
46%
44%
42%
40%
Median house rent as % of SMW Median unit rent as % of SMW
Source: Calculations based on REIWA and WA Department of Commerce data
Housing costs have a disproportionate impact on those living on the lowest incomes. An examination
of the ABS Survey of Income and Housing data reveals the substantial increase in the cost to income
ratio for households on the lowest incomes since 2011-12, while those on the highest saw their cost
to income ratio decline since 2007-08.3
Housing costs as a proportion of gross household income, Australia 1994-95 to 2017-18
Source: ACOSS/UNSW (2020)
3ACOSS/UNSW Poverty and Inequality Partnership (2020) Poverty, Property and Place: A geographic analysis of poverty
after housing costs in Australia, City Futures Research Centre & the Social Policy Research Centre
7When housing costs for private renters are taking into account to reveal what households have left
to spend on other living expenses, the East Pilbara has the highest percentage of private renter
households in poverty. The Roebuck region of the Kimberley rates as the area with the tenth highest
percentage of private rent households in poverty after housing costs across Australia.4
Top 10 SA2s by percentage of private renter households in poverty after housing costs 2015-16
SA2 State/Territory
East Pilbara WA
Ravenswood TAS
Carlton VIC
Bridgewater-Gagebrook TAS
Cooloola QLD
Fairfield NSW
Elizabeth SA
Mudgee Region – East NSW
Forster-Tuncurry Region NSW
Roebuck WA
Source: ACOSS/UNSW (2020)
The HILDA data also reveals that, both before and after housing costs are factored in, social housing
tenants can be observed to have the highest rates of poverty.
Relative poverty rates by housing tenure type, 2018
Source: HILDA (2020)
4 ACOSS/UNSW (2020) Poverty, Property and Place
8They are followed by private renters and then those who own their homes without a mortgage. The
after-housing cost measure, however, decreases the poverty rate for the latter group from 15 per
cent to 7.5 per cent, while for private renters it increases from 13 to 20 per cent.5
Across the Perth metropolitan region, higher levels of poverty can be observed around the urban
periphery, typically within the middle and fourth poverty rate quintiles. The areas with the highest
poverty rates after housing costs, however, are centred in areas like Girrawheen and Mirrabooka,
Bentley and Wilson, Beckenham and Kenwick, Armadale and Gosnells, Calista and Parmelia,
Cooloongup and Mandurah.6
The annual Anglicare Rental Affordability Snapshot takes a ‘snapshot’ on a given day of the rental
market and examines whether the properties being advertised are both affordable for a range of
different low income types and whether those properties are appropriate for the composition of
their household.7
The 2020 Rental Affordability Snapshot took place over 27-28 March 2021.The report found that
only 48 or 1.5 per cent of properties advertised for rent in Perth were affordable and appropriate for
a single on the minimum wage. Due to slightly lower rents in the South West and the Great
Southern, 2.4 per cent of properties in that area were affordable and appropriate, though that only
equated to 6 actual properties. No properties were affordable and appropriate for a single person on
the minimum wage in the North West.
Affordable and Appropriate Properties by Region and Household Type
South West and
Household Type Payment Type Perth Metro North West
Great Southern
# % # % # %
Single Minimum Wage 48 1.5% 6 2.4% 0 0%
Minimum Wage +
Single, two children 59 1.8% 24 9.6% 0 0%
FTB A & B
Minimum Wage +
Couple, two children Parenting payment 878 27.2% 144 57.8% 19 8.7%
(partnered) + FTB A & B
Couple, two children Minimum Wage + FTB A 235 7.3% 62 24.9% 7 3.2%
Total number of properties 3,228 249 218
Median rent per week $430 $370 $550
Source: Anglicare WA (2021) Rental Affordability Snapshot – Western Australia
5 Roger Wilkins et al (2020) HILDA
6 ACOSS/UNSW (2020)
7 Anglicare WA (2021) Rental Affordability Snapshot – Western Australia
9Since 2020, the report found that median rents had increased in the Perth Metro area by 16 per cent
from $370 to $430, in the South West and Great Southern by 12 per cent from $330 to $370, and in
the North West by 17 per cent from $470 to $550.
Over the last twelve months, Perth couples living on the minimum wage and in receipt of the
Parenting Payment (meaning they are caring for a child under 6) saw a drastic drop in the
affordability of rental properties, from 34 per cent to 7 per cent, as a result of escalating rental
prices and the cessation of the Coronavirus Supplement. A single parent on the minimum wage,
supporting two children, saw a drop in affordability from 11 per cent to 1.8 per cent.
Perth Metro - Affordability
40%
35%
30%
25%
20%
15%
10%
5%
0%
2014 2015 2016 2017 2018 2019 2020 2020 Covid 2021
Supplement
Single + 2 kids, Min wage Couple + 2, Min wage & Parenting Payment
Source: Anglicare WA (2021) Rental Affordability Snapshot – Western Australia
Couples in the South West and Great Southern living on the minimum wage and in receipt of the
Parenting Payment saw a drop in affordability from 60.6 per cent to 24.9 per cent. A single parent on
the minimum wage, supporting two children, saw a drop in from 24.8 per cent to 8.7 per cent.
South West and Great Southern - Affordability
70%
60%
50%
40%
30%
20%
10%
0%
2014 2015 2016 2017 2018 2019 2020 2020 Covid 2021
Supplement
Single + 2 kids, Min wage Couple + 2, Min wage & Parenting Payment
Source: Anglicare WA (2021) Rental Affordability Snapshot – Western Australia
10In the North West, couples living on the minimum wage and in receipt of the Parenting Payment saw
a drop in affordability from 12 per cent to 2.8 per cent, while single parents on the minimum wage,
supporting two children, saw a drop in from 6 per cent to zero per cent.
North West - Affordability
16%
14%
12%
10%
8%
6%
4%
2%
0%
2014 2015 2016 2017 2018 2019 2020 2020 Covid 2021
Supplement
Single + 2 kids, Min wage Couple + 2, Min wage & Parenting Payment
Source: Anglicare WA (2021) Rental Affordability Snapshot – Western Australia
The findings of this snapshot make clear how unaffordable the rental market has become for people
on the minimum wage in WA. What is important to note, is that this snapshot took place on the last
two days that the moratorium on evictions and rental increases was in place. What has already
become apparent for community services, is that since the moratorium’s end this already dire
situation has drastically worsened. Rental prices are predicted to continue to rise by an additional 10
to 15 per cent throughout 2021.8
A targeted survey of service providers who deliver frontline services to people who have been or are
facing eviction, or had their rent significantly increase as a result of the rental moratorium lifting,
was undertaken in April 2021 by WACOSS and Shelter WA.9
The survey was completed by community housing providers, homelessness services, support
services and outreach, and tenancy support providers including intensive family support workers,
and agencies providing emergency relief. Regions covered included Perth metro, South West,
Wheatbelt, the Midwest and Gascoyne and the Peel.
When asked about the impact on their services in the month leading up to the end of the
moratorium, 100 percent of those services reported an increase in number of calls for assistance,
and 86 per cent reported an increase in the number of people they are unable to assist and have had
to turn away.
When asked for the reasons people provided for contacting their services, these were:
8 REIWA (2021) ‘Strong property market conditions expected in WA in 2021’, Online article. Available at:
https://reiwa.com.au/about-us/news/strong-property-market-conditions-expected-in-wa-in-2021/
9 https://www.shelterwa.org.au/data-shows-impact-on-people-and-services-in-the-lead-up-to-rental-moratorium-lifting/
11 Trouble finding an affordable rental home (100 per cent)
Facing eviction (71 per cent)
Increase in rental prices (100 per cent)
Unable to pay bonds (43 per cent)
Income not covering the basic necessities (86 per cent)
One service reported a 500 per cent increase in the number of calls for assistance that they receive
each day, with another reporting that they now receive 50 calls a day for private tenancy support. A
service stated that “A single mother of five children has had a rent increase from $350 per week to
$550 per week. The likelihood is that the mother and her five children are expecting to be homeless.”
As housing costs are the single largest component of the household budget for most households,
and hence impact disproportionately on the cost of living for lower income and minimum wage
households, it is critical to take into account housing affordability when considering the adequacy of
the minimum wage.
The more of their income that households must dedicate to covering housing costs, the less they will
be able to spend on other essentials like food, energy and health. It can also mean that any slight
increase in their rent can have a dramatic impact on their ability to stay in a property and maintain
the important connections they have established throughout their local community, along with their
proximity to jobs and services.
Homeowners with a mortgage in Western Australia are also facing significant strife. As of September
2020, Perth had the highest city-wide average mortgage ‘delinquency’ rate of the four largest cities
in Australia. That rate is determined by the number of accounts that are 30 days past due. In the
outer-suburbs of Perth, those rates were more than 100 per cent higher than the city average.10
Regional analysis conducted by Shelter WA earlier this year found that 20 per cent of homeowners
with a mortgage in the Mining and Pastoral region (Kimberley, Pilbara, North West Central and
Kalgoorlie) were in mortgage stress. In the South West region (Mandurah, Albany, Vasse, Warren-
Blackwood, Murray-Wellington, and Collie-Preston), 21 per cent of all mortgage holders are
experiencing mortgage stress.11
Australians experiencing financial vulnerability, hardship and bill stress for the first time as a result of
COVID-19 impacts are often over-leveraged and are more likely to take out loans than those
experiencing long-term hardship. Compared to other mortgage holders, those experiencing
‘emerging hardship’ were more likely to defer their mortgage repayments during the six-month
COVID loan deferral period, indicating an inability to pay due to the financial impacts of COVID-19.
Those seeking mortgage payment relief also have relatively high outstanding mortgage balances
(which have now accrued additional interest and fees), and are over-leveraged compared to other
mortgage holders, placing them at increased risk of financial insecurity and debt. 12
10 Tawar Razaghi (2020) ‘The postcodes where Australians are most behind on mortgage repayments’, Domain, Online
article. Available at: https://www.domain.com.au/news/the-top-postcodes-around-ausralia-behind-on-mortgage-
repayments-1011924/
11 Shelter WA (2021) Heat Map Survey: Homelessness & Housing Stress, Unlock Housing
12 Core Data Research (2020) “How to recognise the new face of financial hardship”, Online article. Available at:
https://www.coredata.com.au/blog/how-to-recognise-the-new-face-of-financial-hardship/
123.2 Food
Low income is the strongest and most consistent predictor of food insecurity. Food insecurity is the
state of being without regular access to a sufficient quantity of safe, nutritious food to meet an
individual or household’s nutritional needs. It often corresponds with lower access to other basic
needs, such as safe and affordable housing and secure employment as well as increased use of
healthcare. Ongoing food insecurity has been demonstrated to manifest in negative health
outcomes for Australian adults, including malnutrition, obesity, diabetes, cardiovascular, some
cancers and other diet-related disease, as well as poorer mental health.13 Children in food insecure
Australian households demonstrate poorer health and education outcomes, including emotional and
behavioural issues as well as more missed days of school.14 Low income, food insecurity and illness
are inextricably linked.
Research suggests that the prevalence of food insecurity in Australia is anywhere between 4 per cent
and 36 per cent of the total population depending on the definition and measurement used,15
reaching as high as 90 per cent among certain vulnerable groups.16 A higher prevalence of food
insecurity has been reported among asylum seekers, Aboriginal and Torres Strait Islander peoples,
female-headed single-parent households, households facing financial stress, people with disabilities,
and those experiencing mental health issues, homelessness, unemployment and low socioeconomic
status.17 Middle income families who have recently had a drop in income and who have high living
expenses may also experience food insecurity due to a lack of available funds to allocate to food
purchases.18
Low wages and competing living expenses act as compounding barriers to food security for lower-
income households. The household food budget is considered to be more flexible compared to other
fixed household and health expenses, such as rent, utility and medical bills, such that a household
receiving a low disposable income that experiences a sudden additional expense is likely to lower
their food budget, or skip meals, to compensate.19 As well as being associated with lower total food
consumption, low income is associated with poor quality dietary intake. A number of studies have
examined the cost of ‘healthy’ food and assessed its affordability for low socio-economic
households,20 finding that ‘healthy’ diets are difficult to afford for low-income households.
13 Ramsey R., Giskes K., Turrell G., Gallegos D. Food insecurity among adults residing in disadvantaged urban areas:
Potential health and dietary consequences. Public Health Nutr. 2012; 15:227–237. doi: 10.1017/S1368980011001996.
14 Ramsey R., Giskes K., Turrell G., Gallegos D. Food insecurity among Australian children: Potential determinants, health
and developmental consequences. J. Child Health Care. 2011;15:401–416. doi: 10.1177/1367493511423854
15 Butcher, Lucy. M., Maria M. Ryan, Therese A. O’Sullivan, Johnny Lo and Amanda Devine 2018. What
Drives Food Insecurity in Western Australia? How the Perceptions of People at Risk Differ to Those of
Stakeholders. Nutrients 10. doi: 10.3390/nu10081059
16 McKay, Fiona and Matthew Dunn 2015. Food security among asylum seekers in Melbourne. Australian
and New Zealand Journal of Public Health 39: 344-349. doi: 10.1111/1753-6405.12368
17 Lindberg, Rebacca, Mark Lawrence, Lisa Gold, Sharon Friel and Olivia Pegram 2015. Food insecurity in
Australia: Implications for general practitioners. Australian Family Physician 44: 859-862.
18 Burns, C. (2004). A review of the literature describing the link between poverty, food insecurity and obesity with specific
reference to Australia. Melbourne: Victorian Health Promotion Foundation.
19 Booth S, Smith A. Food security and poverty in Australia -- challenges for dietitians. Australian Journal of Nutrition &
Dietetics. 2001;58(3):150–6.
20 French SA, Harnack L, Rydell S, Mitchell NR, Oakes MJ. (2017) Financial incentives and purchase restrictions in a food
benefit program affect the types of foods and beverages purchased: Results from a randomized trial.
IJBNPA;14:127. https://doi.org/10.1186/S12966-017-0585-9.
13Increased Odds of Experiencing Food Insecurity for Minimum Wage Earners
Recent research by Kent et al. (2020) analysing socio-demographic predictors of food insecurity in
Tasmania found household income above AU$80,000/year to be seemingly protective against food
insecurity, and income below AU$40,000 per year to be associated with a two-fold increase in the
odds of food insecurity.21 Seeking to understand whether the COVID-19 pandemic further
exacerbated economic vulnerabilities and food insecurity among Tasmanian households, Kent et al.
(2020) examined the prevalence of food insecurity among respondents receiving COVID-19 related
Australian government benefits (JobKeeper or JobSeeker). In comparison to those who were
employed and not receiving government benefits, respondents who were receiving the JobKeeper
government support payment of $750 per week had 20 per cent higher odds of experiencing food
insecurity. Those who were receiving Jobseeker support payments ($565.70 per week) had a three
and a half-fold increase in the odds of experiencing food insecurity.
For comparison purposes, an adult aged 21 years or above in Western Australia receiving the
minimum wage and working full time receives a weekly income of $760 per week - comparable to
the weekly JobKeeper rate - and an annual income of $39,520, before tax. In addition, consumer
prices in Perth are 8.32 per cent higher than in Hobart, with grocery prices in Perth 5.84 per cent
higher than in Hobart.22 Applying Kent et al’s (2020) findings to the Western Australian context and
taking into consideration the relatively higher cost of living, it seems reasonable to conclude that an
adult working full-time at the minimum wage rate is not adequately protected against food
insecurity, and at greater risk of food insecurity compared to higher-income earners. For adults
under 21 working full time and receiving a lower weekly rate, the odds of experiencing food
insecurity are likely much higher.
Kent et al. (2020) concluded that:
“as loss of income was a major factor in our analyses, effective government responses should center
around providing opportunities for secure employment that pays a living wage, rather than a
minimum wage.”23
Corroborative research analysing wage-setting policies, employment and food insecurity in 139
countries suggests that wage-setting policies may be an important intervention for addressing risks
of food insecurity among low-income workers.24
Minimum Wage Earners and Food Stress
Food affordability is defined as the amount of money a household spends on food, relative to that
household’s income. A common indicator of unaffordability is when food costs 30 per cent or more
21 Kent K, Murray S, Penrose B, Auckland S, Visentin D, Godrich S, Lester E. (2020) Prevalence and Socio-Demographic
Predictors of Food Insecurity in Australia during the COVID-19 Pandemic. Nutrients.; 12(9):2682.
https://doi.org/10.3390/nu12092682
22 Budget Direct, 2021. https://www.budgetdirect.com.au/interactives/costofliving/compare/hobart-vs-perth/
23 Kent et al. (2020)
24 Reeves, A., Loopstra, R., & Tarasuk, V. (2021). Wage-setting policies, employment, and food insecurity: A multilevel
analysis of 492 078 people in 139 countries. American Journal of Public Health, 111(4), 718-725.
14of disposable income.25 More recently, 25 per cent of disposable income has been posited as the
level where after ‘food stress’, a similar concept to housing stress, occurs.26
According to Suncorp’s 2020 Cost of Food report,27 the average food spend per week (including
groceries, dining out, alcohol, takeaway food, coffee, specialist health foods and supplements) for
Western Australia households is $266. This is higher than the national average of $237 per week. For
a full-time worker 21 years or above receiving the minimum wage, this amounts to almost 40 per
cent of their total weekly income after tax ($668) and increases to 54 per cent of the total income
for workers aged 18. Maintaining a diet in line with community standards is simply not achievable on
a full-time minimum wage, unless spending on other basic needs is greatly reduced or subsidised
elsewhere. Low-income households faced with allocating 25-30 per cent of their income to food
purchases would have to forgo many of the items on which other Australian households can
comfortably consume.
COVID-19 and food insecurity
COVID-19-induced loss of employment and income saw a dramatic rise in numbers of ‘newly food
insecure groups’28 made up of those locked out from JobSeeker and JobKeeper payments, by virtue
of their employment or visa status. These new cohorts included international students, migrant
workers as well as many among the newly unemployed who had not previously utilised food charity
services. According to the Foodbank Hunger Report 2020, food charities have seen a significant
increase in the demand for food relief. In 2019, 15 per cent of Australians experiencing food
insecurity were seeking food relief at least once a week. In 2020 this has more than doubled to 31
per cent.29 Although charities are seeing demand for food relief become more erratic and
unpredictable, overall numbers are up by an average of 47 per cent. Millions of Australians are
evidently living day-to-day with very little financial safety net, possibly one pay cheque away from
being able to put food on the table.
The Emergency Relief Food Access Service (ERFAS)30 reports that emergency food relief needs are
continuing to increase across Western Australia. March 2021 saw a month-on-month increase of 19
per cent of people accessing emergency relief (and a 126 per cent increase from November),
reflecting increased community hardship linked to the progressive winding back of COVID supports.
During March 2021, 932 clients and 515 children were assisted and provided with 1,119 emergency
relief pathways worth $62,960 in material support. 6 per cent of these clients (n=56) were
employed.
25 Barosh L, Friel S, Engelhardt K, Chan L. (2014) The cost of a healthy and sustainable diet--who can afford it? Aust N Z J
Public Health, 38(1):7–12.
26 Landrigan, T. J., Kerr, D. A., Dhaliwal, S. S., & Pollard, C. M. (2018) Protocol for the Development of a Food Stress Index to
Identify Households Most at Risk of Food Insecurity in Western Australia. International journal of environmental research
and public health, 16(1), 79. https://doi.org/10.3390/ijerph16010079
27 SunCorp, (2020). https://www.suncorpgroup.com.au/news/news/cost-of-food-trends-australia
28 Foodbank (2020) Foodbank Hunger Report 2020. Available online: https://www.foodbank.org.au/wp-
content/uploads/2020/10/FB-HR20.pdf
29 Ibid
30
Emergency Relief and Food Access Service: https://www.financialcounsellingnetwork.org.au/emergency-
relief-and-food/
15For people on low-incomes receiving income support, increases to income via the Coronavirus
Supplement have had a significant effect on the daily amount and quality of food consumed. In May
2020, the Raise The Rate campaign surveyed 955 people on JobSeeker Payment, Youth Allowance,
Parenting Payment, and Austudy, who were receiving the Coronavirus Supplement. Their responses
highlighted the positive, tangible benefits of increased income, particularly on people’s ability to
cover essential food costs and other vital expenses.
Impact of Increased Income on Consumption of Fruits and Vegetables
Prior to the introduction of the Coronavirus After the introduction of the Coronavirus
Supplement Supplement
93% reported they could afford more fresh fruit
60% of people said they do not eat fresh
and vegetables;
produce
86% reported they could afford more meat
75% of people said they skipped meals because
The number of people skipping meals due to a
of a lack of funds
lack of funds dropped by over half, to 33%
20% of people saying they were skipping at
83% reported that they were eating better
least one meal per day
59% were now able to save up for major
66% of people had less than $14 a day to live
household items for better food storage like
on, after paying their rent or mortgage
fridges and freezers
Source: ACOSS and Raise the Rate Campaign (2020)31
Increasing the minimum wage and the purchasing power of low-wage working families can help
protect households against food insecurity, help low-wage earners afford a more nutritious and
sufficient diet, and may help alleviate the growing trend of food insecurity across the state.
31ACOSS and Raise the Rate Campaign (2020) Survey Of 955 People Receiving The New Rate Of JobSeeker And Other
Allowances. Available online: https://www.acoss.org.au/wp-content/uploads/2020/06/200624-I-Can-Finally-Eat-Fresh-
Fruit-And-Vegetables-Results-Of-The-Coronaviru.._.pdf
163.3 Energy
Mounting unpaid bills and utility disconnections can have a significant impact on people’s wellbeing,
from feelings of shame, the stress of trying to stretch their income as far as possible, and the difficult
decisions they have to make as to what to prioritise, such as not eating or not cooling their homes
during the heights of summer. It also impacts their ability to access affordable credit in future.
The cost of energy disproportionately impacts households on the lowest incomes, as they spend a
higher percentage of their disposable income on energy bills and have little, if any, capacity to
absorb additional costs.
Electricity and gas expenditure as a percentage share of income by disposable income quintiles
(Australia-wide)
7%
6.4%
5.9%
6%
5%
4% 3.6%3.8%
3% 2.7%2.8%
2.1%2.3%
2% 1.4%1.5%
1%
0%
Lowest 20% Second 20% Middle 20% Fourth 20% Highest 20%
2008 2018
Source: ACOSS and the Brotherhood of St Laurence (2018)
As noted by the Economic Regulation Authority WA, disconnection data is a “valuable indicator of
how affordable energy is to customers.”32 In March 2020, a disconnection moratorium was put in
place by the State Government to assist electricity residential customers experiencing hardship as a
result of COVID-19. As a consequence, disconnections for electricity residential customer decreased
in 2019/20 for the first time in three years. The disconnection moratorium has now been extended
until 30 June 2021. However, during the three years prior to the moratorium, the percentage of
electricity disconnections has increased, with 2018/19 seeing it exceed 2.0 per cent for the first time
since the Economic Regulation Authority WA commenced reporting on electricity retailer
performance in 2007.33
32 Economic Regulation Authority (2020) Annual Data Report – Energy Retailers 2018/19
33 WACOSS (2020) Cost of Living Report
17Percentage of residential and business electricity customer disconnections 2014 to 2019
Source: Economic Regulation Authority WA (2020)
Number and percentage of residential electricity customer disconnections 2014 to 2019
2013/14 2014/15 2015/16 2016/17 2017/18 2018/19
Number 9,235 9,412 9,774 15,935 19,743 21,212
Percentage 0.97 0.97 0.96 1.60 1.91 2.02
Source: Economic Regulation Authority WA (2020)
Western Australia continued to have the highest residential electricity disconnection rate among the
comparable jurisdictions of News South Wales, Victoria and South Australia, with the gap between
WA and the next highest widening by 0.7 percentage points in 2018/19.
Residential gas disconnections decreased in 2018/19, though this was solely due to the decrease
reported by Alinta Energy. WA continued to have the highest residential gas disconnection
percentage across comparable jurisdictions.
The data collected by the Economic Regulation Authority WA relating to electricity customers on
hardship programs, granted more time to pay and on instalment plans makes clear that the
affordability of energy has been a significant challenge in WA.
From 2017 to 2019, the total number of electricity customers on a hardship program increased by
60.5 per cent.
18Number and percentage of electricity customers on a hardship program at 30 June 2017 to 2019
2016/17 2017/18 2018/19
Number 21,948 31,552 35,218
Percentage 2.21 3.04 3.36
Source: Economic Regulation Authority (2020)
The percentage of residential customers granted more time to pay a bill. In 2018/19 was the highest
it had been in the past six years, at 13.4 per cent.
Electricity customers granted more time to pay a bill 2014 to 2019 (%)
Source: Economic Regulation Authority (2020)
The percentage of residential customers needing to go on instalment plans due to difficulties in
paying their energy bills in 2018/19 was also the highest reported in the past six years, at 6.7 per
cent.
Electricity customers on instalment plans 2014 to 2019 (%)
Source: Economic Regulation Authority WA (2020)
19Analysing data for clients seeking support from the Financial Counselling Network of WA in 2019, we
were able to see that the average household in financial debt was spending around $113 per week
on utilities, of which on average $58 is electricity, $27 is water and $29 is gas. Households were
spending slightly more on utilities on average in Outback South ($129) and Perth South-East ($125),
and slightly less in Outback North ($83) and Perth North West ($105).
Breakdown of weekly spending on utilities for financial counselling clients by location
Source: Financial Counselling Network of WA (2019)
One of the earliest actions taken by the Western Australian Government to provide economic
assistance for households as the scale of the COVID-19 pandemic began to become apparent, was to
announce a $305 boost to the Energy Assistance Payment, effectively doubling its value. At the same
time, the WA Government announced a freeze on all State household fees and charges, including
electricity, water, motor vehicle charges, the emergency services levy and public transport fares.34
This freeze followed a decision in the previous State Budget to hold increases to household fees and
charges at 2 per cent, the lowest increase in 13 years.
Two weeks later, the State Government unveiled further support for households, including bringing
forward the boost payments to the then current financial year, rather than being paid from 1 July
2020, and a moratorium on electricity disconnections or water restrictions for people experiencing
34Hon Mark McGowan MLA, Hon Ben Wyatt MLA (2020) ‘COVID-19 economic response: Relief for businesses and
households’, Media Statements, Government of Western Australia
20financial hardship. It was also announced that no interest would be charged on deferred bill
payments for Synergy and Horizon Power customers.35
From 1 November 2020, all WA households also received a one-off $600 credit on their residential
electricity bill, funded from the Bell Group settlement.36 The impact of this credit on the electricity
bills of households will show in the modelling undertaken for next year’s WACOSS Cost of Living
Report.
Importantly, we are now at a point where most households will have used up that $600 credit, and
some energy retailers have recommenced disconnecting customers. Without that credit and
support, households are once again having to grapple with the unaffordability of energy that had
resulted in Western Australia having the highest disconnection rate in the nation. As such, a rise in
the minimum wage is essential so that those on low incomes are able to cover their power bills and
maintain their living standards.
35 Hon Mark McGowan MLA, Hon Ben Wyatt MLA (2020) ‘$1 billion COVID-19 economic and health relief package
unveiled’, Media Statements, Government of Western Australia
36 Hon Mark McGowan MLA, Hon Ben Wyatt MLA, Hon Bill Johnston MLA (2020) ‘Every WA household to receive a $600
electricity bill credit’, Media Statements, Government of Western Australia
213.4 Costs in the Regions
It is important when considering the adequacy of the minimum wage that differences in the cost of
living for regional areas is taken into account, particularly in the north of the state.
Limitations of the data on detailed household expenditure patterns in the ABS Household
Expenditure Survey mean there is insufficient detail to confidently extend the WACOSS Cost of Living
household models to individual regions within WA. While the data below accurately reflects the
differences in costs of essential items, we recognise that low income households living in these
regions will, where possible, change their actual expenditure patterns to compensate, so they can
balance their weekly budget.
Analysis of rental costs for the four model households based on REIWA market data is included in
the table below. It is important to note that availability can become an even more critical factor in
regional areas with smaller housing markets and a more limited range of choice. While our analysis
reflects the projected costs for the type of appropriate housing assumed in the four models, real
households may not be able to secure appropriate housing at that rate in some regional centres, and
hence would be forced to compromise on either the appropriate dwelling size for their household
composition, or on its affordability.
Weekly Expenditure across the Regions - RENT
Goldfields Great Mid South Wheat
Perth Gascoyne Kimberley Peel Pilbara
Esperance Southern West West -belt
Single parent
& Age $283.68 $163.63 $251.81 $248.20 $308.76 $164.26 $230.56 $330.44 $250.75 $228.65
pensioners
Two parent
$313.44 $250.75 $311.31 $299.20 $475.58 $248.20 $270.09 $515.95 $292.19 $233.33
family
Unemployed
person $104.48 $83.58 $103.77 $99.73 $158.53 $82.73 $90.03 $171.98 $97.40 $77.78
(1/3rd share)
Source: Calculations based on REIWA market data
The Mid West is the most affordable region to rent in for the single parent and age pensioner model
households, with rental costs for units lower by $118.42 per week for those household types than in
Perth. The Wheatbelt is slightly more affordable than the Mid West for the working family and
unemployed person, as a result of slightly lower median rental costs for houses in the region, but
higher costs for renting units.
The Pilbara is the most expensive region for the single parent and age pensioner model households,
spending $46.76 more each week than their equivalents in Perth. The Pilbara is also the most
expensive region for the working family and unemployed single models to rent in, followed by the
Kimberley.
22Weekly Difference from 2018/19 across the Regions - RENT
Goldfields Great South Wheat
Perth Gascoyne Kimberley Mid West Peel Pilbara
Esperance Southern West -belt
Single parent
$4.24 -$13.38 $1.06 -$1.06 -$3.62 $1.70 -$9.14 -$1.70 $6.37 $35.13
& Age
1.52% -7.56% 0.42% -0.43% -1.16% 1.05% -3.81% -0.51% 2.61% 18.15%
pensioners
Working $7.44 -$17.64 $11.05 $3.19 $4.89 $4.67 -$0.42 $55.25 $13.81 -$8.50
family 2.43% -6.57% 3.68% 1.08% 1.04% 1.92% -0.16% 11.99% 4.96% -3.51%
Unemployed $2.48 -$5.88 $3.68 $1.06 $1.63 $1.55 -$0.14 $18.41 $4.61 -$2.83
person 2.43% -6.57% 3.68% 1.07% 1.04% 1.91% -0.16% 11.99% 4.97% -3.51%
Source: Calculations based on REIWA market data
The cost of renting a house in the Pilbara spiked during 2019/20, though unit rental costs remained
relatively stable. Conversely, advertised rents for units in the Wheatbelt increased dramatically,
while those for houses dropped slightly. The South West also saw substantial increases in rental
costs across the board, though rents remain lower than they are in the Perth metropolitan area. The
Gascoyne was the only region that appeared to see any substantial decrease in rental costs during
the financial year.
Weekly Expenditure across the Regions – FOOD AND BEVERAGES
Goldfields Great Mid South Wheat-
Perth Gascoyne Kimberley Peel Pilbara
Esperance Southern West West belt
Single parent $216.50 $227.11 $227.54 $210.00 $242.69 $226.67 $215.42 $229.70 $217.80 $215.42
Two parent
$312.28 $327.58 $328.21 $302.91 $350.07 $326.96 $310.72 $331.33 $314.15 $310.72
family
Unemployed
$95.78 $100.48 $100.67 $92.91 $107.37 $100.28 $95.30 $101.62 $96.36 $95.30
person
Age
$191.56 $200.95 $201.33 $185.82 $214.74 $200.57 $190.61 $203.25 $192.71 $190.61
pensioners
Source: Calculations based on ABS 2015/16 HES, 2020 CPI and 2019 RPI data
23The cost of food and beverages is the highest in the Kimberley, followed closely by the Pilbara. Food
prices in Peel, the Wheatbelt, the Southwest and Great Southern regions are all comparable to Perth
metropolitan prices. Food prices in the Mid West and Gascoyne are slightly higher, but still lower
than in the Kimberley and Pilbara.
Weekly Expenditure across Network Areas - ELECTRICITY
Gascoyne/ Goldfields
SWIS Kimberley Pilbara
Mid West Esperance
Single parent $15.27 $17.70 $12.60 $36.69 $40.68
Working family $33.63 $36.50 $30.49 $58.84 $63.53
Unemployed
$8.98 $9.94 $7.94 $17.39 $18.95
person
Age pensioners $23.00 $25.43 $20.33 $44.42 $48.41
Source: Calculations based on usage data supplied by Horizon Power.
All model households are paying substantially more for electricity in the Pilbara and the Kimberley
than those in the Southwest Interconnected System (Perth, Peel, Southwest and Great Southern).
Model households in the Gascoyne/Mid West are spending slightly more than those in the SWIS,
with the electricity expenditure of model Goldfields/Esperance households noticeably lower.
As the Uniform Tariff Policy means that Horizon Power customers are charged for electricity at the
same rate as Synergy customers, these divergences are the result of different levels of energy
consumption. Climatic conditions outside of the SWIS have a significant impact on the amount of
energy required to maintain temperatures in homes at a liveable and comfortable level.
The high level of energy consumption and the resultant size of the bills, combined with their
seasonal and intermittent nature, mean that low-income households in regional areas can be at
substantial risk of bill shock, with the likelihood of falling into utility debt even higher during the
peak summer period.
24Weekly Expenditure across the Regions – WATER
Goldfields Great Mid South Wheat-
Perth Gascoyne Kimberley Peel Pilbara
Esperance Southern West West belt
Single parent $7.78 $9.64 $8.93 $5.40 $13.48 $8.38 $7.35 $13.64 $8.06 $7.86
Working
$9.46 $11.34 $10.81 $6.66 $16.57 $10.16 $8.95 $16.76 $9.79 $9.55
family
Unemployed
$3.15 $3.78 $3.60 $2.22 $5.52 $3.39 $2.98 $5.59 $3.26 $3.18
person
Age
$3.89 $4.82 $4.47 $2.70 $6.74 $4.19 $3.67 $6.82 $4.03 $3.93
pensioners
Source: Calculations based on average regional residential usage data supplied by the Water Corporation
Households in the Great Southern Region are on average spending the least on water, followed by
those in the Peel and Wheatbelt regions. Tariff cap policies mean that up to the first 300kL in
‘country south’ and 500kL in ‘country north’, residential water consumption charges are no more
than metropolitan charges, after which the charges reflect the cost of providing services in the
different country schemes. The lower water expenditure in those regions is thus a direct result of
lower consumption.
Pilbara households are spending the most on water. For example, our working family are paying on
average 74 per cent more per week or an extra $7.30 per week. In 2018/19, Kimberley households
were spending the most on average, but a drop in water usage has relegated them to second highest
spot this year.
253.5 Financial Stress and Hardship
The economic impacts of COVID-19 have impacted a significant proportion of Australian households
financially. These impacts include job losses, reductions in working hours, having to close their
businesses, or lower returns on investments affecting the incomes of self-funded retirees.
Subsequently, there are significant levels of concern among Australians about their current and
future financial wellbeing.
The ABS Household Impacts of COVID-19 Survey is a longitudinal survey that collects information
from the same panel of households each month. The January 2021 release of Household Impacts of
COVID-19 Survey37 collected information on household financial stresses and actions taken in
response. One in six (16 per cent) Australians reported their household took one or more financial
actions to support basic living expenses in January 2021.
Of the Australians that took a financial action to support basic living expenses:
9 per cent drew on accumulated savings or term deposits
4 per cent sold household goods or jewellery
3 per cent increased the balance owing on their credit card by $1,000 or more.
In addition, 8 per cent of Australians reported their household was unable to pay one or more
selected bills on time over the last three months.
Preliminary data from the 2020-21 ABS Survey of Income and Housing (SIH) on the June 2020 quarter
demonstrates that financial stress increased for households with employment earnings as their main
source of income. The proportion experiencing at least one indicator of financial stress rose to 37
per cent in the June 2020 quarter, up from 31 per cent in the previous three quarters.38
Household markers of financial stress during this period included:
Being unable to raise $2,000 within a week for an emergency (from 16 per cent to 20 per
cent).
Seeking financial help from friends or family (from 11 per cent to 14 per cent).
Seeking assistance from welfare or community organisations (from 2 per cent to 4 per cent).
More households with employment income drew down on savings or term deposits (from 8 per cent
to 11 per cent), and increased the balance owing on credit cards by $1,000 or more (from 4 per cent
to 7 per cent).39
37 ABS (2021) Household Impacts of COVID-19 Survey, Reference Period: January 2021. Available online:
https://www.abs.gov.au/statistics/people/people-and-communities/household-impacts-covid-19-survey/jan-2021
38 ABS (2020) Household financial resources, Reference Period: June 2020. Available online:
https://www.abs.gov.au/statistics/economy/finance/household-financial-resources/jun-2020
39 Ibid.
26This trend reversed for the September 2020 quarter, where fewer households experienced at least
one indicator of financial stress (32 per cent), potentially reflecting the positive financial impact of
the introduction of the Federal Government’s JobKeeper wage subsidy payment and Coronavirus
Supplement to JobSeeker.
AMP’s 2020 Financial Wellness Report provides a longer-term analysis of the impact of financial
stress on Australian workers.40 The findings are based on a survey of more than 2,100 Australians,
conducted between June and July 2020, are weighted using ABS data to reflect Australia’s broader
workforce. The report detailed how severe and moderate levels of financial stress are impacting 1.8
million Australian workers, with nearly half feeling financially stressed for an average of six and a half
years or more.41 The research, which has been conducted by AMP biannually since 2014, further
suggests that the gap between the financially well and those stressed is getting wider over time.
Women are experiencing rates of financial stress at almost double that to men, with approximately
one in five female employees reporting severe or moderate levels of financial stress, compared to 11
per cent of male employees. Younger women are particularly at risk, with 23 per cent of those aged
18 to 34 reporting severe or moderate levels of financial stress this year - almost three times the
number of male employees (eight per cent) in the same age group. 26 per cent of workers in the
hospitality industry reported being severely or moderately stressed, with retail the second most
40 AMP (2020) 1.8 million Australian workers suffering prolonged financial stress, costing $31 billion in lost productivity
41 Ibid.
27You can also read