2020INTERIM MANAGEMENT REPORT FIRST HALF - REPSOL
←
→
Page content transcription
If your browser does not render page correctly, please read the page content below
REPSOL S.A.                       2020 Interim
                                          Management Report
                                          First Half

Translation of a report originally
issued in Spanish.
In the event of a discrepancy,
the Spanish language version
prevails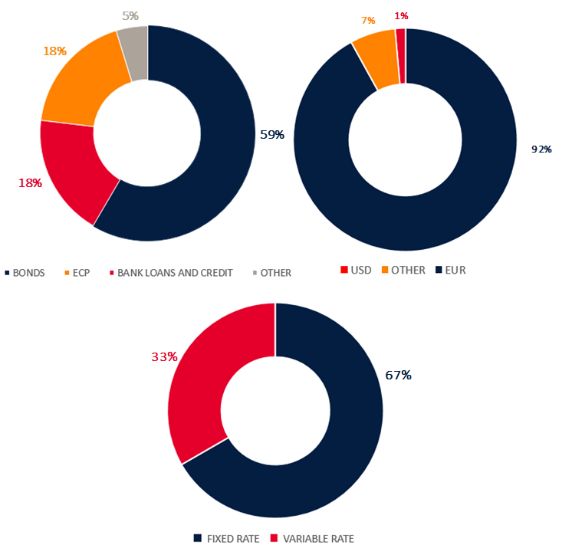
The Interim Management Report of the Repsol Group1 must be read together with the 2019 Consolidated
Management Report2. In conjunction with this report, Repsol publishes condensed interim consolidated financial
statements3 for the first half of 2020 (hereinafter, “interim financial statements for the first half of 2020”). The Board
of Directors of Repsol, S.A. approved both reports at its meeting of July 22, 2020.

The financial information contained in this document, unless expressly indicated otherwise, was prepared in
accordance with the Group’s reporting model, which is described below:

      Repsol presents its segment results including joint ventures and other companies that are jointly managed in
      accordance with the Group’s investment percentage, considering operational and economic indicators within the
      same perspective and degree of detail as those for companies consolidated under the full consolidation method.
      Thus, the Group considers that the nature of its businesses and the way in which results are analyzed for decision-
      making purposes are adequately reflected in this report.

      Given the nature of its business and in order to make its disclosures more readily comparable with those of its
      peers, the Group relies on Adjusted Net Income when measuring the earnings of each business segment. Adjusted
      Net Income means the current cost of supply (CCS), net of taxes and minority interests and excluding certain
      specific items of income and expense (“Special items”).

      For current cost of supply (CCS) earnings, the cost of volumes sold is calculated on the basis of procurement and
      production costs incurred during the period in question and not based on weighted average cost, which is the
      accepted methodology under European accounting law and regulations. The difference between CCS earnings and
      earnings at weighted average cost is included in the so-called Inventory Effect, which also includes other
      adjustments to the valuation of inventories (write-offs, economic hedges, etc.) and is presented net of taxes and
      minority interests. This Inventory Effect largely affects the Industrial segment.

      Furthermore, Adjusted Net Income does not include Special Items, i.e. certain material items that are presented
      separately to provide a more reliable view of the ordinary management of the businesses.

      Our reporting model uses Alternative Performance Measures (APMs), meaning measures that are “adjusted” to
      those presented under IFRS-EU. The information, breakdowns and reconciliations are included in Appendix I —
      Alternative Performance Measures of the 2019 Management Report and are updated with the quarterly
      information available on the Repsol website (www.repsol.com).

Repsol has updated the definitions of its operating and reporting segments to bring them in line with the new strategic
vision of the businesses. The following three business segments are therefore envisioned from 2020 onward:
Upstream, Industrial and Commercial and Renewables. For more information, see section 2.3. The financial
information presented for the first half of 2020 already reflects this new business and reporting structure. Information
for the previous year has also been restated so as to provide more reliable monitoring and comparability of the
information disclosed.

The non-financial information corresponding to sustainability indicators contained in this document was calculated
according to corporate rules that specify the criteria and common methods to be applied to each topic.

1   In this report, the names “Repsol,” “Repsol Group” or “the Company” are used interchangeably to refer to the business group consisting
    of Repsol, S.A. and its subsidiaries, associates and joint arrangements.
2
    This Interim Management Report has been prepared solely for the purpose of updating the consolidated Management Report for 2019.
3   The interim financial statements for the first half of the year have been subject to a limited independent review by the Group’s auditor.

                                                                           2
3
AN ENVIRONMENT MARRED BY THE COVID-19 CRISIS

The economic environment, largely shaped by the COVID-19 pandemic, has been exceptionally tough for
the operations and Repsol’s businesses. The social and economic impact of the pandemic significantly hurt          In this extremely
demand for hydrocarbons and caused a sharp drop in oil and gas prices.                                             challenging
                                                                                                                   environment,
Even in these extraordinary times, Repsol proved able to continue to operate and ensure the supply of              Repsol has
essential energy products and services to society, while safeguarding the health and safety of its                 focused on its
employees, clients and suppliers.                                                                                  role as a supplier
                                                                                                                   of essential and
Moreover, Repsol has taken steps to protect cash flow generation and strengthen the balance sheet, thus
enabling it to reduce its net debt over the period, despite the harshly adverse economic impact of the             strategic
COVID-19 crisis on the profitability of its businesses.                                                            products and
                                                                                                                   services for
In this context, the launch of the 2021-2025 Strategic Plan has been postponed until November 2020.                society
For more information, see sections 2.1. Impact of COVID-19 and 3. Environment.

2020 RESILIENCE PLAN

In the wake of the crisis triggered by the pandemic, Repsol reacted swiftly by creating and implementing a
Resilience Plan that assures continuity of operations, financial robustness and the Company’s investment-
grade credit rating. The Plan envisions reductions of more than 350 million euros in operating expenses
and more than 1,000 million euros in investments, along with optimizations of around 800 million euros in
working capital, compared with the metrics in our initial budget.

The Plan maintains the Company’s existing shareholder remuneration commitments for 2020 under the
current Strategic Plan. Also, reaffirms its pledge to lead the energy transition, in line with the objectives of
the climate change.

In line with the Plan, the Annual General Meeting held in May ratified the committed shareholder
remuneration, the Company continued with its investments in renewable energies and in projects aligned
with the energy transition, and the businesses and corporate areas achieved savings in operating costs and
investments during the period that were even higher than those envisioned. Accordingly, the Company is
confident of achieving reductions of 450 million and of more than 1,100 million euros, respectively, over
the entire year.

For more information, see sections 2.2 2020 Resilience Plan and 7.2 Outlook by business.

PERFORMANCE AND FINANCIAL POSITION

The prevailing global economic recession, the fall in oil and gas prices, the dramatic decline in demand for        Negative net
products and the increased cost of operating safely amid the pandemic have all shaped the financial                 income due
performance of our businesses.                                                                                      to the COVID-
                                                                                                                    19 crisis
 RESULTS FOR THE PERIOD (Millions of euros)                               1H 2020        1H 2019             ∆%
  Upstream                                                                    (51)           646               -
  Industrial                                                                   296           448         (-34%)
  Commercial and Renewables                                                    163           265         (-38%)
  Corporate and others                                                       (219)         (244)            10%
 Adjusted net income                                                           189         1,115         (-83%)
  Inventory effect                                                         (1,088)             63              -
  Special items                                                            (1,585)           (45)              -
 Net income                                                                (2,484)         1,133               -

                                                            4
Upstream results (-51 million euros) were hit by the dramatic decline in hydrocarbon prices, which has led
to decreased production from some assets. Results at the Industrial segment (296 million euros) were a
product of muted activity at refining and chemicals amid slumping demand and a gradual tightening of
margins during the period. The results of the Commercial and Renewables segment (163 million euros) were
affected by falling sales -especially at service stations and in aviation- due to the mobility restrictions put in
place to combat COVID-19. At Corporate, results saw an improvement following a reduction in finance costs
and corporate overheads, in line with the objectives set out in the Resilience Plan.
As a result, adjusted net income, which shows ordinary earnings obtained from managing the businesses,
amounted to 189 million euros, 83% down on the same period last year. The Company’s integrated
business model, together with its flexibility and the resilience of its assets, was vital in enabling its
businesses to achieve this positive result in such an adverse environment.
The prevailing volatility and the heavy decline in the prices of commodities and international products had
an extraordinary adverse impact on Repsol inventories, giving an inventory effect of -1,088 million euros,
versus 63 million euros in the first half of 2019.
Meanwhile, special items (-1,585 million euros) relate to the extraordinary accounting write-downs of
Upstream assets due to the updating of assumptions on future oil and gas prices as a result of the COVID-
19 crisis.
On balance, net income at the Group was negative (-2,484 million euros), versus 1,133 million euros earned
in the first half of 2019. For more information, see section 4.1 Results.
Despite the reduction in EBITDA due to the impact of COVID-19, cash flow from operations in the first half
amounted to 864 million euros, while free cash flow came to 172 million euros. For more information, see
section 4.2 Cash flows.
The measures put in place under the Resilience Plan to protect the balance sheet have been successful in
reducing net debt1 to 3,987 million euros, with a leverage ratio of 14.7%. The Group strengthened its
financial position by issuing senior Eurobonds in the period (EUR 1.5 billion) and perpetual subordinated €233 M
bonds (a further EUR 1.5 billion), while also extending its committed and undrawn credit facilities by a Reduction in
further 1,602 million euros. Group liquidity at the end of the period came to 9,762 million euros (including Net Debt1 vs
undrawn credit facilities).
Dec-19
During the period, rating agencies Standard & Poor’s, Moody’s and Fitch all confirmed Repsol’s investment
grade. For more information, see section 4.3 Financial position.
Shareholder remuneration in the first half of the year was equivalent to 0.424 euros per share2 under the
“Repsol Flexible Dividend” program, which replaces the interim dividend for 2019. Furthermore, and as a
result of the resolutions carried at the Annual General Meeting held in May, shareholders received
additional remuneration in July equivalent to 0.492 euros per share under the same scrip dividend program
and in lieu of the customary final dividend for 2019. With the aim of offsetting the resulting dilutive effect,
the General Meeting resolved to reduce capital through redemption of treasury shares, up to a maximum
amount equivalent to the number of shares issued under the scrip dividend completed in 2020. For more
information, see section 4.4 Shareholder remuneration.
1 Net debt without leases, which amounted to 4,220 million euros at year-end 2019.
2
As per Repsol’s commitment to purchase from shareholders their right to receive free shares under the scrip dividend (see section
4.4.).
5BUSINESS ACTIVITIES
At Upstream, against a backdrop of low crude oil and gas prices, the unit has prioritized value generation
over production volume, in the form of cost reduction plans and by redefining asset operation plans in a Successful
bid to reduce the cash break-even. To help achieve this, facilities have been temporarily shut down in exploratory
Canada, the United States and Colombia and pursued profitable growth, with highlights including the
campaign
successful exploratory campaign with discoveries in Alaska, Gulf of Mexico and Colombia, the start-up of
new development wells in Marcellus, Norway, Eagle Ford, Russia and Trinidad and Tobago, as well as new
acreage obtained in Indonesia, Norway and Russia. For more information, see section 5.1. Upstream.
At the Industrial segment, against the background of a deep and sharp reduction in demand, production,
logistics and commercial patterns were adjusted to keep utilization levels above international averages. Operations
This effort did not blur our focus on innovation and digitalization. We launched new projects in line with continue
the Group’s strategy of decarbonization and the circular economy, and took steps to enhance energy despite the
efficiency, environmental impact and operational reliability. For more information, see section 5.2. testing
Industrial. conditions
At Commercial and Renewables, the mobility restrictions had a negative impact on demand for oil products
and, more specifically, fuel. Nonetheless, Repsol kept up operation of its service stations. Over the first half, Enhanced range
we continued to drive our client-centric multi-energy supply model by developing our Electricity and Gas of multi-energy
businesses (1.07 million customers), launching a new 100% renewable self-consumption service products and
(“Solmatch”), making further progress on renewable projects (acquisition of Delta 2 in Aragón and start of services
construction on Kappa in Ciudad Real and on Valdesolar in Badajoz). For more information, see section 5.3.
Commercial and Renewables.
GOVERNANCE AND SUSTAINABILITY
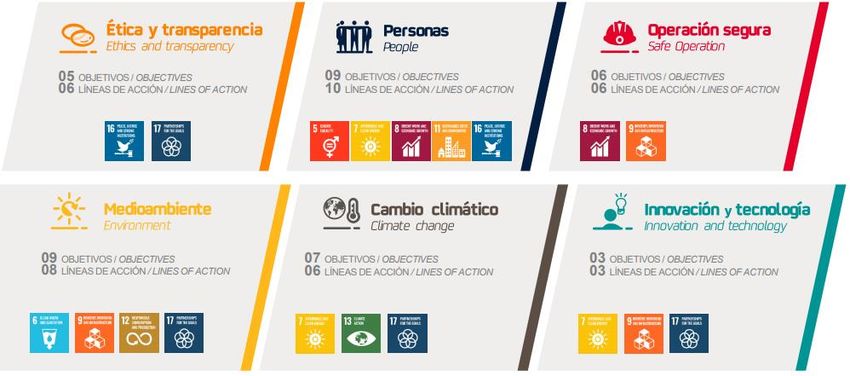
The Company has made further progress toward the Global Sustainability Plan and released its first SDG
2019 report, which presents Repsol’s contribution toward the 2030 Agenda of the United Nations and its
sustainable development goals. As we witness the energy transition toward a future of low emissions to
mitigate the effects of climate change, the Company remains firmly committed to reducing its Carbon
Intensity Score by 3% in 2020 when compared with 2016. Meanwhile, improvement actions have been put
in place at the Company’s facilities, generating an effective reduction in CO2 of 279 thousand tons over the
first six months of the year. The Company has also delivered on its pledge to invest 500 million euros
through the Green Bond issued in 2017 to support projects aimed at cutting greenhouse gas emissions.
Moving to the personnel accident rate, the Total Frequency Rate (TFR) has fallen when compared with
annual figures for 2019, while the number of Tier 1 + Tier 2 process safety incidents (PSIR) has risen
following an increase in incidents classified as Tier 2 in relation to non-conventional Upstream activity. In
the context of COVID-19, numerous measures have been implemented to safeguard the health and safety
of employees, without this affecting the Company’s operations or the service offered.
Repsol has sought at all times to protect the jobs of its workers, especially in the wake of the COVID-19 Committed to
health crisis. protecting jobs
For more information, see Section 6 Sustainability.
Repsol is acutely aware of the impact that the health and social crisis resulting from COVID-19 has had on
the communities in which it operates. It has therefore undertaken various actions and initiatives to mitigate
the effects, such as adapting existing equipment and shifting its competition lubricant laboratory toward
the production and free supply of much-needed hydroalcoholic gel for disinfecting hospitals and health
workers. It has also made donations to institutions such as the Red Cross to aid the delivery of basic
necessities and to provide housing for people at risk, support for low-income families, psychological
assistance and telephone social support and guidance for people forced to cope with loneliness.
6MAIN FIGURES AND INDICATORS
Financial indicators (1) (2) 1H 2020 1H 2019 Our businesses performance (1) 1H 2020 1H 2019
Results Upstream
EBITDA 589 3,712 Net daily liquids production (kbbl/d) 229 251
Results from operations 494 2,002 Net daily gas production (kboe/d) 446 446
Adjusted net income 189 1,115 Net daily hydrocarbon production (kboe/d) 675 697
Net income (2,484) 1,133 Average crude oil price ($/bbl) 35.8 59.6
Earnings per share (€/share) (1.63) 0.68 Average gas price ($/kscf) 2.2 3.2
ROACE (%) (8.4) 3.8 EBITDA 988 2,213
ROACE with leases (%) (7.3) 3.5 Adjusted net income (51) 646
Investments 1,113 1,468 Cash flows from operations 684 1,605
Cash and liquidity Investments 603 961
Cash flows from operations 864 2,530
Free cash flow 172 1,093
Cash generated (359) (124) Industrial
Liquidity 9,762 7,832 Refining capacity (kbbl/d) 1,013 1,013
Debt and available capital Crude oil processed 18.5 22.1
Net Debt (ND) 3,987 3,662 Conversion utilization Spanish refining (%) 91.4 102
Net Debt (ND) (with leases) 8,026 7,464 Distillation utilization Spanish refining (%) 76.1 89.3
Capital employed 27,076 34,697 Refining margin indicator in Spain ($/Bbl) 3.9 4.4
Capital employed (with leases) 30,966 38,391 Sales of petrochemical products (kt) 1,297 1,458
ND / Capital employed (%) 14.7% 10.6% EBITDA (670) 1,075
ND / Capital employed with leases (%) 25.9% 19.4% Adjusted net income 296 448
Shareholder remuneration Cash flow from operations 90 723
Shareholder remuneration (€/share) 0.424 0.411 Investments 227 306
Sustainability indicators (3) 1H 2020 1H 2019 Commercial and Renewables
People Service stations (number) 4,955 4,875
Number of employees 24,373 25,228 Own marketing sales 8,936 11,867
New employees 664 3,800 LPG sales (kt) 601 699
Safety and the environment Installed capacity - low emissions (MW) 2,952 2,952
Process safety indicator rate (PSIR) (4) 0.82 0.55 Electricity production (GWh) 2,293 2,186
Total recordable incident rate (TRIR) (4) 0.99 1.24 EBITDA 360 502
Reduction in CO2 emissions (Mt) 0.279 0.171 Adjusted net income 163 265
Cash flow from operations 125 370
Macroeconomic context 1H 2020 1H 2019 Investments 259 176
Average Brent price ($/bbl) 40.1 66.0 Sales of oil products (kt) 20,857 24,251
Average WTI price ($/bbl) 36.8 57.4
Average Henry Hub price ($/MBtu) 1.8 2.9 Stock market indicators 1H 2020 1H 2019
Electricity Pool - OMIE (5) (€/MWh) 29.0 51.8 Share price at period-end (€/share) 7.79 13.79
Average exchange rate (€/$) 1.10 1.13 Average share price (€/share) 9.79 14.81
CO2 (€/Tn) 21.7 24.0 Market capitalization at period-end (€ million) 12,193 21,489
(1) Where applicable, figures shown in million euros.
(2) More information in section 4 and Appendix I — Alternative Performance Measures.
(3) Figures and indicators calculated in accordance with the Group’s management policies and guidelines. For more information, see
section 6 of the 2019 Integrated Management Report.
(4) The figure for 2019 is at year-end.
(5)
Iberian Energy Market Operator.
7On March 11, 2020, the World Health Organization upgraded the public health crisis posed by the SARS-
CoV-2 virus (widely known as coronavirus or COVID-19) to international pandemic status. COVID-19 spread
rapidly to many countries and is remains a threat today. The sheer scale and speed of the events across the
globe has sparked an unprecedented health, social and economic crisis.
Even in these difficult times, Repsol has managed to ensure the safe operation of its businesses, most of
which are considered essential or strategic activities in the countries in which it operates. However, the
widespread decline in global economic activity and indicators in the wake of the pandemic has affected the
profitability of the company’s main businesses.
In this context, COVID-19 has had a significant impact on several of the material risks1 to our businesses:
Fluctuations in the reference price of hydrocarbons, derivative products and other commodities:
The economic impact of the COVID-19 pandemic, combined with other pre-existing complications on
the supply and demand side, has resulted in an exceptionally challenging price environment. We have
witnessed a dramatic decline in global consumption of oil, gas and other energy products as a result of
the measures put in place around the world in a bid to halt the spread of the pandemic. Meanwhile, in
early March 2020, OPEC+ members failed to reach an agreement to make further cuts in oil production
to counteract the decline in demand. These events led to the largest collapse in oil prices in decades,
which fell below $20/bbl by the end of March. We even witnessed negative prices for WTI 2 on 20 April,
reaching -$37.63/bbl. In the first half, Brent averaged $40.1/bbl (down 39% on the first half of 2019).
As for gas prices, the impact of COVID-19 has pushed down demand for gas in North America and for
LNG in China, which has led to an increase in inventories of stored gas and from February onward gas
prices converged within a very narrow range of below $2/MMBtu. For more information, see section
3.2 Energy landscape and 7.1 General outlook.
Drop in demand for our products
Demand for oil products in the first half of the year, and especially in the second quarter, saw a
significant downturn in response to the decline in economic activity stemming from COVID-19,
particularly as a result of the mobility restrictions put in place to stem the spread of the pandemic.
We have therefore seen a significant impact on the activity and profitability of our businesses.
Upstream:
The results and activities of Upstream have been heavily affected by the weak demand caused by the
price environment for crude oil and gas (see section 4). To mitigate the negative impacts, we have
throttled our business accordingly, prompting the segment to lower investment and adjusted
operations to protect profitability and asset value.
- The change in investment activity during the period has led to: (i) slower development work
at Akacías in Colombia; (ii) start-up of YME in Norway put back to 2021; and (iii) minimal
drilling activity at non-conventional sides in North America.
1 The information relating to the Group's main risks is set out in this section, which should be read in conjunction with Appendix II of
the 2019 Management Report. Additionally, the information contained in this section is updated and complemented with the
information provided in Note 5.1 —Disputes, Note 5.2 — Administrative tax proceedings and Note 5.3 — Geopolitical risks to the
interim financial statements for the first half of 2020. The risks described in the 2019 Management Report and updated in this
section are subject to change not only in the current financial year but also in future years. However, it is expected that these risks
and uncertainties will persist throughout the second half of 2020.
2 WTI futures with delivery in May 2020.
8- Production has fallen by just over 22 kboe/d as a result of (i) shrinking demand for gas (Algeria,
Venezuela, Bolivia, Peru and Indonesia); (ii) temporary closures due to low prices to preserve
the value of certain assets (Colombia, Canada and the US Gulf of Mexico); and (iii) production
cuts in certain countries (Algeria and Norway).
Industrial businesses:
At Refining, the drop in global demand has prompted the temporary shut-down of refineries across the
globe, including Europe. Repsol’s refining system has managed to maintain reasonable levels of activity
by balancing production, sales and storage capacity, despite a certain throttling of refinery use.
At Chemicals, the gradual recovery of the Chinese economy has been countered by the effective closure
of other major markets. Margins have been solid and demand has remained at reasonable levels. The
increased reliance on propylene oxide and styrene units was somewhat successful in compensating for
the lack of any real market for polyols and polyurethanes destined for the automotive sector.
This price environment has also had a negative impact on the value of inventories, the effect of which
is shown in the inventory effect.
Commercial businesses:
Shrinking demand for fuel in the wake of the mobility restrictions and the general decline in economic
activity has had a significant impact, especially at our network of service stations and aviation supplies.
In Spain, we witnessed an 85% reduction in demand for fuel at service stations at the height of the
containment measures, before recovering to end the period at still 25% below the levels of demand
seen in 2019. Demand for kerosene plummeted in the first six months due to lower domestic
consumption and the absence of an international market for this product. Meanwhile, the confinement
has pushed up demand for heating oil and LPG for domestic use due to increased consumption while
people remained at home.
It is also difficult to predict to what extent and for how long the pandemic will continue to impact Repsol’s
businesses as we move forward. The reduced global demand for crude oil, gas and oil products in response
to the slump in economic activity, especially the mobility restrictions in place, may adversely affect prices
and the level of production and sales of our businesses. Meanwhile, the deterioration in global financial
conditions may also affect the cost of financing, available liquidity or the solvency of our clients and
partners under joint ventures, among other possible impacts. The course of the pandemic, the containment
measures rolled out by the health authorities and the policies put in place to mitigate the social and
economic impact of the crisis will all shape the scope and duration of both the crisis and the subsequent
recovery.
9On March 25, Repsol’s Board of Directors assessed the context and the evolution of the current economic
situation, particularly the global impact of COVID-19, the downturn in oil and gas market prices and their Reduced
impact on the Company’s business and activities. This prompted the Company to make the following operating
decisions: costs and
investment
- Guaranteeing the health and safety of its employees, clients and suppliers in their dealings with
the Company, as well as continuing with its operations, maintaining the supply of essential energy
products and services to society, both critical to sustain key services at the present time.
- Deploying a 2020 Resilience Plan in response to the hugely demanding macroeconomic
environment expected for the rest of the year: factoring in an average price of Brent crude of
$35/Bbl for the period April to December, and Henry Hub price of $1.8/MBtu.
The Resilience Plan also envisions a number of initiatives that imply additional reductions of more
than 350 million euros in operating expenses and more than 1 billion euros in investments, along
with optimizations of around 800 million euros in working capital, compared with the metrics in
our initial budget.
The Company’s financial objective will be to preserve the robustness of its balance sheet and its
investment grade and, despite the current context, avoid any further increase in debt in 2020 with
respect to the figure reported at the end of 2019.
- The Company will maintain its shareholder remuneration commitments in 2020 (charged to 2019
earnings) under the current Strategic Plan (see section 4.4) and it also plans to effect a capital
reduction by redeeming treasury shares so as to counter the dilutive effect of its scrip dividend
issues. Meanwhile, and in response to the current market situation and the COVID-19 crisis, the
Board of Directors decided not to include on the agenda of the Annual General Meeting held on
May 8 a further reduction of 5% of the Company’s share capital at December 31, 2018, as initially
agreed upon in July 2019.
- Repsol has reaffirmed its commitment to lead the energy transition, in line with the objectives of
the Paris objectives and the United Nations´ Sustainable Development Goals, maintaining its
objective of reducing the Carbon Intensity Index by 3% in 2020 compared to 2016, while
significantly increasing renewable generation capacity and reducing CO2 emissions across all
businesses.
Given the extraordinary levels of volatility and market uncertainty, Repsol has decided to postpone the
presentation of its 2021-2025 Strategic Plan until November 2020.
During the first half of the year, the Company aligned its actions with the objectives set out in the Resilience
Plan, as evidenced by the following:
- We guaranteed the continuing supply of our products and services, while keeping our operations
safe. In Spain, for instance, our service stations, direct fuel sales and LPG distribution networks
remained operational even at the peak of the lock-down and production continued at our refining
and chemical industrial complexes.
- We achieved savings in operating costs and investment over and above the level expected,
prompting us to review our annual targets and now estimate that the reductions could reach 450
million euros in operating costs and over 1,100 million euros in investment.
- The main rating agencies all upheld Repsol’s investment grade, which has made its balance sheet
stronger by enhancing its equity (issue of 1.5 billion euros of perpetual subordinated bonds),
reducing its net debt and increasing its liquidity.
10- Committed levels of shareholder remuneration in 2020 have been honored through the payment,
in January and July, of 0.424 and 0.492 euros per share, under the scrip dividend program to
replace the traditional dividend charged to 2019 earnings.
For more information, see section 7.2 Outlook by business.
Repsol has revised the definition of its operating and reporting segments, attending both to our
commitment to become CO2 emissions neutral by 2050 and to our renewed strategic vision for the business New
divisions. In particular, the Company will enhance its commercial businesses with a new multi energy and definition for
customer centric approach, as well as the development of new low carbon electricity generation the operating
businesses, from which a new business segment was created under the “Commercial and Renewables”
and reporting
nomenclature. Consequently, Repsol’s operating and reporting segments will be defined as follows:
segments
Upstream: corresponding to exploration, development and production of crude oil and natural
gas reserves;
Industrial: corresponding, mainly, to the following activities: (i) refining; (ii) petrochemistry; (iii)
trading and transportation of crude oil and oil products; (iii) commercialization, transportation and
regasification of natural gas and liquefied natural gas (LNG);
Commercial and Renewables: corresponding, mainly, to the following businesses: (i) low-carbon
electricity generation and renewable sources; (ii) gas and electricity commercialization; (iii)
mobility and commercialization of oil products; and (iv) LPG.
Corporate and others includes (i) corporation running expenses and, specifically, those expenses related to
managing the Group that have not been invoiced to the business divisions as a service, (ii) the financial
result and (iii) consolidation intersegment adjustments.
On May 8, Repsol held its Annual General Meeting remotely, without the physical attendance of
shareholders, their proxies or guests. The 2020 Annual General Meeting was an absolute necessity for the
Company to carry on its business normally and accomplish its objectives, in the interests of all its
shareholders and other stakeholders. Even so, Repsol’s Board of Directors made every effort to ensure
strict compliance with the state of the alarm announced by the Spanish government, with the overriding
priority being to protect the health of everyone involved in organizing and staging the meeting.
11In 2020, the global economy has faced a massive scare in the form of the COVID-19 pandemic, forcing the
authorities to resort to confinement measures to protect public health. The sheer scale and speed of the -4.9%
collapse in economic activity seen between mid-March and the end of April across many countries has been
Forecast
unprecedented. It is estimated that most countries will have seen a slump in economic activity of between
20% and 30% during the confinement, and in some sectors the impact has been even greater. global
growth in
According to the latest forecasts of the International Monetary Fund (IMF, World Economic Outlook June 2020
2020), the world economy will shrink considerably in 2020 (-4.9%), after gaining 2.9% in 2019. Yet there is
much uncertainty surrounding these forecasts. For instance, 75% of countries have been reopening their
economies in late June and in most countries economic activity is recovering faster than expected, and
financial conditions are now relaxing in response to the rapid change in monetary policy. Yet at the same
time the pandemic is intensifying in other countries and the risk of further outbreaks and renewed financial
tensions will persist for as long as there is no treatment or vaccine.
Given this widespread uncertainty and huge demand for liquidity, the dollar strengthened in early 2020 to
reach 1.078 euros/dollar at the start of April. However, since then the reduction in risk aversion has made
interest rate spreads and fundamentals more relevant in shaping the exchange rate. Since the FED has
more room to implement further stimulus measures than the ECB, and because financing needs are greater
in the United States due to its high fiscal and external deficit, the dollar has retreated and the exchange
rate has now stabilized within the range of 1.12-1.13 euros/dollar.
Euro/ Dollar exchange rate (monthly averages)
Source: Bloomberg and Repsol´s Division of Business Studies & Analysis
Brent crude
40.1
Brent crude averaged $40.1/bbl in the first half of 2020. Brent crude began the year at around $68/bbl,
before dropping to below $20/bbl in April and then recovering to around $40/bbl by the end of June. $/bbl
Average
Crude oil prices have been heavily affected by the pandemic. The COVID-19 crisis has caused an Brent price in
unprecedented contraction in oil consumption. The drastic measures rolled out by governments to control 1H
the spread of the virus by limiting social interaction, imposing significant mobility restrictions and closing
borders and non-essential sectors, have directly impacted the consumption of oil products. The estimated
contraction in global oil consumption for the second quarter of 2020 is around 20 million bbl/d, bringing
demand back to the levels reported in 2002-2003.
On the supply side, the response has fallen short of the mark in rebalancing the market, despite the actions
undertaken by both OPEC and non-OPEC countries. OPEC+ has agreed on the largest and longest
production cut in its history, while in the rest of the countries we have witnessed the natural dynamic
whereby falling prices have triggered a decline in investment and consequently a fall in production; the
12main difference being that in the current climate this dynamic has been a more rapid affair than on previous
occasions.
As a result, the balance in the first half of 2020 has been one of oversupply, with an unprecedented build-
up of inventories that has forced prices down.
Average Brent price over time
Source: Bloomberg and Repsol´s Division of Business Studies & Analysis.
Natural Gas - Henry Hub
The price of U.S. Henry Hub natural gas averaged $1.8/MBtu in the first half of 2020, trading 40% below
the same period in 2019. Persistently high production levels and mild winter temperatures continued to 1.8
apply pressure on gas prices during the early months of the year. This situation was then aggravated by the
emergence of COVID-19 and the containment measures put in place to stop it from spreading, which have
$/MBtu
dampened demand and caused an even greater reduction in prices. Turning to U.S. exports of liquefied Average
natural gas, loads have been cancelled in the wake of the pandemic, which has placed further pressure on Henry Hub
prices. Coupled with low Henry Hub prices, production has also been affected, showing a 4% year-on-year price in 1H
drop through to April when compared with 2019.
According to the latest figures released in the United States, and assuming this downward trend in
production continues and demand recovers due to the seasonal effect, a gradual recovery in prices next
winter and throughout 2021 as a result of this improved balance between supply and demand could be
expected.
Average Henry Hub price over time
Source: Bloomberg and Repsol´s Division of Business Studies & Analysis.
For more information on the expected performance of prices in the second half of the year, see section 7.1
General outlook.
13Despite the impact of the COVID-19 crisis on the Group’s income, the measures rolled out under the
Resilience Plan to maximize cash flow and protect the balance sheet enabled us to end the period with net Lower debt
debt lower than at December 31, 2019. and
increased
liquidity in
response to
Results for the first half of 2020 (1H 2020) arose within a context of a global economic recession, largely the
caused by the emergence of the COVID-19 pandemic, with low crude oil prices (Brent 40.1 vs 66.0 in 1H
challenging
2019) and gas prices (Henry Hub 1.8 vs 2.9 in 1H 2019) and plummeting demand for oil and gas products.
environment
Millions of euros 1H 2020 1H 2019 ∆
Upstream (51) 646 -
Industrial 296 448 (-34%)
Commercial and Renewables 163 265 (-38%)
Corporate and others (219) (244) 10%
Adjusted net income 189 1,115 (-83%)
Inventory effect (1,088) 63 -
Special items (1,585) (45) -
Net income (2,484) 1,133 -
In this extremely challenging environment, there was a significant reduction in EBITDA (589 million euros
vs 3,712 million euros in 1H 2019):
TOTAL
EBITDA (Millions of euros) 1H 2020 1H 2019
Upstream 988 2,213
Industrial (670) 1,075
Commercial and Renewables 360 502
Corporate and others (89) (78)
TOTAL 589 3,712
Adjusted net income:
Adjusted net income, which is intended to reflect the financial result of the ordinary course of the
businesses, was 189 million euros, 83% lower than in the same period of the previous year.
Upstream
Average production in period came to 675 kboe/d, down 3% on the same period of 2019. This decline was
largely a result of production stoppages in Libya and the shutdown or reduction of operations at other
assets owing to slacker demand and prices.
Greater
Moving to exploration activity, the drilling of seven exploration wells and one appraisal well were completed exploration
in the first half of the year. Six of them with positive results. success with
less
For further information on the activities of the Upstream segment, see section 5.1. investment
Adjusted net income at Upstream amounted to -51 million euros, down 697 million euros on 1H 2019.
Lower crude oil and gas prices (-40% and -33%, respectively), coupled with lower volumes produced and
sold, had a negative impact, which was partially offset by the reduction in amortization expenses and taxes.
14Change in adjusted net income at Upstream
million euros
800
646
600
400
200
0 490
-200 51
-400
102 15
-600 170 1
1,224 0
-800
251
-1,000
1H 2019 Price effect Sales volume Taxes (other Exploration DD&A Others (1) Exchange rate Income Tax 1H 2019
effect than income tax) effect
(1) Includes costs related to production and the results of investees and non-controlling interests.
Investment in the first half of the year (603 million euros) was down on 1H 2019 (961 million euros) in
response to the Resilience Plan. Investment activity focused on assets in production and/or under
development, mainly in Norway, the United States, Trinidad and Tobago, Brazil and Malaysia. Exploratory
investment took place mainly in the United States (Alaska and Gulf of Mexico) and Mexico (Gulf of Mexico),
and to a lesser extent in Russia, Indonesia and Colombia.
Industrial
Adjusted net income in the first half of 2020 was 296 million euros, compared to 448 million euros in the
first half of 2019.
Change in adjusted net income at Industrial
€296 M
Adjusted net
income at
Industrial
The change in income is mainly due to the following factors:
- At Refining, the lower result arising from lower margins and decreased sales due to the worsening
international environment were mitigated by production adjustment and plant logistics measures
and by improved margins in Peru through operational optimization.
- At Chemicals, the drop in income was largely down to lower margins and sales, a rise in operating
incidents and maintenance stoppages at the Tarragona and Sines facilities.
- At Trading, improved results across all lines, especially in crudes and light products.
- At Wholesale & Gas Trading, margins fell at the LNG commercialization business, despite improved
margins at the trading gas business in North America.
15Operating investment at Industrial in the first half of 2020 came to 227 million euros (down 26% on 1H
2019). The investments were aimed at maintaining levels of activity at industrial complexes.
See section 5.2 for more information on the activities of the Industrial segment.
Commercial and Renewables
Adjusted net income in the first half of 2020 was 163 million euros, compared to 265 million euros in the
first half of 2019.
Change in adjusted net income at Commercial and Renewables
The change in income is mainly due to the following factors:
- At Mobility, the decrease in result was largely due to lower demand at Service Stations, Direct Sales
and International Aviation by the COVID-19 impact.
- At LPG, weaker performance reflected lower margins on operations subject to regulated prices and
lower sales due to a relatively mild winter in Spain.
- At Lubricants, the improved performance was due to the increased margins at Asphalts and the
contribution made by the international lubricants businesses (Mexico and Southeast Asia).
- At Electricity and Gas, result was higher than in the first half of 2019, largely due to an improved
performance at the generation business, where higher margins were achieved and production
increased, despite the falling electricity pool prices in Spain. A further highlight was the increase in
the number of customers for electricity and gas commercialization compared with the first half of
2019.
Operating investment in the first half of 2020 amounted to 259 million euros (up 47% on 1H 2019). The
investments were largely aimed at the development/start-up of new renewable energy businesses for Investment
Electricity and Gas. in new
renewable
See section 5.3 for more information on the activities of the Commercial and Renewables segment. projects
Corporate and others
Results for the first six months amounted to -219 million euros (1H 2019: -244 million euros). Corporation
cost reduction efforts were increased in line with Resilience Plan goals, but kept up our momentum in
digitalization and technology initiatives. The financial result improved in response to higher results from
exchange rate positions and lower net interest expenses.
16Net income:
Adjusted net income was shaped by the following impacts:
- The inventory effect, which was a negative 1,088 million euros, versus a positive 63 million euros
in the first half of 2019, due to the collapse of prices through to April as a consequence of the
rapid progression of the COVID-19 and its subsequent impact on demand, as well as the excess of
crude supply.
- Special items for the first half of 2020 totaled -1,585 million euros. These items corresponds to
accounting recognition of impairments and valuation adjustments to Upstream assets reflecting
the change in economic expectations due to the COVID-19 crisis (see following section), the
adverse impact of exchange rate fluctuations on tax positions in countries where the local currency
is not the Company’s functional currency (mainly Brazil) and credit risk provisions in Venezuela, all
of which were partially offset by the capital gain generated on the sale of assets in Papua New
Guinea.
Millions of euros 1H 2020 1H 2019
Divestments 72 31
Workforce restructuring (41) (29)
Impairment (1,296) (3)
Provisions and others (320) (44)
TOTAL (1,585) (45)
Therefore, the Group’s net income in the first half of 2020 amounted to -2,484 million euros (1,133 million
euros in 1H 2019).
Profitability indicators 1H 2020 1H 2019
ROACE - Return on average capital employed (%) (1) -8.4 3.8
Earnings per share (€/share) -1.63 0.68
(1) ROACE with leases: -7.3%
Asset impairment and write-downs
The COVID-19 pandemic has worsened the environment in which some of our businesses are expected to Write-downs
operate. The scale and depth of the crisis, and a lack of historical benchmarks, cast a cloud of uncertainty in response
on forecasts. However, at this time, a strong recovery of the economy and gradual stabilization of oil and to the new
gas markets are already in sight. It can be reasonably expected that the recovery will continue and allow a market
return to pre-crisis scenarios in the medium term (see section 7.1). conditions
In this context, Repsol has revised downward its expectations related to the future prices of crude oil and
gas, which has prompted the Company to recognize impairments and write-downs on the carrying amount
of certain Upstream assets, as described below (before taxes):
Millions of euros 1H 2020
Productive assets (956)
Americas (297)
Southeast Asia (234)
Europe and North Africa (419)
Exploration assets (70)
Goodwill (368)
TOTAL (1,388)
For more information on the impairment recognized in the period, see Note 4.2.2 to the interim financial
statements for the first half of 2020.
17Free cash flow in 1H 2020 came to 172 million euros, compared to 1,093 million euros in 1H 2019.
CASH FLOWS (Millions of euros) 1H 2020 1H 2019
EBITDA 589 3,712
Changes in working capital 459 (659)
Dividends received 19 17
Income tax receipts/(payments) (10) (463)
Other receipts/(payments) (193) (77)
I. Cash flow from operations 864 2,530
Payments for investments (1,207) (1,503)
Receipts from investments 515 66
II. Cash flow from investing activities (692) (1,437)
FREE CASH FLOW (I + II) 172 1,093
Dividends and other equity instruments (128) (201)
Net interest and leases (253) (287)
Treasury shares (150) (729)
CASH GENERATED (1) (359) (124)
(1) Does not include derivatives on shares of Repsol, S.A. arranged/settled with financial institutions, out of a total notional amount of 21.9 million
shares, which form part of “cash flows from financing activities and other items” (-199 million euros).
Cash flow from operations (864 million euros) was lower on 1H 2019, although the reduction in EBITDA of
the businesses due to the impact of COVID-19 was mitigated by the effect of lower inventory costs on
working capital (price of inventories at the industrial businesses) and a reduction in taxes payable. Positive free
cash flow,
Cash flow from investing activities (-692 million euros) was down on the first half of 2019, in line with the
but affected
Resilience Plan (Upstream investment down 28% and Industrial investment 24%), although investment in
the new electricity and renewables businesses was maintained. The refund of tax paid in previous years by the
following the sale of Naturgy is included in Proceeds from divestments. difficult
environment
Free cash flow amounted to 172 million euros, versus 1,093 million euros in the first half of 2019.
As a result of the foregoing, after satisfying financing costs (-253 million euros), shareholder remuneration
(-128 million euros) and acquisition of treasury shares (see section 4.4), cash generated amounted to -359
million euros.
The financial objective envisioned in the 2020 Resilience Plan is to preserve the strength of our balance
sheet and maintain an investment grade credit rating. With this in mind, there will be no increase in debt €3,987 M
in 2020 when compared to the end of 2019. Net Debt
In line with the policy of financial prudence and commitment to maintaining a high degree of liquidity, the
funds held in cash by the Group at the end of June and available credit facilities were comfortably enough
to meet debt maturities in the short term and beyond, through to 2029, without the need to refinance.
Indebtedness
Net debt (3,987 million euros) with leases (8,026 million euros) is down on 2019. The lower cash flow from
operations as a result of COVID-19 have been offset by a total of 886 million euros in net funds obtained
from issuances and repurchases of equity instruments (perpetual subordinated bonds).
18Change in net debt
9,000 128
705 246 186
8,083 10 602 8,026
8,000
459
7,000 589 886
6,000 Net Debt with leases
5,000
4,000
3,000
2,000 4,220 3,987 Net debt
1,000
0
Net debt EBITDA Net Shareholder Change Taxes Net interest Treasury Perpetual Others (1) Net debt
Dec 31, 2019 investment return working shares subordinated Jun 30, 2020
capital bonds
(1) Net impact of the issuance and partial repurchase described in the section titled “Main funding operations”.
(2)
Includes, inter alia, new leases contracts in the period, other receipts/payments from operating activities and the exchange
rate effect.
The leverage ratio (14.7% without leases) remains unchanged on December 2019.
Leverage
The breakdown and maturity of gross debt ex leases (10,756 million euros) at June 30, 2020 is as follows: ratio:
14.7%
Solid
5,000
financial
4,500 structure
4,000
3,500 LuxSE
3,000
2,500
2,000
1,500
1,000
500
0
2020 2021 2022 2023 2024 and
following
BONDS ECP BANK LOANS AND CREDIT OTHER
Main funding operations
On April 15, Repsol International Finance, B.V. (RIF) issued two series of Eurobonds (secured by Repsol,
S.A.) worth 1,500 million euros, which are admitted to trading on the Luxembourg Stock Exchange:
(i) 750 million euros at an issue price of 99.967%, paying a fixed annual coupon of 2% and maturing in
December 2025; and
(ii) 750 million euros at an issue price of 99.896%, paying a fixed annual coupon of 2.625% and maturing
in April 2030.
On May 28, a bond issued by RIF in May 2013 under the EMTN Program, which had been paying a fixed
annual coupon of 2.625%, was redeemed at maturity for the nominal amount of 1,200 million euros.
19On June 11, RIF issued two series of perpetual subordinated bonds (secured by Repsol, S.A.) worth 1,500
million euros, which are admitted to trading on the Luxembourg Stock Exchange:
(i) 750 million euros, paying a fixed coupon of 3.750% through to the first redemption option in March
2026; and
(ii) 750 million euros, paying a fixed coupon of 4.247% through to the first redemption option in September
2028.
On June 12, the Repurchase Offer announced by RIF in relation to the perpetual subordinated bonds issued
in March 2015, as described in Note 4.1.4 to the interim financial statements for the first half of 2020, was
settled, with RIF paying the nominal sum of 594 million euros (59.4% uptake).
Additionally, RIF runs a Euro Commercial Paper (ECP) Program guaranteed by Repsol, S.A., capped at 2,000
million euros; the outstanding balance at June 30, 2020 was 1,989 million euros.
For further information, see Note 4.1.5 to the interim financial statements for the first half of 2020.
Liquidity
Group liquidity at June 30, 2020, including committed and undrawn credit facilities, stood at 9,762 million
euros, which is enough to cover its short-term debt maturities by a multiple of 2.4. Repsol had undrawn €9,762 M
credit facilities amounting to 3,420 million and 1,818 million euros at June 30, 2020 and December 31, Liquidity
2019, respectively.
Credit rating
At present, the credit ratings assigned to Repsol, S.A. by the rating agencies are as follows:
STANDARD & POOR’S MOODY’S FITCH
TERM Repsol, S.A. Repsol, S.A. Repsol, S.A. Credit rating
Long-term BBB Baa2 BBB maintained
Short-term A-2 P-2 F-2
Outlook stable negative stable
Most recent change 25/03/2020 02/04/2020 02/04/2020
Treasury shares and own equity investments
At June 30, 2020, the balance of treasury shares stood at 93.4 million shares (including 92.0 million shares
as the underlying of derivative contracts entered into by Repsol, S.A. with financial institutions)
representing 75% of share capital as at that date. For further information, see Note 4.1.4 to the interim
financial statements for the first half of 2020.
Remuneration received by shareholders in the first half of 2020 as part of the “Repsol Flexible Dividend”
program includes the amount of the irrevocable commitment to purchase free allocation rights undertaken
by Repsol as part of the paid-up capital increase closed in January 2020 (0.424 euros, gross, per right). Thus,
in the first half of 2020, Repsol paid out a gross total of 107 million euros to shareholders and distributed
38,647,825 new shares, equivalent to 541 million euros, to shareholders opting to receive new shares of
the Company.
In addition, in July 2020, under the “Repsol Flexible Dividend” program, replacing what would have been
the final dividend of 2019, Repsol paid out 236 million euros in cash (0.492 euros, gross, per right) to
shareholders opting to sell their free allocation rights to the Company and delivered 60,335,140 shares,
equivalent to 534 million euros, to shareholders opting to receive new shares of Repsol, S.A. (holders of
the 69.35% of the free allocation rights).
20At the 2020 Annual General Meeting, the shareholders resolved to reduce capital through redemption of
treasury shares1, up to a maximum amount equivalent to the number of shares issued under the scrip
dividend completed in 2020, as described above, with the aim of offsetting the resulting dilutive effect.
For additional information on the total remuneration received by shareholders and the scrip dividend made
under the “Repsol Flexible Dividend” program, see Note 4.1.4 to the interim financial statements for the
first half of 2020.
Our share price
The Repsol share ended June at well below the price reported at the start of the year, largely as a result of
the impact that COVID-19 has had on the markets since March.
The Group’s main stock market indicators in 2020 and 2019 are detailed below:
MAIN STOCK MARKET INDICATORS 1H 2020 1H 2019
Shareholder remuneration (€/share) (1) 0.424 0.411
Share price at period-end (2) (euros) 7.79 13.79
Period average share price (€) 9.79 14.81
High (€) 14.36 15.52
Low (€) 6.03 13.64
Number of shares outstanding at end of the period (million) 1,566 1,559
Market capitalization at the end of the period (€ millions) (1) 12,193 21,489
(1) For each period, shareholder remuneration includes dividends paid and the fixed price guaranteed by Repsol for the bonus share
rights awarded under the “Repsol Flexible Dividend” program.
(2)
Share price at period-end in the continuous market of the Spanish stock exchanges.
(3)
Period-end closing market price per share, times the number of shares outstanding.
1 Through the redemption of 1,400,000 existing treasury shares, as well as the shares acquired under a share repurchase program
and, as the case may be, through the settlement of derivatives arranged prior to March 25, 2020 (the maximum number of shares
that may be acquired through the settlement of derivatives shall not exceed 96,950,000).
21Main operating figures Our performance in 1H 2020
1H 2020 1H 2019 Millions of euros 1H 2020 1H 2019 ∆
Net production of liquids (kbbl/d) 229 251 Operating income (4) 1,174 -
Net production of gas (kboe/d) 446 446 Income tax (57) (547) 90%
Net production of hydrocarbons (Kboe/d) 675 697 Investees and non-controlling
10 19 (-47%)
Average crude oil price ($/bbl) 35.8 59.6 interests
Average gas price ($/kscf) 2.2 3.2 Adjusted net income (51) 646 -
Special items (1,489) 75 -
Net income (1,540) 721 -
Effective tax rate (%) (1) 47 -
EBITDA 988 2,213 (-55%)
Investments 603 961 (-37%)
(1) N/A. Although profit from operations is negative, there is a tax expense due to
the mix of results at different effective rates in each jurisdiction (income at
high rates and losses at low rates or not capitalized).
Main events in the first half of the year (1/3):
Average production:
Average production in the first half of 2020 came to 675 kboe/d, down 3% on the same period of 2019. This decline
was largely a result of production stoppages (Libya); natural decline at fields (Canada); as well as temporarily shutdowns
in Akacias (Colombia) and Chauvin (Canada) and the reduction of production in Duvernay (Canada) due to low prices;
lower demand for gas (Bolivia, Peru and Indonesia); and the Piedemonte license expiration (Colombia), which has been
partially offset by the acquisition of an additional 63% in Eagle Ford (United States) at the end of 2019, the connection
of new wells, mainly at Marcellus (United States) and the first oil in Buckskin (United States) in June 2019.
Exploration campaign:
Over the first six months of 2020, drilling was completed on seven exploration wells and one appraisal well, six of which
yielded a positive result (three exploration wells in the United States -two in Alaska and one in Gulf of Mexico-, two in
Mexico -Gulf of Mexico- and one in Colombia), one with a negative result in Mexico (Gulf of Mexico) and one under
evaluation (appraisal well in Colombia). At June 30, one exploration well in Bolivia was in progress.
Acreage:
In the first half of 2020, several exploration blocks were acquired in Indonesia (Aru, with a stake of 100%) and Russia
(Sablerskiy, as part of the AROG Joint Venture, with a stake of 49%). In Norway, the Company was awarded development
block PL-055E (Brage field), with a stake of 33.84%.
Impact of COVID-19 and price review:
The COVID-19 pandemic and prevailing prices have had a significant impact on operations at Upstream. Activity has
been reduced, investment limited and operations throttled accordingly (with the resulting drop in production) to
protect profitability and asset value (see section 2.1).
Future price patterns have been reviewed accordingly, as have production schedules for certain assets, prompting
extraordinary write-downs for some of these assets as described in section 4.1 of this report and in Note 4.2.2 to the
interim financial statements for the first half of the year.
22You can also read