Background Noise? TV Advertising Affects Real Time Investor Behavior
←
→
Page content transcription
If your browser does not render page correctly, please read the page content below
Background Noise? TV Advertising Affects Real Time
                  Investor Behavior∗
                         Jūra Liaukonytė                        Alminas Žaldokas

                                                  February 2020

                                                        Abstract

           Using granular minute-by-minute television advertising data covering approximately
       326, 000 ads, 301 firms, and $20 billion in ad spending, we study the real-time effects of
       TV advertising on investor search for online financial information and subsequent trad-
       ing activity. Our identification strategy exploits the fact that viewers in different U.S.
       time zones are exposed to the same programming and national advertising at different
       times, allowing us to control for contemporaneous confounding events. We find that
       an average TV ad leads to a 3% increase in SEC EDGAR queries and an 8% increase
       in Google searches for financial information within 15 minutes of the airing of that
       ad. Such advertising effects spill over through horizontal and vertical product market
       links to financial information searches on closest rivals and suppliers. The ad-induced
       queries on the advertiser increase trading volume and contribute to a temporary rise
       in the stock price. This suggests that advertising, originally intended for consumers,
       has a non-negligible effect on financial markets.

Keywords: Advertising; Limited Attention; Retail Investor Behavior

JEL Classification: G11, G12, L15, M37
    ∗
      Jūra Liaukonytė: Cornell University, jurate@cornell.edu; Alminas Žaldokas: Hong Kong University of Science and Tech-
nology (HKUST), alminas@ust.hk. We thank our discussants Ling Cen, Lauren Cohen, Prachi Deuskar, Lisa George, Nick
Hirschey, Markus Ibert, Chao Jiang, Patrick Kelly, Weikai Li, Kasper Meisner Nielsen, Daniel Schmidt, Joel Waldfogel, and
James Weston. For valuable comments we also thank Umit Gurun, Harrison Hong, Byoung-Hyoun Hwang, Ryan Israelsen,
Matti Keloharju, Simas Kučinskas, Dong Lou, Matthew McGranaghan, Abishek Nagaraj, Joel Peress, Brad Shapiro, Scott
Yonker, Kenneth Wilbur, and the seminar participants at Arrowstreet Capital, Harvard University, Boston University, Cornell
University, University of Texas at Dallas, UNSW, HKUST, and Bank of Lithuania as well as conference participants at NBER
Big Data Conference 2019, European Finance Association Meeting 2019, European Winter Finance Summit 2019, Market-
ing Science Conference (Rome) 2019, Summer Institute of Finance (Ningbo) 2019, Marketing Strategy Meets Wall Street VI
Conference (INSEAD) 2019, ISMS Marketing Science Conference 2019, ABFER, CEPR and CUHK Symposium in Financial
Economics 2019, Finance Down Under Conference 2019, Paris December Finance Meeting 2018, Tel Aviv University Finance
Conference 2018, SFS Cavalcade Asia-Pacific 2018, Conference on Financial Economics and Accounting (Tulane University),
Workshop on the Economics of Advertising and Marketing 2018 (Columbia University), ISB Summer Research Conference
in Finance 2018, ZEW Conference on the Economics of Information and Communication Technologies 2018, and the Baltic
Economics Conference 2018. Alminas Žaldokas is grateful to the McCombs School of Business at the University of Texas at
Austin for the hospitality when part of this research has been conducted.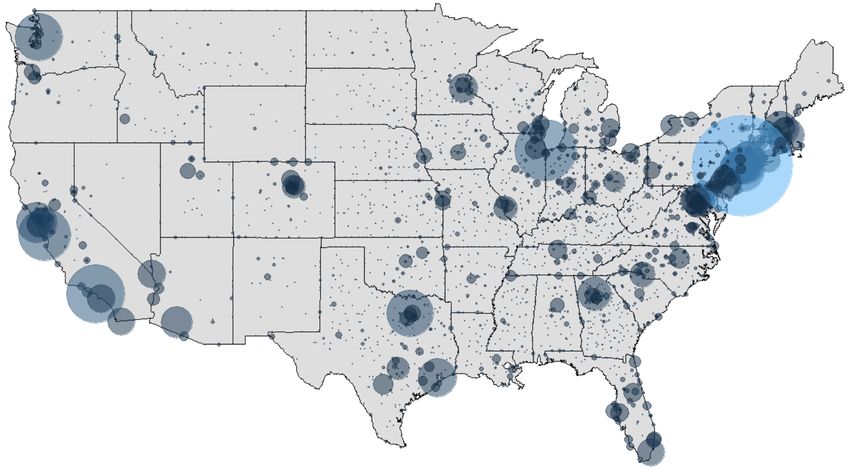
1     Introduction

Retail investors exhibit limited attention and tend to disproportionately trade attention-
grabbing securities. However, the question whether such trading behavior results in a pre-
dictably recurring trading pattern remains unanswered. In fact, a recent survey of retail
investors concludes that it is difficult to predict when these investors trade (Giglio et al.,
2019). This may be due in part to the challenge involved in designing or finding experi-
mental settings that repeatedly expose investors to firms, holding the larger context (e.g.,
news coverage) in which a firm operates constant. In this paper, we show that a recurring
attention shock – TV advertising that makes a firm more salient in investor’s minds – can
predict retail investor financial information search and trading activity.
    Using high-frequency disaggregated data on TV advertising with real-time geography-
based identification, which allows us to control for contemporaneous news about a firm, we
find a causal link between advertising and the search for an advertiser’s financial information.
Such ad-induced searches on advertisers predict the increased trading volume of their respec-
tive equity securities. Specifically, we find that each dollar spent on advertising translates to
around 40 cents of additional trading activity for the advertiser’s stock. Ad-induced searches
are associated with positive overnight stock returns but these returns partially reverse during
the next trading day. Furthermore, to our knowledge, our paper is the first one to show the
causal effect of a firm’s advertising on the investor interest in the advertiser’s closest rival
and major suppliers. Taken together, the evidence presented in this paper suggests that the
advertising effect on investor actions is more immediate and far-reaching than has previously
been documented.
    While studying advertising effects on retail investment behavior can help explain how
investors react to attention shocks (Grullon et al., 2004; Lou, 2014), discerning the causal
link is challenging. Given confounding events that might affect both investor interest and
advertising (Cohen et al., 2010; Fich et al., 2017), co-determination of profitability (and thus
stock returns) and advertising (Comanor and Wilson, 1967; Schmalensee, 1976, 1983), as

                                               1
well as the dual nature of investors as consumers (Keloharju et al., 2012), the relationship
between ads and investor actions is bound to be endogenous.
In this paper, we are able to overcome such endogeneity concerns by utilizing a novel
quasi-experimental identification approach. We examine how real-time TV advertising1 af-
fects contemporaneous investor interest in the advertiser within a narrow time window after
their ad. We rely on minute-by-minute data at the ad insertion level representing 301 pub-
licly listed US firms over a sample period that runs from 2015 through 2017.2 Studying the
effect within a narrow time window ensures that firms cannot strategically time their ads
within that time window due to institutional constraints of TV advertisers not being able
to pick the exact timing for their ads (Wilbur et al., 2013). The use of such high-frequency
data also mitigates the concern that the effect of advertising is systematically confounded
with other actions undertaken by the firm or news about it and also enables us to measure
the immediate effect of advertising on investor behavior.3
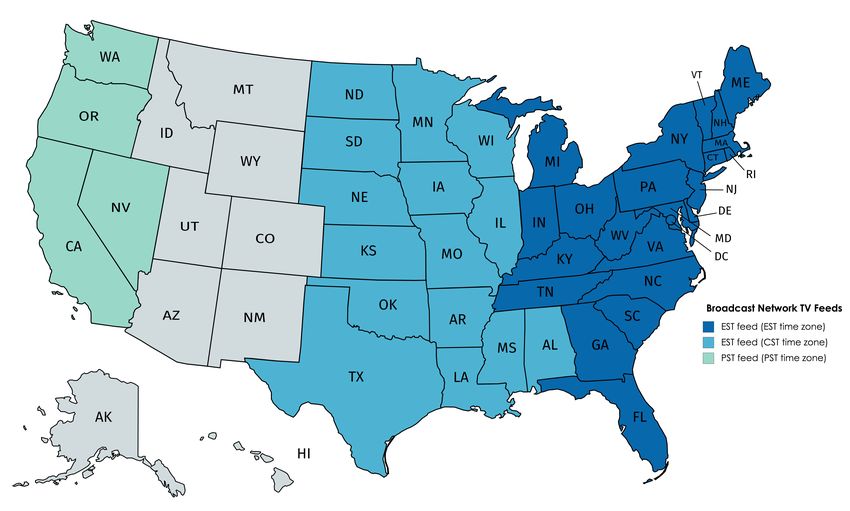
In addition to using real-time data, we also exploit a unique feature of broadcast net-
work TV programming. Most network TV programs and the associated national advertising
are first broadcast in the Eastern Standard Time (EST) and Central Standard Time (CST)
zones simultaneously, after which the signal is held and broadcast on a three-hour delay in
the Pacific Standard Time (PST) zone. Thus, when a particular advertisement is broadcast
in the easterly time zones (in EST or CST rather than in PST), we can analyze the behavior
of investors in these exposed time zones, using the behavior of investors in the contemporane-
ously unexposed time zone as the control. In this way, we control for any other confounding
1
TV is the dominant advertising medium by expenditure, constituting around 40% of total corporate
advertising expenses (eMarketer, 2016). In addition, TV consumption is associated with multitasking, which
allows us to capture its immediate effects. Nielsen (2010) reports that 34% of all Internet usage time occurs
simultaneously with TV consumption, whereas Council for Research Excellence (2014) finds that 69% of TV
viewers consume one or more additional media platforms concurrently.
2
Our sample includes all of the publicly listed companies that advertised during our studied time period.
These companies together represent 64% of overall TV advertising expenditures.
3
Indeed, large publicly listed firms we study in this paper often have news or media coverage about them,
making it challenging to identify the advertising effect using daily data. Based on Ravenpack, 61% of days
during which our average sample firm advertised also had a news story that was classified as strongly and
significantly relating to the advertising firm.
2real-time effects involving the advertiser.
In particular, we study how TV advertising affects financial information acquisition via
the SEC EDGAR database. We match the internet protocol (IP) addresses from SEC
EDGAR visitation logs to geographic locations, allowing us to identify the timezone from
which the visitation originated. We then construct a balanced firm×time zone×15 minute
interval panel and control for high-dimensional fixed effects that capture contemporaneous
confounding signals about the advertiser such as news, fixed effects that capture differences
in Internet searching or TV viewing behavior across time zones at a particular time, and
fixed effects that capture non-time-varying differences in investor information sets about an
advertiser, such as local bias, based on the firm’s location of operations.
We find that, on average, a TV ad leads to an immediate 3% increase in queries about
the advertiser on SEC EDGAR. The effect is stronger during primetime viewing hours. We
also find that this effect is the strongest for the advertisers in the financial sector followed
by firms in pharmaceuticals and consumer staples. For instance, the effect rises to 11% in
the case of ads of financial firms during primetime TV hours. We do not find that our ad-
related queries are influenced by automated bot traffic and the effect is absent in a timing
falsification test wherein we insert placebo ads in time intervals preceding actual ads.
We further show that these advertising effects spill over through horizontal and vertical
product market links. Specifically, we find that advertising can be causally linked to real-
time financial information acquisition about an advertiser’s primary rival and major supplier,
suggesting that, as a function of an attention shock to a specific firm, investors also seek
further information to evaluate the competitive environment of that advertiser.
Zooming in on the IP addresses that follow up with SEC EDGAR searches on an ad-
vertiser after its TV ad in a treated timezone, we find that over our sample period 164k
distinct non-bot IP addresses search within 15 minutes after the airing of an ad, suggest-
ing a widespread effect, likely coming from the retail investors. Indeed, we find that the
effects of advertising on investor information search are not confined to queries on the SEC
3EDGAR database but are also present in financial information searches on Google. Compar-
ing ad-induced SEC EDGAR queries with ad-induced Google financial searches, we find that
the Google effect is greater – an 8% increase in searches. Our results suggest a substantial
overlap between our effect based on Google searches and SEC EDGAR queries.
Finally, we show that searching for financial information is related to trading activity and
stock returns. Specifically, we show that higher ad-induced searches lead to a higher trading
volume of the advertiser’s stock during the following day. In particular, a one-standard-
deviation increase in daily real-time SEC EDGAR searches after TV ads increases the overall
trading volume by 0.82% and trading initiated by retail investors by 1.12% (based on the
methodology in Boehmer et al. (2017)). This effect comes solely from the intensive margin,
i.e., high ad-induced searches, rather than the extensive margin, i.e., any ad airing. We also
find an increase in the overnight stock returns that are associated with retail trading (Lou
et al., 2018) but these returns partially reverse during the intraday trading when institutional
investors are likely to be more active. When looking at the trading activity of an advertiser’s
rivals and suppliers, we find that ad-induced information search on the closest rival translates
to higher trading volume of the rival’s stock.
Taken together our results suggest that recurring TV advertising captures household in-
vestor attention and this translates into a non-negligible share of retail trading and stock
price adjustments. With retail investors facing thousands of stocks in the investment uni-
verse, advertising appears to be one channel that triggers investors to pay attention to the
advertising firms, collect additional information on them, and trade their shares.
2 Related Literature
Our study contributes to several strands of literature. We primarily relate to finance research
on the effects of product advertising on investor behavior and firm financial decisions (e.g.,
Grullon et al. (2004); Reuter and Zitzewitz (2006); Srinivasan and Hanssens (2009); Gurun
4and Butler (2012); Lou (2014); Focke et al. (2020); Madsen and Niessner (2019); Fang et al.
(2019)). The literature has looked at a low frequency and aggregate advertising data and
has suggested multiple reasons why advertising can be endogenous to investor behavior.
First, firms strategically choose where, when, and how often to advertise. Advertising
campaigns have been shown to coincide with earnings announcements, product launches,
equity issuances, stock option exercises, and M&A transactions (Cohen et al., 2010; Lou,
2014; Fich et al., 2017). Firms might also strategically adjust their advertising in response to
external events that are independently correlated with investor interest. They might increase
advertising to offset negative media coverage of product recalls or corporate scandals (Gao
et al., 2015). Other confounding signals about a firm, such as news about product market
rivals, can be correlated with both advertising and investor interest.
Yet another potentially confounding factor is that both higher advertising spending and
more active investor interest in a firm’s stock might be co-affected by the firm’s recent posi-
tive stock performance. Increasing stock prices might grab the attention of, say, momentum
traders, but would also simultaneously increase firm valuation, which in turn could reduce
financial constraints on marketing expenditures. Similarly, advertising and profitability are
simultaneously determined and positively related to omitted variables that induce large
markups (Comanor and Wilson, 1967; Schmalensee, 1976, 1983), thus the relationship be-
tween advertising and investor actions might simply reflect its relationship with profitability.
Finally, advertising might affect investor behavior indirectly by increasing product sales
and thus raising the probability that an investor is personally familiar with an advertised
product (Keloharju et al., 2012). In such a case, the investment decision is affected by
investor-consumer familiarity with the advertiser rather than directly by advertising.
All of the abovementioned factors complicate the study of the relationship between ad-
vertising and investor behavior. Thus, the advertising expenditure data that are aggregated
annually, monthly, or even daily are unlikely to provide satisfying evidence of the causal
effect, resulting in unresolved conclusions about these effects in the literature (e.g., posi-
5tive stock price effects in Lou (2014) and null effects in Madsen and Niessner (2019) and
Focke et al. (2020). Meanwhile, our paper uses high frequency data, focuses on the adver-
tising medium with the widest reach, and relies on a quasi-experimental research design to
overcome identification challenges present in prior research. Importantly, our highly disag-
gregated data allows us to show a highly nuanced advertising effect on stock returns that
has not been previously documented. Specifically, we show that advertising systematically
creates a short-term positive stock price reaction, presumably coming from retail investors.
This positive effect, however, partially reverses during the next day’s daytime trading, likely
driven by institutional investors. These findings on stock returns suggest that institutional
investors might be able to form trading strategies that could exploit this continuous stream
of retail investor trading.
More broadly, our paper contributes to the literature on investor attention (Peng and
Xiong, 2006; Barber and Odean, 2008; Abel et al., 2013) and, in particular, we relate to
the work on household investor information acquisition from traditional media and web
sources (Da et al., 2011; Ben-Rephael et al., 2017; Loughran and McDonald, 2017; Peress
and Schmidt, 2020) and information provision to retail investors via social media and social
networks (Heimer, 2016; Chawla et al., 2017; Farrell et al., 2019). Earlier literature has looked
at high but rare attention grabbing events and linked them to investor reaction (Cooper et al.,
2001; Rashes, 2001). On the contrary, our estimation approach captures a recurring sequence
of shocks to household investor attention and provides evidence that exogenously generated
retail investor attention translates into searching for financial information on SEC EDGAR
and Google. We also find that such salience shocks spread to a firm’s rivals and suppliers,
i.e., increased attention to a stock affects information collection pertaining to a given sector
more generally, thus relating to predictions in Peng and Xiong (2006).
In this respect, our paper is also related to the studies of the effects of media on investor
attention (e.g., Chan (2003); Tetlock (2007); Engelberg and Parsons (2011)). While both
advertising and media are likely to attract the attention of investors, these two attention-
6grabbing channels are substantially different. For example, financial media is strongly asso-
ciated with the dissemination of information intended for investors (Fang and Peress, 2009;
Peress, 2014). On the other hand, TV advertising is directed primarily at consumers and is
expected to have indirect effects on investors. Moreover, a given company is rarely fully in
control of its media coverage, whereas advertising is a firm’s strategic choice and therefore
is less influenced by the interests and incentives of other parties such as media companies
and journalists. Our research thus provides evidence that a channel that is under a firm’s
control does affect investor actions.
Finally, while some advertising might carry an informative signal about the firm’s finan-
cial position (Nelson, 1974; Kihlstrom and Riordan, 1984), the empirical evidence presented
in this paper suggests that ad-induced trading largely originates due to non-informative
attention shocks to household investors. Thus, our paper contributes to the literature on
household investor portfolio choice and investment decisions, which has previously relied on
data from surveys, brokerage records, or administrative registers (e.g., Calvet et al. (2007);
Barber and Odean (2001); Calvet et al. (2009); Keloharju et al. (2012); Calvet and Sodini
(2014)). By identifying a continuous stream of retail trading, we also contribute to the
microstructure literature on how noise trading arrives to the market and accommodates in-
formed trading (Grossman and Stiglitz, 1980; De Long et al., 1990; Mendel and Shleifer,
2012; Banerjee and Green, 2015). Our results suggest that TV advertising might provide
incentives for informed trading.
3 Empirical Methodology
3.1 Institutional Details
Our identification strategy relies on different geographic locations being exposed to the same
TV ads at different times.4 Five U.S. national network TV broadcast-over-the-air channels
4
This approach has some similarities to the methodology in Engelberg and Parsons (2011), where the fact
that newspapers have different print deadlines creates a natural experiment in the timing of news delivery
7(ABC, CBS, CW, FOX, and NBC) use only one feed for all of their affiliate local partners
scattered around the country.5 When the broadcast feed goes out, each station picks up
the signal to broadcast it immediately (EST or CST time zones) or they hold the feed for
broadcast at a later time (MST or PST time zones). For example, when New York airs
the feed live at 8pm EST, Chicago airs the same feed live at 7pm CST. Meanwhile, Denver
receives the feed at 6pm local time and broadcasts it 7pm MST and Los Angeles receives
the feed at 5pm local time and broadcasts it to their viewers at 8pm PST. We refer to these
programs and ads that are shown at different times in different time zones as time-shifted
programs and ads.6
Time-shifted programs include national TV shows broadcast in primetime TV hours
(8pm-11pm), late night shows, news shows (6:30pm-7pm), and morning shows (7am-9am).
The remaining programming is local or includes live shows such as sporting and election
events that are shown simultaneously in all time zones. We manually cross-verify all program
categories with TVGuide.com to make sure that we are not attributing live events to time-
shifted programs in our analysis.
Finally, an important institutional detail for our identification strategy is that firms
can choose what program to advertise on, but they cannot pick the exact time when to
advertise. Advertising contracts require networks to assign ads to slots within ad breaks
on an equitable basis, which is commonly understood to mean quasi-random (Wilbur et al.,
2013). This assertion has been verified in our advertising dataset by McGranaghan et al.
(2018) who show that the empirical distribution of average ad position placements within
advertising breaks is consistent with a random placement of ads.
across different geographic markets.
5
These channels are also by far the most watched TV channels in the U.S. with the most expensive
advertising slots, constituting 80% of the daily TV viewership (Nielsen, 2016).
6
Given that local stations in EST and CST broadcast the feed at the same real time, in our analysis we
consider these time zones together and further refer to both EST and CST time zones as EST. Section 5.2
presents robustness tests with EST and CST time zones considered separately and shows that the results
are largely the same . In order to reduce the possibility that some of TV viewers can observe multiple feeds,
we remove MST from the analysis. Figure 1 shows the map how we assign the states into two time zones –
EST and PST.
8Our novel double difference approach used to causally identify the real time TV adver-
tising effect on online financial information search is more robust and more appropriate for
financial market contexts (where the primary concern is about confounding contemporaneous
effects) than the single difference identification approach that has been used in marketing
literature to understand consumer outcomes by Du et al. (2017), Joo et al. (2014), and Lewis
and Reiley (2013), who show that TV ads cause internet search spikes, and Liaukonytė et al.
(2015) who show that this search effect also extends to online sales of the advertised products.
3.2 Specification
Given that only some geographic locations are treated at a given time, our identification
strategy can control for contemporaneous confounding events. At each quarter of an hour
interval7 , we record two observations for each of 301 publicly traded firms that had at
least one ad during the time-shifted programming in our sample period. One of these two
observations includes the number of searches for the firm’s filings on SEC EDGAR database
coming from the EST time zone in this 15 minute interval while the second one of these
observations records the number of searches coming from the PST time zone in the same 15
minute interval.8 Note that if an ad is aired in the EST time zone in that 15 minute interval,
only “EST observation” is treated while the “PST observation” acts as a control, and this
is reversed 3 hours later when “PST observation” becomes treated and “EST observation”
becomes a control. Our sample thus contains a balanced panel based on 301 firms, two time
zones, and 78,720 15 minute intervals.
Our specification is thus estimated at a firm × 15 minute interval × time zone level:
7
The choice of 15 minute interval balances between providing enough response time after an ad airing
(e.g., 5 minutes might be too short, especially if an ad falls towards the end of the interval) and having
confounding effects if the interval is too long. In Section 5.2, we provide robustness by considering 10 minute
and 20 minute intervals.
8
Due to an uneven average distribution of ads within different 15 minute intervals, we define our intervals
starting at 5 minutes past each hour. Internet Appendix 1 details the rationale of this methodological choice.
In Section 5.2 we show that our results are robust to alternative interval definitions.
9Ln(EdgarIP Searches)itk = β × Aditk + γit + κik + θtk + itk (1)
where i indexes the firms, t indexes time at a 15 minute interval, k indexes the time zones
(EST or PST). Ln(EdgarIP Searches)itk refers to the log of 0.1 + number of times that
firm i’s filings were accessed on the SEC EDGAR database in a 15-minute time interval t
from the IP addresses that are associated with the time zone k. Aditk refers to a dummy
equal to one if at least one broadcast channel aired an ad of the firm i during t 15-minute
time interval in the time zone k.
We control for three sets of fixed effects. First, γit , a fixed effect constructed at a 15
minute interval × firm level, controls for what is happening nationally with the firm i in this
15 minute time interval t. That is, this effect captures any contemporaneous confounding
signal about the firm, e.g., news about the firm itself or general news that might affect the
firm. Given γit , our advertising effect can only be identified on the time-shifted ads.
Second, κik , a fixed effect constructed at a firm × time zone level, controls for differences
in the baseline interest about the firm i across time zones k. For instance, it controls for
the differences in the non-time varying investor information set about the firm or local bias
based on the firm’s location of operations.
Third, θtk , a fixed effect constructed at a 15 minute interval × time zone level, controls
for any events happening in the time zone k at a particular time t that is unrelated to the
firm. For instance, this fixed effect would capture the differences in the time of the day
habits, or the differences in internet browsing patterns, or TV watching behavior across time
zones k at time t (e.g., baseline search differences at February 15, 2017, 9:15AM EST versus
February 15, 2017, 6:15AM PST).
104 Data
4.1 Information Acquisition
Our main measure of information acquisition is based on how often firm’s SEC filings were
accessed via the SEC EDGAR database from IP addresses associated with each time zone.
The SEC EDGAR database hosts all mandatory filings by public companies such as 10-K
filings, 8-K filings, as well as forms 3 and 4, and other filing documents. The database
has been frequented by over 100, 000 unique daily users on average in our sample period of
2015-2017Q1.
In addition to SEC EDGAR, this financial information is also disseminated by the data
providers such as Bloomberg, Morningstar, or Thomson Reuters and thus our estimates
provide a lower bound of the effect of advertising on financial information search.9 Investors
might also trade without collecting additional information. We focus on SEC EDGAR due to
the availability of the geographic breakdown of its access. As we later show, the response on
SEC EDGAR is correlated with searches on Google and we thus believe that SEC EDGAR
queries act as a good proxy for capturing general investor response to TV ads.
We obtain the server request records from the EDGAR Log File dataset available on the
SEC’s web servers. This dataset maintains a log file of all activity performed by users on
SEC EDGAR such as the client IP address, timestamp of the request, and page request. IP
addresses in the dataset are partially anonymized using a static cypher (e.g., 24.145.236.jcf ).
In mapping IP addresses to the geographic locations, we consider all 256 possible IP addresses
in the anonymized range (e.g., 24.145.236.0−24.145.236.255). We then map all the addresses
in this range to the geographic locations (at a zipcode level), using Maxmind data. Maxmind
periodically tests the accuracy of the data used in their databases by checking known web
9
See Li and Sun (2018) for the discussion on what investors might see as SEC EDGAR advantages over
other information sources. For example, other sources often condense financial statements into pre-specified
formats and thus some components of firms’ financial information may be misrepresented. Also, some
accounting information such as operating leases as well as qualitative information contained in 10-K filings
are not easily available in these data consolidators (Loughran and McDonald, 2011).
11user IP address and location pairs against the data within their databases. The reported
location accuracy falling within 150 miles of the true location is 91%.10
After we perform the matching, we check whether all matched zipcodes fall within the
same continental US time zone (either EST/CST, or MST, or PST). If that is the case, we
attribute this query to that time zone. If some of the 256 possible addresses map to different
time zones, we exclude this access event from our analysis.11 We then aggregate the matched
geographic location IP searches for each time zone at the 15 minute intervals.
Following past literature (e.g., Lee et al. (2015)), we exclude IP addresses that have
performed more than 500 queries on SEC EDGAR database during a day as these are likely
to be automated searches. As we report in Section 5.2, our results are consistent if we exclude
IP addresses that have performed more than 50 queries during the day.
Internet Appendix IA2 provides the bubble map for the geographic locations of SEC
EDGAR queries during our sample period, which shows that, as expected, most searches are
coming from the financial hubs, but they are spread all across the U.S.
4.2 TV Advertising
Our TV advertising data come from Kantar Media. Kantar monitors all TV networks in
the U.S. It identifies national ads using codes embedded in networks’ programming streams.
We observe every ad at the ad “insertion” level, defined as a single airing of a particular
advertisement on a particular television channel at a particular date and time. For each such
insertion, the database reports the advertised brand, the parent company of the advertised
brand, the date and start time (in hours, minutes, and seconds), the channel (e.g., CBS),
and an estimated insertion cost.
We manually match the name of the ultimate owner of each advertiser to the CRSP/
Compustat and SEC CIK databases. In the rare cases of joint ads (i.e., when multiple
10
Given our broad definition of geographic areas, i.e., at the time zone level, the relevant accuracy metric
is likely to be much higher than 91%.
11
We lose fewer than 5% of observations in this step. If there remains any measurement error after these
steps, it is likely to be very small and unlikely to systematically bias our treatment effect.
12firms are listed as advertisers for the same ad), we create entries for both advertisers. Our
final sample includes 301 publicly listed firms that advertise on the five channels in the
time-shifted national programs in the years 2015-2017 Q1.12
4.3 Descriptive Statistics
Table 1 provides descriptive statistics for our data. Panel A provides summary statistics for
the advertising data on the time-shifted ads of 301 publicly listed firms. Our dataset covers
326, 745 unique ad insertions with an average estimated cost of $61k and a total cost of
$20bn. As expected, primetime TV ads are more expensive, costing $87k on average. These
181, 266 primetime TV ads constitute 78.4% of total ad expenditure in our data.
Panel B reports the representation of firms in our data across different industry sectors.
We group firms into broad industry sectors, using Global Industry Classification Standard
(GICS), developed by MSCI and S&P. Most of the firms in our sample are in the consumer
discretionary sector, followed by consumer staples. We see few firms from materials, utilities,
energy, and real estate. Consumer discretionary sector constitutes the largest share of the
total advertising expense, contributing 39% of total advertising expenditure in our data.
Panel C provides the summary statistics of our sample firms’ financial information based
on Compustat, CRSP, and Thomson Reuters 13f data. We report the 2014 fiscal year data.
In Panel D we report the total number of SEC EDGAR queries for the firms in our sample
over 2015-2017Q1. We also separately report the split of the searches coming from EST and
PST time zones. In column (1) we report the total number of queries after excluding bot
traffic (IP addresses that have performed more than 500 queries on SEC EDGAR database
during the day) and in column (2) we exclude IP addresses that have performed more than
50 queries. In column (3), we only look at the SEC EDGAR queries that come from IP
addresses with more than 500 queries during the day that we call automated bot queries,
12
Our Kantar advertising data is significantly more detailed than Compustat advertising data: Out of 301
firms in our sample with positive advertising levels reported by Kantar, in Compustat 62 firms had missing
values of advertising expenditures in the financial years of 2015-2017.
13which in our sample constitute around 90% of all of the traffic on SEC EDGAR and which
we further exclude from the analysis.
Overall, we see that approximately 80% of the queries originate from EST and CST,
which is consistent with the East Coast being the main region of financial activity.
5 Main Findings
Our identification strategy relies on search variation being present (i) in short time intervals
when an ad was aired as compared to when an ad was not aired in one time zone and (ii)
such patterns being different across treated and untreated time zones. Figure 2 illustrates an
example of such variation with a specific Citigroup ad on March 3, 2017. Panel A illustrates
SEC EDGAR queries in both time zones before and after the ad is shown in EST (but not
yet in PST), whereas Panel B illustrates the pattern when the same ad is shown 3 hours later
in PST. We see an associated increase in SEC EDGAR queries when the ad is broadcast in
that timezone but not in the other one.
5.1 Baseline Regression Results
Next, we formally explore whether the patterns similar to the ones summarized in the Citi-
group example above exist, on average, across all ads in our sample. We adopt our baseline
specification (1). Table 2 presents our results where we estimate the contemporaneous effect
of TV ads on the queries about the firm on the SEC EDGAR website. We provide results
for three specifications. In column (1), we show the effect of any TV ad being broadcast.
In column (2), we refine the analysis by only focusing on the ads during primetime hours
(8PM-11PM) that are the most coveted ad slots due to their broad audience reach. We find
that the point estimate is larger when we consider only primetime ads. Finally, in column
(3), we look at the continuous measure of the log value of the total estimated cost of TV
ads of the advertiser in a particular 15 minute interval. Here we see that the effect size
14is increasing with the estimated ad cost, which is expected, given that ad cost is highly
correlated with the audience reach.
In terms of the economic significance, our results suggest that, on average, a TV ad leads
to 2.5% more queries about the advertiser on SEC EDGAR database in a 15 minute time
window, and this number increases to 3.2% if we look only at ads during the primetime hours
of TV broadcasting. As a comparison, Madsen (2016) finds that earnings announcements
increase daily SEC EDGAR queries by 36%, while news events about the firm increase daily
searches by 20%. This suggests that ads lead to a relatively non-negligible increase in online
search activity.
5.2 Robustness
We perform a number of robustness tests where we study the sensitivity of our results to the
definition of our outcome variable and also to how we capture ad insertions, especially with
regards to their timing. We report them in Table 3.
We start with the robustness tests with respect to the definition of the outcome variable.
Our first test narrows down the definition of automated queries. In the baseline analysis, we
exclude IP addresses that have performed more than 500 queries on SEC EDGAR database
during the day. In Panel A, column (1), we report the results if we exclude IP addresses
that have performed more than 50 daily queries. We see that our effect is both statistically
and economically stronger with a stricter automated bot traffic definition.
Our second test reverses the exercise. Here we only look at the SEC EDGAR queries
that come from the IP addresses that we have flagged as automated bots in our previous
analysis. Presumably, the bots that perform automated queries should not react to the TV
ads (although one could imagine an algorithm that would condition on the TV ad insertions).
Thus, in this falsification test we consider SEC EDGAR access from the IP addresses that
have more than 500 queries during the day. The absence of the identified effect, as reported
in column (2), suggests that our result is not mechanical and is not driven by any correlated
15patterns between SEC EDGAR and Kantar Media databases.
In our third robustness test, we only look at the first search by each IP address for each
advertiser. In particular, for each IP address that is searching about an advertiser within
15 minutes of its ad, we determine whether that IP address has accessed SEC EDGAR
reports on that advertiser at any time since 2012, and only record new searches. As shown
in column (3), we find a statistically significant, albeit smaller, ad effect on such first-time
searches. This suggests, that advertising not only acts as a reminder to continue investigating
previously explored firms, but also induces new searches for previously unexplored firms.
The fourth and fifth robustness checks focus on narrower geographic regions. First,
in column (4) we exclude CST and only compare searches originating from the actual EST
timezone to searches from PST. Second, in column (5), we impose an even stricter geographic
definition and compare searches from the states of Connecticut and New York to searches
from California. Indeed, when we focus on each time zone’s regions where investors are more
likely to be located, the advertisement effect is more statistically significant and larger in
magnitude.
In column (6), we report the results of the specifications where we exclude the dates when
advertisers announced their earnings, i.e., those days that might see an increased activity
of SEC EDGAR searches.13 We find that advertising effect is not concentrated on the days
when firms announce their earnings.
In Panel B, we report the tests with respect to the timing of the effect. First, we look
at how ad effect carries over into the future time intervals. That is, in addition to looking
at the ad effects in the same 15 minute interval, we study whether the effect persists in
the subsequent intervals. We do find a statistically significant one-period lagged effect of
an ad, as reported in column (1), but the size of the estimate is much smaller than that
of a contemporaneous effect. The effect of two-period lag is not statistically significant,
13
We rely on Compustat and IBES on earnings announcement dates. Where these two sources disagree
we take a conservative approach and exclude both sets of dates. In additional tests, we also exclude three
days before earnings announcements and three days after and we continue to find a similar effect.
16suggesting that the abnormal search dies off over approximately 30 minutes.14
Further, we perform another type of falsification test, where we insert a placebo ad one
15 minute interval before the actual ad. This exercise is equivalent to checking whether a
future event (advertisement) affects current outcomes (searches). When doing so, we make
sure that there are no ads by the same firm at least 30 minutes before this interval, i.e., by
choosing a placement of a placebo ad, we do not want to capture any spillover effects from
the previous ads. The results are reported in column (2) and show that the effect for placebo
ads is not statistically significant from zero.
Our next specification tests whether our results are robust to how we define the start
of our intervals. Instead of starting them at 5 minutes past the hour as in our main set of
analysis, here we start them exactly at the hour (X:00-X:14; X:15-X:29; X:30-X:44; X:45-
X:59, where X is a particular hour). As shown in column (3), as expected, based on the
ad distribution patterns provided in the Internet Appendix Figure IA1, we get consistent,
albeit marginally weaker, results.
Finally, we redefine the intervals to be constructed at 10 minute and 20 minute intervals
instead of 15 minutes that we consider in our baseline specifications. As shown in columns
(4) and (5), we find that the percentage increase in search activity is the largest with the
narrower time period: compared to the 15 minute interval results, the 10 minute interval
results are slightly stronger and the 20 minute interval results are slightly weaker.
In all our specifications we cluster standard errors by advertiser. In the results, available
at request, we find that the statistical significance of the effect is virtually identical if we
double-cluster standard errors by firm and time or firm and timezone × time.
14
One other paper that studies real time TV exposure effects is Busse and Green (2002), which analyzes
CNBC news show coverage on the stock market and finds that the market responds within 15 minutes to
the stock coverage, with the largest effect manifesting itself within the first 5 minutes.
175.3 Heterogeneity
We further study the heterogeneity of the advertising effect across different contexts. First,
we look at the heterogeneity of the effect at the level of an ad creative, i.e., a particular
commercial video. Specifically, we investigate how the effect varies with: (1) an advertised
brand name similarity to their parent company’s name (e.g., Wendy’s (brand) and The
Wendy’s Co (parent company) versus Taco Bell (brand) and Yum! Brands Inc (parent
company)), (2) the ad position within an ad break, (3) ad video/campaign recency, and (4)
ad length in seconds. Given that the same parent company might have multiple ads across
different TV broadcast channels in the same 15 minute interval, we perform the analysis at
the ad creative level. In particular, for each ad in our sample, we estimate the effect of each
ad on the SEC EDGAR searches, according to our econometric specification represented
in equation (1), where we difference out γit , κik , and θtk from total searches during the 15
minute time interval with an ad. In this way, we calculate an expected abnormal search that
is directly attributable to a specific advertisement.
The results are reported in Table 4. In column (1), we find that advertisements for
brands that sound similar to their parent company name lead to significantly more searches
than those that sound different. In column (2), we also find that the first ad in an ad break
leads to significantly more searches relative to the subsequent ads. This is consistent with
the first ad receiving the most audience attention due to attention depreciation throughout
an ad break (see e.g., McGranaghan et al. (2018)). Moreover, in column (3), we study how
the effect varies with the time since the first airing of a specific advertisement video and we
find that the effect diminishes with the recency of a specific ad video, which suggests that
investors pay more attention and react more to newer ad campaigns relative to campaigns
that have been in circulation for a while. Finally, in column (4), we find a strong positive
relationship between the number of searches and an ad length in seconds. This result is
expected, since keeping everything else constant, more investors are more likely to remain
exposed to longer ads.
18Our second set of tests looks at how the effect varies across different industries. We
report them in the Internet Appendix Table IA1.15 As before, we estimate three separate
regressions: general effect (column (1)), primetime (column (2)), and the log value of the
total estimated ad cost (column (3)). We find that the effect is stronger among consumer
staples, financial sector, and pharmaceutical firms, as compared to the other sectors. The
effect is the strongest for the financial sector and during the primetime hours.
We next perform heterogeneity tests where we estimate the effect separately for each
firm. Internet Appendix 2 discusses the procedure, while Internet Appendix Table IA2 and
Figure IA3 report the results. We find that out of 301 firms in our sample, 124 firms have a
statistically significant positive response to the TV advertising at a 5% level.
How do investors get to the SEC EDGAR website after being exposed to ads? The
SEC EDGAR log data do not indicate the referral website. However, we further investigate
whether SEC EDGAR website is accessed after a search on Google. We collect data on the
position of SEC EDGAR website in Google search results after searching for the keyword
“firm name + 10K”, e.g. “Apple 10K”. Using Google incognito search function, across all
of our sample firms we find that the median search result position for SEC EDGAR page
was number four. Next, we estimate a model where we interact our advertising treatment
variable with the search result position for “firm name + 10K”. We find that both the
treatment and the interaction effect are statistically significant: advertising effect is larger
for the firms where SEC EDGAR website comes higher on the Google search results page.
These results are reported in the Internet Appendix Table IA3. This finding is consistent
with an interpretation that at least some investors initiate their SEC EDGAR visits with
searches on Google.
Next, we investigate a broader set of search keywords on Google and evaluate the impact
15
We provide the distribution of firms in different sectors in Table 1, Panel B. Given limited number
of observations in Telecommunications sector, we group it together with Information Technology sector.
Similarly, we group Real Estate and Financial sectors together. Since the vast majority of the companies in
our sample falling under the larger Healthcare GICS sector belong to Pharmaceuticals, Biotechnology & Life
Sciences sub-sector (the other sub-sector being Health Care Equipment & Services), we refer to this sector
as Pharmaceuticals. Finally, we define materials, utilities, and energy as “Other”.
19of ads on Google searches for financial information.
5.4 Google Searches
The recent literature on investor attention has used Google searches for companies’ ticker
symbols as a proxy for investor interest in that company’s securities (e.g., Da et al. (2011)).
We expand upon this approach. In particular, in addition to Google search volume on
tickers, we also collect information on related keywords that lead to the same financial
information websites as the searches for tickers. The Google AdWords Keyword Planner
tool provides total search volume estimates for every keyword, as well as suggests alternative
search keywords that lead to the same type of websites. For example, Google AdWords
Keyword Planner suggests that users who search for the keyword “MSFT”, ticker symbol
for Microsoft, go to similar websites as people who search for the keywords “Microsoft Stock”
or “MSFT Stock”. We manually gather all of these related keywords for every ticker symbol
in our sample. We only include related keywords that generate at least 10, 000 searches per
month to ensure that we do not include obscure keywords that would add noise to search
volume estimates.
Given the complexity and restrictions in downloading the minute-by-minute Google
Trends data and its sheer volume, we only focus on one month of data16 and on the most
populous states: California, Connecticut, Florida, Illinois, New Jersey, New York, North
Carolina, Oregon, Pennsylvania, Texas, Virginia, and Washington. Since search volume in-
dex (SVI) is normalized within each Google Trends query, we include a control keyword in
every query and ensure that at least one minute of the query overlaps with the subsequent
query. Furthermore, given that Google SVI data is reported at the state level and the index
16
For the highest frequency, i.e., minute-by-minute data, Google only allows downloads in four-hour blocks
for up to five search terms. To make this exercise manageable, we thus need to limit the time period for
our analysis. We download the data for one full month. We pick August, 2016, as 2016 Summer Olympics
were taking place in this month and Summer Olympics are known to attract wide TV viewership. The main
Olympics coverage during primetime was time-shifted. Our sample consists of 156 publicly traded firms.
The sample is smaller than before since not all of 301 firms we study over 2015-2017Q1 advertised in the
time-shifted programs in August, 2016.
20is normalized at this level and thus cannot be compared across states, we do not aggregate
the searches across the time zones but we add state fixed effects to directly control for state
level normalization in Google Trends SVI algorithm. Our specification follows the one for
SEC EDGAR searches and is thus estimated in a panel, constructed at a firm × 15 minute
interval × state level :
Ln(GoogleSearches)its = β × Aditk + γit + κik + θtk + ψs + its (2)
where i indexes the firms, t indexes time at a 15 minute interval, k indexes the time zones
(EST or PST), and s indexes the states. Ln(GoogleSearches)its refers to the log(0.1 + SV I)
for firm’s i ticker and other related Google keywords in a t 15 minute time interval from the
state s in the time zone k. Aditk refers to a dummy whether at least one broadcast channel
aired an ad of the firm i during t 15 minute time interval in the time zone k.17
The results are reported in Table 5. We find a statistically significant increase in the
searches for ticker and other related keywords after the ad is broadcast in a treated time
zone, as compared to searches in the contemporaneously non-exposed time zone. As before,
we report the general effect of the ad in column (1), focus on ads during primetime in column
(2), and the log value of the total estimated cost of TV ad in column (3). The estimates
point in the same direction and follow similar patterns with SEC EDGAR search results:
TV ads increase firm financial information search on Google and more expensive ads lead to
more Google financial information searches.18
Prior research (e.g., Da et al. (2011)) has argued that Google Search Volume Index
17
We also perform an alternative specification where we control for all fixed effects at the state level rather
than time zone level, i.e., we add firm × state and 15 minute interval × state fixed effects:
Ln(GoogleSearches)its = β × Aditk + γit + κis + θts + its
The estimates are identical to those from specification (2). We report them in Internet Appendix Table IA4.
18
Since our advertising data is at the product-level, as a comparison we also evaluate the effect of ad-
vertising on Google searches for advertised product names. That is, for example, upon airing of the Apple
IPhone ad, we can compare the Google searches for the firm’s ticker (“AAPL”) and other financial keywords
to searches for firm’s advertised product name (“IPhone”). Such product-level analysis suggests that the
treatment effect of an ad on the financial information search constitutes 30%-40% of the effect of an ad on
the product name search.
21predicts retail trading. The Internet Appendix Table IA5 and Figure IA4 show a substantial
overlap between our effect based on Google searches and SEC EDGAR queries. We have
also shown evidence consistent with the interpretation that some investors’ visits to the
SEC EDGAR website are initiated with Google searches. Taken together, we interpret
this as suggestive evidence that retail investors react to advertising by searching for financial
information online. In the next section we introduce a formal test which further corroborates
this interpretation.
6 Investors and Markets
In this Section, we further discuss the implications of our main results presented above. We
first investigate the profile of investors who react to TV advertising and then study the effect
of ad-induced abnormal search on trading volume and stock returns.
6.1 Investors
Since the IP addresses provided by SEC are partially anonymized, we cannot identify the
actual investors who are affected by the TV advertising nor their professional affiliations.
However, we are still able to study some characteristics of the searchers.
First, we look at the unique IP addresses that search for the advertised firm’s financial
information on SEC EDGAR immediately after the ad airing in their timezone. We see
that over 2015-2017Q1 period 164k distinct users searched for advertisers within 15 minutes
after the ad airing; 129k users searched within 10 minutes; and 89k users searched within 5
minutes, out of 8.3m total number of distinct non-bot IP addresses present in our sample.19
Absent an ad, we would expect that the average per minute distribution of searches on any
company should be approximately even. The above pattern, on the other hand, suggests
that the average per minute search for firm financial information decays after an ad and that
19
These numbers provide the upper bound of the treatment effect as we do not know which of these
particular IP addresses would have searched for the firm absent its ad.
22a disproportionate number of investors react within a very narrow time window of an ad,
which is consistent with ads inducing near real-time reaction of investors.
Second, we check the time of the day activity patterns for the IP addresses that search
after the ads as compared to the average activity patterns of all IP addresses. We find that
IP addresses that react after the ads have on average 68% of their search activity in the
evening (6pm-12am), as compared to 48% in the case of all IP addresses. This asymmetry
is particularly pronounced for the browsing activity during the primetime hours, i.e., 36%
versus 18%, and it suggests that a lot of ad-induced searches are happening on the devices
with the IP addresses that are primarily used in the evenings.
6.2 Trading Volume
Additional signals coming from advertising and then later from the information collection
through SEC EDGAR are likely to generate dispersion in the opinions among investors and
thus facilitate trading. In this Section we first provide the results consistent with TV ads
increasing not only the search for financial information but also affecting trading volume.
Then, we provide several arguments to support the causal interpretation of such effect.
In particular, we look at the trading of the firm’s shares on the day after its ads are
broadcast. For each TV ad broadcast during the primetime TV hours20 , we estimate the
effect on the SEC EDGAR searches, according to our econometric specification represented
in equation (1), where we difference out γit , κik , and θtk from total (not logged) number of
searches during the 15 minute time interval with an ad. Similar to the heterogeneity analysis
at the ad creative level, this step estimates how many SEC EDGAR searches are directly
attributable to each ad after it aired in EST and then in PST and then adds them up to get
the total effect. Next, in case an advertiser had multiple ads during the primetime hours in
a given day, we sum ad-induced abnormal search across all of the ads of that advertiser. The
resulting measure captures the total number of searches due to a firm’s advertising during
20
In this analysis, we primarily look at the primetime ads, which air exclusively after the trading hours,
but we also provide tests for all ads during the day.
23the primetime in a given day. We then relate this measure to the next day’s trading volume
of the firm’s stock.21 Our specification is:
Ln(V olume)id = α + β × AbnormalAdSearchid−1 + ρ × T otalSearchid−1 + γim + θd + id
(3)
where i indexes the firms, d indexes the date, and m indexes the month. Ln(V olume)id refers
to the dollar trading volume on firm’s i stock on day d, as extracted from CRSP database.
AbnormalAdSearchid−1 is the total ad-induced abnormal search over primetime for firm i
on day d − 1 as described above. Given that firms have varying seasonal time trends both
in trading volume (Heston and Sadka, 2008) and advertising, γim controls for firm × month
fixed effects22 and θd controls for day fixed effects. In these regressions we also control for
the overall daily search on a given firm on SEC EDGAR during the prior day. Such control,
T otalSearchid−1 , which also includes ad-induced search, is intended to remove overall daily
variation in the interest in the firm’s financial information, further assuring that what we
are capturing is the advertising effect.
Baseline Estimates
As reported in Table 6, Panel A, we find a strong positive relationship between a sig-
nificant abnormal search in the evening during the primetime and the trading volume the
next day. That is, these results suggest that our earlier finding that TV advertising causes
information search on SEC EDGAR also carries over into the trading behavior. Column
(1) shows the baseline effect for ads aired in primetime hours while column (2) shows the
effect for all ads aired throughout the prior day. In terms of the economic effect, a one
21
Our estimation has a flavor of instrumental variables specification whereby the first stage would estimate
the advertising effect on SEC EDGAR search and the second stage would estimate the instrumented SEC
EDGAR effect on trading. However, the exclusion restriction in the instrumental variables estimation is
unlikely to hold since advertising might affect trading directly or through other indirect channels.
22
This way, β captures within-month variation of the attention to advertising on the next-day trading
volume. The effect of AbnormalAdSearchid−1 is consistent if we control for firm × week fixed effects, or
firm × quarter fixed effects, or just firm fixed effects.
24You can also read