Pathogen Challenge and Dietary Shift Alter Microbiota Composition and Activity in a Mucin-Associated in vitro Model of the Piglet Colon ...
←
→
Page content transcription
If your browser does not render page correctly, please read the page content below
ORIGINAL RESEARCH
                                                                                                                                            published: 19 July 2021
                                                                                                                                  doi: 10.3389/fmicb.2021.703421

                                             Pathogen Challenge and Dietary
                                             Shift Alter Microbiota Composition
                                             and Activity in a Mucin-Associated
                                             in vitro Model of the Piglet Colon
                                             (MPigut-IVM) Simulating Weaning
                                             Transition
                                             Raphaële Gresse 1,2 , Frédérique Chaucheyras-Durand 1,2 , Juan J. Garrido 3 ,
                                             Sylvain Denis 1 , Angeles Jiménez-Marín 3 , Martin Beaumont 4 , Tom Van de Wiele 5 ,
                                             Evelyne Forano 1 and Stéphanie Blanquet-Diot 1*
                                             1
                                              INRAE, UMR 454 MEDIS, Université Clermont Auvergne, Clermont-Ferrand, France, 2 Lallemand SAS, Blagnac, France,
                                             3
                                              Grupo de Genómica y Mejora Animal, Departamento de Genética, Facultad de Veterinaria, Universidad de Córdoba,
                                             Córdoba, Spain, 4 GenPhySE, INRAE, ENVT, Université de Toulouse, Castanet-Tolosan, France, 5 Center for Microbial
                                             Ecology and Technology, Ghent University, Ghent, Belgium
                          Edited by:
               Wakako Ikeda-Ohtsubo,
              Tohoku University, Japan       Enterotoxigenic Escherichia coli (ETEC) is the principal pathogen responsible for post-
                         Reviewed by:        weaning diarrhea in newly weaned piglets. Expansion of ETEC at weaning is thought to
                  Katie Lynn Summers,        be the consequence of various stress factors such as transient anorexia, dietary change
             United States Department
                                             or increase in intestinal inflammation and permeability, but the exact mechanisms remain
  of Agriculture (USDA), United States
                             Åsa Sjöling,    to be elucidated. As the use of animal experiments raise more and more ethical
      Karolinska Institutet (KI), Sweden     concerns, we used a recently developed in vitro model of piglet colonic microbiome
                  *Correspondence:           and mucobiome, the MPigut-IVM, to evaluate the effects of a simulated weaning
              Stéphanie Blanquet-Diot
            Stephanie.blanquet@uca.fr        transition and pathogen challenge at weaning. Our data suggested that the tested
                                             factors impacted the composition and functionality of the MPigut-IVM microbiota.
                    Specialty section:       The simulation of weaning transition led to an increase in relative abundance of the
          This article was submitted to
                  Microbial Symbioses,       Prevotellaceae family which was further promoted by the presence of the ETEC strain.
                a section of the journal     In contrast, several beneficial families such as Bacteroidiaceae or Ruminococcaceae
              Frontiers in Microbiology
                                             and gut health related short chain fatty acids like butyrate or acetate were reduced
              Received: 30 April 2021
             Accepted: 24 June 2021
                                             upon simulated weaning. Moreover, the incubation of MPigut-IVM filtrated effluents with
             Published: 19 July 2021         porcine intestinal cell cultures showed that ETEC challenge in the in vitro model led
                               Citation:     to an increased expression of pro-inflammatory genes by the porcine cells. This study
   Gresse R, Chaucheyras-Durand F,           provides insights about the etiology of a dysbiotic microbiota in post-weaning piglets.
Garrido JJ, Denis S, Jiménez-Marín A,
         Beaumont M, Van de Wiele T,         Keywords: in vitro model of colonic microbiota, piglet, weaning, ETEC, intestinal cells, gene expression
 Forano E and Blanquet-Diot S (2021)
Pathogen Challenge and Dietary Shift
          Alter Microbiota Composition
   and Activity in a Mucin-Associated
                                            INTRODUCTION
      in vitro Model of the Piglet Colon
     (MPigut-IVM) Simulating Weaning
                                            In early life, the gut microbiota is shaped by its host and by external factors, including diet
                              Transition.   (Frese et al., 2015). At weaning, piglets are exposed to social, environmental and dietary stresses
           Front. Microbiol. 12:703421.     engendering disruptions of the balance between intestinal microbial communities, also called
     doi: 10.3389/fmicb.2021.703421         dysbiosis (Gresse et al., 2017). Gut dysbiosis in post-weaning piglets is associated with a higher

Frontiers in Microbiology | www.frontiersin.org                                  1                                           July 2021 | Volume 12 | Article 703421
Gresse et al.                                                                                                   ETEC Challenge in the MPigut-IVM

risk of developing infectious post-weaning diarrhea (Gresse et al.,       study using the MPigut-IVM, a 48 h feed deprivation stress
2017), raising a major economic burden in swine industry                  remodeled piglet gut microbiota composition and functionality
because of the reduced growth performance and high mortality              (Gresse et al., 2021).
of infected animals (Amezcua et al., 2002; Fairbrother et al.,               In this study, we used the MPigut-IVM to evaluate the impact
2005; Luppi et al., 2016). Additionally, the massive use of               of a dietary change on the gut microbiota of 4-week-old piglets
antibiotics as preventive and curative treatment increases public         after a 48 h feed deprivation period. The MPigut-IVM was then
health concerns due to the expansion of bacteria resistance               exposed to an ETEC strain isolated from diarrheic piglets to
against antibiotics (Gresse et al., 2017). The major pathogenic           study the interactions between the pathogen and gut microbiota.
agent responsible for post-weaning diarrhea is Enterotoxigenic            Finally, to unravel the consequences of microbiota perturbation
Escherichia coli (ETEC) (Amezcua et al., 2002; Fairbrother et al.,        on the host epithelium metabolism, filtrated effluents of control
2005; Dubreuil et al., 2016; Luppi et al., 2016; Rhouma et al.,           and ETEC-inoculated MPigut-IVM bioreactors were incubated
2017). This pathotype is characterized by both the presence of            with a porcine cell line.
fimbrial adhesins inducing cell attachment to porcine intestinal
epithelial cells and secretion of enterotoxins which impact
intestinal homeostasis (Dubreuil et al., 2016; Luppi et al., 2016).       MATERIALS AND METHODS
The most prevalent ETEC strains found in 45.1% of diarrheic
post-weaning piglets harbor the fimbriae F4 (also designated              Fecal Sample Collection and Treatments
K88) and secrete heat-labile toxin (LT) and heat-stable toxins            All animals were housed in a conventional pig farm located in the
(St a or b) (Fairbrother et al., 2005; Dubreuil et al., 2016;             Haute-Loire area of the Auvergne-Rhône-Alpes region in France.
Luppi et al., 2016). If contributing factors to the progression           Piglets remained with their mother and siblings during the
and severity of ETEC infections such as housing conditions,               suckling period. In addition to sow milk, piglets received water
early weaning, feed management, and genetic predispositions               and pre-weaning diet ad libitum. None of the piglets had signs
were previously identified (Madec et al., 1998; Main et al., 2004;        of enteric or metabolic disturbances. The animals did not receive
Laine et al., 2008; Rhouma et al., 2016), the exact etiology              any antibiotic in the 27 days prior to the day of fecal collection.
of post-weaning diarrhea and ETEC infections remains far                  As freezing process showed to affect bacterial abundances in pig
from understood. One hypothesis incriminates the reduced feed             feces (Metzler-Zebeli et al., 2016), fecal samples from six 4-weeks
intake encountered by piglets at weaning which contributes                old healthy male unweaned suckling piglets (Landrace × Large
to intestinal inflammation and morphology disruptions and                 White) were collected directly from the pig while holding
strongly correlates with the risk of developing enteric diseases          using sterile bottles and preserved under anaerobic conditions
(McCracken et al., 1999; Le Dividich and Sève, 2000; Main et al.,         using GENbag anaer gas pack systems (bioMérieux, Marcy-
2004; Rhouma et al., 2017). In particular, the disturbance of             l’Etoile, France) during transport to laboratory where they were
the mucosa intestinal environment and its associated microbiota           immediately processed upon their arrival.
could promote the expansion of opportunistic pathogens such as
Enterobacteriaceae and increase the susceptibility toward bacteria        MPigut-IVM Parameters
and their toxins (Gresse et al., 2017). At the end of the weaning-        Five hundred milliliters MiniBio bioreactors (Applikon
induced feed deprivation period, the ingestion of plant-based             Biotechnology, Delft, Netherlands) equipped with stirrers,
derived solid feed further remodels the composition of the                ports and probes and inoculated with fecal samples from piglets
gut microbiota that was adapted to maternal milk during the               were prepared as previously described (Gresse et al., 2021).
suckling period (Frese et al., 2015). Understanding the origin            Briefly, 150 mL of fecal suspension prepared in an anaerobic
of post-weaning diarrhea is challenging since the mechanisms              chamber were added in each bioreactor containing 150 mL of
involved are very complex and probably caused by nutrition                nutritive medium (see below), previously reduced by flushing
and both host and microbe-derived factors. In vitro models of             with O2 -free N2 gas. Ten minutes after inoculation and during
the piglet intestine including gut microbiota are adequate tools          the fermentation course, flushing was stopped and anaerobic
to remove host influence and thus exclusively evaluate factors            conditions were maintained exclusively by the activity of the
impacting or influenced by commensal microbes. Especially, the            resident microbiota and by ensuring the airtightness of the
use of such in vitro techniques offers advantageous conditions            system. The temperature of the fermentation was set up to
when pathogenic strains are involved due to more standardized             39◦ C, pH was maintained to a physiological value of 6.0, and
conditions, good reproducibility and ethical reasons (Payne               redox potential was constantly measured. The fermentation
et al., 2012). Hitherto, the PigutIVM (Piglet Gut In vitro                medium was stirred at a constant speed of 300 rpm. After
Model) and the BABY-SPIME (Baby Simulator of Pig Intestinal               a 24 h-batch fermentation period, nutritive medium was
Microbial Ecosystem) were the only developed in vitro models              continuously introduced at a flow rate of 0.17 mL/min except
mimicking the specific physicochemical and microbial conditions           during the feed deprivation period (see below). The fermentation
encountered in the colon of piglets (Fleury et al., 2017; Dufourny        medium volume was maintained at 200 mL using a drainage
et al., 2019). However, the recently designed MPigut-IVM                  pump controlled by a level sensor. Indeed, the system ensured a
(Mucin associated Piglet Gut In vitro Model) brought the unique           retention time of 18 h to mimic the colonic transit time of 4-week
feature of reproducing the mucus-associated microbiota of piglet          old piglets (Wilson and Leibholz, 1981). Anaerobic conditions
colon using specifically developed mucin beads. In a previous             and gas composition were checked every day by analyzing N2 ,

Frontiers in Microbiology | www.frontiersin.org                       2                                      July 2021 | Volume 12 | Article 703421
Gresse et al.                                                                                                                     ETEC Challenge in the MPigut-IVM

O2 , CO2 , CH4 , and H2 present in the atmospheric phase of                           were introduced into their specific glass compartment. The latter
the bioreactors using a 490 Micro gas chromatograph (Agilent                          was maintained at 39◦ C in a water-bath and the fermentative
Technologies, Inc., Santa Clara, CA, United States) equipped                          medium continuously flowed through it (re-circulating loop).
with two columns, Molecular Sieve 5A and PoraPlot U, coupled                          Mucin beads were completely replaced every 48 h to ensure a
with TCD detectors. Argon was used as gas carrier.                                    continuous availability of mucin adherent surfaces. During the
                                                                                      time of bead replacement, the medium of the bead compartment
Composition of MPigut-IVM Nutritive                                                   was kept under CO2 flushing to avoid oxygenation.
Media
Two nutritive media were used during in vitro fermentative                            In vitro Fermentation Procedures and
procedure (see Figure 1). A pre-weaning diet was given during                         Sampling
the first 7 days of fermentation (Stabilization period, Figure 1).                    The first 7 days of the fermentation procedures represented the
Its formula was elaborated as previously described (Gresse                            stabilization period and corresponded to the appropriate time
et al., 2021) and considered as a digested pre-weaning diet                           to achieve stabilization of microbiota composition, diversity and
(Supplementary Table 1). Following the 48 h feed deprivation                          activity inside the MPigut-IVM (Gresse et al., 2021). At day 7,
period, which was simulated by stopping the nutrient supply                           the flow of nutritive medium was interrupted during 48 h to
to MPigut-IVM bioreactors, corn meal, potato protein and                              simulate feed deprivation observed at weaning. At day 9, the
a higher concentration of soy proteins were included in the                           flow of nutritive medium restarted with a simulated post-weaning
diet whereas milk derived proteins and products were reduced                          diet. Taken together the feed deprivation stress and the dietary
to simulate a post-weaning diet as commonly fed to piglets                            change applied during the recovery period aimed to simulate
(Supplementary Table 1).                                                              weaning transition (Figure 1). Experiments were designed as
                                                                                      presented on Figure 1, three independent runs of fermentation
Mucin Bead Production and                                                             were performed with different pools of piglet fecal samples.
Compartment                                                                           Samples from the bioreactor medium were collected on day 7
Mucin beads were prepared as previously described (Gresse et al.,                     (before the start of the feed deprivation period), day 9 (right
2021). At the beginning of fermentation, 350 ± 20 mucin beads                         at the end of the feed deprivation), and days 10, 10.5, 11, 12,

  FIGURE 1 | Experimental design of the in vitro fermentations and denomination of the conditions studied in the MPigut-IVM.

Frontiers in Microbiology | www.frontiersin.org                                   3                                            July 2021 | Volume 12 | Article 703421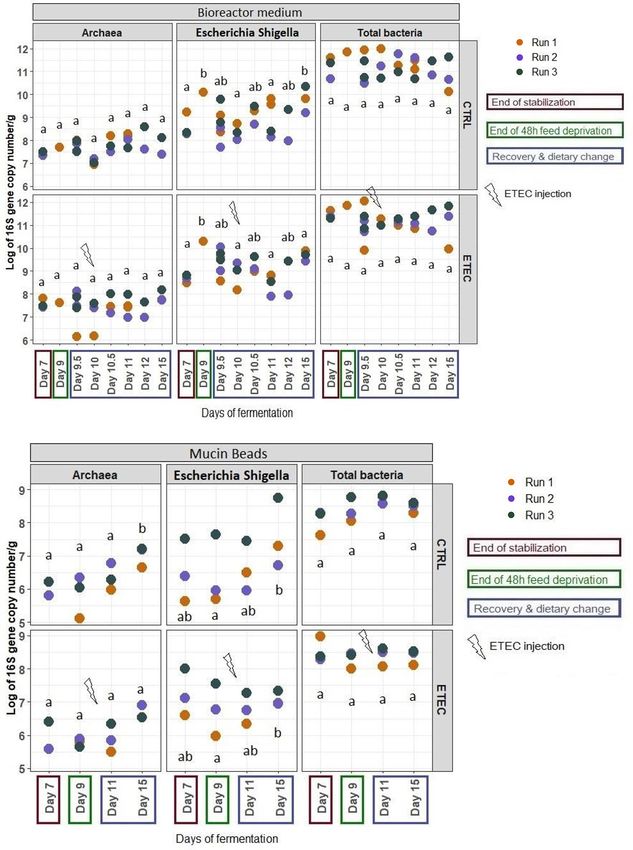
Gresse et al.                                                                                                     ETEC Challenge in the MPigut-IVM

and 15 (corresponding to the recovery period). Mucin beads and              Rotor-Gene Q (Qiagen, Venlo, Netherlands) in 20 µL reactions
bead medium from the bead compartment were collected on                     with QuantiFast SYBR GREEN master mix (Qiagen, Venlo,
days 7, 9, 11, and 15. Samples from the bioreactor medium and               Netherlands) or TaqMan Fast Advanced Master mix (Applied
bead medium were centrifuged (4◦ C, 10,000 g, 45 min). Pellets              Biosystems, Foster City, CA, United States) with the addition
and supernatants were stored until analysis at −20 and −80◦ C,              of each primer at their optimal concentration (Supplementary
respectively. After collection, mucin beads were gently washed              Table 2). The 16S rDNA genes were amplified using the following
three times in sterile 1X PBS and stored at −20◦ C.                         program: 2 min denaturation at 95◦ C and 10 min denaturation
                                                                            at 95◦ C; 40 and 45 cycles of 20 s at 95◦ C and 60 s elongation
ETEC Strain, Culture and Challenge                                          and extension at the optimum annealing temperature, and when
Conditions                                                                  performing SYBR GREEN based assay, a melting curve step
The ETEC Ec105 strain (F4, Stb+, East1+, LT+) was isolated                  was performed from 60◦ C to 95◦ C. Each reaction was run in
from a diarrheic piglet (Dr. J. J. Garrido, Department of Animal            duplicate. The melting curves of PCR amplicons from SYBR
Genetics, University of Córdoba, Spain). Prior to ETEC challenge            GREEN based assays were checked to ensure primer specificity.
in the in vitro model, bacteria were grown until OD600nm = 0.6              The 16S rDNA gene copy number was calculated using the
in Luria Bertani (LB) broth (BD Difco, NJ, United States), at               formula: copy number/µl = (C/X)∗ 0.912.1012 with C: DNA
39◦ C to be consistent with the temperature of the MPigut-                  concentration measured (ng/µL) and X: PCR fragment length
IVM (body temperature of piglets). The bacterial culture was                (bp/copy) and diluted in 10-fold dilution series to be used as
then centrifuged (4◦ C, 10,000 g, 15 min) and the pellet was                qPCR standards. Efficiency of the qPCR for each target varied
rinsed using sterile PBS 1X (Phosphate Buffered Saline, Sigma-              between 95 and 105% with a slope from −3.0 to −3.4 and a
Aldrich), resuspended in 1 mL of sterile PBS and inoculated to              regression coefficient above 0.95, which was in accordance with
the bioreactor medium of the “ETEC” condition on day 10 (see                the MIQE guidelines (Bustin et al., 2009). Ten-fold dilutions
Figure 1) at a final concentration of 107 CFU/mL of fermentation            series of DNA extracted from the ETEC Ec105 pure culture
medium. The control condition, referred as “CTRL,” received                 stained or not with PMA were used to control the reliability of the
1 mL of sterile PBS 1X at the same time.                                    PMA treatment. A sample from the same bacterial pure culture
                                                                            was subjected to a lethal treatment (95◦ C, 15 min) and stained or
                                                                            not with PMA and used as a negative control for PMA-qPCR.
PMA Treatments for qPCR
                                                                            The survival of the ETEC strain was monitored from day 10,
Samples from the bioreactor medium and bead medium were
                                                                            i.e., the time of inoculation, to day 15 in the bioreactor medium,
collected in duplicate at all time points. They were stained with
                                                                            bead medium and on mucin beads via the quantification of the
50 µM PMAxx (Interchim, Montluçon, France) as described by
                                                                            labile enterotoxin (LT) gene [Supplementary Table 3, references
Roussel et al. (2018) to avoid PCR amplification of DNA from
                                                                            (Ngeleka et al., 2003; Rahman et al., 2006; Madoroba et al., 2009;
dead cells. The stained samples were incubated for 5 min in
                                                                            Nicklasson et al., 2012; Roussel, 2019)]. After log transformation
the dark at room temperature, under shaking (100 rpm). After
                                                                            of the data, a mixed-model one-way ANOVA (lmer and ANOVA
incubation, samples were exposed to the blue light PMA-Lite
                                                                            functions) with time point (days of fermentation) and ETEC
LED Photolysis (Interchim, Montluçon, France) during 15 min to
                                                                            treatment as fixed effects and fermentation experiment as a
activate the PMAxx dye. Samples were then centrifuged (4,400 g,
                                                                            random effect was used to compare the number of 16S gene
4◦ C, 45 min). Pellets were washed twice with milli-Q water and
                                                                            copy per g of samples between days of fermentation using the
stored at −20◦ C until DNA extraction.
                                                                            R packages lme4 package version 1.1.21 and car package version
                                                                            3.0-6. The means of each group were compared pairwise with the
DNA Extraction From MPigut-IVM                                              lsmeans package (version 2.30-0) with the Tukey correction.
Samples
Total DNA was extracted from all samples using the Quick-
DNA Fecal/Soil Microbe Miniprep Kit (Zymo Research, Irvine,                 MiSeq 16S rDNA Sequencing and
CA, United States) according to the manufacturer’s instructions.            Bioinformatic Analysis
The quality of the eluted DNA was assessed by agarose gel                   The DNA concentration of all samples was measured using the
electrophoresis. Extracts were quantified using the Qubit dsDNA             Qubit dsDNA High Sensitivity Assay Kit (Invitrogen, Carlsbad,
Broad Range Assay Kit (Invitrogen, Carlsbad, CA, United States)             CA, United States) with a Qubit 2.0 Fluorometer (Invitrogen,
with a Qubit 2.0 Fluorometer (Invitrogen, Carlsbad, CA,                     Carlsbad, CA, United States) and diluted to 2 ng/µL prior
United States). Samples were stored at −20◦ C prior to analyses.            to PCR amplification. The Bacterial V3–V4 region of 16S
                                                                            rDNA and the Archaeal 16S rDNA were, respectively, amplified
Microbial Quantification by qPCR                                            with primers 357F 50 -CCTACGGGNGGCWGCAG-30 (Yu et al.,
The list of primer pairs and their optimal conditions used                  2005) and 805R 50 -GACTACHVGGGTATCTAATCC-30 (Lane
for quantitative PCR of total bacteria, Methanogenic archaea                et al., 1985) and primers 349F 50 -GYGCASCAGKCGMGAAW-
and Escherichia/Shigella group are presented in Supplementary               30 and 806R 50 -GGACTACVSGGGTATCTAAT -30 (Ohene-Adjei
Table 2 (Huijsdens et al., 2002; Yu et al., 2005; Ohene-Adjei et al.,       et al., 2008). Amplicons were generated using a Fluidigm
2008). Standard curves assessment was performed as specified in             Access Array followed by high-throughput sequencing on an
Gresse et al. (2021). Real-time PCR assays were performed on a              Illumina MiSeq system (Illumina, San Diego, CA, United States)

Frontiers in Microbiology | www.frontiersin.org                         4                                      July 2021 | Volume 12 | Article 703421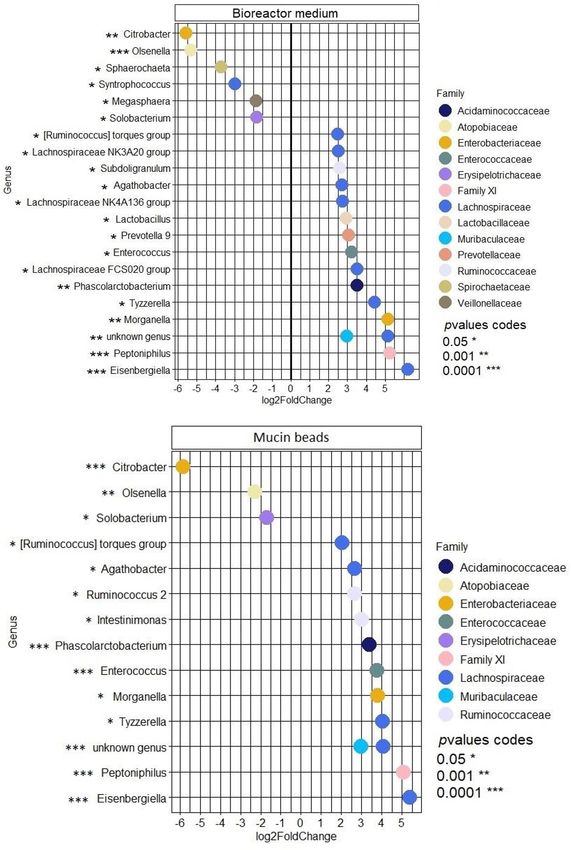
Gresse et al.                                                                                                ETEC Challenge in the MPigut-IVM

performed at the Carver Biotechnology Center of the University          from the recovery phase of the fermentation containing or not
of Illinois (Urbana, IL, United States). The demultiplexed              the ETEC Ec105 strain were also performed using the Wald
paired end Illumina sequence reads in the FastQ format were             test of the DESeq2 R package version 1.26.0 at the genus
uploaded into the Galaxy instance (v.2.3.0) of the Genotoul             level. In all statistical analyses, only P-values below 0.05 were
bioinformatics platform1 to be used in the FROGS (Find Rapidly          considered as significant.
OTU with Galaxy Solution) pipeline (Escudié et al., 2018).
During the FROGS pre-process, sequences were depleted of
barcode and the sequences with a non-appropriate length or
                                                                        RNA Isolation of MPigut-IVM Samples
containing ambiguous bases were removed. Next, reads were               Total RNAs from bioreactor medium, mucin beads, and bead
clustered into de novo operational taxonomic units (OTUs)               medium were extracted using Trizol reagent (Invitrogen, Thermo
using SWARM algorithm (Mahé et al., 2014) with, at first, a             Fisher Scientific, Waltham, MA, United States) as described
denoising step to build very fine cluster using the minimal             by Comtet-Marre et al. (2017). DNAse treatment with the
distance equal to 1 and, secondly, with an aggregation distance         rDNAse Set (Macherey-Nagel, Hśrdt, France) was performed
equal to 3. Chimeras were then detected and removed with                to remove any contamination of genomic DNA according to
VSEARCH (Rognes et al., 2016). Additionally, filters were               the manufacturer’s instructions. The integrity of few samples
applied to the OTUs in order to remove singletons (Bokulich             representative from the whole set was assessed using the Agilent
et al., 2013; Auer et al., 2017). The OTUs selected were                2100 Bioanalyzer using RNA Nano Chip (Agilent Technologies,
taxonomically assigned using the Silva release 132 reference            Inc., Santa Clara, CA, United States) to ensure sufficient
database (Quast et al., 2013).                                          quality for RT-qPCR. Quantity and purity of RNAs were
                                                                        measured using the Nanodrop One (Thermo Fisher Scientific,
                                                                        Waltham, MA, United States) and RNAs were stored at −80◦ C
Statistical Analysis of Sequencing Data                                 until cDNA synthesis.
The Illumina MiSeq run generated a total of 8,107,484 and
1,467,731 high quality sequences, respectively, for the V3–V4 and
archaeal sets of primers. Removal of PhiX control reads, removal        RT-qPCR of ETEC Virulence Genes
of chimeras and filtering of singletons lead to a number of             First, 1 µg of RNA per sample was reverse transcribed
51,703 ± 13,520 sequences for V3–V4 primers and 5,377 ± 4,645           into complementary DNA (cDNA) with the SuperScript
sequences for archaeal primers per sample. To avoid any bias,           IV Reverse Transcriptase kit (Invitrogen, Thermo Fisher
samples containing less than 500 sequences after abundance              Scientific, Waltham, MA, United States) in conformity with
filtering were removed from the dataset. Statistical analysis           the manufacturer’s instructions. QPCR was performed on
was processed using the RStudio software version 1.0 (with              the cDNAs as outlined in the section above. Primers and
R software version 3.5.1, R Development Core Team)2 . OTU               conditions used for qPCR on cDNAs are listed in Supplementary
structure and composition analyses were performed using the             Table 3. cDNAs and DNA samples from the ETEC Ec105
phyloseq R package version 1.30.0 (McMurdie and Holmes,                 pure culture and from the MPigut-IVM challenged with ETEC
2013). Visualization of data was performed using the ggplot2            were used as a positive control. The comparative E−11Ct
R package version 3.2.1. Prior to alpha and beta diversity              method was applied to calculate the relative fold changes
calculations, rarefaction using the transform count methods             in the expression of ETEC virulence genes in the samples
was applied to the dataset. The following alpha diversity               from the MPigut-IVM. The BestKeeper excel-based tool (Pfaffl
indices were calculated: number of observed OTU phylogenic              et al., 2004) was used to determine the geometric means of
diversity and Shannon index. Statistical differences in Bray            the three quantified reference genes, arcA, gapA, and rpos
Curtis distance between the mucin beads, bead medium and                considered for normalization. Primer efficiency was determined
the bioreactor medium and between the pre and post-weaning              using 10-fold dilution series of a set of samples representative
diet were tested using a multi-analysis of variance (MANOVA)            from mucin beads, bead medium, and bioreactor medium.
performed with ADONIS using the vegan R package with 9999               The efficiency was calculated from the slope of the standard
permutations and represented by principal coordinate analysis           curves using the following equation E = 10 (−1/slope),
(PCoA) plots. The relative abundances of bacterial groups               where E corresponds to high/acceptable amplification efficiency
were log transformed prior to univariate statistical analyses.          equals to 90–110%.
All univariate statistical analyses were performed using linear
mixed-models (lme4 package version 1.1.21) with time point
(days of fermentation) and ETEC treatment as fixed effects
                                                                        Quantification of Short Chain Fatty Acids
and fermentation experiment as a random effect. Analysis of             (SCFAs) by Gas Chromatography
variance tables was calculated with the car package (version            The SCFAs were quantified in the bioreactor medium and bead
3.0.6). The means of each group were compared pairwise with             medium by gas chromatography. Eight hundred microliters
the lsmeans package (version 2.30-0) with the Tukey correction          of supernatants from bioreactor medium and bead medium
(Supplementary Table 4). Statistical comparisons of samples             were mixed with 500 µL of 0.4% (w:v) crotonic acid and
                                                                        2% (w:v) metaphosphoric acid solutions. This mixture was
1
    http://sigenae-workbench.toulouse.inra.fr                           centrifuged and the supernatant obtained was injected into a
2
    www.R-project.org                                                   PerkinElmer Clarus 580 gas chromatograph (Waltham, MA,

Frontiers in Microbiology | www.frontiersin.org                     5                                     July 2021 | Volume 12 | Article 703421
Gresse et al.                                                                                                             ETEC Challenge in the MPigut-IVM

United States) for quantification of SCFAs. A mixed-model one-             A thirty-fold dilution of each sample was established as the
way ANOVA (lmer and ANOVA functions) with time point                       best compromise following preliminary tests estimating the
and ETEC treatment (days of fermentation) as fixed effects                 survival of IPI-2I cells exposed to dilution series of MPigut-IVM
and fermentation experiment as a random effect was used to                 supernatants. After 2 h of incubation with the 30 fold diluted
compare the concentration of the main SCFAs between days of                supernatants, the viability of cells was comprised between 70
fermentation using the R packages lme4 and car.                            and 100% with a mean of 86.5% (n = 8, data not shown). The
                                                                           diluted samples were added in duplicate to confluent monolayers
Metabolome Analysis by 1H Nuclear                                          of IPI-2I cells in 48-well plates, as described above. Plates were
                                                                           incubated for 2 h at 37◦ C, 5% CO2 . Then, the supernatants were
Magnetic Resonance (NMR)
                                                                           removed and IPI-2I cells were lysed by addition of 500 µL of
Supernatants of mucin bead medium collected on days 7 and 11
                                                                           NucleoZOL (Macherey-Nagel, Hœrdt, France). Cell lysates were
were used for metabolomic profiling using NMR spectroscopy.
                                                                           stored at −80◦ C prior to RNA isolation.
After two centrifugation steps (18,000 g, 4◦ C, 10 min) to
remove particles, 50 µL of supernatant were mixed with 600 µL
                                                                           RNA Isolation From IPI-2I Lysates
of buffer composed of sodium phosphate 0.2 M, pH 7.4,
                                                                           Total cellular RNA was extracted from IPI-2I lysed cells
trimethylsilylpropanoic acid 1 mmol/L, 80% deuterated water,
                                                                           following the guidelines provided by the NucleoZOL user manual
and 20% water. Spectra acquisition, processing, and metabolite
                                                                           (Macherey-Nagel, Hœrdt, France). The TURBO DNA-freeTM kit
identifications were performed as described previously in
                                                                           (Applied Biosystems, Foster City, CA, United States) was used
the MetaboHUB MetaToul-AXIOM metabolomics platform
                                                                           according to the manufacturer’s instructions to prevent DNA
(Beaumont et al., 2020). The list of metabolites identified in the
                                                                           contamination. Purity and quality of the RNA extracts were
bead medium is presented in Supplementary Table 5.
                                                                           controlled on 1% agarose gels. RNAs were then quantified using
   Statistical analysis for NMR metabolomics was performed
                                                                           a Nanodrop 1000 spectrophotometer (Thermo Fisher Scientific,
using the R software (version 3.5.1). Partial-least square
                                                                           Waltham, MA, United States) using an optical density of 260 nm.
discriminant analysis (PLS-DA) was performed with mixOmics
package (Rohart et al., 2017). Metabolite relative concentration           RT-qPCR on IPI-2I RNA Extracts
was used as variable matrix (X). Groups (Day 7, Day 11
                                                                           Reverse transcription was performed using the qScript cDNA
CTRL, Day 11 ETEC) were used as predictors (Y) and time-
                                                                           Synthesis Kit (Quantabio, Beverly, MA, United States). Briefly,
repeated measurement were considered by using a multilevel
                                                                           350 ng of RNA per sample were added to 5 µL of sScript Reaction
approach. Univariate statistical analysis was also performed on
                                                                           Mix (5x) and 1 µL of qScript Reverse Transcriptase in a final
each metabolite relative concentration with the R packages lme4
                                                                           volume of 15 µL. The reverse transcription mix was successively
and car. A mixed-model one-way ANOVA (lmer and ANOVA
                                                                           incubated 5 min at 22◦ C, 30 min at 42◦ C, and 5 min at 85◦ C.
functions) with group (Day 7, Day 11 CTRL, Day 11 ETEC) as
                                                                           The synthetized cDNAs were stored at −20◦ C until used. The
a fixed effect and fermentation experiment as a random effect
                                                                           targeted genes are listed in Supplementary Table 5 (Mariani
was used. A post hoc test was used to compare the mean relative
                                                                           et al., 2009). Quantifications were carried out in triplicate for
concentrations with Tukey correction. P-values were corrected
                                                                           each cDNA using a QuantStudioTM 12K Flex Real-Time PCR
for multiple testing (false discovery rate).
                                                                           system (Applied Biosystems, Foster City, CA, United States).
                                                                           The cyclophilin A and β-actin genes were used as reference
Incubation of MPigut-IVM Effluents on                                      genes. PCR reactions were carried out in 96 well plates using
the IPI Porcine Cell Line                                                  3 µL of 5x HOT FIREPol EvaGreen qPCR Mix Plus (ROX)
                                                                                                                R            R

IPI-2I Cell Culture                                                        (Solis BioDyne, Tartu, Estonia), 0.4 µL of forward and reverse
The IPI-2I cell line is derived from the ileum of an adult male            primer, 9.2 µL of milli-Q water, and 2 µL of cDNA. Tenfold
pig and was immortalized by transfection with an SV40 plasmid              dilution series of each primer pair were used as standard curves
(pSV3-neo) (Kaeffer et al., 1993). IPI-2I cells were maintained            to determine primer efficiencies. Real time PCR efficiencies
in Dulbecco’s Modified Eagle Medium (DMEM)/Ham’s F-12                      were calculated according to the equation: E = 10 (−1/slope).
(1:1) medium (Invitrogen Life Technologies, Carlsbad, CA,                  The appropriate reference gene and the Log2 fold change of
United States) supplemented with 10% Fetal Calf Serum (FCS,                each gene, compared with the IPI-2I cells which had not been
PAA Laboratories GmbH, Austria) and 4 mM L-glutamine                       exposed to bead medium supernatants, were determined by
(Sigma, St. Louis, MO, United States). Cells were seeded onto 48-          GenEx software3 . A mixed-model one-way ANOVA (lmer and
well tissue culture plates at 25,000 cell/well in a volume of 200 µL       ANOVA functions) with time point (days of fermentation) and
and grown 24 h in an atmosphere of 5% CO2 at 37◦ C to allow for            ETEC treatment as fixed effects and fermentation number as a
confluency for the day of experiment.                                      random effect was used to compare the significance between gene
                                                                           expression profile of the IPI-2I cells which were exposed to bead
Exposure of IPI-2I Cells to MPigut-IVM Effluents                           medium supernatants containing or not the ETEC Ec105 strain
Supernatants from bioreactor and bead medium at days 7, 9, 11,             using the R packages lme4 and car. In all statistical analyses, only
13, and 15 were filtered using 0.2 µm sterile Minisart syringe             P-values below 0.05 were considered as significant.
filters (Sartorius, Göttingen, Germany) and 30 times diluted
with DMEM (10% Fetal Calf Serum and 4 mM L-glutamine).                     3
                                                                               http://genex.gene-quantifcation.info/

Frontiers in Microbiology | www.frontiersin.org                        6                                               July 2021 | Volume 12 | Article 703421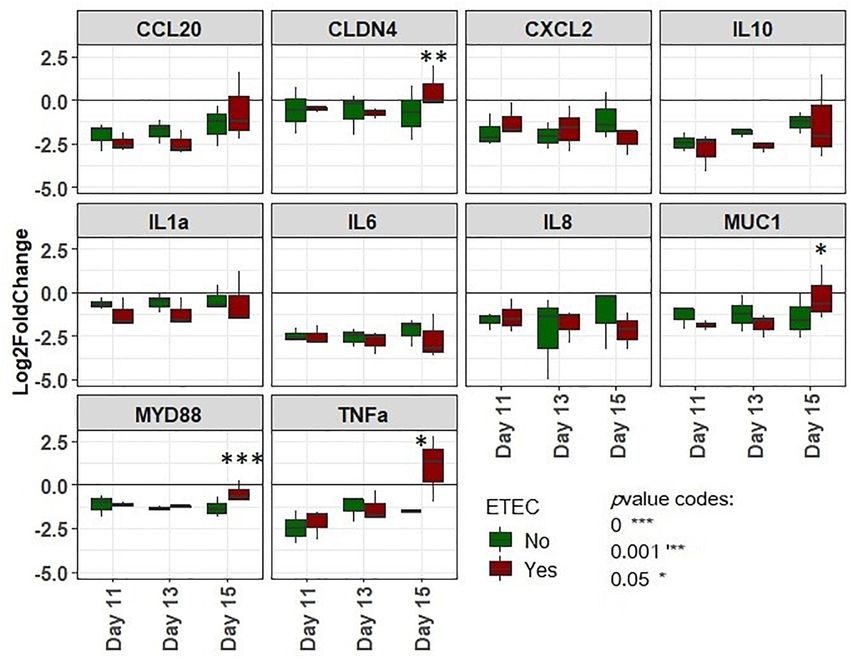
Gresse et al. ETEC Challenge in the MPigut-IVM
RESULTS 10 to 15 (Supplementary Figure 2). In the bioreactor, the
Proteobacteria significantly increased from a relative abundance
Analyses of the microbial profile and SCFA proportions of the of 4.0 ± 2.5% at day 7 to 17.1 ± 4.1% at day 9 and to
three pooled fecal inocula for the runs #1, 2, and 3 are available 7.9 ± 5.6% from day 10 to 15 (Supplementary Figure 2). Looking
in Supplementary Figure 1. Redox potential was followed at lower taxonomy level, some families were also significantly
throughout the whole fermentation runs and was representative impacted by the simulation of weaning transition (Figure 5). In
of a feed deprivation stress by displaying an important increase the bioreactor medium, Coriobacteriaceae significantly decreased
during this period such as detailed in Gresse et al. (2021) (data not from a mean relative abundance of 11.9 ± 6.6% at day 7 to
shown). Gas composition was also monitored every day during a mean relative abundance of 2.2 ± 2% from day 9 to day
the fermentation runs. At the end of the stabilization period [Day 15. In contrast, the Enterobacteriaceae and Erysipelotrichaceae
7, the mean relative proportions of H2 , O2 , CO2 , N2 , and CH4 families significantly increased from a mean relative abundance
for the six bioreactors were, respectively, 2.1 ± 1.2, 0.3 ± 0.1, of, respectively, 0.9 ± 0.7% and 1.5 ± 2% at day 7 to mean relative
73.7 ± 0.4, 5.9 ± 0.8, and 6.8 ± 1.1% (data not shown)]. abundances of 6.2 ± 5.4% and 4.7 ± 4.1% from day 9 to day
15 (Figure 5A). Finally, the Prevotellaceae significantly decreased
Simulation of Weaning Transition Affects from 6.5 ± 6.3% at day 7 to 4 ± 2.7% at day 9 prior to significantly
the Metabolic Activity of the MPigut-IVM increase from day 10 to day 15 with a mean relative abundance of
27.1 ± 20%. On the mucin beads, the average relative abundances
Microbiota
of Bacteroidiaceae and Coriobacteriaceae for the day 11–day 15
In the bioreactor medium of the CTRL group, propionate and
period (10.3 ± 8.8% and 1.3 ± 0.9%, respectively) significantly
caproate proportions increased while acetate, isovalerate and
decreased as compared to those calculated for the day 7–day
butyrate proportions decreased from day 10 to 15 compared to
9 period (24.9 ± 9% and 5 ± 2.7%, respectively) (Figure 5B).
day 7 (Figure 2A). In the mucin bead medium of the CTRL
In contrast, the average relative abundances of Prevotellaceae
group, the proportions of propionate, isovalerate and valerate
and Atopobiaceae were significantly higher for the day 11–
increased while the proportions of acetate and butyrate decreased
day 15 period (9.7 ± 7% and 6.8 ± 4%, respectively) than
from day 11 to 15 compared to day 7 (Figure 2A). The total
those calculated for the day 7–day 9 period (3.1 ± 2.4% and
concentration of SCFA significantly (P < 0.05) increased between
2.4 ± 1.5%, respectively) (Figure 5B). The simulation of weaning
day 9.5 and 15 both in the bioreactor medium and the bead
transition also led to modifications in relative proportions of
medium (Figure 2B).
several genera, both in bioreactor medium and mucin beads
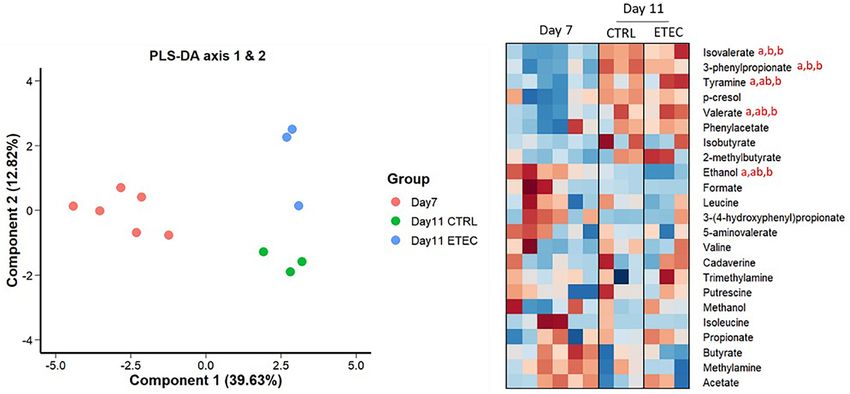
Nuclear magnetic resonance-based metabolomics revealed
(Figure 6). Statistical results of this section are detailed in
a strong modification of the mucin bead medium metabolome
Supplementary Table 6.
between day 7 and day 11 in the CTRL group (Figure 3). The
In the bioreactor medium and the mucin beads of control
relative concentration of isovalerate and 3-phenylpropionate
fermentations, the Methanosphaera genus was found in
increased significantly after the simulation of weaning
significantly higher mean relative abundance during the
transition (day 11 CTRL).
recovery period compared to the end of the stabilization
period (Figure 7A), and feed deprivation stress also affected
Simulation of Weaning Transition Methanobrevibacter relative abundance which was significantly
Impacts MPigut-IVM Microbiota lower after stress but only on mucin beads (Figure 7B).
Composition Regarding qPCR data, on the mucin beads, the abundance of
Q-PCR quantifications of targeted bacterial groups showed that archaea increased significantly (P < 0.05) at day 15 compared to
total bacteria concentrations were not affected by the 48 h day 9 and 11 for the CTRL conditions (Figure 4B).
feed deprivation stress nor the diet change (Figure 4A). The
abundance of Escherichia/Shigella group increased significantly Survival of Ec105 in the MPigut-IVM
(P < 0.05) at day 9 and 15 in the bioreactor medium, when The presence of the ETEC strain was monitored in all the
compared to day 7. In the mucin beads, the concentration MPigut-IVM samples by quantifying the LT gene using qPCR.
of Escherichia/Shigella increased significantly (P < 0.05) at In the bioreactor medium of the ETEC condition, the LT gene
day 15 compared to day 9 and 11 for both (Figure 4B). was quantified at a mean of 8.0 ± 0.2 log10 of gene copy/g of
PMA-qPCR confirmed that bacteria from Escherichia/Shigella sample at day 10 (ETEC inoculation) prior to slowly decrease
genus were viable across time for all the fermentation runs over time to reach a mean of 4.9 ± 1.1 log10 of gene copy/g
in both the bioreactor and bead medium of the MPigut-IVM of sample at day 15 (end of recovery period). On the mucin
(data not shown). beads of ETEC condition, the LT gene was quantified at mean
16S DNA sequencing analysis showed a certain variability of values of 4.5 ± 1.6 and 3.3 ± 2.9 log10 of gene copy/g of
microbiota composition between runs #1, 2, and 3. However, sample, respectively, at day 11 and 15. However, the LT gene
several populations responded in a similar manner and were was quantified in higher concentration in the bead medium at
significantly impacted by the simulated weaning transition. In mean values of 7.6 ± 1.6 and 6.4 ± 2.1 log10 of gene copy/g of
more details, on the mucin beads, the Spirochaetes phylum sample, respectively, at day 11 and 15. It can be noticed that the
significantly decreased from a relative abundance of 6.8 ± 5.7% LT gene was quantified in much lower quantity from day 11 in
at day 7 to 0.3 ± 0.3% of mean relative abundance from day all samples from run #1 (Figure 8). Finally, a low copy number
Frontiers in Microbiology | www.frontiersin.org 7 July 2021 | Volume 12 | Article 703421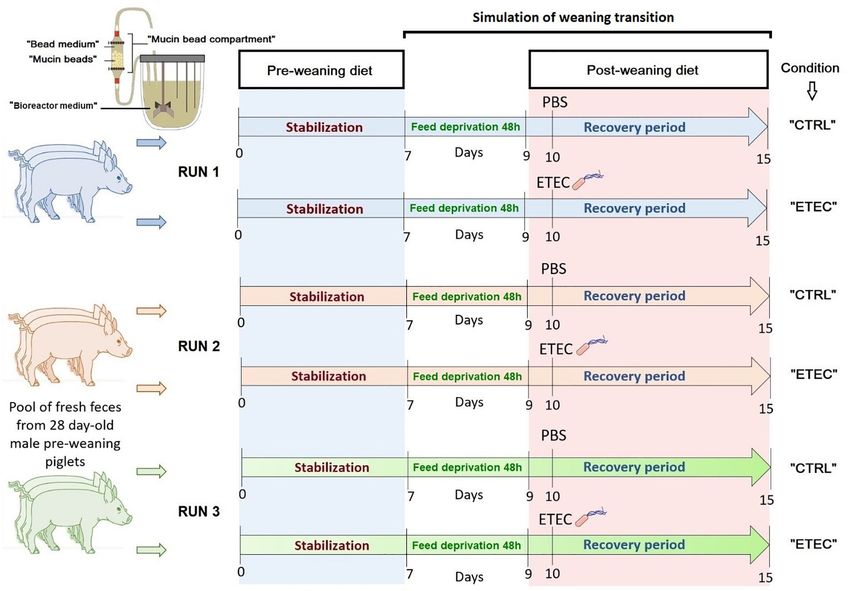
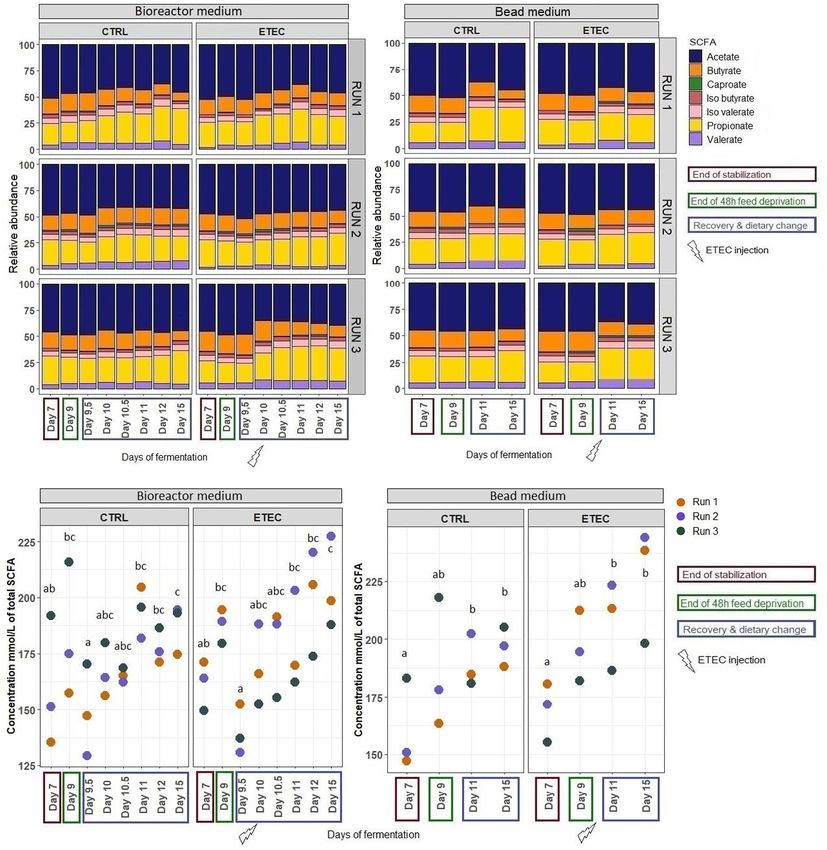
Gresse et al.                                                                                                                        ETEC Challenge in the MPigut-IVM

  FIGURE 2 | Short chain fatty acids (SCFA) relative abundances (A) and Evolution of the total concentration of SCFAs (B) produced by fermentation activity of the
  microbiota inhabiting the MPigut-IVM in the CTRL and ETEC conditions for the runs #1, 2, and 3. Groups (days) associated with different letters are significantly
  different (P < 0.05).

of LT gene could also be detected in the CTRL condition at mean                        versus CTRL in the bead medium and bioreactor medium,
values of 2.9 ± 1.6, 3.4 ± 1.6, and 3.9 ± 0.2 log10 of gene copy/g                     respectively (Figure 2A).
of sample, respectively, in the bioreactor medium, mucin beads,                           The mucin bead medium metabolome shifted strongly
and bead medium, however, these values are close to the detection                      between day 7 and day 11 in the presence of ETEC
limit (Figure 8). The activity of the ETEC strain in the MPigut-                       Ec105 (Figure 3). Indeed, the relative concentrations of
IVM was evaluated by quantification of virulence gene expression                       isovalerate, valerate, 3-phenylpropionate and tyramine increased
using RT-qPCR. Even though the expression of virulence genes                           significantly, while the relative concentration of ethanol
was detected in the bioreactor medium and bead medium in the                           decreased. Multivariate PLS-DA analysis also suggested
ETEC condition on the day 10, 11, and 15, none of the targeted                         metabolome differences between CTRL and ETEC groups at day
virulence genes (EAST1, LT, and K88 genes) was expressed in the                        11 (Figure 3). However, the relative concentrations of individual
CTRL condition (data not shown).                                                       metabolites were not significantly different at this time point.

Effects of the ETEC Ec105 Strain on
MPigut-IVM Microbiota Metabolic                                                        ETEC Challenge Triggers Microbiota
Activity                                                                               Composition Disruptions in the
Relative abundances of SCFAs were compared between the                                 MPigut-IVM Subjected to a Simulated
conditions ETEC and CTRL during the recovery period from                               Weaning Transition
day 10 to 15. The proportion of caproate and propionate                                No effect of the presence of the ETEC Ec105 strain on bacterial
tended (0.05 < P < 0.1) to be higher in the ETEC condition                             populations was detected by qPCR (Figure 4). However, a

Frontiers in Microbiology | www.frontiersin.org                                    8                                             July 2021 | Volume 12 | Article 703421
Gresse et al.                                                                                                                           ETEC Challenge in the MPigut-IVM

  FIGURE 3 | NMR-based metabolomics analysis of mucin bead medium. Left panel: Individual plot of PLS-DA. Right panel: Heatmap representing the relative
  concentrations of all identified metabolites (rows) in individual samples (columns). The color represents the Z-scores (row-scaled relative concentration) from low
  (blue) to high values (red). The days sharing the same letters are not significantly different from each other (p > 0.05) whatever the conditions.

significant impact of the ETEC challenge on the microbiota was                              The MPigut-IVM microbiota alpha diversity indices were not
highlighted by the Illumina MiSeq data from day 10 to 15. Indeed,                        significantly modified by any of the treatment (Supplementary
in the bioreactor medium, the presence of Ec105 led to significant                       Figure 4). Yet, beta diversity analysis using principal component
higher average relative abundance of the Bacteroidetes phylum                            analysis on Bray-Curtis distance showed that samples of MPigut-
(35.4 ± 15.4% for the CTRL condition and 50.7 ± 10.5% for                                IVM clustered by diet (Supplementary Figure 4). No effect of
the ETEC condition for the day 10 to day 15 period), and lower                           ETEC was detected (data not shown).
mean relative abundance of Actinobacteria from 9.2 ± 7.4%
in the CTRL condition to 2.7 ± 2.7% in the ETEC condition                                Gene Expression in IPI-2I Cells Is
during the same period (Supplementary Figure 2A). On the
                                                                                         Modulated When Exposed to the Bead
mucin beads, the Firmicutes were significantly increased from
48.9 ± 7.7% in the CTRL condition to 58.1 ± 6.6% in the                                  Medium of MPigut-IVM Challenged by
ETEC condition from day 11 to 15 (Supplementary Figure 2B).                              ETEC
At the family level in the bioreactor medium (Figure 5A),                                The expression of selected genes involved in innate inflammatory
the Prevotellaceae average relative abundance was significantly                          immune response targeting inflammatory cytokines and
increased (23.2 ± 23% in the CTRL condition, 30.9 ± 18.8% in                             chemokines, tight junctions or mucus secretion (Supplementary
the ETEC condition for the day 10 – day 15 period) (Figure 5A).                          Table 5) of IPI-2I porcine cells incubated with filtrated effluents
In contrast, Acidaminococcaceae, Atopobiaceae, Veillonellaceae,                          of the bead medium of MPigut-IVM were quantified using
and Erysipelotrichaceae were significantly reduced with average                          RT-qPCR (Figure 10). The effluents from the ETEC-inoculated
relative abundances of, respectively, 24.2 ± 8.4%, 6.3 ± 7%,                             bioreactors collected at day 15 led to a significant increase in
4.1 ± 2.8%, and 6 ± 4.8% in the CTRL condition to 18.2 ± 7.4%,                           the expression of TNFα, MYD88, MUC1, and CLDN4 genes
0.3 ± 0.4%, 2.2 ± 2.1%, and 2.7 ± 2.8% in the ETEC condition                             compared to effluents from control bioreactors collected at same
during the same recovery period (Figure 5A). On the mucin                                day. Differences in IPI-2I gene expression caused by effluents
beads, the Atopobiaceae family was significantly decreased from                          from the other days of fermentation (day 11 and 13) remained
mean relative abundance of 11.5 ± 3.2% in the CTRL condition to                          non-significant.
5.8 ± 2.1% in the ETEC condition while the Enterococcaceae was
significantly increased from 0.5 ± 0.6% in the CTRL condition to
10.3 ± 5.7% in the ETEC condition in the day 11 – day 15 period                          DISCUSSION
(Figure 5B). At the genus level, the introduction of the ETEC
strain significantly affected the abundance of several genera. For                       The MPigut-IVM has been developed to simulate the gut
example, the genera Eisenbergiella, Peptoniphilus, Morganella,                           microbiome and mucobiome of weaning piglet (Gresse et al.,
Tyzzerella, and Enterococcus were particularly enhanced in the                           2021). In this previous paper, we demonstrated that, due to
ETEC-challenged bioreactors and mucin beads (Figures 6, 9).                              unique features such as the presence of mucin beads and a self-
The MPigut-IVM archaeal microbiota was not significantly                                 maintained anaerobiosis, the MPigut-IVM harbored an in vitro
impacted by ETEC inoculation (Figure 7).                                                 microbiota very close to that of the proximal colon of piglets

Frontiers in Microbiology | www.frontiersin.org                                      9                                              July 2021 | Volume 12 | Article 703421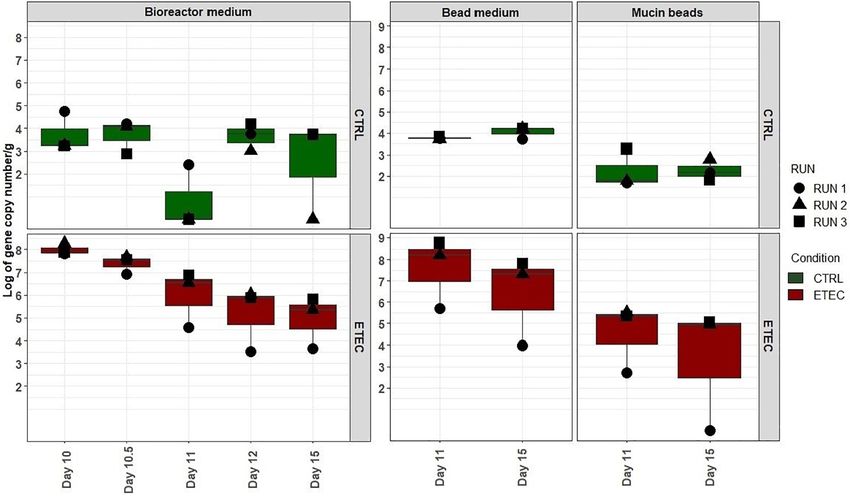
Gresse et al.                                                                                                                       ETEC Challenge in the MPigut-IVM

  FIGURE 4 | Q -PCR quantification of total bacteria, Escherichia/Shigella and methanogenic archaea populations in the bioreactor medium (A) and the mucin beads
  (B) of the MPigut-IVM for the runs #1, 2, and 3 in the CTRL and ETEC conditions. The days sharing the same letters are not significantly different from each other
  (p > 0.05) whatever the conditions.

originating from the same farm, after a stabilization period of                        focused on the introduction of more diversified plant protein
7 days (Gresse et al., 2021). To further understand the impact                         sources and of higher amounts of these nutrients was introduced
of weaning stressors on the colonic microbiota of piglets and                          into the MPigut-IVM right after the 48 h- feed deprivation
their roles in the etiology of post-weaning diarrhea, a diet change                    period to evaluate the impact of stressful events close to weaning

Frontiers in Microbiology | www.frontiersin.org                                   10                                            July 2021 | Volume 12 | Article 703421
Gresse et al.                                                                                                                     ETEC Challenge in the MPigut-IVM

  FIGURE 5 | Relative abundances of the main bacterial families in the bioreactor medium (A) and the mucin beads (B) in MPigut-IVM during the runs #1, 2, and 3
  which were subjected to a simulated weaning transition and challenged or not with the ETEC Ec105 strain.

as encountered in commercial pig farms. First, in the present                         and Methanosphaera are mainly known as hydrogenotrophic
work, the simulated weaning transition induced modifications                          and methylotrophic archaea genera, respectively, although recent
in the archaeal microbiota of the MPigut-IVM, shifting from a                         genomic studies suggest that they may have other metabolic
Methanobrevibacter to a Methanosphaera dominant microbiota.                           differences (Poehlein et al., 2018). Second, regarding bacterial
Modifications of the archaeal microbiota associated with weaning                      microbiota, the simulated weaning transition induced an increase
transitions are not yet well documented in piglets. This shift                        in the relative abundance of several bacterial communities in the
could, however, impact the metabolites present in the piglet                          MPigut-IVM, including Prevotellaceae and Enterobacteriaceae
gut, considering the high abundance of archaea populations in                         family members while the Bacteroidiaceae was decreased. Our
piglet lower gut (Gresse et al., 2019). Indeed, Methanobrevibacter                    findings are in agreement with in vivo studies reporting a shift

Frontiers in Microbiology | www.frontiersin.org                                  11                                           July 2021 | Volume 12 | Article 703421
Gresse et al.                                                                                                                 ETEC Challenge in the MPigut-IVM

  FIGURE 6 | Mean relative abundance of the 30 more abundant bacterial genera in the bioreactor medium (A) and mucin beads (B) of MPigut-IVM in the CTRL and
  ETEC conditions (n = 3).

from a high relative abundance of Bacteroides in pre-weaning                       piglets that developed diarrhea after weaning harbored a higher
piglet feces toward a high relative abundance of Prevotella                        relative abundance of Prevotella and less Escherichia coli in
coupled with a reduced Bacteroides proportion in post-weaning                      their pre-weaning period compared to piglets that remained
piglet fecal samples (Alain B. Pajarillo et al., 2014; Frese et al.,               healthy after weaning (Yang et al., 2019). A reduced number
2015; Guevarra et al., 2018; Trckova et al., 2018; Yang et al., 2019)              of Bacteroides in weaned piglet feces was also associated with
and Adhikari et al. (2019) reported similar results in the piglet                  diarrhea (Yang et al., 2019). Therefore, disturbed ratios between
colon. Prevotella is a common commensal genus which plays                          Prevotella, Bacteroides, and Escherichia populations in early life
important roles in the digestion of nutrients, particularly in the                 could be associated with the onset of post-weaning diarrhea.
degradation of starch, proteins and other plant polysaccharides                    Also, the simulated weaning transition in the MPigut-IVM led
(Ivarsson et al., 2014; Sandberg et al., 2019). In the study                       to a decrease of the Collinsella genus from the Coriobacteriaceae
from Yang et al. (2019), Prevotella was the most abundant                          family. A decreased proportion of Collinsella in human gut was
genus in both healthy and diarrheic weaning piglets. However,                      previously linked to the development of a dysbiotic microbiota

Frontiers in Microbiology | www.frontiersin.org                               12                                          July 2021 | Volume 12 | Article 703421
Gresse et al.                                                                                                                    ETEC Challenge in the MPigut-IVM

  FIGURE 7 | Relative abundance of the archaeal genera in the bioreactor medium (A) and mucin beads (B) of the MPigut-IVM for the runs #1, 2, and 3, in the CTRL
  and ETEC conditions. Day 7 and 9 of run #1 were removed due to their low number of sequences.

in inflammatory bowel disease (Kassinen et al., 2007) while an                       our previous findings (Gresse et al., 2021). In the bioreactor
increase of Collinsella was positively correlated with protection                    and on the mucin beads, butyrate, acetate and isovalerate
against rotavirus diarrhea in gnotobiotic pigs (Twitchell et al.,                    relative abundances significantly decreased after the simulated
2016) suggesting of potential role of Collinsella in pigs’ health. In                weaning transition. In contrast, propionate, valerate and caproate
our study, microbial activity was also significantly modified by the                 increased both in the bioreactor and on the mucin beads of the
simulated weaning transition probably associated to microbiota                       MPigut-IVM. The total SCFA concentration increased during
composition changes. Redox potential was considerably impacted                       the feed deprivation period. This particular point could be due
by the feed deprivation period which is in agreement with                            to the accumulation of these metabolites inside the bioreactors

Frontiers in Microbiology | www.frontiersin.org                                 13                                           July 2021 | Volume 12 | Article 703421
Gresse et al.                                                                                                                    ETEC Challenge in the MPigut-IVM

  FIGURE 8 | Quantification of the ETEC LT gene in the MPigut-IVM by qPCR for the runs #1, 2, and 3 in the CTRL and ETEC conditions (n = 3).

due the absence of feeding and consequently medium flushing.                         could also induces different responses toward the ETEC challenge
Besides, the bacterial metabolite 3-phenylpropionate increased                       and the simulated weaning transition such as observed in vivo.
after weaning simulation in the mucin bead medium, maybe due                         The ETEC challenge did not influence the relative abundance of
to an increased availability of its polyphenol precursors present                    Escherichia/Shigella genus, probably because the concentration
in the post-weaning diet. Butyrate proved to be very beneficial                      of the ETEC strain after inoculation was in the range of that
to piglet health by improving the performance of piglets around                      of commensal Escherichia/Shigella. In addition, López-Colom
weaning due to the stimulation of intestinal epithelium (Lu                          et al. (2019) reported previously that an ETEC challenge was
et al., 2008), improved immune response (Melo et al., 2016), and                     not associated with the increase of commensal E. coli in the
modulation of intestinal microbiota (Castillo et al., 2006; Xu et al.,               ileum and ileal mucosa of weaned piglets. In this study, piglets
2016; López-Colom et al., 2019). Also, supplementation of early                      which received butyrate and heptanoate preventive treatments to
weaned piglets with sodium butyrate was shown to attenuate                           ETEC F4 displayed higher levels of commensal Enterobacteria in
diarrhea symptoms and decrease intestinal permeability (Feng                         the ileum and ileal mucosa few days after the infection (López-
et al., 2018). Thus, fluctuations of both bacterial composition                      Colom et al., 2019). One hypothesis, supported by Leatham
and activity were observed in the MPigut-IVM following the                           et al. (2009), was the phenomenon of colonization resistance
simulated weaning transition which could favor the emergence                         described as an increase in coliforms in the gut to fight against
of opportunistic pathogens such as ETEC.                                             colonization of pathogenic strains. In the present work, several
    To further simulate the conditions leading to post-weaning                       families and genera were, however, significantly impacted by the
diarrhea at weaning (Gresse et al., 2017), a porcine ETEC                            introduction of ETEC after the simulated weaning transition in
strain was inoculated to the MPigut-IVM after the simulated                          the MPigut-IVM. The most spectacular change was the increase
weaning transition. Interestingly, 2 days after the inoculation                      in Enterococcus in the ETEC conditions, especially on the mucin
of ETEC Ec105, the Labile Toxin (LT) gene was detected in                            beads. Some Enterococcus members are known to bind to mucus
high concentration in the bead medium of the MPigut-IVM,                             in vivo (Hendrickx et al., 2015; Tytgat et al., 2016). Consistently
showing a preferential localization of ETEC Ec105 close to an                        with our findings, several in vivo studies reported a higher relative
area rich in mucins which are indeed known to be a privileged                        abundance or quantity of Enterococcus and E. coli or ETEC
site of adhesion in vivo (González-Ortiz et al., 2014). Only                         strains in the digestive content or mucosa of neonatal diarrheic
one replicate displayed a strong decrease in the pathogenic                          piglets (Cheon and Chae, 1996; Jonach et al., 2014; Larsson
strain concentration after few days in the MPigut-IVM. This                          et al., 2014; Hermann-Bank et al., 2015). A co-occurrence of
difference could be explained by some variability in the microbial                   Enterococcus and pathogenic E. coli could thus be involved in
composition of the fecal inocula, probably reflecting the in vivo                    the pathogenesis of diarrhea episodes in piglets. Considering
situation. A more robust microbial community could lead to less                      the several reports of this observation, it has been hypothesized
susceptibility to the introduction of a pathogen. The differences                    that Enterococcus and E. coli/ETEC members could be able to
of microbiota composition observed between the three replicates                      naturally cooperate possibly by mechanisms of cross feeding

Frontiers in Microbiology | www.frontiersin.org                                 14                                           July 2021 | Volume 12 | Article 703421
Gresse et al. ETEC Challenge in the MPigut-IVM FIGURE 9 | Differentially abundant genera between the samples of the recovery period containing the ETEC Ec105 strain or not in the bioreactor medium (A) and mucin beads (B) of the MPigut-IVM. Only significant Log2 fold changes are represented on the figure. Positive Log2 fold changes indicate genera that were significantly more abundant in the presence of the pathogen. P values were corrected for multiple testing. Frontiers in Microbiology | www.frontiersin.org 15 July 2021 | Volume 12 | Article 703421
Gresse et al.                                                                                                                        ETEC Challenge in the MPigut-IVM

  FIGURE 10 | Log2 fold changes of gene expression of IPI-2I cells incubated with bead medium supernatants of the MPigut-IVM collected at days 11, 13, and 15
  and challenged or not with the ETEC Ec105 strain. Values were normalized with basal gene expression profiles for the targeted genes from IPI-2I cells incubated with
  their usual glutamine and FCS complemented DMEM medium (n = 3).

or mutualism (Germerodt et al., 2016). Finally, the Morganella                         this is the first time that this was performed with an in vitro model
genus, which was found to be four times more abundant in the                           of the piglet colon. In this study, supernatants from the bead
ETEC condition both in the mucin beads and the bioreactor                              medium of the ETEC condition induced significant increases
by the differential analysis, has been previously associated with                      in expression of genes coding for the myeloid differentiation
diarrhea in humans (Müller, 1986; Jertborn and Svennerholm,                            primary response 88 (MyD88), tumor necrosis factor α (TNFα),
1991; Ikeobi et al., 1996) and was even positively correlated                          claudin 4 (CLDN4), and mucin 1 (MUC1) in IPI-2I cells. The
with diarrhea indices during an ETEC F4 challenge in mice (Xu                          relation between mucins, commensals and pathogens have been
et al., 2020). The MPigut-IVM is thus able to reproduce several                        widely studied (Etienne-Mesmin et al., 2019). MUC1 is a high
characteristics of ETEC pathogenesis consistent with in vivo data.                     molecular mass glycoprotein expressed at the apical surface of
In consequence, the other populations which correlated with the                        mucosal epithelial cells. MUC1 secretion can be stimulated by
ETEC conditions but are not currently described in the literature                      lipopolysaccharides produced by Gram negative bacteria and
such as Peptoniphilus or Eisenbergiella should be considered as                        mucin is thought to play an important role against infections of
populations of interest for future investigations.                                     epithelial cells (Kato et al., 2017). Expression of the MUC1 gene
   To increase our understanding of the etiology of post-weaning                       notably limited the access of Helicobacter pylori in infected mice
diarrhea and how microbiota disruptions and pathogen presence                          (McGuckin et al., 2007). In our study, claudin 4 gene was over-
affect host cells, we incubated diluted filtrated effluents collected                  expressed in cells exposed to supernatants collected at day 15 of
from bead medium from MPigut-IVM with the IPI-2I pig                                   ETEC conditions. This gene belongs to claudins’ family which
intestinal cell line. In vitro models of the human colon were                          are, with occludin proteins, tight junction proteins located at the
previously successfully coupled with eukaryotic cell cultures                          apical side of piglet enterocytes (Pasternak et al., 2015) and thus
(Marzorati et al., 2014; Defois et al., 2018) but, to our knowledge,                   play a role in intestinal permeability and infection. Consistently

Frontiers in Microbiology | www.frontiersin.org                                   16                                             July 2021 | Volume 12 | Article 703421
You can also read