A Multiomic Approach to Investigate the Effects of a Weight Loss Program on the Intestinal Health of Overweight Horses
←
→
Page content transcription
If your browser does not render page correctly, please read the page content below
ORIGINAL RESEARCH
                                                                                                                                                  published: 18 June 2021
                                                                                                                                          doi: 10.3389/fvets.2021.668120

                                             A Multiomic Approach to Investigate
                                             the Effects of a Weight Loss Program
                                             on the Intestinal Health of
                                             Overweight Horses
                                             Nicola Walshe 1*, Raul Cabrera-Rubio 2,3 , Roisin Collins 1 , Antonella Puggioni 1 ,
                                             Vivian Gath 1 , Fiona Crispie 2,3 , Paul D. Cotter 2,3,4 , Lorraine Brennan 5 , Grace Mulcahy 1,6†
                                             and Vivienne Duggan 1†
                                             1
                                              School of Veterinary Medicine, University College Dublin, Dublin, Ireland, 2 Teagasc Food Research Centre, Moorepark,
                                             Fermoy, Ireland, 3 APC Microbiome Ireland, Cork, Ireland, 4 VistaMilk, Cork, Ireland, 5 UCD School of Agriculture and Food
                                             Science, Conway Institute, UCD Institute of Food and Health, University College Dublin, Dublin, Ireland, 6 Conway Institute of
                                             Biomedical and Biomolecular Research, University College Dublin, Dublin, Ireland
                            Edited by:
                      Guillermo Tellez,
 University of Arkansas, United States
                                             Obesity is endemic in human populations in the western society, and with mounting
                       Reviewed by:
                                             evidence that the intestinal ecological environment plays a major role in its pathogenesis,
       Victor Manuel Petrone-García,         identification of therapies based on intestinal microbiota modulation are gaining attention.
   National Autonomous University of         Obesity in companion animals is also a common clinical problem. We set out using a
                      Mexico, Mexico
               Roberto Senas Cuesta,         multidimensional approach, to determine the effectiveness and safety of a weight loss
 University of Arkansas, United States       program for horses incorporating diet restriction and exercise. In addition, we aimed
                   *Correspondence:          to investigate the effect of this program on the overall intestinal health of overweight
                         Nicola Walshe
                  nicola.walshe@ucd.ie
                                             sedentary horses. The investigation comprised of a randomized, controlled, 6-week
                                             study of 14 overweight sedentary horses and ponies who were blocked for age, gender,
 † These   authors share last authorship
                                             and breed (controls n = 7, treatment n = 7). The treatment group were fed a restricted
                    Specialty section:       diet (1.4% of body weight dry matter intake) and the control group a maintenance diet
         This article was submitted to       (2% of body weight as dry matter intake) over the study period. The treatment group
     Animal Nutrition and Metabolism,
                                             were subjected to a prescribed exercise regime, while the control group were exercised
                a section of the journal
        Frontiers in Veterinary Science      to mimic foraging conditions. Several clinical measurements were taken at the start
           Received: 15 February 2021        and end of the study, including morphological parameters, ultrasound measurements of
            Accepted: 16 March 2021          subcutaneous fat, and blood pressure. Fecal microbiota analysis was performed using
             Published: 18 June 2021
                                             16S rRNA gene sequence analysis, and fecal metabolome was analyzed using NMR
                              Citation:
Walshe N, Cabrera-Rubio R, Collins R,
                                             spectroscopy, on samples taken at weeks 1, 3, and 6 of the study. All horses completed
          Puggioni A, Gath V, Crispie F,     the study period successfully. However, two of the treatment group had to have modified
Cotter PD, Brennan L, Mulcahy G and
                                             exercise regimes. The treatment group showed significant weight loss (p < 0.00001) and
         Duggan V (2021) A Multiomic
Approach to Investigate the Effects of       an associated decrease in waste circumference (p < 0.0001) when compared with the
       a Weight Loss Program on the          control group. The alpha-diversity of the fecal microbiota in the treatment group showed
        Intestinal Health of Overweight
   Horses. Front. Vet. Sci. 8:668120.
                                             a significant increase from the start to the end of the study period (p < 0.05); however,
     doi: 10.3389/fvets.2021.668120          there was no significant difference between groups at any sampling point. There were

Frontiers in Veterinary Science | www.frontiersin.org                                1                                              June 2021 | Volume 8 | Article 668120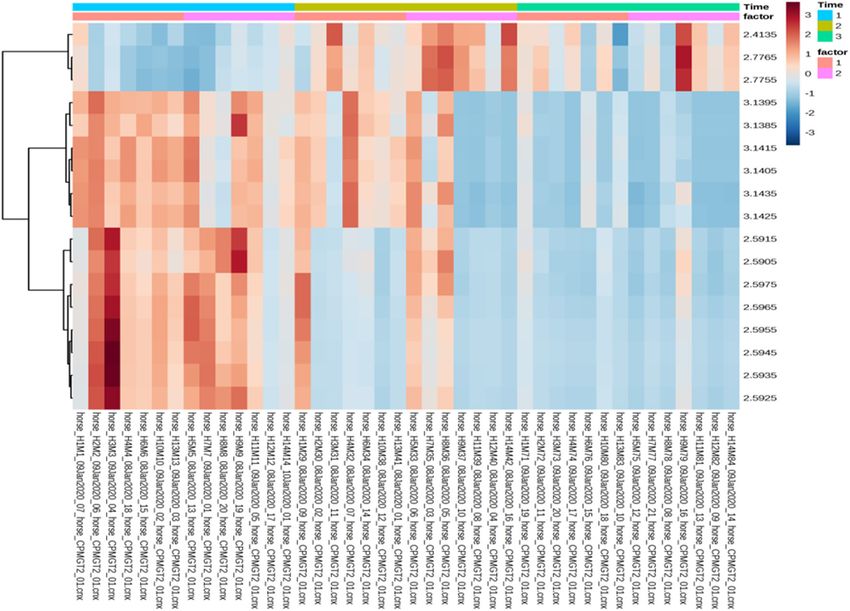
Walshe et al.                                                                                                             Weight-Loss Effects on Obese Horses

                                             significant changes (p < 0.05) in the metabolome in both groups between the start and
                                             end of the study, but not between groups at any sampling point. Finally, the resting blood
                                             pressure of all horses was significantly lower by the end of the study.

                                             Keywords: equine, fecal microbiota, fecal metabolome, multiomics, obesity, weight-loss, diversity

INTRODUCTION                                                                        parameters, fecal microbiota, and fecal metabolome in a cohort
                                                                                    of clinically normal but overweight horses and ponies. This
Human obesity is recognized as endemic worldwide (1) with                           was to be achieved using a multiomics approach combined
comprehensive reports showing a rise in the incidence of obesity                    with morphological assessment, cardiovascular diagnostics, and
globally (2, 3). Domesticated animals also suffer from obesity;                     clinical observations.
notably, 20–51% of selected horse and pony populations are
reported to be overweight or obese (4–8).
    Obesity is associated with further chronic health problems,
                                                                                    MATERIALS AND METHODS
including metabolic syndrome. In human metabolic syndrome,                          Study Population
obesity and associated increased blood pressure, hyperglycemia,                     This was a longitudinal study using client-owned, rather than
excess abdominal fat, and abnormal blood cholesterol and                            experimental animals; therefore, the number of animals available
triglyceride concentrations result in an increased risk of                          were constrained. As we intended to measure a range of
cardiovascular disease and diabetes type-2 (9). Similarly,                          parameters related to body condition, physiological parameters,
overweight horses and ponies may develop equine metabolic                           and gut health, we chose to use an anticipated change in body
syndrome (EMS), in which obesity and insulin dysregulation are                      weight as a significant parameter for estimation of required
associated with significant disease (10) such as endocrinopathic                    group size.
laminitis (11, 12), a painful debilitating inflammatory condition                       We estimated that for a study with power = 90%, we could
of the lamellar tissues connecting the hoof wall to the pedal bone                  reliably measure an incremental body weight reduction of 5 kg,
that can ultimately lead to euthanasia (13). Equids with insulin                    i.e., a weekly reduction of 1% in an average horse of 500 kg, and
dysregulation are also at risk of dyslipidemia, which may result in                 that the SD of the reduction would be no more than 4 kg. Hence,
hepatic dysfunction (14). In addition, EMS has been associated                      the SD units would be 1.25, and the required group size is n =
with myocardial hypertrophy, correlated with insulin dynamics,                      7. Due to the other parameters included in this study and the
autonomic nervous system tone, and blood pressure (15).                             availability of horses that fit the inclusion criteria, we increased
    In order to combat obesity and its associated comorbidities,                    our group size to 14.
investigations are ongoing into predisposing factors and potential                      The study was carried out on a total of 14 horses. The study
novel treatments. In humans, this has led to an increasing focus                    population was recruited from a rescue charity (n = 12) and
over the past decade on the possible influence of the intestinal                    from the UCD teaching herd (n = 2) that were residents on
microbiota on obesity (reviewed in Castaner et al. (16)). There are                 the study site. The study group consisted of a mix of breeds
a relatively small number of studies investigating the association                  (Table 1), a range of ages (4–17 years old) and included both
between the gut microbiota and obese phenotype in the horse;                        genders (nine geldings and five mares). Horses were included in
however, changes in the microbiome have been noted, with an                         the study if they were considered overweight or obese, i.e., Body
increase in microbial diversity in obese horses when compared                       Condition Score (BCS) ≥ 6/9 (21), had not received antibiotics
with a lean cohort (17, 18). Moreover, one study has shown                          or anti-inflammatory treatment in the last 3 months, and had
changes in the gut microbiota in horses with EMS; conversely,                       no clinical signs of disease, including clinical laminitis. Animals
this study showed a decrease in diversity (19).                                     were excluded from the study if they had any concurrent illness,
    The current advice for treatment of EMS is similar to                           had a history or evidence of pars pituitary intermedia dysfunction
that provided for humans, i.e., diet restriction and controlled                     (PPID), or clinical signs of laminitis, i.e., >Obel grade 1 (22).
exercise (10). There is evidence, indeed, that weight loss through                  The horses were maintained at UCD Research Farm under the
diet restriction and low-intensity exercise can improve insulin                     welfare guidelines outlined by UCD Animal Welfare Committee
sensitivity in obese horses when compared with controls (20).                       and with exemption from full ethical approval by the Animal
However, there is currently no reported data on the effects of                      Research Ethics Subcommittee (AREC-E-19-26-Mulcahy).
a recommended weight loss program, through diet restriction
and exercise, on fecal microbiota or cardiovascular parameters                      Pre-trial Period
in the horse.                                                                       The 12 horses recruited from the rescue charity were treated with
    We hypothesized that a weight loss program, through                             anthelmintic (Equest, Pramox 0.4 mg/kg PO, Zoetis Broomhill
restricted diet and exercise, could not only induce weight loss and                 Rd, Tallaght, Dublin, Ireland) and vaccinated against equine
improve cardiovascular function in overweight horses, but could                     influenza virus and tetanus (Equilis Prequenza TE, MSD Red Oak
also alter the intestinal microbiota to improve gastrointestinal                    North, South County Business Park Leopardstown, Dublin 18,
health. The objective of this study was to investigate effects                      Ireland) 2 weeks prior to their arrival on the farm, as per the UCD
of weight loss on morphological measurements, cardiovascular                        research farm regulations for any new horses entering the farm.

Frontiers in Veterinary Science | www.frontiersin.org                           2                                         June 2021 | Volume 8 | Article 668120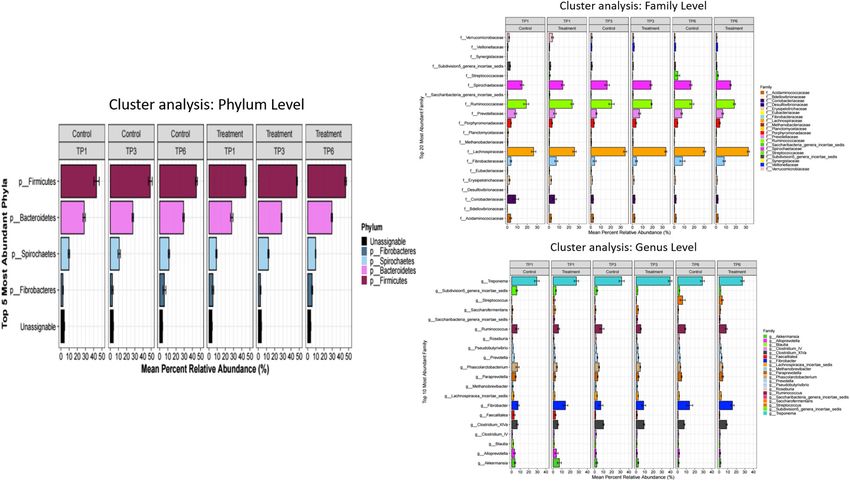
Walshe et al.                                                                                                                           Weight-Loss Effects on Obese Horses

TABLE 1 | Outline of study population of 14 horses including horse number, sex, breed, and age.

                                      Treatment                                                                                 Control

Number                       Sex                  Breed                   Age                  Number                   Sex                  Breed                  Age

5                             M                 Cob pony                    5                      1                     M                    Cob                    10
7                             M                 Cob pony                    7                      2                     M                 Cob pony                  4
8                             M                     SB                     15                      3                     M                    Pony                   17
9                             M                    Pony                     5                      4                     M                     SB                    5
11                            F                    Cob                     10                     13                     M                    Pony                   5
12                            F                 Cob pony                    4                      6                     F                 Cob pony                  5
14                            F                     SB                     15                     10                     F                 Cob pony                  4

The treatment group was subject to a weight loss program that involved diet restriction and exercise. The control group remained on a maintenance diet and exercise that mimicked
foraging. M, male; F, female; SB, Standard bred.

    For the week leading into the trial, the horses were housed on                         BWT; therefore, the diet was modified weekly in line with
site for acclimatization purposes. The horses were fed 2% of their                         weight fluctuations.
body weight (BWT) with fresh weight grass hay that was soaked                                 The daily DMI was divided into two feeds to be given
for 1 h prior to administration. They were also made accustomed                            morning and evening. The hay was placed in slow-feeder
to an automated horse walker, together with sand paddocks that                             hay nets (small gauged hay nets) and weighed individually
would be used for turn out purposes during the trial.                                      using hanging scales to calculate DM weight. The filled hay
                                                                                           nets were then soaked in individual containers, with weights
Clinical Monitoring                                                                        keeping the nets submerged, for an hour, and allowed to
On arrival, all horses underwent a full clinical examination                               drain for 30 min before feeding. To compensate for loss of
and lameness examination. Throughout the study, they were                                  nutrients associated with soaking the hay, a multivitamin,
monitored daily for food and water intake, fecal consistency,                              mineral, and amino-acid supplement (EquitonTM Troytown
urine output, demeanor, exercise tolerance, and any other                                  Grey-Abbey Pharmacy, Kildare, Ireland) was administered, as per
observations. They were visually assessed for abnormalities                                manufacturer’s instructions (2 ml/50 kg), in 300 g of high-fiber
and monitored while exercising on the horse walker for any                                 chaff mix (Hi-Fi lite, Dengie Crops Ltd, Essex, England) once
development of an injury. A trot up examination, which                                     daily and incorporated into the total calculated DMI.
included examination on the turn, was performed weekly to
ensure soundness throughout the study. For any horse showing                               Exercise
clinical abnormalities, exercise was stopped, and a full clinical                          Exercise was carried out on an automated horse walker under
examination was performed.                                                                 continuous supervision with alternating directions every second
                                                                                           day. The C group was exercised daily at walk to mimic foraging
Study Design                                                                               conditions ensuring that the total time in the walker matched
The horses were randomly assigned to control (C) and treatment                             that of the T group. The T group was enrolled in a 5-day weekly
(T) groups, blocked for age, gender, and breed. The herd                                   walk–trot exercise program, with two rest days. The T group
remained on site for 45 days incorporating the acclimatization                             was divided into two subgroups created to accommodate for the
and study periods. The horses were stabled in individual loose                             length of stride, i.e., horses under 148 cm (T-pony) and horses
boxes on sawdust bedding for the duration of the study. All                                over 148 cm (T-horse). Exercise intensity was determined by
horses were turned out in pairs for at least 25 min each day, in                           observation, and increases in the exercise program were made
small sand paddocks to avoid interference with dietary restriction                         in accordance with improved fitness levels and exercise tolerance
and enable natural social behavior.                                                        (Table 2). At every increase in exercise intensity, the horses’ heart
                                                                                           rates were taken pre-exercise, immediately post-exercise, and
Diet                                                                                       15 min post-exercise to ensure the exercise level was tolerated.
The C group were kept on a maintenance diet of 2% BWT, as                                  On their two rest days, the T group followed the C group
fresh weight hay, which was equivalent to 1.66% dry matter intake                          horse-walker program.
(DMI) of pre-soaked grass hay based on a DM of 83%. The T
group was restricted to 1.4% BWT as fresh weight grass hay, as                             Morphological Parameters
per guidelines outlined in the recent EMS consensus statement                              Physical measurements were assessed and recorded before the
(10), which is the equivalent of 1.17% DMI of pre-soaked                                   commencement of treatment and again at the end of the study,
grass hay.                                                                                 as appropriate, by a European Board of Veterinary Specialisation
   All horses were weighed weekly, and their DMI was adjusted                              (EBVS) equine internal medicine specialist who was blinded to
accordingly. The target weight loss for the T group was 1%                                 the group allocation. These included body weight (BWT), body
BWT per week, while the C group was to maintain initial                                    length (BL), height at the withers (HW), body condition score

Frontiers in Veterinary Science | www.frontiersin.org                                  3                                                June 2021 | Volume 8 | Article 668120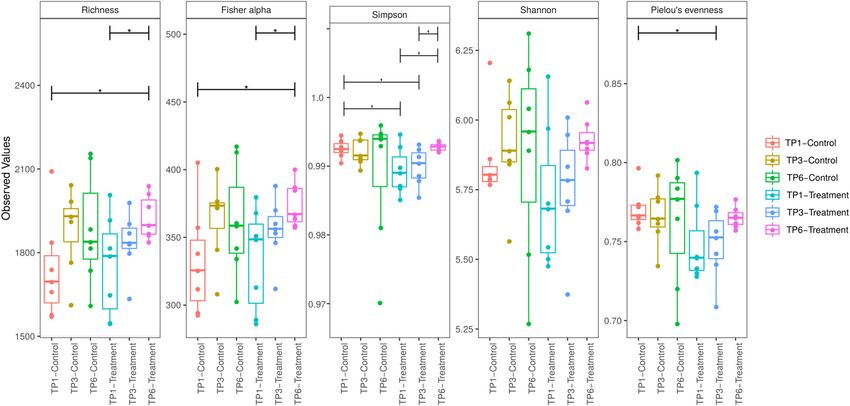
Walshe et al.                                                                                                                           Weight-Loss Effects on Obese Horses

TABLE 2 | Outline of the exercise regime of the treatment (T) group in minutes on                   From the right side of the horse, images for each area were
automated walker.                                                                                   obtained in triplicate and saved; SFT was then measured and
Treatment group            Week 1 Week 2 Week 3 Week 4 Week 5 Week 6                                calculated to the nearest 1 mm. The average of the measurement
                                                                                                    in three images per location was used for statistical analysis. All
Warm up                        5          5          5         5          5          5              measurements were taken before the commencement and after
Brisk walk                    15         15         15         15        15          15             the cessation of the weight loss program.
Trot                           0          5         15         15        15          15
Warm down                      5          5          5         5          5          5              Fecal Sample Collection
Total                         25         30         40         40        40          40             Fecal samples were collected as per recommendations for
Level of exercise determined by observation on walker. Exercise was increased from week             microbiota analysis outlined by (25) on the same day at the same
1 to 3. Exercise remained at week 3 level until week 6 in line with exercise tolerance of the       time each week. The time point of sampling was attributed in
T group. Bold represent total exercise time for each group.                                         accordance with week number of the study, i.e., week 1 was time
                                                                                                    point one (TP1), week 3 was timepoint 3 (TP3), and week 6 was
(BCS), cresty neck score (CNS), and measurements of the neck                                        time point six (TP6). Freshly voided feces that had been produced
(NC), girth (GC), and waist (WC) circumference. Measurements                                        after the horses’ morning feed were used. The fecal ball that was
were taken in triplicate, and the mean value was calculated.                                        least contaminated with bedding was selected and placed in a
   BWT was calculated using an electronic weighing system                                           sterile container, which was sealed, labeled, and immediately put
and was recorded weekly to allow for diet adjustment. BL                                            on ice.
was calculated from the point of the shoulder to the point
of the ischium using a soft tape with 1-cm increments. HW                                           Initial Processing of Fecal Samples
was calculated using a wooden horse measuring stick. BCS was                                        Initial processing of samples was carried out within 6 h of
calculated by visual assessment and palpation using a nine-point                                    collection. The fecal ball was removed from the container, and
scale, i.e., 1 (poor) to 9 (extremely fat) (21), and the CNS was                                    a 10-g sample was taken from the center of the ball (25)
calculated using a six-point scale, i.e., 0 (no visual appearance                                   for both metabolome and microbiota analysis and placed in
of a crest) to 5 (crest is so large, it permanently droops to one                                   a sterile container. These samples were numerically labeled so
side) (23). NC was calculated at the upper third, middle third,                                     as not to bias the analysis and were stored at −80 ◦ C until
and lower third of the neck, and an average of those three                                          further processing.
measurements was also recorded. GC was measured around the
thorax behind the withers, and WC was measured at the widest                                        Fecal Sample Preparation and 16S rRNA
point of the abdomen.                                                                               Gene Sequence Analysis
   Resting blood pressure (BP) was measured non-invasively                                          Fecal samples for microbiota analysis were processed as
using a portable veterinary blood pressure monitor (Cardell                                         described previously (26). Briefly, samples were homogenized
Veterinary Monitor 9401; Sharn Veterinary Inc., Florida, USA).                                      and processed using mechanical and chemical lysis. DNA was
SV 8 (9 cm) and SV 10 (12 cm) cuffs were used, as appropriate                                       extracted using the QIAamp R PowerFecal R Pro DNA Kit
for the size of the horse/pony to provide a snug fit with the hook                                  (QIAGEN R ). DNA concentration was normalized, and 16S
and loop sections fully engaged. The cuff was applied to the base                                   libraries were prepared using primers to amplify the V3–
of the tail in the standing horse or pony to approximate the                                        V4 region of the bacterial 16S rRNA gene, with Illumina
level of the right atrium. Mean blood pressure measurement was                                      adaptors incorporated as described in the Illumina 16S
repeated five times at each recording time, and the average value                                   Metagenomic Library Preparation guide. Following index PCR
was calculated. Clear outliers were discarded.                                                      and purification, the products were quantified using the
                                                                                                    Qubit high-sensitivity DNA kit (Life Technologies) and pooled
Ultrasound of Subcutaneous Fat                                                                      equimolarly. The pooled libraries were assessed using an Agilent
Subcutaneous fat thickness (SFT) measurements were made by a                                        high-sensitivity DNA kit and quantified by quantitative PCR
European College of Veterinary Diagnostic Imaging (ECVDI R )                                        (qPCR) using the Kapa Quantification kit for Illumina (Kapa
specialist who was blinded to the group allocation. If the horse’s                                  Biosystems, USA) according to the manufacturer’s guidelines.
demeanor allowed, consistent with handler safety, the area was                                      Libraries were then diluted and denatured following the Illumina
clipped, sprayed with 70% alcohol solution, and transmission gel                                    platform guidelines and sequenced (2 × 300 bp) on the Illumina
applied. When clipping was not possible, large amounts of the                                       MiSeq platform.
alcohol solution were used to obtain images of the diagnostic                                          The sequences obtained were filtered on the basis of quality
                                                                                                                                                   ′
value. The transcutaneous B-mode ultrasound examinations                                            (removal of low-quality nucleotides at the 3 end and removal
were performed using a GE Logiq e ultrasound machine (IVM                                           of window 10 nt with low average quality) and length [removal
imaging Ireland, Gormanston, Co. Meath), equipped with a                                            of sequences with 25. The filtered sequences were
withers, ribs at the 14th intercostal space (ICS), and the tailhead.                                matched at operational taxonomic unit 241 (OTU; with 97%

Frontiers in Veterinary Science | www.frontiersin.org                                           4                                       June 2021 | Volume 8 | Article 668120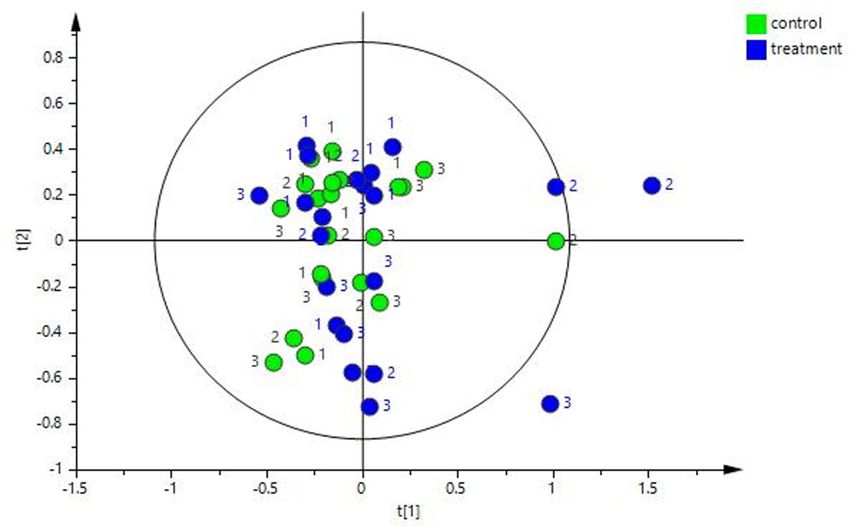
Walshe et al.                                                                                                 Weight-Loss Effects on Obese Horses

identity level) using the UPARSE-OTU algorithm with usearch               bacterial biomarkers associated with control and treatment
v7.0 program (29), and Chimeric sequences were removed with               groups. Statistical differences between multiple samples at the
ChimeraSlayer with the Gold database (https://gold.jgi.doe.gov)           phylum, family, and genera levels were determined by both
and UCHIME. The taxonomic assignment of these OTUs was                    Kruskal–Wallis and Mann–Whitney U-tests, adjusting for
matched to results in the Ribosomal Database Project (30) and             multiple testing (35) with the R statistical package (https://
were labeled unclassified if the bootstrap value was less than 80%.       www.r-project.org/). Statistical significance was established
Alpha and beta diversities were calculated using phyloseq and             at p < 0.05.
Vegan R packages (31). The R MixOmics package (32) was used
to carry out multiomic analysis, to enable the use of relevant
network options to visualize the relationship between the selected        RESULTS
variables and results of each group and time point.
                                                                          Study Population and Clinical Monitoring
                                                                          All 14 horses recruited to the study, completed the trial.
Fecal Metabolome Analysis                                                    Over the 6-week period, there were four horses, Horse 1 (C
Fecal water was extracted from fecal samples as previously
                                                                          group) and Horses 7, 11, 13 (T group), that presented with signs
described (33). To prepare the samples for NMR spectroscopy,
                                                                          of clinical disease. These individuals were treated by changes
60 µl of D2 O and 10 µl of sodium trimethylsilyl propionate-
                                                                          in environmental management, dietary management, or exercise
[2,2,3,3-2H4] (TSP) (0.05 g/ml) were added to 540 µl of fecal
                                                                          regime (see Table 3 for details). No chemical therapeutics were
water. The NMR spectra were acquired on a 600-MHz Varian
                                                                          used for any of the 14 horses at any stage.
NMR spectrometer by using a CPMG pulse sequence at 25◦ C.
The spectra were acquired with 16,384 data points and 128 scans.
Water suppression was achieved during the relaxation delay of             Diet
3 s. All 1 H NMR spectra were referenced to TSP at 0.0 parts              DMI was adjusted weekly in both groups. This ensured that there
per million (ppm) and processed manually with the Chenomx                 was no change in BWT of the control group and that the target
NMR Suite (version 7.5) by using a line broadening of 0.2 Hz,             of 1% BWT loss was obtained weekly in the treatment group.
followed by phase correction and baseline correction. The spectra         Therefore, the range of restriction on DMI in the treatment group
were integrated into regions in domains of 0.001 ppm excluding            ranged from 1.3 to 2% BWT DMI in accordance with weight loss
both TSP and water regions. Data were normalized to the sum of            or gain. Hay from a second source was introduced incrementally
the spectral integral. Metabolites were identified using Chenomx          into the diet starting on day 18 with the inclusion of 10% of the
NMR Suite (version 7.5) and the HMDB database.                            “new” hay in the total DMI, increased by 10% increments every 2
                                                                          days so as to reduce the risk of intestinal upset.
Statistical Methods
The SPSS statistical software was used to estimate normality              Exercise
using the Shapiro–Wilk test. Two-tailed Student T-tests were              In the treatment group, five of the seven horses participated in the
used to compare changes in physical parameters that were                  prescriptive exercise program. As mentioned above, two horses
normally distributed. The Mann–Whitney U test was used for                sustained injuries and, thus, had modified exercise regimes.
non-parametric data, i.e., BCS and CNS.                                   Horse 11 joined the control exercise program. Horse 12 was
    Metabolome data analysis was performed using both SIMCA               enrolled in a rehabilitation program that began as 10 min walking
(multivariate) and MetaboAnalyst (https://www.metaboanalyst.              in hand twice daily on day 15 with a gradual increase in time to
ca/) (univariate). PCA analysis was performed using SIMCA,                include trotting for 10 min twice daily by day 25 (Table 3).
and the data were par scaled before analysis. Two-way repeated
measures ANOVA was performed using MetaboAnalyst, and the
data were corrected for multiple comparisons using the false              Morphological Parameters
discovery rate (FDR) procedure in MetaboAnalyst.                          There was a significant loss of BWT in the treatment group
    Microbiota analysis was performed using downstream                    (p < 0.00001) compared with the control group (Table 4). The
analyses, and graphical outputs of the 16S rRNA results                   treatment group lost, on average, 1% BWT a week, with an
were generated with various packages in R (31). For beta-                 average of 4% BWT lost over the duration of the study. There
diversity analysis, the dissimilarity matrix between samples              was also a significant decrease in the WC in the treatment
was calculated with the Bray–Curtis method transforming the               group (p < 0.0001) compared with the control group, with an
data into a logarithmic scale, studying the effects on microbiota         average decrease in circumference of 3% (Table 3). Resting blood
composition. The variability between samples by permutational             pressure was significantly lower in all horses and ponies at the
multivariate analysis of variance was calculated using distance           end of the study, compared with the start (p = 0.0007) with no
matrices from the R Vegan package (34). For alpha-diversity               significant difference between the treatment and control groups.
values, assumption of normality was checked using the Shapiro–
Wilk test. Potential differences in alpha-diversity included in the       Ultrasound of Subcutaneous Fat
study were thereafter estimated by repeated measures analysis             There were no significant differences found between week 1 and
of variance (ANOVA) and t-tests. Linear discriminant analysis             6 in subcutaneous fat measurements at any location in either
effect size (LEfSe) was performed in order to discover specific           treatment or control group (Supplementary Table 1).

Frontiers in Veterinary Science | www.frontiersin.org                 5                                       June 2021 | Volume 8 | Article 668120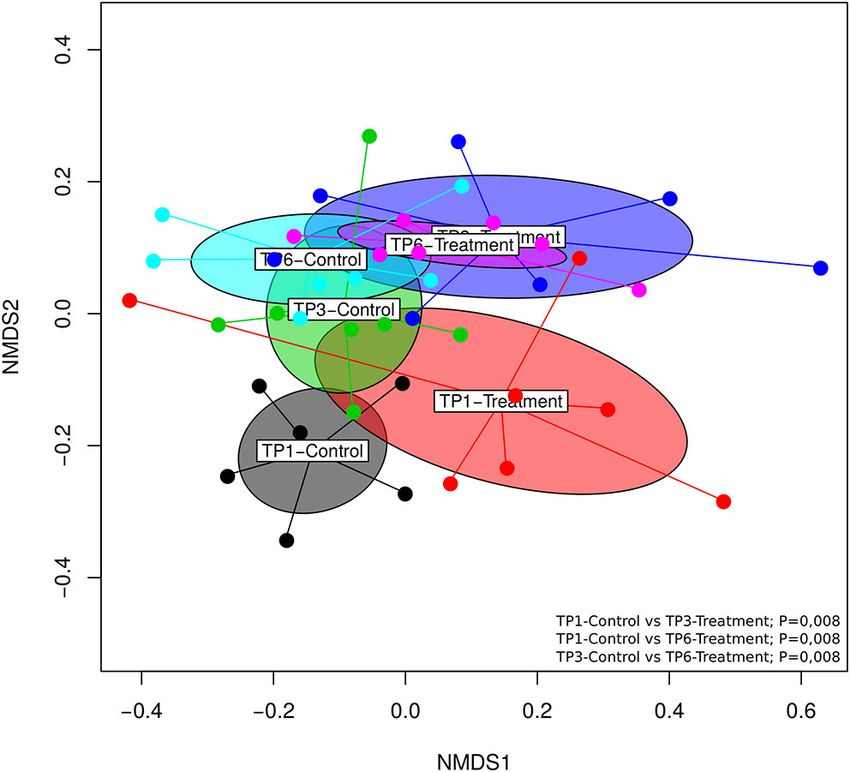
Walshe et al.                                                                                                                            Weight-Loss Effects on Obese Horses

TABLE 3 | A summary of the horses who presented with signs of clinical disease during the 6-week trial period.

Number          Group                     Week        Presentation                                                  Treatment

1               Control                       1       Increased respiratory effort at rest                          Moved to outdoor stable
7               Treatment                     2       Acute moderate weight loss, lethargy, and transient soft      Increased feed intake to 2% BWT DMI
                                                      but formed fecal consistency
11              Treatment                     1       2/5 grade (AAEP) lameness right fore associated with poor Decreased level of exercise to control group level
                                                      foot balance
12              Treatment                     3       3/5 grade (AAEP) lameness right fore with tissue swelling     Rehabilitation program combined with daily local
                                                      and heat associated with the medial mid cannon area           hydrotherapy

The table outlines the horse affected, the presenting complaint, and the treatment.

TABLE 4 | A summary of the significant morphological parameter findings between week 1 and week 6 of the study.

Horse                                   BWT                                                   WC                                                  BP

                      Start             End           Loss/gain            Start              End       Loss/gain             Start                  End             Loss/gain
                       kg                kg                %                cm                cm            %                mmHg                  mmHg                  %

Control
1                      640              635             −0.8%             226.33             226.67       0.15%                92.2                  86.4             −6.29%
2                      378              382              1.1%             182.67             186.33        0.02                111                     82            −26.13%
3                      320              320              0.0%             189.67             196.00       3.34%               112.6                  86.4            −23.27%
4                      496              499              0.6%             198.00             205.33       3.70%                NT                      NT                NT
6                      568              576              1.4%             215.33             222.00       3.10%                99.4                  87.8            −11.76%
10                     408              408              0.0%             194.00             197.00       1.55%               108.4                  85.2            −21.04%
13                     372              373              0.3%             189.33             192.67       1.76%                91.2                    91             −0.22%
Treatment
5                      453              430             −5.1%             187.67             183.67      −2.13%               116.4                  90.6            −22.16%
7                      358              338             −5.6%             192.67             185.00      −3.98%               116.8                  56.2             51.88%
8                      528              511             −3.2%             209.67             209.33      −0.16%               107.4                    75            −30.17%
9                      260              249             −4.2%             171.33             165.33      −3.50%                92.2                  85.8             −6.94%
11                     656              633             −3.5%             228.00             225.00      −1.32%                130                   117             −10.31%
12                     484              470             −2.9%             209.00             202.33      −3.19%               109.2                  91.6            −16.12%
14                     608              586             −3.6%             237.67             226.00      −4.91%                82.8                  67.2             18.84%

The treatment group was subject to a weight loss program that involved diet restriction and exercise. The control group remained on a maintenance diet and light exercise to mimic
natural foraging. BWT, body weight; WC, waist circumference; BP, blood pressure; NT, not taken.

Fecal Sample Collection                                                                        was apparent. Similarly, evenness was significantly increased
Fecal samples were collected in weeks 1, 3, and 6 at the same time                             (Simpson). There were no differences in the alpha diversity of the
on the same day (Wednesday between 8 a.m. and 10:30 a.m.),                                     C group between time points (Figure 2).
with the exception of one sample from horse 9 in week 1, which                                     Significant differences (p = 0.001) in beta diversity (NMDS,
was collected at 4 p.m. on Wednesday afternoon in week 1.                                      Bray–Curtis) were evident (Figure 3). Pairwise comparison
                                                                                               of NMDS distances revealed significant differences between
Fecal Microbiota Analysis                                                                      TP1-Control vs. TP3-Treatment (p < 0.008), TP1-Control
The analysis of the fecal microbiota showed general similarities                               vs. TP6-Treatment (p < 0.008), and TP3-Control vs. TP6-
at the phylum, family and genus level between the treatment and                                Treatment (p < 0.008) (Figure 3). Also, there was evidence of
control groups across all time points (Figure 1). Alpha diversity                              clustering according to individual animal in the treatment group
showed no significant differences between the T and C groups                                   (Supplementary Figure 1).
when compared with each other at the specific three sampling                                       Assessment with linear discrimination analysis (LDA)
time points.                                                                                   effect size >3 and LefSe (Wilcoxon test) showed statistically
    However, when comparing diversity within groups over time,                                 significant differences when respective groups at specific time
a significant increase in alpha diversity, Fisher Alpha index, and                             points were directly compared. More specifically, there was a
Richness index, between TP1 and TP6 in the T group (Figure 2)                                  significant reduction in the relative abundances of the families
was identified, while a trend toward increased Shannon diversity                               Eubacteriaceae (p < 0.05) and Pseudomonadaceae (p < 0.05),

Frontiers in Veterinary Science | www.frontiersin.org                                    6                                               June 2021 | Volume 8 | Article 668120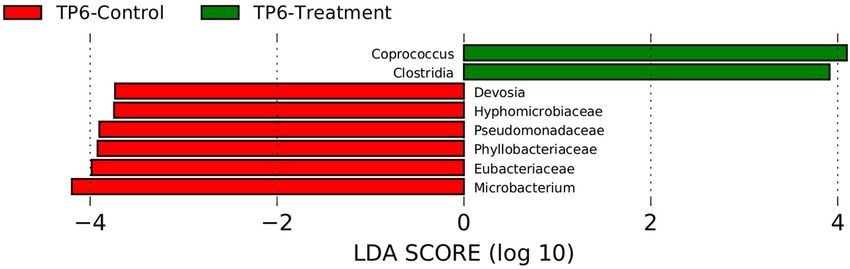
Walshe et al.                                                                                                                     Weight-Loss Effects on Obese Horses

 FIGURE 1 | The mean percentage relative abundance of the major phyla (A), families (B), and genera (C) in the control and treatment groups over three timepoints.
 The treatment group (n = 7) was subject to a weight loss program that involved diet restriction and exercise. The control group (n = 7) remained on a maintenance
 diet and light exercise to mimic natural foraging. TP, time point; TP1, week 1; TP3, week 3; TP6, week 6.

 FIGURE 2 | Alpha diversity was measured by five indices of diversity: Richness, Fisher Alpha, Simpson, Shannon, and Pielou Evenness. The treatment group (n = 7)
 was subject to a weight loss program that involved diet restriction and exercise. The control group (n = 7) remained on a maintenance diet and light exercise to mimic
 natural foraging. The group and timepoint are color coded. The T group showed a significant increase in diversity between timepoint 1 and timepoint 6 as measure by
 Richness, Fisher alpha, and Simpson indices. TP, timepoint; TP1, week 1; TP3, week 3; TP6, week 6. *p < 0.05.

Frontiers in Veterinary Science | www.frontiersin.org                              7                                              June 2021 | Volume 8 | Article 668120
Walshe et al. Weight-Loss Effects on Obese Horses
Multiomic Analysis
The relationship between microbiota and metabolites in the feces,
in the control and treatment groups over the three different
time points, was visualized through Pearson network images
of correlation. The total NMR profile and OTU readings for
each sample was used in this analysis, to identify any significant
correlations between fecal microbiota and metabolites in both
groups at each time point. A correlation analysis cutoff was used
(r = 0.8), with the color of the lines between the nodes in each
case indicating the strength and direction (positive/negative) of
the correlation.
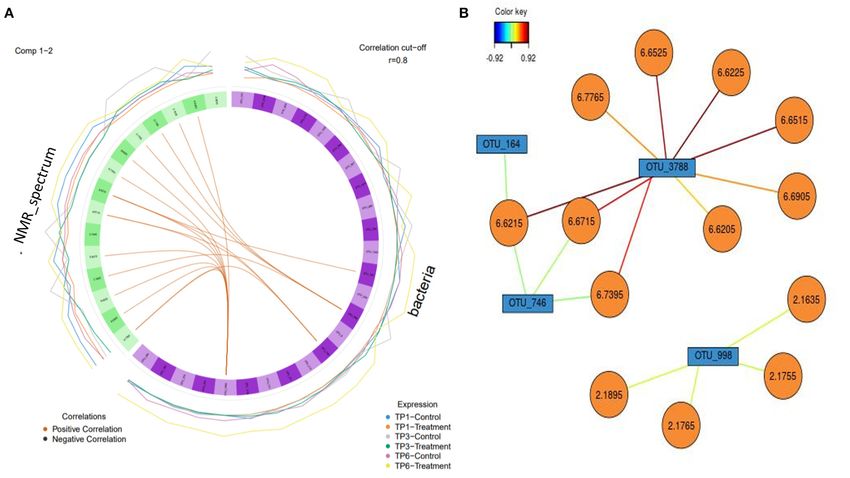
A circos plot with a correlation cutoff of r = 0.8 (Figure 7)
shows that OTU 3778 (p__Bacteroidetes; c__Bacteroidia;
o__Bacteroidales; f__Rikenellaceae) is strongly associated
with the NMR peaks corresponding to urocanic acid
(6.6225, 6.6215, 6.6525, and 6.6515 ppm), with additional
peaks of 6.7765, 6.6205, and 6.6905 (unidentifiable
metabolites) associated with the same OTU (3,788). This
analysis also shows propionate (2.1635, 2.1895, 2.1765, and
2.1755 ppm) is associated with OTU 998 (p__Firmicutes;
FIGURE 3 | The beta diversity illustrated using an NMDS graph; the treatment
c__Clostridia; o__Clostridiales; f__Ruminococcaceae). OTU
and control groups are shown at each timepoint and are color coded. The 164 (Firmicutes; c__Negativicutes; o__Selenomonadales;
treatment group (n = 7) was subject to a weight loss program that involved f__Acidaminococcaceae; g__Phascolarctobacterium) and
diet restriction and exercise. The control group (n = 7) remained on a OTU 748 (p__Firmicutes; c__Clostridia; o__Clostridiales;
maintenance diet and light exercise to mimic natural foraging. The significant
f__Ruminococcaceae) weakly correlated with urocanic acid.
differences found included: TP1-control vs. TP3-treatment (p < 0.008),
TP1-control vs. TP6-treatment (p < 0.008), and TP3-control vs. TP6-treatment
The significant correlations between OTU 3778 and associated
(p < 0.008). TP, time point; TP1, week 1; TP3, week 3; TP6, week 6. metabolites were only found in the T group at TP 3. The
correlation between the other three OTUs (OTU 998, OTU 164,
and OTU 748) was found at all timepoints in both groups;
however, the association was more evident in the T group.
as well as an increase in the genus Coprococcus and the class
Clostridia in the T group compared with the C group at DISCUSSION
timepoint 6 (Figure 4).
Obesity is endemic in human populations in the developed world,
and this has spread into our domesticated animal population
with reports of over 50% of the pet population being overweight
Fecal Metabolome Analysis or obese (4, 5, 36). The concept of obesity goes back to ancient
The NMR metabolomics data was successfully acquired from all times (37), yet scientists are still grappling to instigate successful
fecal samples at each sampling timepoint. A representative NMR interventions that can effectively combat the rising tide of obesity
spectrum is displayed in Supplementary Figure 2. and associated diseases. This has prompted investigations into
The multivariate analysis revealed that there was no major the merits of manipulating the intestinal microbiota in order to
impact on the overall fecal metabolomic profile that could be ameliorate obesity-associated gut dysbiosis. In line with this, this
attributed to treatment, i.e., the exercise and diet program (see study investigated the effects of a weight loss program through
Figure 5, R2 0.89). However, there was a significant change in exercise and diet restriction in horses on the associated intestinal
fecal metabolome composition over time (i.e., from T1 to T6) gut microbiota and cardiovascular parameters. This program was
in both the control and treatment group but no significant successful in reducing weight and waist circumference, and there
differences between the groups at any timepoint. was an associated increase in microbial diversity between the
Univariate data revealed changes in the metabolome profile start and end of the study period in the treatment group. Both
over the study period irrespective of group, and a wo-way treatment and control groups had lowered blood pressure at the
ANOVA analysis revealed that there were specific metabolites end of the study, likely as a result of environmental adaptation
(dimethylsulfone and methylamine) with a significant factor and frequent handling, and there were adverse effects on the
effect (control/treatment) (Table 5). There was a decrease in the gastrointestinal system in either group.
levels of dimethysulfone and methylamine metabolites, and there
was an increase in unknown metabolites (2.4135, 2.7755, 2.7765) Weight Loss
in both groups from TP1 to TP6. This is demonstrated in the Dietary restriction and controlled exercise are the foundations of
heatmap analysis of the significant features in each group over treatment of obesity in both humans and horses. In this study,
the study period (Figure 6). significant weight loss was achieved in a group of overweight
Frontiers in Veterinary Science | www.frontiersin.org 8 June 2021 | Volume 8 | Article 668120Walshe et al. Weight-Loss Effects on Obese Horses FIGURE 4 | Linear discriminant analysis effect size (LEfSe) was performed in order to discover specific bacterial biomarkers associated with control and treatment groups. The treatment group (n = 7) was subject to a weight loss program that involved diet restriction and exercise. The control group (n = 7) remained on a maintenance diet and light exercise to mimic natural foraging. In this graph, statistically significant differences of samples between the T and C groups at timepoint 6 are shown. Significance (p < 0.05). TP6, timepoint 6. FIGURE 5 | PCA plot of the fecal water NMR data color coded according to group (treatment and control). The treatment group (n = 7) was subject to a weight loss program that involved diet restriction and exercise. The control group (n = 7) remained on a maintenance diet and light exercise to mimic natural foraging. No significance difference on the global metabolic profile was found between groups. horses. This is in line with similar studies that implemented Morphological Parameters/US both diet and exercise as part of a weight loss program (20, 38– Although significant weight loss and decreased WC were 40). This study also recorded a significant decrease in WC, recorded in the treatment group, these changes were not reflected similar to that previously observed in a diet restriction program in the remaining morphological parameters measured including in horses with EMS (41). In several previous studies, exercise BCS or the subcutaneous fat ultrasound measurements. This or exercise combined with diet restriction was associated with is consistent with another study of 12 overweight/obese horses increased insulin sensitivity (38, 39, 41–43). Insulin dysregulation that were submitted to exercise-induced weight loss but had no has been shown to affect the gut microbiota of ponies (17) and change in subcutaneous fat measurements (44) and supported horses suffering from EMS (19). Although there were varying by the long periods taken to change subcutaneous fat levels and few significant differences between the fecal microbiota significantly as measured by ultrasound analysis (24, 45). A in the weight loss and control groups in this study, further previous diet restriction study in horses with EMS did show a investigation of these changes along with the dynamic link similar reduction in WC to that observed in the current study, between insulin regulation and the gut microbial environment with a corresponding decrease in BCS (41). This could be due to would be of value. a decrease in internal abdominal fat or perhaps a toning of the Frontiers in Veterinary Science | www.frontiersin.org 9 June 2021 | Volume 8 | Article 668120
Walshe et al.                                                                                                                                      Weight-Loss Effects on Obese Horses

TABLE 5 | A two-way ANOVA analysis of metabolites taking into account the sample timepoint (Time) and the effect of the group (Factor), i.e., control vs. treatment group.

                 NNMR data                              Time(raw.p)                 Time(adj.p)                Factor(raw.p)               Factor(adj.p)          Interaction(raw.p)

3.1405                Dimethylsulfone                     0.006449                    0.41649                    2.39E−07                        0.000835               0.30133
3.1415                Dimethylsulfone                     0.008492                    0.41649                    9.72E−07                        0.001501               0.39066
3.1395                Dimethylsulfone                     0.010088                    0.41649                    1.29E−06                        0.001501               0.42122
3.1425                Dimethylsulfone                     0.011623                    0.41649                    8.11E−06                        0.006362               0.54783
3.1435                Dimethylsulfone                     0.019075                    0.41649                    6.61E−05                        0.017793               0.69828
3.1385                Dimethylsulfone                     0.048665                    0.41649                    4.58E−05                        0.014563               0.54441
2.7765                Unknown                              0.05342                    0.41649                     0.000239                       0.049286               0.44754
2.7755                Unknown                             0.058283                    0.41649                     0.000185                       0.04324                0.49582
2.4135                Unknown                              0.16904                    0.41649                     0.00022                        0.048163               0.37797
2.5945                Methylamine                          0.36387                    0.52756                    1.70E−05                        0.008492               0.57962
2.5955                Methylamine                          0.39142                    0.54966                    2.39E−05                        0.009409               0.64331
2.5935                Methylamine                          0.47239                    0.61876                    1.09E−05                        0.006362               0.64923
2.5965                Methylamine                          0.51512                    0.65026                    3.00E−05                        0.010497               0.74757
2.5905                Methylamine                          0.64991                    0.74924                     0.000141                       0.035276               0.75996
2.5975                Methylamine                          0.72159                     0.7947                    5.70E−05                        0.016639               0.78131
2.5925                Methylamine                          0.73149                    0.79781                    9.65E−06                        0.006362               0.8052
2.5915                Methylamine                          0.90805                    0.92766                    2.42E−05                        0.009409               0.83179

Note. Metabolites that had a significant factor effect (control/treatment) are listed. No difference was attributed to Group at any timepoint.

  FIGURE 6 | Heatmap analysis of the treatment and control groups at three timepoints during the study. The treatment group (n = 7) was subject to a weight loss
  program that involved diet restriction and exercise. The control group (n = 7) remained on a maintenance diet and light exercise to mimic natural foraging. The analysis
  of the significant features shows the changes in treatment group/control group across the all the timepoints, with no significance seen between groups at any
  timepoint. Time 1, 2, and 3: TP1, week 1; TP3, week 3; TP6, week 6; Factor 1, control; Factor 2, treatment; Y axis, metabolites; X-axis, horse and sample number.

Frontiers in Veterinary Science | www.frontiersin.org                                       10                                                     June 2021 | Volume 8 | Article 668120
Walshe et al. Weight-Loss Effects on Obese Horses
FIGURE 7 | (A) A circos plot of the Spearman correlation between “bacteria,” i.e., operational taxonomic units (OTUs) (in purple) and “NMR spectrum,” i.e., metabolites
(in green). Each individual feature is labeled within the block. The outer lines indicate the expression level of each variable according to group over each timepoint, e.g.,
blue is the control group over timepoint 1. The correlation is colored coded to show positive and negative as orange and black, respectively (r = 0.8). The treatment
group (n = 7) was subject to a weight loss program that involved diet restriction and exercise. The control group (n = 7) remained on a maintenance diet and light
exercise to mimic natural foraging. TP1, week 1; TP3, week 3; TP6, week 6. (B) Relevance network with each color representing a significant variable that was
highlighted in the circos plot and the associated correlation (r = 0.8) with the strength of correlation color coded. OTUs are in blue, and the metabolites are in orange.
abdominal muscles due to increased levels of exercise. A decrease restrictions using 1% of BWT in DMI can be used successfully
in BCS associated with weight loss has also been seen in a number without any detrimental effects to the horses’ welfare (49), and
of studies (20, 42, 43, 46), with a decrease in NC associated with in some weight-loss resistant animals, this level of restriction is
exercise and the corresponding insulin sensitivity in one of those necessary (50). In this study, we found individual variation of
(43). Therefore, it appears that BWT loss, WC, and BCS remain weight loss or gain, which needed to be monitored strictly to
the most reliable reflections of weight loss in the horse and that achieve the recommended loss of 1% BWT per week (treatment
changes in other parameters may require a program of longer group) (10) or to keep the horses at their presented weight
duration or a more restricted diet. (control group). Therefore, regardless of level of restriction,
consistent monitoring of weight to allow for dietary adjustment
Cardiovascular should be a key part of any weight loss program, as some horses
It has been shown in both human (47) and equine studies may be more weight loss resistant than others (50).
(15) that improved body composition was associated with
improved cardiovascular function, and it has been proposed Fecal Multiomic Analysis
that cardiovascular disease could be prevented by exercise- Due to the complexity of bacterial and host interactions, this
induced changes to the intestinal microbiota (48). In this study, study used a multiomic approach broadening the investigation
improvements in the cardiovascular parameter of resting blood to incorporate not only the structure of the microbial
pressure was seen in both treatment and control groups; however, community but also the metabolic functions. This study
we speculate this was due to a controlled level of exercise for all analyzed the microbiota and metabolites found in the feces of
groups regardless of intensity. Habituation to frequent handling overweight, sedentary horses undergoing a strict weight loss
may also have influenced resting blood pressure. program compared with a control cohort maintained at their
presenting weight.
Diet Restriction There are a few studies investigating the effect of obese
Although the recommendations for dietary restriction in phenotype on the intestinal environment in horses, often using
overweight horses is 1.4% BWT (10), it has been shown that one sample point and a heterogenous population (18, 51), or
Frontiers in Veterinary Science | www.frontiersin.org 11 June 2021 | Volume 8 | Article 668120Walshe et al. Weight-Loss Effects on Obese Horses
sampling only at the start and end points of a homogenous bacterial communities in the treatment and control groups as
population, diet controlled, uniform location studies (17, 52). As revealed by 16S rRNA sequencing. There have been a number
described, this is a longitudinal study with three sample points of studies investigating the effect of diet (73–75) and the effects
during the weight loss phase allowing for analysis of changes over of dietary restriction on gut microbiota in equids (52, 53). The
time as recommended by Dougal (53). core microbiota of horses has been shown to be relatively stable
The composition of the major phyla found in equine feces with 65% of the microbial community retained when horses
in this study is consistent with other studies, dominated by were on a restricted fiber-based diet (53). Similarly, humans have
Firmicutes, Bacteroidetes, and then the less dominant phyla of a recognizable core microbiome (76) that also remains quite
Spirochaetes and Fibrobacteres (54–57). At each sample point, stable over time (58). In this study, similar to other longitudinal
Firmicutes was the predominant phylum over Bacteroidetes studies (53, 77), the PCA graph clustering shows similarities
in these overweight horses. A decrease in Bacteroidetes was in individual horse samples over the three time points in the
associated with obesity in humans (58); however, this finding T group, which highlights the need for longitudinal studies,
was contradicted in a later study with a larger study group size whereby the participants can act as their own controls.
(59) and Firmicutes: Bacteroidetes ratio is no longer regarded as In humans, high-level microbial diversity in the gut is
a reliable metric. In horses, a predominance of Firmicutes was frequently regarded as desirable, and it has been proposed
found in obese horses using one sampling point (n = 37) (18), that obese and overweight phenotypes are associated with
but the opposite was found in a study of obese Welsh mountain decreased intestinal diversity (78). However, a recent systematic
ponies (52) indicating that reports of the importance of phylum- review could not find enough consistent results to corroborate
level changes with respect to obesity should also be interpreted these findings (16). Similarly, dietary restriction in humans has
with extreme caution in the equine setting. provided variable results with respect to the fecal microbiota. In
The taxonomic composition at the family and genus levels a study of 49 obese/overweight individuals, dietary restriction
were broadly the same across the most abundant bacteria resulted in improved gene richness and clinical phenotype (79),
(Figure 1). However, the LEFSE analysis of the C- and T-groups while a low calorie diet induced no change in the phylogenetic
at TP6 did show significant differences. Notably, there was an make up or alpha diversity of the fecal microbiota (80). In horses,
increase in the class Clostridia and the genus Coprococcus in an increase in diversity related to obesity has been documented
the T group at the end of the weight loss program. The class (18, 52) with a decrease in diversity associated with weight loss as
Clostridia has been shown to be altered in obesity in many rodent result of a more stringent (1% BW in DMI) restricted diet (52).
data sets, with increased abundance more commonly associated In this study, the treatment group showed a significant increase
with obese state (60). However, within such a broad-ranging in alpha diversity over time, while no change was seen in the
class, orders such as Clostridiales have been associated with control group. Therefore, it would be reasonable to propose that,
intestinal health particularly in relation to exercise (61, 62), and in the treatment group, exercise may have improved the overall
a decreased abundance has been associated with colitis (63) and intestinal health of the horses, while also contributing to both
colic (64) in horses. Also, families such as Ruminococcaceae and weight loss and reduced waist circumference.
Lachnospiraceae have been associated with normal horses when The benefits of physical exercise are well-documented and
compared with horses with EMS (19). Coprococcus abundance have been proven in humans (81). There is growing evidence
has previously been negatively correlated with body mass index that this benefit may be associated with modulation of the
and body fat percentage (65) and to be decreased in obese adults microbiome, with exercise modifying the microbiota in diabetic
(66), patterns that are consistent with our findings. However, mice (82) as well as obese rats (62) and even attenuating intestinal
this genus has also been found to be highly enriched in young dysbiosis in mice (61). Similarly, in humans, exercise is citied
obese individuals (67) and associated with obesity and metabolic as a possible therapy for gut dysbiosis-associated disease (83).
syndrome in women (68). However, the effects of exercise are inconsistent. In a study of
It was notable that there was an increased relative abundance 90 overweight/obese individuals in Ireland, a moderate intensity
of the families Eubacteriaceae and Pseudomondaceae in the C exercise program had minimal effect on the composition or
group. Eubacteriaceae has been associated with obesity in obese function of the fecal microbiota (47). However, a study of
adults (69) and youths (67); however, increases in Eubacteriaceae sedentary overweight women saw effects in half the treatment
have also been associated with exercise and a cellulose fiber group (84). In a study comparing lean to obese adults, the effect
diet in mice (70), which could have contributed to its increase of exercise was transient and reversible (85). To date, there is
in the C group. Pseudomondaceae was found to be associated limited evidence on the effects of exercise on the equine intestinal
with obesity and insulin resistance (IR) in humans (71), and microbiota, with this being the first study done on sedentary
members of this family have been speculated to have possible overweight horses. However, exercise have been associated with
opportunistic pathobiont capacity to induce the inflammatory improvement in insulin sensitivity in overweight horses (20, 43),
pathways associated with IR. and perhaps, the increase in diversity of our exercised horses
It is recognized that diet is a driving factor of microbial could be related to improve insulin dynamics. This study did
community composition in the animal kingdom (72). Therefore, not measure insulin-related parameters, and so, further studies
one of the big advantages of equine studies is that tight regulation would be required to investigate whether this is the case.
and uniform nature of diet can be achieved. In our study, this is The metabolome analysis allows investigation of the
reflected in the generalized similarities in the taxonomy of the functional changes associated with bacterial community and
Frontiers in Veterinary Science | www.frontiersin.org 12 June 2021 | Volume 8 | Article 668120Walshe et al. Weight-Loss Effects on Obese Horses
the potential changes that a weight loss program may have not in the treatment group were unable to participate fully in the
only on the microbiota composition but also the associated prescribed exercise program, which may have affected the results.
metabolome. Although we did not observe a significant Further investigation into cardiovascular parameters through
difference between the treatment and the control groups, both echocardiology as done by Heliczer (15) would have been
groups showed significant changes in metabolomic profile preferable. However, the animals’ excess weight made adequate
between the start and end of study period. This is most likely visualization of the heart impossible. Although the time period
attributable to adjustment to the fiber-based diet over time. of this study was short, it was similar to other weight loss
To get a more nuanced view of microbe–metabolite–host investigations (41, 43, 53) and enabled the target weight loss to be
interactions, this study used network analysis of correlations achieved. The fecal microbiota has been shown to reflect the large
between the metabolites and OTUs found. The family intestinal microbiota, but, of course, does not represent changes
Rikenellaceae was associated with urocanic acid at TP 3 in directly (54). However, fecal sampling is readily accessible and
the T group. There were three other OTUs, which the analysis non-invasive and, thus, is a valuable tool in investigations of
showed as linked to specific metabolites found, the most disorders of the equine gut and particularly the large intestine.
interesting being the family Ruminococcaceae, which was As this study was not carried out under experimental license, we
correlated to propionate. did not take invasive samples to measure the effects of diet and
Rikenellaceae is a saccharolytic bacteria that can ferment exercise on changes in insulin dynamics and adipokine levels.
glucose to acid byproducts. In mouse studies, it has been shown
to increase in obesity inducing high-fat diets and would be Future Directions
considered an obesity-related bacteria (70). Such high-fat diets As we reach for novel treatments to combat the ongoing upsurge
have been shown to be associated with gut microbiota changes, of equine obesity, the manipulation of the intestinal microbiota
increased adiposity, and metabolic syndrome accompanied is potentially a key target for future therapeutics. Therefore,
by metabolic endotoxemia (86). Urocanic acid (UCA), a we suggest longitudinal studies evaluating larger sample groups
breakdown product of histidine, has been associated with investigating the systemic effects of a weight loss program
immunomodulatory properties. Most notably, UCA has been using a multiomic approach in tandem with investigation of
shown to attenuate experimentally induced inflammatory bowel insulin dynamics and adipokine levels. This approach could
disease in mice and in ex vivo studies (87, 88). offer insights into the interaction between ongoing weight loss,
Although Ruminococcaceae is highly specialized in the increased insulin sensitivity, and the intestinal microbiome.
degradation and fermentation of cellulose in short-chain fatty Potentially, highlighting fecal biomarkers associated with weight
acids (SCFAs), they are more commonly associated with loss resistance and insulin resistance could enable therapeutic
butyrate production (89) rather than propionate as seen here. modulation of the equine intestinal microbiota as has been shown
Ruminococcaceae has previously been reported to be present at to be effective in humans, such as diet supplementation (94) and
increased abundance in obese horses (18) and notably have also fecal microbial transplant (95).
been associated with a high-fat diet (HFD) in obese mice (90).
Conversely, an abundance of Ruminococcaceae was associated
with healthy controls when compared with horses with EMS Conclusions
(19). Propionate is an essential SCFA produced in the hindgut In this study, it was shown that a controlled weight loss program
that provides up to 60% of the blood glucose in horses (91). using diet restriction and exercise can be successful and may
Propionate has been shown, along with other SCFAs, to stimulate contribute to an improvement in the intestinal health of the
intestinal hormones, inhibit food intake, and protect against horses. The insights gained will be useful in designing further
diet-induced obesity and insulin resistance (92) and has been studies aimed at prevention and treatment of obesity and obese-
proposed as a tool to be used in a novel approach to treating associated disease in horses. With the overarching aim of the
obesity (93). research to unravel the connections of a range of chronic
In summary, the change in diversity of the samples in the T inflammatory conditions linked to gut health in the horse, and,
group between the start and end of the successful weight loss in line with the One Health paradigm, across species.
program is indicative of the effect of treatment on the fecal
microbiota composition of horses. Moreover, the increased alpha
diversity over time is linked with increase abundance of genus
DATA AVAILABILITY STATEMENT
Coprococcus and class Clostridia, which are potential signposts of The data presented in the study are deposited in the ENA
improved intestinal health. repository, accession number ERP127102.
Limitations
In this study group, there was a mix of gender, breed, size, ETHICS STATEMENT
and place of origin, and although there was an acclimatization
period, all of these factors can affect the fecal microbiota. The The animal study was reviewed and approved by UCD
sample size was small, and further larger studies would be Animal Research Ethics Subcommittee AREC-E-19-26-Mulcahy.
required to confirm the microbiota and metabolome findings. Written informed consent was obtained from the owners for the
Although target weights were achieved, two of the seven horses participation of their animals in this study.
Frontiers in Veterinary Science | www.frontiersin.org 13 June 2021 | Volume 8 | Article 668120You can also read