Observation and modeling of the historic "Godzilla" African dust intrusion into the Caribbean Basin and the southern US in June 2020
←
→
Page content transcription
If your browser does not render page correctly, please read the page content below
Atmos. Chem. Phys., 21, 12359–12383, 2021
https://doi.org/10.5194/acp-21-12359-2021
© Author(s) 2021. This work is distributed under
the Creative Commons Attribution 4.0 License.

Observation and modeling of the historic “Godzilla” African
dust intrusion into the Caribbean Basin and the
southern US in June 2020
Hongbin Yu1 , Qian Tan2,3 , Lillian Zhou1 , Yaping Zhou1,4 , Huisheng Bian1,4 , Mian Chin1 , Claire L. Ryder5 ,
Robert C. Levy1 , Yaswant Pradhan6 , Yingxi Shi1,4 , Qianqian Song4,7 , Zhibo Zhang4,7 , Peter R. Colarco1 ,
Dongchul Kim1,8 , Lorraine A. Remer4 , Tianle Yuan1,4 , Olga Mayol-Bracero9,a , and Brent N. Holben1
1 Earth Sciences Division, NASA Goddard Space Flight Center, Greenbelt, MD, USA
2 Bay Area Environment Research Institute, Petaluma, CA, USA
3 Earth Science Division, NASA Ames Research Center, Moffett Field, CA, USA
4 JCET, University of Maryland at Baltimore County, Baltimore, MD, USA
5 Department of Meteorology, University of Reading, Reading, RG6 6BB, UK
6 Met Office, Exeter, EX1 3PB, UK
7 Physics Department, University of Maryland at Baltimore County, Baltimore, MD, USA
8 GESTAR, Universities Space Research Association, Columbia, MD, USA
9 Department of Environmental Science, University of Puerto Rico, Puerto Rico, USA
a now at: Brookhaven National Laboratory, New York City, New York, USA

Correspondence: Hongbin Yu (hongbin.yu@nasa.gov)

Received: 27 January 2021 – Discussion started: 3 March 2021
Revised: 22 July 2021 – Accepted: 22 July 2021 – Published: 18 August 2021

Abstract. This study characterizes a massive African dust         veal that dust emissions from convection-generated haboobs
intrusion into the Caribbean Basin and southern US in June        and other sources in West Africa were large albeit not ex-
2020, which is nicknamed the “Godzilla” dust plume, us-           treme on a daily basis. However, the anomalous strength
ing a comprehensive set of satellite and ground-based obser-      and northern shift of the North Atlantic Subtropical High
vations (including MODIS, CALIOP, SEVIRI, AERONET,                (NASH) together with the Azores low formed a closed cir-
and EPA Air Quality network) and the NASA GEOS global             culation pattern that allowed for accumulation of the dust
aerosol transport model. The MODIS data record registered         near the African coast for about 4 d. When the NASH was
this massive dust intrusion event as the most intense episode     weakened and wandered back to the south, the dust outflow
over the past 2 decades. During this event, the aerosol optical   region was dominated by a strong African easterly jet that
depth (AOD) observed by AERONET and MODIS peaked                  rapidly transported the accumulated dust from the coastal
at 3.5 off the coast of West Africa and 1.8 in the Caribbean      region toward the Caribbean Basin, resulting in the record-
Basin. CALIOP observations show that the top of the dust          breaking African dust intrusion. In comparison to satellite
plume reached altitudes of 6–8 km in West Africa and de-          observations, the GEOS model reproduced the MODIS ob-
scended to about 4 km altitude over the Caribbean Basin           served tracks of the meandering dust plume well as it was
and 2 km over the US Gulf of Mexico coast. The dust in-           carried by the wind systems. However, the model substan-
trusion event degraded the air quality in Puerto Rico to a        tially underestimated dust emissions from haboobs and did
hazardous level, with maximum daily PM10 concentration            not lift up enough dust to the middle troposphere for en-
of 453 µg m−3 recorded on 23 June. The dust intrusion into        suing long-range transport. Consequently, the model largely
the US raised the PM2.5 concentration on 27 June to a level       missed the satellite-observed elevated dust plume along the
exceeding the EPA air quality standard in about 40 % of           cross-ocean track and underestimated the dust intrusion into
the stations in the southern US. Satellite observations re-       the Caribbean Basin by a factor of more than 4. Modeling im-

Published by Copernicus Publications on behalf of the European Geosciences Union.
12360                                                      H. Yu et al.: “Godzilla” African dust intrusion into the Americas

provements need to focus on developing more realistic rep-        also critical to assess to what extent global aerosol models
resentations of moist convection, haboobs, and the vertical       can capture such extreme intercontinental transport events.
transport of dust.                                                   In late June 2020, a gigantic dust plume was observed
                                                                  to intrude into the Caribbean Basin and the southern US.
                                                                  Figure 1 shows a snapshot panorama of dust plumes ob-
                                                                  served at 14:47:32 GMT on 23 June 2020, taken by the Earth
                                                                  Polychromatic Imaging Camera (EPIC) on board the Deep
1   Introduction                                                  Space Climate Observatory (DSCOVR) at the first Lagrange
                                                                  point (L1) between Earth and the sun (about 2.5 × 10⁹ m
Trans-Atlantic transport of African dust to the Caribbean         above the Earth’s surface) (Marshak et al., 2018). Featured
Basin and the Americas is a year-round phenomenon (Yu             in the image is a dense dust plume over the Caribbean Basin
et al., 2013; Prospero et al., 2014) that imposes far-reaching    followed by another just off the African coast in the east-
impacts on air quality and human health, the radiation bud-       ern North Atlantic Ocean. These two dust plumes are about
get, clouds and weather systems, soil development, snow           5000 km apart but appear to be comparable in intensity. The
melting, and terrestrial and aquatic ecosystems (Swap et al.,     dust over the Caribbean Basin during this period has at-
1992; Prospero, 1999; DeMott et al., 2003; Miller et al.,         tracted considerable interest from the scientific community
2004; Okin et al., 2004; Jickells, et al., 2005; Chin et al.,     and media because of its huge extent and massive amount,
2007; Muhs et al., 2007; Evan et al., 2011; Yu et al., 2015b;     thus called the “Godzilla” dust plume (https://phys.org/news/
Yuan et al., 2016; Song et al., 2018; Tao et al., 2018). On       2020-06-sahara-blankets-caribbean-air-quality.html, last ac-
average, it has been estimated that about 180 million metric      cess: 21 January 2021) and “a dust plume to re-
tons of dust from North Africa is carried by the trade winds      member” (https://earthobservatory.nasa.gov/images/146913/
each year to sweep across the tropical North Atlantic Ocean.      a-dust-plume-to-remember, last access: 21 January 2021)
This dust lands in different parts of the Americas and the        for its extraordinary characteristics. Francis et al. (2020) ex-
Caribbean Basin (Yu et al., 2015a), which is modulated by         amined the atmospheric circulation characteristics that drove
the seasonal migration of the intertropical convergence zone      the formation and transport of this dust storm. Pu and Jin
(ITCZ).                                                           (2021) analyzed satellite measurements of aerosol and re-
   Dust uplift during the Saharan summertime dust season is       analysis of atmospheric circulations and showed that the as-
primarily driven by two mechanisms: low level jets (LLJs)         sociation of this extreme dust event with enhanced dust emis-
and haboobs (Marsham and Ryder, 2021). LLJs occur when            sions and atmospheric circulation extremes favored west-
nocturnal jets are mixed down towards the surface as the day-     ward transport of dust. Both studies have focused on anoma-
time boundary layer develops with surface heating. Haboobs        lies in large-scale circulations without elucidating potential
occur due to cold-pool outflows in the form of density cur-       roles of mesoscale circulations in producing and transporting
rents from convective systems, with high wind speeds and          dust. Pu and Jin (2021) assessed that the increased surface
dust uplift. These high-wind events play an important role in     wind speed and reduced vegetation cover only contributed
dust lifting and make the largest contribution to interannual     to less than half of the observed anomaly in aerosol optical
variability of dust generation (Cowie et al., 2015). Marsham      depth for this event.
et al. (2013) found that haboobs accounted for as much as            In this study, we will use a variety of remote sensing and
50 % of Saharan summertime dust uplift. Convective mix-           in situ observations and simulations with the NASA God-
ing resulting from intense solar heating gradually mixes dust     dard Earth Observing System (GEOS) model to character-
vertically as the convective boundary layer grows, eventually     ize the gigantic dust plume and assess its impact on the air
mixing it throughout the entire Saharan boundary layer up to      quality in the southern US. Specifically, we will (1) charac-
6–8 km (e.g., Engelstaedter et al., 2015; Ryder et al. 2015).     terize the evolution of the three-dimensional structure of the
Easterly mid-level winds then advect the dust westwards over      dust plumes along their cross-ocean transit, (2) place the in-
the Atlantic Ocean, where it overrides the marine boundary        tensity of the Godzilla dust plume in a context of the last
layer, becoming the elevated Saharan Air Layer (SAL) (e.g.,       2 decades, (3) understand major synoptic processes that re-
Karyampudi, 1999; Carlson and Prospero, 1972).                    sulted in the gigantic dust intrusion into the Caribbean Basin,
   It is worth noting that these dust events are episodic in      (4) assess its impact on particulate matter (PM) air quality in
nature and vary substantially in intensity from event to event.   the southern US, and (5) evaluate the Goddard Earth Observ-
Because of the high intensity and broad reach of extreme dust     ing System (GEOS) model simulation of the dust event with
events, they can impose enormous albeit intermittent impacts      the observations. The rest of the paper is organized as fol-
on the environment on a large spatial scale. Often a few ex-      lows. Section 2 describes the data and model we use to char-
treme dust events could make disproportionally large con-         acterize the dust event, including aerosol retrievals from the
tributions to the annual dust budget. It is thus important to     Moderate Resolution Imaging Spectroradiometer (MODIS),
characterize such extraordinary events with comprehensive         aerosol vertical profiles from the Cloud-Aerosol Lidar with
observations and understand their underlying processes. It is     orthogonal Polarization (CALIOP), surface PM2.5 (PM with

Atmos. Chem. Phys., 21, 12359–12383, 2021                                         https://doi.org/10.5194/acp-21-12359-2021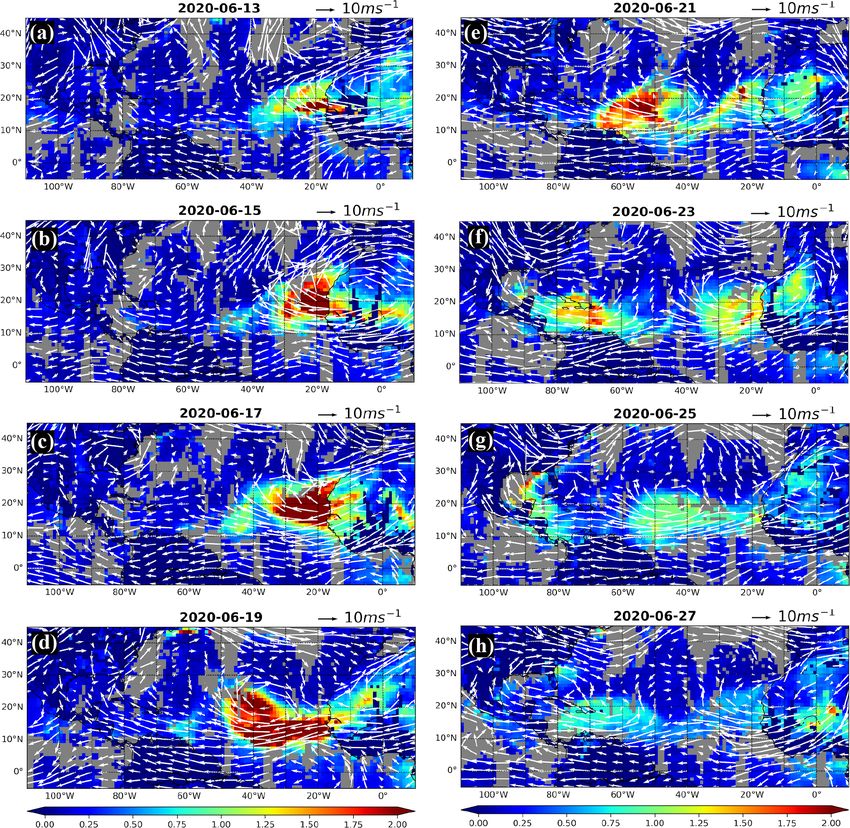
H. Yu et al.: “Godzilla” African dust intrusion into the Americas                                                          12361

Figure 1. A panorama of dual dust plumes from 2.5 × 10⁹ m above the Earth’s surface snapped by the EPIC/DSCOVR at 14:47:32 GMT on
23 June 2020 (https://epic.gsfc.nasa.gov, last access: 20 January 2021).

aerodynamic diameter less than 2.5 µm) concentration from          veloped to improve dust retrievals by accounting for non-
the U.S. Environmental Protection Agency (EPA) air quality         sphericity of dust particles (Zhou et al., 2020a). It has been
network, dust and deep clouds from the Spinning Enhanced           shown that this enhanced dust retrieval algorithm signifi-
Visible and InfraRed Imager (SEVIRI), and aerosol simu-            cantly improves the retrievals of AOD and FMF over ocean
lations with the model. Section 3 presents major results of        (Zhou et al., 2020b). For this study exclusively, the enhanced
the data analysis and addresses several important questions,       DT algorithm has been applied to the identified dust scenes
including the following. (a) How did the three-dimensional         over ocean from 10–30 June 2020. Although the DT al-
structure of the dust plumes evolve during the trans-Atlantic      gorithm is also applied to retrieval of AOD over vegetated
journey? (b) Is this episode a historic event over the past 2      lands, it does not retrieve aerosol over deserts because of in-
decades? (c) What are major meteorological factors respon-         terference of strong surface signal. The Deep Blue (DB) al-
sible for the huge dust intrusion? (d) What is the adverse im-     gorithm was initially developed to retrieve AOD and other
pact of the dust event on the PM2.5 air quality in the southern    aerosol properties over bright surfaces and then extended to
US? (e) To what extent does the GEOS model capture the ob-         vegetated lands and oceans (Hsu et al., 2013), which comple-
served characteristics and quantities of the dust plume? Ma-       ments the DT retrievals. The DT and DB products have been
jor conclusions are summarized in Sect. 4.                         combined, on the basis of their performance in reproducing
                                                                   the Aerosol Robotic Network (AERONET) observations, to
                                                                   characterize the global aerosol system (Levy et al., 2013).
2     Description of data and model                                For this study, we aggregate the enhanced DT over-ocean
                                                                   retrievals into 1◦ × 1◦ grids. Over land, we use the MODIS
2.1    MODIS aerosol optical depth                                 Collection 6.1 daily data. We also combine MODIS AOD at
                                                                   550 nm from Terra and Aqua to acquire a better spatial cov-
The MODIS instruments on board both the NASA Terra                 erage of daily aerosol distribution than each satellite alone.
(morning) and Aqua (afternoon) satellites acquire near-            When both Terra and Aqua have AOD retrievals, they are av-
global, daily observations of aerosols with a wide swath of        eraged. In this study, we will use the AERONET data to val-
∼ 2330 km. Because of its wide spectral range and the sim-         idate the MODIS AOD retrieval for this intense dust event.
plicity of the dark ocean surface, the MODIS Dark Target           AERONET is a ground-based network with equipped well-
(DT) algorithm (Remer et al., 2005, 2020; Levy et al., 2013)       calibrated sun photometers that have been measuring AOD
has the capability of retrieving AOD with a relatively high        (with an accuracy of 0.01) and retrieving a set of particle
accuracy over ocean, as well as information on particle size       properties around the globe (Holben et al., 2001).
(in the form of Ångström exponent, effective radius, or fine-
mode fraction – FMF). The FMF measures the contribu-               2.2   CALIOP aerosol extinction profiles
tion of fine-mode particles to total AOD at 0.55 µm (Remer
et al., 2005). In the operational DT aerosol retrieval, dust       CALIOP is a two-wavelength polarization lidar on board the
is assumed to be spherical, which introduces errors in the         Cloud-Aerosol Lidar and Infrared Pathfinder Satellite Obser-
aerosol retrievals downwind of the dust source regions. Most       vation (CALIPSO) satellite with an Equator crossing time
recently, an enhanced DT retrieval algorithm has been de-          of about 13:30 and 01:30 and a 16 d repeat cycle. Since

https://doi.org/10.5194/acp-21-12359-2021                                        Atmos. Chem. Phys., 21, 12359–12383, 2021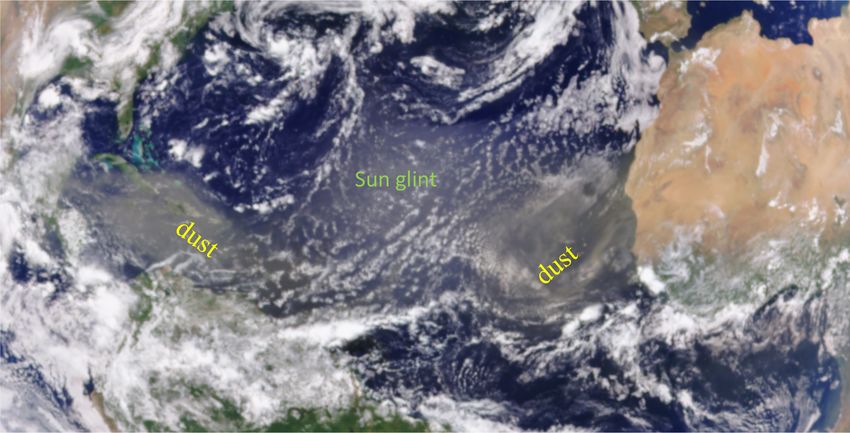
12362                                                       H. Yu et al.: “Godzilla” African dust intrusion into the Americas

June 2006, CALIOP has been almost continuously collecting          10 µm) concentration was measured during the 22–30 June
high-vertical-resolution (e.g., 30 m) profiles of the attenuated   period. Given that in the southern US the EPA network cur-
backscatter by aerosols and clouds at 532 and 1064 nm wave-        rently only collects PM10 concentration at a very limited
lengths along with polarized backscatter at 532 nm between         number of sites, our analysis will focus on PM2.5 .
82◦ N and 82◦ S (Winker et al., 2009). Currently, CALIOP
is the only spaceborne lidar in orbit that provides this key       2.5   GEOS simulations of aerosol
information about the vertical distribution of aerosol. The
unprecedented long data record of CALIOP aerosol profiles          The NASA GEOS is a global Earth system model that in-
accumulated over more than a decade has contributed to a           cludes components for atmospheric circulation and compo-
revolutionary understanding of aerosols in the Earth system.       sition, ocean circulation and biogeochemistry, land surface
It is worth noting that CALIOP can detect aerosol layers in        processes, and data assimilation (Rienecker et al., 2011). The
clear sky, below thin cirrus clouds, and above opaque low-         coupled atmospheric constituent module within the GEOS
level clouds during both day and night, although the night-        architecture most relevant to this study is an aerosol module
time data have better accuracy than the daytime data (Winker       based on the Goddard Chemistry Aerosol Radiation Trans-
et al., 2010; Yu and Zhang, 2013). In this study, we will use      port (GOCART) model (Colarco et al., 2010). GOCART
the CALIOP version 4.20 aerosol extinction profile data at a       simulates major components of aerosols (with diameter be-
nominal horizontal resolution of 5 km supplemented by the          tween 0.02 and 20 µm) and some gaseous precursors, includ-
vertical feature masks in both daytime and nighttime, which        ing dust, sea salt, sulfate, nitrate, ammonium, organic carbon,
represents significant improvements over the previous data         black carbon, SO2 , dimethyl sulfide, and NH3 (Chin et al.,
versions (Kim et al., 2018). We only use high-quality aerosol      2002, 2009, 2014; Ginoux et al., 2001; Bian et al., 2017).
data with the cloud aerosol discrimination (CAD) score be-         The model runs in a replay mode, with meteorological fields
tween −100 and −90 following Yu et al. (2019).                     being taken from the Modern-Era Retrospective analysis for
                                                                   Research and Applications – version 2 (MERRA-2) reanaly-
2.3   SEVIRI dust RGB composite imagery                            sis (Gelaro et al., 2017) every 6 h. The model has a horizontal
                                                                   resolution of 1◦ × 1◦ and 72 layers in the vertical. The GEOS
SEVIRI on board the Meteosat Second Generation (MSG)               hourly outputs of aerosol are used in this study. Note that the
satellite series in geostationary orbit (36 000 km) and cen-       model run does not assimilate satellite aerosol observations.
tered at (0◦ N, 0◦ E) provides images of Europe and Africa at         In the GOCART dust modeling, bulk dust emissions are
a frequency of every 15 min, day and night (Schmetz et al.,        calculated online based on 10 m wind speed and a pre-
2002). This allows for monitoring the genesis and movement         determined dust source function. The dust source function
of dust clouds at high temporal resolution (Schepanski et al.,     is a dynamic one that uses the topographic depression and
2007; Ashpole and Washington, 2012). The brightness tem-           the dynamic surface bareness derived from the satellite ob-
perature (BT) at 10.8 µm and two BT differences (between           servations (Ginoux et al., 2001; Kim et al., 2013). This dy-
8.7 and 10.8 µm and between 12.0 and 10.8 µm) are ren-             namic dust source function accounts for the seasonal and in-
dered to red–green–blue (RGB) beams to highlight the pres-         terannual variations in the surface bareness and soil moisture,
ence of dust and different cloud phases (deep clouds, middle       which improves simulated temporal variation in dust aerosols
clouds, and low clouds) (Lensky and Rosenfeld, 2008; Brind-        over some semi-arid areas (Kim et al., 2013). Currently, dust
ley et al., 2012). In this study, we use SEVIRI RGB imagery        particle size distribution (PSD) in the GEOS model is de-
to illustrate the genesis and movement of mesoscale convec-        scribed with five size bins (i.e., 0.2–2, 2–3.6, 3.6–6, 6–12,
tive systems, haboobs, and dust plumes from other sources.         and 12–20 µm in diameter) (Ginoux et al., 2001; Chin et al.,
                                                                   2009). The size distribution of emitted dust is empirically
2.4   PM concentrations from EPA air quality network               prescribed following Tegen and Fung (1994). Emitted dust is
                                                                   transported by winds and removed from the atmosphere via
The EPA of the United States has established a comprehen-          gravitational settling, dry deposition by turbulence, and scav-
sive network across the nation (including Puerto Rico, and         enging by large-scale and convective rain. The gravitational
the US Virgin Islands) to monitor the outdoor air quality of       settling is calculated with an assumption of spherical parti-
ozone, PM, and other chemical species. In this study, we           cles following a method described in Ginoux et al. (2001).
will use the measured daily PM2.5 data in June 2020 over           The model parameterizes large-scale in-cloud and below-
nine southern states of the US, including Florida, South Car-      cloud scavenging as a function of rainfall production rate and
olina, Georgia, Alabama, Mississippi, Louisiana, Arkansas,         precipitation fluxes, respectively, and the scavenging in con-
Oklahoma, and Texas. This wide swath of states captured the        vective updrafts as a function of the updraft mass flux. Dust
major influence of the massive dust intrusion on air quality.      optical properties in the model are based on the Meng et al.
Unfortunately, most of EPA measuring sites in Puerto Rico          (2010) database that incorporates Mie, T-matrix, DDA (dis-
were not active during the period of this study, except Canato     crete dipole approximation), and geometric optics (depend-
where PM10 (PM with aerodynamic diameter of smaller than           ing on size parameter), as described in Colarco et al. (2014).

Atmos. Chem. Phys., 21, 12359–12383, 2021                                          https://doi.org/10.5194/acp-21-12359-2021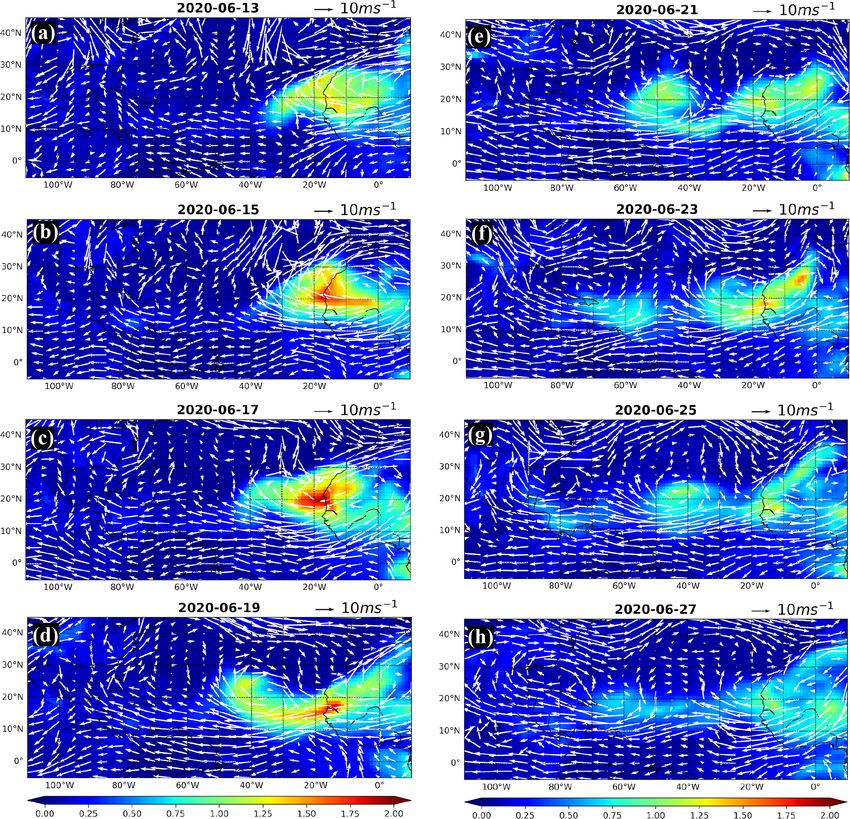
H. Yu et al.: “Godzilla” African dust intrusion into the Americas                                                            12363

The shape distribution presently used is the spheroidal distri-      3     Results
bution proposed by Dubovik et al. (2006).
                                                                     3.1     Observational characterizations of the dust event
2.6   Uncertainties
                                                                     In this section we use satellite and ground-based observa-
Both observations and model simulations are subject to sig-          tions to characterize the dust event, including the evolution
nificant uncertainties, which have been extensively assessed         of trans-Atlantic dust plumes, strength of the dust intrusion
in previous studies. Here we provide a summary of major un-          event in the context of the last 2 decades, impacts of the dust
certainties associated with observational datasets and GEOS          intrusion event on air quality in Puerto Rico and the southern
dust modeling.                                                       US, and synoptic meteorological conditions controlling the
   Satellite retrievals can have large uncertainties result-         dust event.
ing from instrument calibration, cloud contamination, and
aerosol models assumed in the retrieval algorithms, among            3.1.1    Evolution of the trans-Atlantic dust plumes
others. Previous validations show that the MODIS DT and
DB AOD has an uncertainty of ± (0.05 + 0.15 · AOD) (Levy             Horizontal variations in trans-Atlantic dust plumes are char-
et al., 2013) and ± (0.03 ± 0.20 · AOD) (Sayer et al., 2013),        acterized by MODIS aerosol retrievals. Figure 2 shows the
respectively. Generally, the MODIS retrievals tend to bias           MODIS daily AOD maps from 13 to 27 June at a fre-
high at low AOD but bias low at high AOD. In this study,             quency of every other day (a full day-to-day variation in
we use the new MODIS DT algorithm that accounts for                  AOD can be seen in an animation in Yu et al., 2021,
non-sphericity of dust particles, which significantly im-            https://doi.org/10.5446/50830). Here MODIS observations
proves MODIS DT retrievals (Zhou et al., 2020b). In the              from both Terra and Aqua are combined to represent daily
next section we will also evaluate the MODIS AOD re-                 AOD with a better spatial coverage. Overlaid on the AOD
trievals with the AERONET measurements during this event.            map is horizontal wind vectors at about 4 km altitude from
For CALIOP retrievals, the assumptions of aerosol-type-              the MERRA-2 reanalysis. Clearly seen in these maps are the
dependent lidar ratio could result in large uncertainty in the       dust plumes as wide as 2500 km (confined within 5–30◦ N
aerosol extinction retrieval, in particular when aerosol load-       latitude belt) being transported across the tropical Atlantic
ing is high (Winker et al., 2009; Yu et al., 2010; Schuster          Ocean in a meandering path and ultimately reaching the Gulf
et al., 2012). On the one hand, the CALIOP aerosol detec-            of Mexico and the southern US. A discontinuity in AOD
tion algorithm tends to miss tenuous features with signal be-        along the West African coastline reflects the difference be-
low the instrument sensitivity. On the other hand, the lidar         tween the MODIS DT and DB algorithms. In the early days
signal can be completely attenuated when the aerosol layer           (13–15 June), the dust plume was largely confined to the
is optically thick (e.g., AOD greater than 2–3), which leads         African coastal region (east of 35◦ W), which is consistent
to missing the lower part of the aerosol plume. In either case,      with the presence of a strong meridional wind component in
the AOD is biased low. In the CALIOP version 4 retrieval,            the region. This coastal accumulation of dust led to a peak
the lidar ratio for dust is increased from 40 sr in the early ver-   AOD of about 3.5 on 17 June. Although the plume had al-
sions to 44 sr, resulting in an increase in dust extinction and a    ready started moving westward on 17 June as a result of
smaller low bias with respect to AERONET AOD (Kim et al.,            a much weakened meridional wind, the rapid ventilation of
2018).                                                               dust away from the African coast took place on 18 June. On
   Uncertainties in the GEOS dust simulations can come               19 June, the plume extended from the African coast to 50◦ W
from a variety of sources, including dust emissions, atmo-           with more dust coming out of West African deserts. The dust
spheric transport and removal processes, and assumptions of          plume front was swirling around a weak anticyclone with
dust particle size, shape, and refractive indices. The GEOS          its front moving northward to nearly 30◦ N. In the following
dust simulations have been validated with a variety of ob-           days, the dust plume drifted south and reached the northern
servations and compared with other models, largely in terms          coast of South America on 21 June. The plume with its front
of the climatology (e.g., Huneeus et al., 2011; Kim et al.,          at 70◦ W was followed by another narrow dust plume located
2014, 2019; Kok et al., 2017; Yu et al., 2010, 2019). Like           near the coast of West Africa with AOD generally smaller
many other models, the GEOS model overestimates fine dust            than 1. It appears that significant dust in the plume had been
but underestimates coarse and giant dust (Kok et al., 2017).         deposited into the ocean during the period of 19–21 June.
Comparisons against satellite observations for the trans-            Some new dust sources were also evident over West Africa
Atlantic dust transport also show that the model tends to re-        (e.g., southern Algeria, Mali, and Mauritania). On 23 June
move dust from the atmosphere too efficiently (Kim et al.,           dual dust plumes appeared on the map, the primary Godzilla
2014; Yu et al., 2019). In this study we will use the MODIS          dust plume over the Caribbean Basin (centered around 15◦ N
and CALIOP observations to evaluate how the GEOS model               and 68◦ W) and the secondary dust plume near the African
performs in simulating the Godzilla dust event.                      coast. The primary dust plume veered into the Gulf of Mex-
                                                                     ico towards the northwest on 25 June, potentially striking a

https://doi.org/10.5194/acp-21-12359-2021                                            Atmos. Chem. Phys., 21, 12359–12383, 2021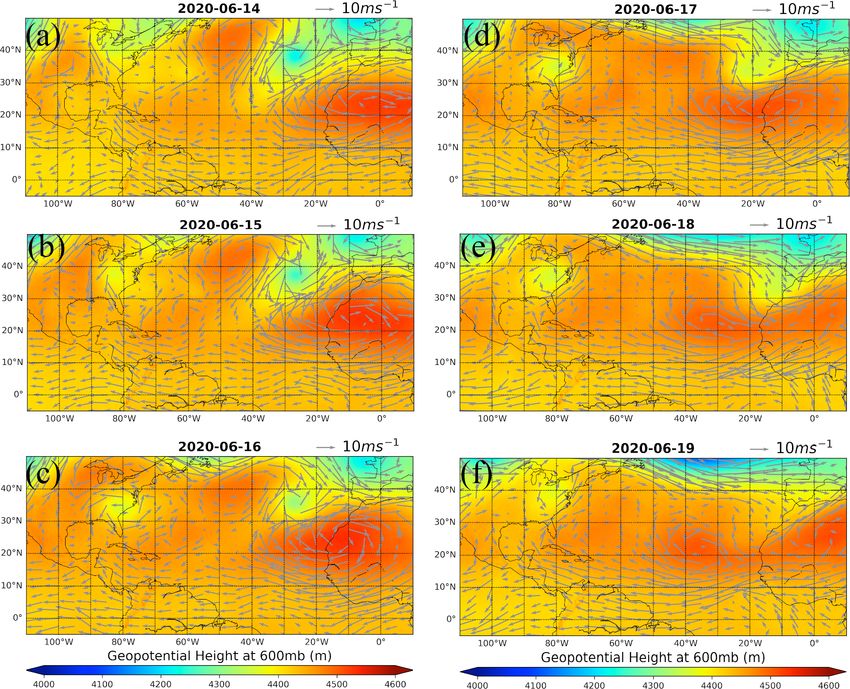
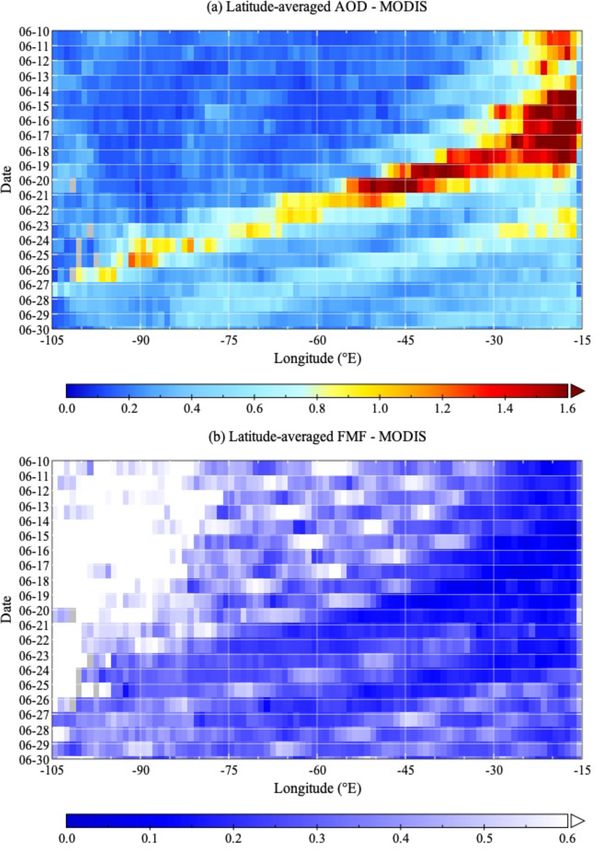
12364                                                         H. Yu et al.: “Godzilla” African dust intrusion into the Americas

Figure 2. Evolution of dust plumes as revealed by MODIS AOD (color map) from 13 to 27 June 2020. Overlaid on the AOD is the MERRA-2
wind vectors at about 4 km altitude, which illustrates how the dust plumes are carried by atmospheric circulations from the coast of North
Africa to the Caribbean Basin and the southern US. Gray areas indicate MODIS data gaps due to the presence of clouds or other unfavorable
conditions for the retrieval.

large swath of the southern US. While a branch of the dust             and FMF averaged over 5–30◦ N in the time–longitude Hov-
plume appeared to enter the Florida panhandle, the plume               möller diagrams, as shown in Fig. 3. During the 10–30 June
structure off the gulf coast from Texas to Louisiana was not           2020 period, three distinct dust plumes stand out with high
visible from MODIS due to the presence of clouds. Mean-                AOD and low FMF (dust particles are coarse and have
while, the secondary dust plume was approaching the east-              smaller values of FMF than background marine aerosol and
ern Caribbean Sea at about 60◦ W. On 27 June, the secondary            combustion aerosol). The most prominent dust plume, i.e.,
dust plume reached the Gulf of Mexico, but did not move to-            the Godzilla dust plume, started to build up along the African
ward the southern US due to the dominant zonal winds in the            coast on 13–15 June. Initially the dust plume was generally
gulf region.                                                           confined and accumulated to the coastal region east of 35◦ W.
   To track the progression of dust plumes across the trop-            As such over the coastal water off West Africa, high AOD
ical North Atlantic Ocean, we present MODIS daily AOD                  (1.5–2.0) and small FMF (0.1–0.2) persisted for several days.

Atmos. Chem. Phys., 21, 12359–12383, 2021                                                https://doi.org/10.5194/acp-21-12359-2021
H. Yu et al.: “Godzilla” African dust intrusion into the Americas                                                        12365

                                                                 Caribbean Basin (at 60◦ W) on 26 June and the Gulf of Mex-
                                                                 ico (at 90◦ W) on 30 June.
                                                                    Figure 4 shows the time series of MODIS and AERONET
                                                                 daily AOD from 10 to 30 June 2020 at seven AERONET
                                                                 sites in West Africa and the Caribbean Basin, including Cape
                                                                 Verde, Tamanrasset, Ben Salem, Cape San Juan, La Parguera,
                                                                 Guadeloupe, and Ragged Point. These comparisons show
                                                                 that MODIS retrievals captured the time evolution of the dust
                                                                 events observed by AERONET sun photometers well, in par-
                                                                 ticular over the Caribbean Basin.
                                                                    The vertical structures of the dust plumes are characterized
                                                                 by CALIOP observations. Figure 5 displays the CALIOP
                                                                 aerosol extinction curtains over West Africa (17 June), the
                                                                 African coast (18 June), and the Caribbean Basin (23 and
                                                                 24 June). In West Africa and along the coast, the top of the
                                                                 dust plume is at 6–8 km, which is higher in the north than
                                                                 in the south. This dust plume top altitude is higher than the
                                                                 climatology of summertime extreme dust events (∼ 5 km)
                                                                 (Huang et al., 2010). The intense dust layers stay above
                                                                 the low-level clouds (light gray shading) (Fig. 5a and b).
                                                                 Also, the heavy dust layer attenuates the CALIOP beam
                                                                 entirely so that no signal (black shading) is apparent be-
                                                                 low 2 km in some locations (Fig. 5b). After being trans-
                                                                 ported to the Caribbean Basin, the top of the dust plume is
                                                                 at about 4 km, and the dust layer appears to mix with ma-
                                                                 rine aerosol in the boundary layer. The mixing leads to the
                                                                 maximum extinction near the surface. Because the aerosol
                                                                 loading was significantly reduced through deposition pro-
                                                                 cesses along the transport, totally attenuated features do not
                                                                 exist over the Caribbean Basin. The CALIOP high-resolution
Figure 3. Tracks of trans-Atlantic dust plumes over 10–30 June   measurements also show fine structures in the dust plume,
2020 as revealed in the longitude–time Hovmöller diagrams of
                                                                 including several sandwiched layers of high aerosol extinc-
MODIS daily AOD (a) and FMF (b). AOD and FMF are averaged
over 5–30◦ N.
                                                                 tion of greater than 0.5 km−1 between 1.5 and 4 km near the
                                                                 African coast and about 0.3 km−1 between 1 and 3 km in the
                                                                 Caribbean Basin.

On 17–18 June, the intense dust plume was transported west-      3.1.2   Impacts on air quality in Puerto Rico and the
ward rapidly by an African easterly wave, reaching the east-             southern US
ern Caribbean (at 60◦ W) on 21 June with an AOD of 0.9–
1.3 and FMF of about 0.2 and then the Gulf of Mexico (at         As shown in Fig. 2, the gigantic dust plume swept across
90◦ W) on 25 June with an AOD of about 1.0 and FMF of 0.3.       Puerto Rico. During this dust event PM10 was sampled only
AOD did not undergo a significant decrease from the eastern      at the EPA Catano site (18.43◦ N, 66.14◦ W) (Fig. 6a). PM10
Caribbean to the Gulf of Mexico, which would yield a strong      peaked on 23 June, with the concentration of 453 µg m−3 .
influence on the southern US. Additionally, two weaker but       The PM10 concentration was also higher than the statisti-
still notable dust plumes are also displayed in the Hovmöller    cal average a day before (161 µg m−3 on 22 June) and after
diagrams. One plume started its trans-Atlantic journey from      (139 µg m−3 on 24 June). On 27 and 28 June, PM10 concen-
the coast of North Africa (at 15◦ W) with an AOD of ∼ 1.2        tration was 95 and 91 µg m−3 , respectively, indicating the in-
and FMF of ∼ 0.1 on 10 June. The AOD of this plume de-           fluence of the secondary dust plume discussed earlier. This
creased rapidly to ∼ 0.3 at 45◦ W on 15 June. No clear plume     day-to-day variation in PM10 concentration is different than
can be seen beyond this point, suggesting that this dust plume   AOD variation in Cape San Juan and La Parguera where
had been quickly removed from the atmosphere and did not         AOD peaked on 22 June (Fig. 4). This difference can be
reach the Caribbean Basin. On the other hand, another dust       explained by the aerosol vertical distribution, as shown in
plume originating at the coast on 22 June with a smaller AOD     Fig. S1 in the Supplement. Generally, the dust layer was
of about 0.9 was transported all the way to the Caribbean        elevated in altitude on 22 June but touched the ground on
Basin and Gulf of Mexico. The plume reached the eastern          23 and 24 June, although CALIOP tracks were not always

https://doi.org/10.5194/acp-21-12359-2021                                      Atmos. Chem. Phys., 21, 12359–12383, 2021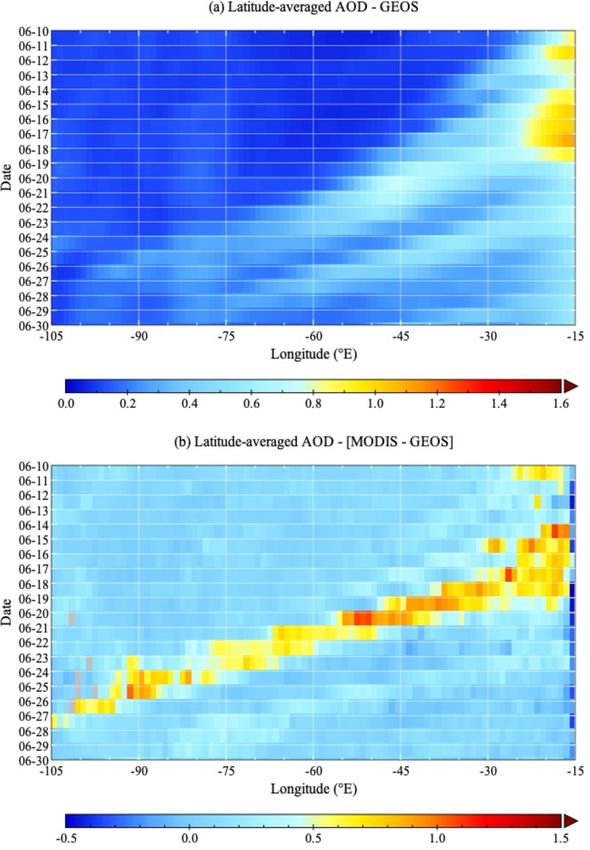
12366                                                     H. Yu et al.: “Godzilla” African dust intrusion into the Americas

Figure 4. Time series (10 to 30 June 2020) of MODIS and AERONET daily AOD at 550 nm at seven AERONET sites, as illustrated in
(a) over MODIS AOD map, including (b) Ben Salem, (c) Tamanrasset, (d) Cape Verde, (e) Cape San Juan, (f) La Parguera, (g) Ragged
Point, and (h) Guadeloupe.

close to the surface site. By examining the PM10 data record      were substantially elevated on 26 and 27 June in compari-
since 1994 at the Catano site, we identified 24 d with daily      son to the days before and after. We categorized the PM2.5
PM10 > 100 µg m−3 (Fig. 6b). Clearly, 23 June 2020 had the        data into four ranges, < 15, 15–35, 35–50, and > 50 µg m−3 ,
highest PM10 in the whole record, while 22 and 24 June had        and marked with different colors, as illustrated in Fig. 7.
the third and fifth highest PM10 , respectively.                  On 26 June, 31 out of 158 sites (or 20 %) observed PM2.5
   The dust plume intruded into the southern US through the       exceeding the EPA air quality standard of 35 µg m−3 . On
Gulf of Mexico pathway, affecting PM levels and thus possi-       27 June, 62 out of 150 sites (or 41 %) exceeded the EPA
bly air quality in the southern US states. We examined daily      standard. The maximum PM2.5 concentration observed was
PM2.5 concentrations in June 2020 at all available EPA air        73.9 µg m−3 (St. Marks, Florida) and 73.5 µg m−3 (Eagle
quality sites (∼ 150) in the nine southern US states and found    Pass, Texas) on 26 and 27 June, respectively. Although only
that the surface PM2.5 concentrations at a number of sites        a few sites have PM10 concentration available, three sites ob-

Atmos. Chem. Phys., 21, 12359–12383, 2021                                         https://doi.org/10.5194/acp-21-12359-2021
H. Yu et al.: “Godzilla” African dust intrusion into the Americas 12367
Figure 5. Curtains of CALIOP–CALIPSO aerosol extinction at 532 nm (colored) in the North African coastal region (a – 17 June and b –
18 June) and the Caribbean Basin (c – 23 June and d – 24 June). Light gray, dark gray, and black represent cloudy, clear and clean (below
the detection limit), and totally attenuated, respectively. The x axis denotes latitude and longitude of the CALIPSO track.
trations remained low (< 15 µg m−3 ) in southern and cen-
tral Florida. This suggests that the dust plume took the
Gulf of Mexico pathway and affected the gulf coast in par-
ticular, which is corroborated by remote sensing measure-
ments of dust plume intrusion to the region (Fig. 8). The
AERONET measurements at Tallahassee (illustrated in the
inset of 27 June map) show maximum AOD of 1.47 on
26 June, which is substantially higher than 0.1–0.2 during the
10–23 June period. Meanwhile the FMF on 27 June was 0.28,
which represented a substantial drop from 0.82 on 22 June.
MODIS AOD around Tallahassee shows an increase from
about 0.2 on 24 June to 0.5 and 0.8 on 25 and 26 June, re-
spectively. On 25 June, CALIOP also passed through the re-
gion with the aerosol extinction coefficient of 0.1–0.5 km−1
from the surface to about 4 km. These measurements provide
clear evidence that large amounts of dust did intrude into the
panhandle region and degrade the air quality significantly.
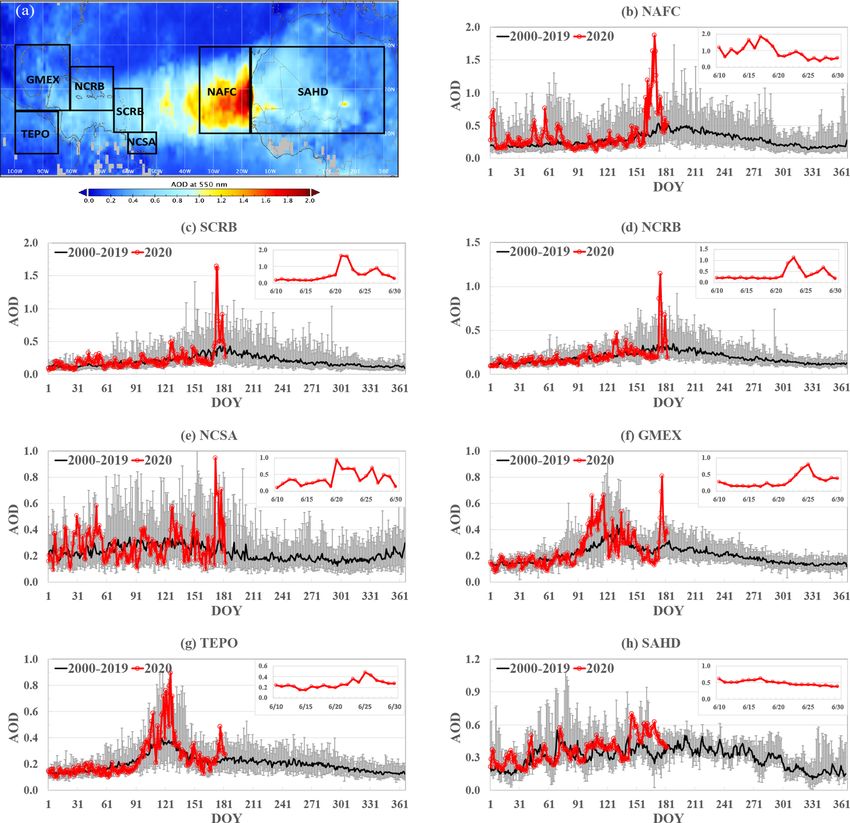
3.1.3 A historic event in the past 2 decades and its
synoptic control
Figure 6. (a) PM10 concentration measured at Catano, Puerto The June 2020 event of African dust intrusion into the
Rico, during the June 2020 dust event, (b) 24 extreme dust events Caribbean Basin and the Americas is a historic one project-
(PM10 > 100 µg m−3 ) at this site since 1994. ing above the climatology from the past 2 decades, as reg-
istered in the MODIS Terra data record since 2000 (Fig. 9).
We carried out regional analysis of MODIS Terra daily AOD
served PM10 greater than 100 µg m−3 , including 136 µg m−3 since 2000 in seven regions as defined in Fig. 9a: Saharan
in North Tulsa, Oklahoma (27 June); 135 µg m−3 in Jack- deserts (SAHD), North African Coast (NAFC), the north-
son NCORE, Mississippi (26 June); and 113 µg m−3 in OKC east coast of South America (NCSA), the southern Caribbean
North, Oklahoma (27 June). Basin (SCRB), the northern Caribbean Basin (NCRB), the
A notable feature in Fig. 7 is that a number of sites Gulf of Mexico (GMEX), and the tropical eastern Pacific
in the Florida panhandle region detected PM2.5 concentra- Ocean (TEPO). Results of the regional analysis are shown
tion > 50 µg m−3 for both days, although PM2.5 concen- in Fig. 9b–h. In each region, daily AOD for January–June
https://doi.org/10.5194/acp-21-12359-2021 Atmos. Chem. Phys., 21, 12359–12383, 2021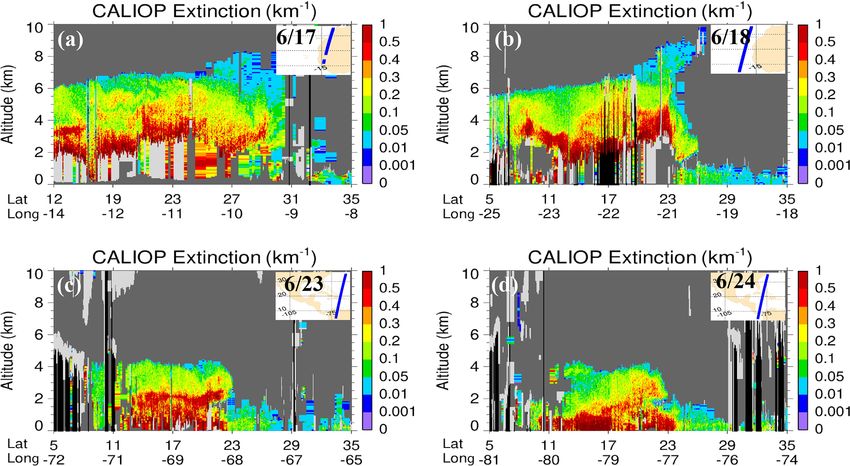
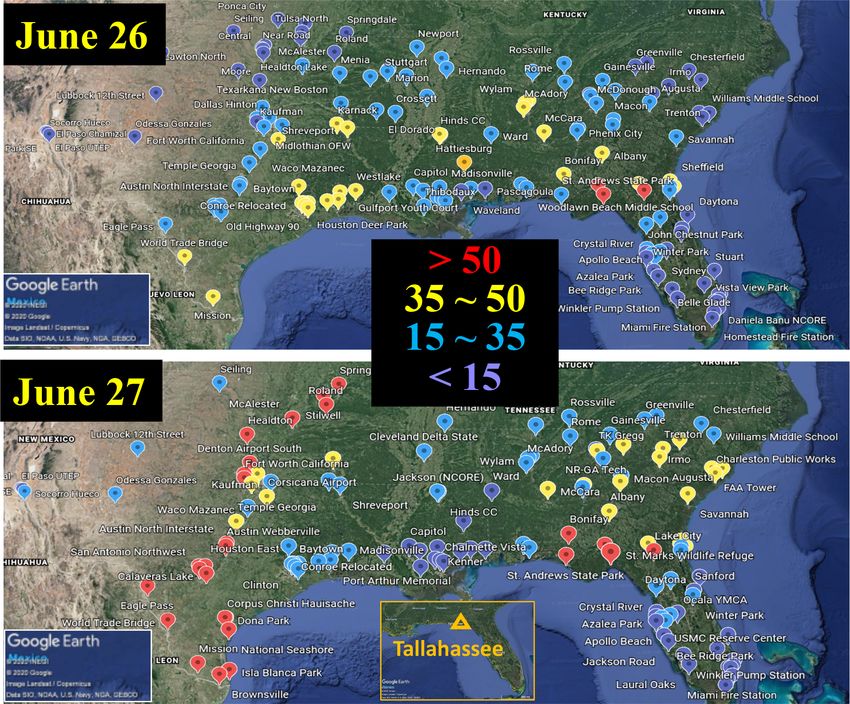
12368                                                           H. Yu et al.: “Godzilla” African dust intrusion into the Americas

Figure 7. Observed PM2.5 concentrations at the EPA air quality network over the southern US on 26 (top) and 27 June (bottom). PM2.5
concentrations are categorized and marked with color in four ranges: < 15 (purple), 15–35 (blue), 35–50 (yellow), and > 50 (red) µg m−3 .
Note that the EPA air quality standard for 24 h PM2.5 is 35 µg m−3 . The location of Tallahassee is shown in the inset of the 27 June map. The
background maps are copyrighted by © Google Earth.

2020 is marked as red dots and lines, with the evolution of              some extreme springtime biomass burning events, it was in-
daily AOD from 10 to 30 June 2020 being elaborated on                    deed the highest in June. Moreover, it is very rare for African
in the inset. For visual clarity, we present the 2000–2019               dust to make it into the tropical eastern Pacific because ob-
daily AOD climatology in the form of the 20-year average                 servations have suggested a Central American barrier to dust
(black line) plus its range (gray vertical bar). Clearly, the            transport (Nowottnick et al., 2011). Therefore, for all six re-
dust event in June 2020 has the highest AOD over the past 2              gions affected by trans-Atlantic dust transport, the June 2020
decades over the North African coast (Fig. 9b), the southern             dust is a historic event over the past 2 decades when seasonal
Caribbean Basin (Fig. 9c), and the northern Caribbean Basin              variations in dust and smoke transport are factored in. On the
(Fig. 9d). In the northeast coast of South America (Fig. 9e),            contrary, the MODIS AOD over the Saharan desert (Fig. 9h)
the dust transport to this region peaks in March–June with               does not indicate that daily dust emissions from North Africa
a minimum in August–November, which is determined by                     were particularly large in early and mid-June. In fact, it was
the seasonal migration of ITCZ (Yu et al., 2015a, b; Pros-               smaller than AOD in late May and 6–8 June 2020. Although
pero et al., 2014). Despite this, the 2020 June event had the            the 2020 June AOD was higher than the climatological aver-
second highest AOD over the past 2 decades and was the                   age in June, it was not the highest. An analysis in West Africa
highest in June. The Gulf of Mexico (Fig. 9f) and the trop-              (10–30◦ N, 17◦ W–10◦ E), which is a part of the SAHD and
ical eastern Pacific Ocean (Fig. 9g) are highly impacted by              likely the major source region for this dust event, displays
biomass burning smoke from Central America in spring. Al-                similar AOD variations (see Fig. S2 in the Supplement).
though the June 2020 dust event had lower AOD than for

Atmos. Chem. Phys., 21, 12359–12383, 2021                                                  https://doi.org/10.5194/acp-21-12359-2021
H. Yu et al.: “Godzilla” African dust intrusion into the Americas                                                             12369

                                                                     the northern fringe of the African continent (30–35◦ N), and
                                                                     eventually to the south in central Africa. This created a nearly
                                                                     closed atmospheric circulation system over West Africa and
                                                                     the eastern North Atlantic Ocean that could recirculate and
                                                                     trap the dust in the West African coast. The unfavorable syn-
                                                                     optic systems persisted through 15 and 16 June, although
                                                                     they were gradually weakened. By 17–19 June, the subtropi-
                                                                     cal high weakened further and drifted southward; meanwhile
                                                                     the trough over the Azores was gradually filled up. The mid-
                                                                     latitude westerly pushed southward along the African coast-
                                                                     line and broke up the closed atmospheric circulation over
                                                                     West Africa and the coastal ocean. As a result, the dust out-
                                                                     flow region was dominated by a strong African easterly jet
                                                                     (AEJ), which would favor the rapid transport of the accu-
                                                                     mulated dust from the African coast toward the Caribbean
                                                                     Basin.
                                                                        Satellite observations corroborate the above analysis of
                                                                     the potential control of the synoptic systems on distribut-
                                                                     ing African dust. As shown earlier in Figs. 2 and 3, MODIS
Figure 8. The intrusion of African dust into the Florida panhandle   AOD started to build up on 13 June but a majority of the
as evidenced in remote sensing observations: (a) evolution of AOD    dust did not transport westward beyond 35◦ W until 18 June.
(black from AERONET and red from MODIS, left axis) and FMF           The highest AOD near the coast occurred on 17 June. More-
(purple from AERONET, right axis) over Tallahassee, Florida, dur-    over, the dust distribution modulated by the synoptic systems
ing 10–30 June 2020; (b) curtain of CALIOP–CALIPSO aerosol ex-       can be vividly displayed in an animation of SEVIRI full-disk
tinction (at 532 nm) along a CALIPSO track overpassing the Florida   RGB dust imageries once every 30 min over the 12–25 June
panhandle on 25 June 2020. The x axis denotes latitude and longi-
                                                                     period (https://doi.org/10.5446/51548, Tan et al., 2021). The
tude of the CALIPSO track.
                                                                     animation clearly shows the evolution of haboobs and their
                                                                     radial outflow behavior, driven by outflows from convective
                                                                     downdrafts, which is not always evident in the still images.
   Given that the dust loading in source regions in June 2020        Here we show a sequence of SEVIRI still images (zoomed
was large albeit not historic (Figs. 9h and S2), the observed        in North Africa) at 12:00 Z of 14–19 June 2020 to illus-
historic intrusion of African dust into the Caribbean Basin          trate the day-to-day evolution of the dust plumes (Fig. 11).
and the southern US should have been modulated by mete-              In these images, magenta, dark red, orange, and dull pink
orological conditions. The North Atlantic subtropical high           denote dust, deep clouds, middle clouds, and low clouds, re-
(NASH), also known as the Bermuda–Azores high, is a semi-            spectively. On 14 June, SEVIRI detected two dust plumes
persistent synoptic system that affects the meteorology and          (Fig. 11a). One plume originating from the southern Mau-
atmospheric circulations in West Africa and the tropical At-         ritania was dispersed over a small coastal area (22–16◦ W
lantic Ocean. The variation in NASH location and intensity           and 12–20◦ N). The other dust plume originated from a ha-
would affect how the dust is transported across the tropical         boob developing over Niger due to strong downdrafts asso-
Atlantic Ocean. Here we analyze the MERRA-2 meteorol-                ciated with a mesoscale convection system (dark red). The
ogy associated with the dust episode by focusing on geopo-           dust plume was situated north of the track of the convective
tential height and wind. Figure 10 displays the evolving spa-        system and was trailing the rapidly moving deep clouds be-
tial patterns of the geopotential height and wind vectors at         cause of the much weaker wind speed than in the convec-
600 hPa from 14 to 19 June. On 14 June, the subtropical              tive core (refer to Fig. 10). The convective systems swept
high was centered at 43◦ N, 45◦ W with a maximum height              swiftly across West Africa and reached the coastal ocean by
of about 4500 m. This ridge system was accompanied by a              the early hours of 15 June. This formed an extensive dust
low-pressure system or trough to its southeast around the            belt between 15–22◦ N that extended from Niger to the coast
Azores and an extensive high-pressure system (∼ 4550 m)              of Mauritania, as shown in Fig. 11b. The haboob-generated
over West Africa. This setting of synoptic systems created           dust mixed with that produced from West African deserts and
an unfavorable atmospheric circulation condition for trans-          stayed over coastal water (east to 30◦ W and 15–30◦ N). The
Atlantic transport of dust. At the lower latitudes (south to         extensive dust belt continued to proceed towards the ocean
∼ 20◦ N), West Africa was dominated by strong northeast-             on 16 June, and more dust was accumulated into the coastal
erly winds, which rapidly exported dust from Sahara–Sahel            region (east to 40◦ W, Fig. 11c). These images clearly show
transit to the eastern Atlantic Ocean. But the easterly veered       that dust emerging from the continent accumulated over the
to the north in the coastal ocean (15–35◦ W), to the east at         coastal region for more than 3 d, yielding the heaviest dust

https://doi.org/10.5194/acp-21-12359-2021                                          Atmos. Chem. Phys., 21, 12359–12383, 2021
12370 H. Yu et al.: “Godzilla” African dust intrusion into the Americas Figure 9. MODIS Terra daily AOD for 2020 (red dot and thick line) in comparison to 2000–2019 climatology (the median and range of daily AOD are represented by the thick black line and gray vertical bar, respectively) in seven regions defined in (a), including (b) NAFC, (c) SCRB, (d) NCRB, (e) NCSA, (f) GMEX, (g) TEPO, and (h) SAHD. The insets in (b–h) zoom in on the day-to-day variations in regional AOD from 10 to 30 June 2020. plume on 17 June. Then this amplified dust plume was ven- trans-Atlantic dust transport during this historic dust intru- tilated out of the coastal region by the easterlies on 18 and sion event. It is intriguing to compare the June 2020 NASH 19 June (Fig. 11e and f), leading to the historic intrusion of with other years. Figure 12 compares the June geopotential African dust into the Caribbean Basin and southern US. Note height at 600 hPa between 2020 (Fig. 12a) and 1980–2019 also that additional dust plumes from haboobs (18 June) and climatology (Fig. 12b). Clearly, the NASH in June 2020 was other West African sources (19 June) were added to the trans- stronger and located further north in comparison to the 40- Atlantic transport. year climatology. As shown in (Fig. 12c), the geopotential The above analysis suggests that the strength and loca- height in 2020 is more than 80 m higher than the climatol- tion of NASH plays an important role in modulating the ogy. South of this high anomaly is a low anomaly that ex- Atmos. Chem. Phys., 21, 12359–12383, 2021 https://doi.org/10.5194/acp-21-12359-2021
H. Yu et al.: “Godzilla” African dust intrusion into the Americas                                                               12371

Figure 10. Patterns of MERRA-2 geopotential height (color) and wind vector (gray arrow) at the 600 hPa level on 14 (a), 15 (b), 16 (c),
17 (d), 18 (e), and 19 June (f) 2020.

tends from Bermuda to western Europe, with the lowest tak-            3.2   GEOS model simulations of the dust intrusion
ing place off the coast of western Europe and the second                    event
lowest between the Azores and Canary Islands. Over West
Africa, the geopotential height in 2020 is higher than the cli-
                                                                      In Sect. 3.1, we have characterized the evolution of the his-
matology by up to 20 m over northwestern Africa. Over the
                                                                      toric dust plume in three dimensions associated with synoptic
last 4 decades, the 2020 geopotential height over the high-
                                                                      systems and assessed its impact on air quality in the south-
anomaly center (35–50◦ N, 60–30◦ W) is the second highest,
                                                                      ern US by using a set of satellite and ground-based observa-
slightly lower than in 2006 (Fig. 12d). This analysis suggests
                                                                      tions. Here we assess to what extent the GEOS model can
that the subtropical high in June 2020 was highly anomalous
                                                                      reproduce the observed characteristics of this historic event.
in both the intensity and position. In comparison to the 40-
                                                                      Similar to Fig. 9, we analyze GEOS AOD from 1 January
year climatology, the high-pressure system over the tropical
                                                                      2000 to 30 June 2020 on a regional basis (see Fig. S3 in the
Atlantic Ocean extended further west to the Gulf of Mexico
                                                                      Supplement). It shows that although the model characterizes
in 2020, which could have contributed to the historic intru-
                                                                      the June 2020 event as a historic one over the North African
sion of dust plume to the southern US (Pu and Jin, 2021) and
                                                                      coast (NAFC) and the southern Caribbean Basin (SCRB), the
the tropical eastern Atlantic Ocean.
                                                                      magnitude is more than a factor of 2 smaller than the MODIS
                                                                      AOD. Similar to the MODIS observations, the GEOS AOD
                                                                      over the desert (SAHD) during the event is not historically
                                                                      high. Unlike the MODIS observations, GEOS simulations of
                                                                      AOD over the other four regions are not the highest even

https://doi.org/10.5194/acp-21-12359-2021                                            Atmos. Chem. Phys., 21, 12359–12383, 2021
12372 H. Yu et al.: “Godzilla” African dust intrusion into the Americas
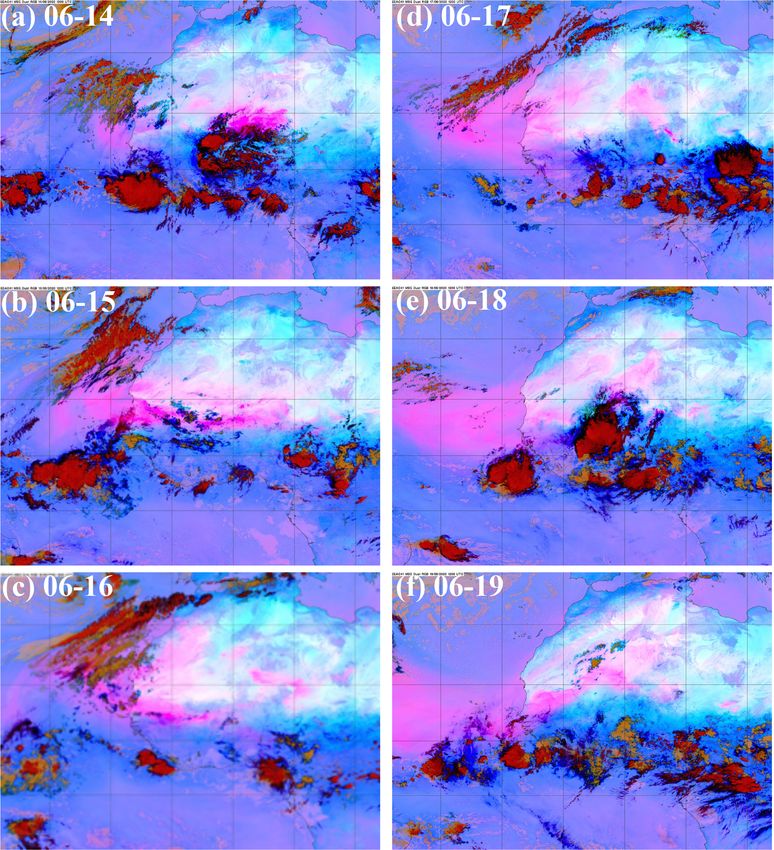
Figure 11. Coastal accumulation and ventilation of dust plumes (magenta) from haboobs (associated with mesoscale convection systems,
dark red) and other meteorological processes in West Africa as revealed by SEVIRI RGB dust images at 12:00 Z of (a) 06–14, (b) 06–15,
(c) 06–16, (d) 06–17, (e) 06–18, and (f) 06–19. An animation of the SEVIRI images every 30 min covering 12–25 June (https://doi.org/10.
5446/51548) clearly shows the evolution of haboobs and their radial outflow behavior, driven by outflows from convective downdrafts.
after accounting for seasonal variations in dust and smoke in Niger where the haboobs originated, although the GEOS
transport. In the following, we further compare the GEOS AOD is higher than MODIS AOD near the coast. The GEOS-
simulations of three-dimensional aerosol distributions with simulated dust plume also drifts northwards over Maurita-
MODIS and CALIOP observations over the dust source re- nia, in comparison to the MODIS observation. There was a
gion and along the trans-Atlantic transport route. CALIPSO track passing through the convective system and
associated dust haboob at 13:14 Z (Fig. 13c). CALIPSO ob-
3.2.1 Dust source region servation shows that the dust extinction within the haboob is
nearly uniform from the surface up to about 4 km (Fig. 13d).
As discussed earlier and displayed in the SEVIRI anima- In contrast, the GEOS model simulates the maximum aerosol
tion, the major source of the Godzilla dust plume is asso- extinction near the surface, which decreases by a factor of
ciated with intense haboobs generated by a strong and fast- about 4 from the surface to 4 km altitude (Fig. 13e).
moving convective system over the southern Sahara from 13 A similar comparison for the 15 June case was displayed in
to 15 June. How does the GEOS model perform in simulat- Fig. 14. On this day, the long-stretched dust plume extending
ing haboobs associated with mesoscale convective systems? from Niger to the African coast (Fig. 14a) was a remanent of
Figure 13 shows an example comparing the GEOS modeling the haboobs from the previous day. Again, the GEOS model
with MODIS and CALIOP observations on 14 June. Clearly, underestimates the AOD and simulates a plume transported
GEOS (Fig. 13b) underestimates MODIS AOD (Fig. 13a) northwards by about 800 km over Mali (Fig. 14b), extending
Atmos. Chem. Phys., 21, 12359–12383, 2021 https://doi.org/10.5194/acp-21-12359-2021H. Yu et al.: “Godzilla” African dust intrusion into the Americas 12373 Figure 12. MERRA-2 reanalysis geopotential height at 600 hPa: (a) June 2020, (b) June climatology (1980–2019), (c) June 2020 anomaly, and (d) 1980–2020 time series averaged over 35–50◦ N and 60–30◦ W. Figure 13. Satellite and GEOS characterizations of dust over North Africa on 14 June 2020: (a) MODIS DB AOD at 550 nm, (b) GEOS AOD at 550 nm, (c) SEVIRI RGB image (with magenta and dark red denoting dust and mesoscale convective system, respectively) with CALIPSO track (yellow line), and altitude–latitude curtains of aerosol extinction coefficient (unit: km−1 ) from CALIOP at 532 nm (d) and GEOS at 550 nm (e). Hourly GEOS outputs close to the satellite overpassing time are used. https://doi.org/10.5194/acp-21-12359-2021 Atmos. Chem. Phys., 21, 12359–12383, 2021
12374                                                      H. Yu et al.: “Godzilla” African dust intrusion into the Americas

Figure 14. Same as Fig. 13 except for 15 June 2020.

further north than the MODIS AOD observation. Although            difference between MODIS and GEOS (MODIS − GEOS),
the top of the dust plume simulated by GEOS is largely con-       as shown in Fig. 16. The GEOS AOD Hovmöller dia-
sistent with the CALIOP observation, the vertical distribu-       gram clearly shows that the model reproduces the distinct
tion of aerosol extinction within the plume is quite different.   trans-Atlantic dust plume tracks as observed by MODIS
Although CALIOP reveals the elevated dust plume (either           (Fig. 3). However, the GEOS substantially underestimated
above clouds or totally attenuated features) with the highest     the MODIS observations. For the primary or Godzilla dust
extinction at the altitude of 4–6 km, the GEOS model dis-         plume, the MODIS AOD is higher by up to 1 (correspond-
plays a rapid decrease in aerosol extinction with increasing      ing to a factor of 2) near the African coast and by up to 0.6
altitude.                                                         (corresponding to a factor of 5) in the Caribbean Basin than
   Both comparisons confirm that the model with a horizontal      the model simulation. The increasing MODIS and GEOS
resolution of 1◦ has a grand challenge to realistically simu-     discrepancy with increasing transport distance suggests that
late the mesoscale convection and haboobs. The model sub-         the GEOS model removes the dust too efficiently from the
stantially underestimates dust loading over the desert, im-       atmosphere, consistent with previous findings (Yu et al.,
plying a very substantial underestimate of dust emissions.        2019; Kim et al., 2014). For the secondary dust plume with
The model also drifts the dust plume northwards and fails to      weaker intensity, the GEOS model performs better; gener-
pump up dust from the surface to higher altitudes for ensuing     ally, MODIS AOD is larger than GEOS AOD by a factor
long-range transport. These modeling deficiencies affect the      of no more than 2. A more complete view of MODIS and
simulation of trans-Atlantic dust transport as discussed in the   GEOS AOD evolution during the 10–30 June period is dis-
next section.                                                     played in an animation (https://doi.org/10.5446/50830, Yu et
                                                                  al., 2021). Finally, the long-term GEOS model simulations
3.2.2   Trans-Atlantic dust transport                             do not show that the Godzilla dust plume is historic over the
                                                                  past 2 decades.
Figure 15 shows GEOS simulation of the evolving dust                 The vertical structure of the “Godzilla” dust plume ex-
plume during the period of 13–27 June 2020, similar to the        hibits striking differences between GEOS and the CALIOP
MODIS characterization as shown in Fig. 2. A comparison of        observations, as shown in Figs. 17 and 18. The nine
Figs. 15 and 2 shows that the model reproduces the MODIS          CALIPSO curtains are selected along the track of the trans-
observed track of meandering dust plume carried by the            Atlantic dust plume (Fig. 3). GEOS hourly outputs closer to
wind systems well, although the modeled plume center shifts       CALIOP overpass time are extracted along the CALIPSO
northwards by about 2◦ . However, the model substantially         track. While the along-CALIPSO track curtain plots in
underestimates the MODIS-observed AOD, which becomes              Fig. 17 resolve the meridional and vertical distributions of
more pronounced with increasing transport distance. To fur-       the dust plume over the course of the trans-Atlantic trans-
ther quantify the difference between GEOS and MODIS, we           port, Fig. 18 contrasts the differences between GEOS and
create the Hovmöller diagrams for GEOS AOD and AOD

Atmos. Chem. Phys., 21, 12359–12383, 2021                                        https://doi.org/10.5194/acp-21-12359-2021
H. Yu et al.: “Godzilla” African dust intrusion into the Americas 12375 Figure 15. GEOS-simulated evolution of trans-Atlantic AOD (color map) during the period of 13–27 June 2020. Overlaid on the AOD map are MERRA-2 wind vectors at an altitude of about 4 km. CALIOP by averaging over the meridional extent (5–30◦ N) tal attenuated layer just beneath the dust plume. This ele- of the dust plume. When calculating average profiles, GEOS vated dust plume descends continuously during the westward hourly outputs are sampled based on CALIOP observations transport, with the peak aerosol extinction occurring at an al- of aerosol and clear–clean features only (that means the titude of 4 km near the coast (15◦ W) on 16 June to about cloudy and fully attenuated features are excluded in aver- 2 km on 20 June when entering the Caribbean at ∼ 55◦ W. aging). Figures 17 and 18 collectively show several ma- This suggests that the dust plume travels westward at an av- jor discrepancies between CALIOP and GEOS. The GEOS erage speed of 1000 km d−1 (∼ 11.6 m s−1 ) and descends at model does not reproduce CALIOP-observed fine dust plume a rate of about 500 m d−1 (∼ 20 m h−1 ), which agrees well structure, presumably because of the model’s coarse verti- with the climatology of the extreme dust events (Kaufman cal resolution. East to the middle ridge of the tropical At- et al., 2005; Huang et al., 2010). The GEOS model misses lantic Ocean (16–20 June), CALIOP observed an elevated or substantially underestimates the elevated dust plume, al- dust layer of 1–2 km thick in the mid-troposphere with an though it generally agrees better with CALIOP at lower al- extinction coefficient of greater than 0.4 km−1 and a to- titudes. During 22–25 June and in the west Atlantic Ocean https://doi.org/10.5194/acp-21-12359-2021 Atmos. Chem. Phys., 21, 12359–12383, 2021
You can also read