Development of global temperature and pH calibrations based on bacterial 3-hydroxy fatty acids in soils
←
→
Page content transcription
If your browser does not render page correctly, please read the page content below
Biogeosciences, 18, 3937–3959, 2021
https://doi.org/10.5194/bg-18-3937-2021
© Author(s) 2021. This work is distributed under
the Creative Commons Attribution 4.0 License.

Development of global temperature and pH calibrations based on
bacterial 3-hydroxy fatty acids in soils
Pierre Véquaud1 , Sylvie Derenne1 , Alexandre Thibault2 , Christelle Anquetil1 , Giuliano Bonanomi3 , Sylvie Collin1 ,
Sergio Contreras4 , Andrew T. Nottingham5,6 , Pierre Sabatier7 , Norma Salinas8 , Wesley P. Scott9 , Josef P. Werne9 , and
Arnaud Huguet1
1 Sorbonne   Université, CNRS, EPHE, PSL, UMR METIS, Paris, 75005, France
2 Antea  Group, Innovation Hub, 803 boulevard Duhamel du Monceau, Olivet, 45160, France
3 Dipartimento di Agraria, Università di Napoli Federico II, via Università 100, Portici, NA, 80055, Italy
4 Laboratorio de Ciencias Ambientales (LACA), Departamento de Química Ambiental, Facultad de Ciencias & Centro de

Investigación en Biodiversidad y Ambientes Sustentables (CIBAS), Universidad Católica de la Santísima Concepción,
Casilla 297, Concepción, Chile
5 School of Geosciences, University of Edinburgh, Crew Building, Kings Buildings, Edinburgh EH9 3FF, UK
6 School of Geography, University of Leeds, Leeds, UK
7 Univ. Savoie Mont Blanc, CNRS, EDYTEM, Le Bourget du Lac, 73776, France
8 Instituto de Ciencias de la Naturaleza, Territorio y Energías Renovables, Pontificia Universidad Catolica del Peru,

Av. Universitaria 1801, San Miguel, Lima 32, Peru
9 Department of Geology and Environmental Science, University of Pittsburgh, Pittsburgh, PA 15260, USA

Correspondence: Arnaud Huguet (arnaud.huguet@sorbonne-universite.fr)

Received: 17 November 2020 – Discussion started: 24 November 2020
Revised: 13 April 2021 – Accepted: 30 April 2021 – Published: 1 July 2021

Abstract. Gram-negative bacteria produce specific mem-          ear regression models, in contrast with the MBT’5Me and
brane lipids, i.e. 3-hydroxy fatty acids with 10 to 18 C        CBT. However, strong global correlations between 3-OH FA
atoms. They have been recently proposed as temperature          relative abundances and MAAT or pH were shown by us-
and pH proxies in terrestrial settings. Nevertheless, the ex-   ing other algorithms (multiple linear regression, k-NN and
isting correlations between pH or temperature and indices       random forest models). The applicability of the three afore-
derived from 3-OH FA distribution are based on a small          mentioned models for palaeotemperature reconstruction was
soil dataset (ca. 70 samples) and only applicable region-       tested and compared with the MAAT record from a Chi-
ally. The aim of this study was to investigate the applica-     nese speleothem. The calibration based on the random forest
bility of 3-OH FAs as mean annual air temperature (MAAT)        model appeared to be the most robust. It generally showed
and pH proxies at the global level. This was achieved using     similar trends with previously available records and high-
an extended soil dataset of 168 topsoils distributed world-     lighted known climatic events poorly visible when using lo-
wide, covering a wide range of temperatures (5 to 30 ◦ C)       cal 3-OH FA calibrations. Altogether, these results demon-
and pH (3 to 8). The response of 3-OH FAs to tempera-           strate the potential of 3-OH FAs as palaeoproxies in terres-
ture and pH was compared to that of established branched        trial settings.
glycerol dialkyl glycerol tetraether (GDGT)-based proxies
(MBT’5Me /CBT). Strong linear relationships between 3-OH-
FA-derived indices (RAN15 , RAN17 and RIAN) and MAAT
or pH could only be obtained locally for some of the indi-
vidual transects. This suggests that these indices cannot be
used as palaeoproxies at the global scale using simple lin-

Published by Copernicus Publications on behalf of the European Geosciences Union.
3938                                               P. Véquaud et al.: Bacterial lipids as temperature and pH proxies in soils

1   Introduction                                                      Recent studies have unveiled the potential of another fam-
                                                                   ily of bacterial lipids – 3-hydroxy fatty acids (3-OH FAs) –
                                                                   for temperature and pH reconstructions in terrestrial (Wang
Investigating past climate variations is essential to under-       et al., 2016, 2018; Huguet et al., 2019) and marine (Yang
stand and predict future environmental changes, especially in      et al., 2020) settings; 3-OH FAs with 10 to 18 carbon
the context of global anthropogenic change. Direct records of      atoms are specifically produced by Gram-negative bacteria
environmental parameters are available for the last decades,       and are bound to the lipopolysaccharide (LPS) by ester or
the so-called “instrumental” period. Beyond this period,           amide bonds (Wollenweber et al., 1982; Wollenweber and
proxies can be used to obtain indirect information on envi-        Rietschel, 1990). Three types of 3-OH FAs can be distin-
ronmental parameters. A major challenge is to develop re-          guished with either normal chains or branched chains, iso or
liable proxies which can be applied to continental environ-        anteiso.
ments in addition to marine ones. Indeed, available prox-             The analysis of 3-OH FAs in soils showed that the ratio of
ies have been mainly developed and used in marine settings         C15 or C17 anteiso 3-OH FA to normal C15 or C17 3-OH FA
as the composition and mechanism of formation of marine            (RAN15 and RAN17 indices, respectively) were negatively
sedimentary cores are less complex than in continental set-        correlated with MAAT along the three mountains investi-
tings, which are highly heterogeneous. Several environmen-         gated so far: Mt. Shennongjia (China; Wang et al., 2016),
tal proxies based on organic (e.g. the alkenone unsaturation       Mt. Rungwe and Mt. Majella (Tanzania and Italy, respec-
           0
index (Uk37 ; Brassell et al., 1986) and inorganic (Mg/Ca ra-      tively; Huguet et al., 2019). This suggests that Gram-negative
tio and 18 O/16 O ratio of foraminifera; Emiliani, 1955; Erez      bacteria producing these fatty acids respond to colder tem-
and Luz, 1983) fossil remains were notably developed for the       peratures with an increase in anteiso-C15 /C17 vs. n-C15 /C17
reconstruction of sea surface temperatures.                        3-OH FAs in order to maintain a proper fluidity and opti-
   Some of the existing proxies are based on membrane lipids       mal state of the bacterial membrane, the so-called homeo-
synthesized by certain microorganisms (Eglinton and Eglin-         viscous adaptation mechanism (Sinensky, 1974; Hazel and
ton, 2008; Schouten et al., 2013). These microorganisms are        Eugene Williams, 1990). Nevertheless, the relationships be-
able to adjust the composition of their membrane lipids in         tween RAN15 and MAAT along the three mountain transects
response to the prevailing environmental conditions in order       showed the same slopes but different intercepts (Wang et al.,
to maintain an appropriate fluidity and to ensure the optimal      2016; Huguet et al., 2019), suggesting that regional or local
state of the cellular membrane (Singer and Nicolson, 1972;         RAN15 relations may be more appropriate to apply for tem-
Sinensky, 1974; Hazel and Williams, 1990; Denich et al.,           perature reconstructions in terrestrial settings. In contrast, a
2003). The structure of glycerol dialkyl glycerol tetraethers      significant calibration between RAN17 and MAAT could be
(GDGTs), which are membrane lipids biosynthesized by ar-           established using combined data from the three mountain re-
chaea and some bacteria, is especially known to be related to      gions (Wang et al., 2016; Huguet et al., 2019).
environmental conditions. Archaeal GDGTs are constituted              Another index, defined as the cologarithm of the sum of
of isoprenoid alkyl chains ether-linked to glycerol, whereas       anteiso and iso 3-OH FAs divided by the sum of normal
bacterial GDGTs are characterized by branched alkyl chains         homologues (RIAN index), was shown to be strongly nega-
instead of isoprenoid ones. The latter compounds are ubiqui-       tively correlated with soil pH along the three aforementioned
tous in terrestrial (Weijers et al., 2007; Peterse et al., 2012;   mountains (Wang et al., 2016; Huguet et al., 2020), reflect-
De Jonge et al., 2014; Naafs et al., 2017) and aquatic envi-       ing a general relative increase in normal homologues com-
ronments (Peterse et al., 2009; Tierney and Russell, 2009;         pared to branched (iso and anteiso) ones with increasing pH.
Sinninghe Damsté et al., 2009; Loomis et al., 2012; Peterse        This mechanism was suggested to reduce the permeability
et al., 2015; Weber et al., 2015). These branched GDGTs            and fluidity of the membrane for the cell to cope with lower
(brGDGTs) are produced by still unidentified bacteria, al-         pH (Russell et al., 1995; Denich et al., 2003; Beales, 2004).
though some of them may belong to the phylum Acidobacte-              For the first time, 3-OH FA indices were recently applied
ria (Sinninghe Damsté et al., 2011, 2014, 2018). The analysis      to the reconstruction of the temperature and hydrological
of brGDGTs in a large number of soils distributed worldwide        changes over the last 10 000 years in a speleothem from
showed that the relative distribution of these compounds is        China (Wang et al., 2018), showing the potential of 3-OH
mainly related to mean annual air temperature (MAAT) and           FAs as independent tools for environmental reconstruction
soil pH (Weijers et al., 2007; Peterse et al., 2012; De Jonge      in terrestrial settings. A very recent study based on marine
et al., 2014). Even though brGDGT proxies were largely in-         sediments from the North Pacific Ocean suggested that the
vestigated over the last 10 years (De Jonge et al., 2014; Dear-    distribution of 3-OH FAs could also be used to reconstruct
ing Crampton-Flood et al., 2020) and were applied to various       sea surface temperature (Yang et al., 2020).
palaeorecords (e.g, Coffinet et al., 2018; Wang et al., 2020),        Even though these results are promising, the linear regres-
new molecular proxies, independent of and complementary            sions between pH or MAAT and 3-OH FA indices in terres-
to brGDGTs, are needed to improve the reliability of temper-       trial environments are still based on a rather small dataset
ature reconstructions in terrestrial settings.                     (ca. 70 soil samples; Wang et al., 2016; Huguet et al., 2019).

Biogeosciences, 18, 3937–3959, 2021                                                   https://doi.org/10.5194/bg-18-3937-2021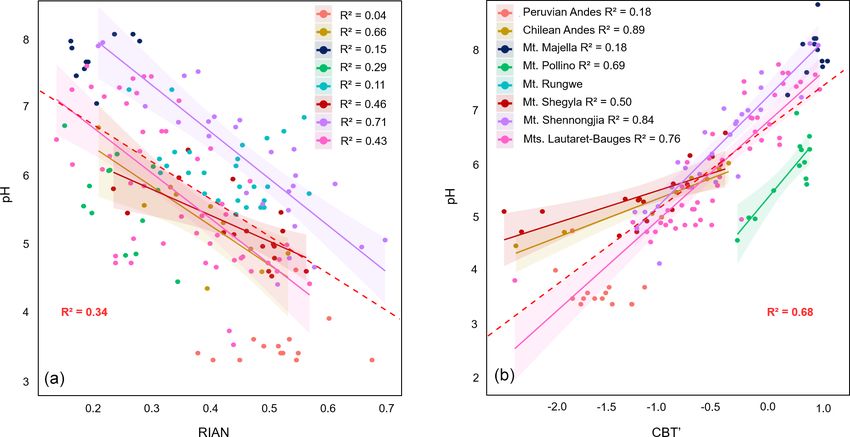
P. Véquaud et al.: Bacterial lipids as temperature and pH proxies in soils                                                      3939

The aim of this study was to investigate the applicability of       etation (over 1200 m a.s.l.) is dominated by Fagus sylvatica
3-OH FAs as MAAT and pH proxies at the global level us-             forests and, at the treeline, by scattered Pinus leucodermis
ing an extended soil dataset and refined statistical tools. The     (Bonanomi et al., 2020). The soil is poorly developed and
3-OH FA distribution from 54 soils was determined in four           dominated by calcareous soils. Between 0 and 1200 m a.s.l.
globally distributed altitudinal transects (Tibet, Italy, the Pe-   (Scalercio et al., 2014, and reference therein), Mt. Pollino
ruvian Andes and Chile) and was combined with data pre-             is characterized by the presence of Quercus ilex forests or
viously published by Wang et al. (2016; Mt. Shennongjia,            shrubs. Climate along this mountain is humid Mediterranean,
China), Huguet et al. (2019; Mt. Rungwe, Tanzania, and              with high summer temperatures and an irregular distribu-
Mt. Majella, Italy) and Véquaud et al. (2021; Mt. Bauges and        tion of rainfall throughout the year with pronounced sum-
Mt. Lautaret-Galibier, France), leading to a total of 168 sam-      mer drought (39.5 % in winter, 23.7 % in spring, 29.2 %
ples. In addition to linear regressions, non-parametric ma-         in autumn, 7.6 % in summer; average annual precipitation:
chine learning models were used to improve the global rela-         1570 mm; see Todaro et al., 2007). MAAT is comprised be-
tionships between 3-OH FA distribution and MAAT or pH.              tween 7 ◦ C (2200 m a.s.l.) and 18 ◦ C (0 m a.s.l.; Scalercio et
These models present the advantage of taking into account           al., 2014). MAAT along Mt. Pollino was estimated using a
non-linear environmental influences, in line with the intrin-       linear regression between two MAATs (16 ◦ C at 400 m a.s.l.
sic complexity of the environmental settings. Finally, these        and 10 ◦ C at 1600 m a.s.l.) from the meteorological data
new models were tested and compared by applying them                (Castrovillari station) recorded by Scalercio et al. (2014).
to a speleothem archive (Wang et al., 2018) representing to         The pH of the soils analysed in the present study ranges be-
date the only available MAAT record derived from 3-OH FA            tween 4.5 and 6.8 (Table 1).
proxies in a continental setting. As brGDGTs are the only              Soil samples were collected from 17 sites along Mount
microbial organic proxies which can be used for temperature         Shegyla between 3106 and 4474 m a.s.l. (south-eastern Ti-
and pH reconstructions in terrestrial settings so far, they can     bet, China), as previously described by Wang et al. (2015).
serve as a reference proxy to understand the temperature and        Different climatic zonations are observed along this high-
pH dependency of 3-OH FAs analysed in the same dataset.             altitude site (2700 to 4500 m a.s.l.): (i) a mountainous tem-
The 3-OH FAs and brGDGTs have thus been concomitantly               perate zone between 2700 and 3400 m, (ii) a subalpine cold
analysed to assess their reliability and complementarity as         temperate zone between 3400 and 4300 m, and (iii) a cold
independent temperature and pH proxies.                             alpine zone above 4300 m. Plant species such as brown oak
                                                                    (Q. semecarpifolia) or common fir (Abies alba) are abundant
                                                                    within the mountainous and subalpine levels. In the cold sub-
2     Material and methods                                          alpine zone, the forrest’s fir (Abies georgei var. smithii) is en-
                                                                    demic to western China. In the cold alpine zone, coniferous
2.1     Soil dataset                                                species (Sabina saltuaria) as well as species typical of moun-
                                                                    tainous regions such as Rhododendron are observed. MAAT
2.1.1    Study sites                                                was estimated using a linear regression between seven mea-
                                                                    sured MAATs from the data recorded by Wang et al. (2015).
The dataset of the present study is comprised of the globally       The average MAAT along the transect is 4.6 ◦ C, with a min-
distributed surface soils previously analysed for brGDGTs           imum of 1.1 ◦ C at ca. 4500 m a.s.l. and a maximum of 8.9 ◦ C
and 3-OH FAs and collected along four altitudinal transects:        at ca. 3100 m a.s.l. (Table 1). Soil pH ranges between 4.6 and
Mt. Shennongjia (China; Yang et al., 2015; Wang et al.,             6.4 (Table 1).
2016), Mt. Rungwe (Tanzania; Coffinet et al., 2017; Huguet             Soils were sampled from 14 sites in the Peruvian Andes
et al., 2019), Mt. Majella (Italy; Huguet et al., 2019) and         along the Kosñipata transect, located in south-eastern Peru,
Mt. Bauges and Mt. Lautaret-Balibier (France; Véquaud et            in the upper part of the Madre de Dios and Madeira water-
al., 2021). This set was extended with surficial soils (0–          shed, east of the Andes Cordillera (Nottingham et al., 2015).
10 cm) from four additional altitudinal transects described         This transect (190 m to 3700 m a.s.l.) is well documented and
below, located in Italy, Tibet, Peru and Chile (Table 1).           is the object of numerous ecological studies (Malhi et al.,
   Soil samples were collected from 13 sites along Mount            2010; Nottingham et al., 2015). There is a shift in vegetation
Pollino in the Calabria region (Italy) between 0 and                zonation with increasing elevation, from tropical lowland
2200 m a.s.l. (above sea level) (Table 1). Mt. Pollino is lo-       forest to montane cloud forest and high-elevation “Puna”
cated in the calcareous Apennine range and is 2248 m a.s.l. It      grassland. The treeline lies between 3200 and 3600 m a.s.l.
is framed to the north-west by the Sierra de Prete (2181 m          For the 14 sites sampled in this study, the lower 13 sites are
high) and to the south by the Pollino Abyss. The alpine             forest, and the highest site is grassland. The 14 sites are part
to subalpine area (above 2100 m a.s.l.) is characterized by         of a network of 1 ha forest plots (Nottingham et al., 2015); for
the presence of Mediterranean grasslands (Festuca bosniaca,         each 1 ha plot, 0–10 cm surface soil was sampled from five
Carex kitaibeliana) and the presence of sinkholes (Todaro           systematically distributed locations within each 1 ha plot.
et al., 2007; Scalercio et al., 2014). The mountainous veg-         Mean annual precipitation does not vary significantly with al-

https://doi.org/10.5194/bg-18-3937-2021                                                     Biogeosciences, 18, 3937–3959, 2021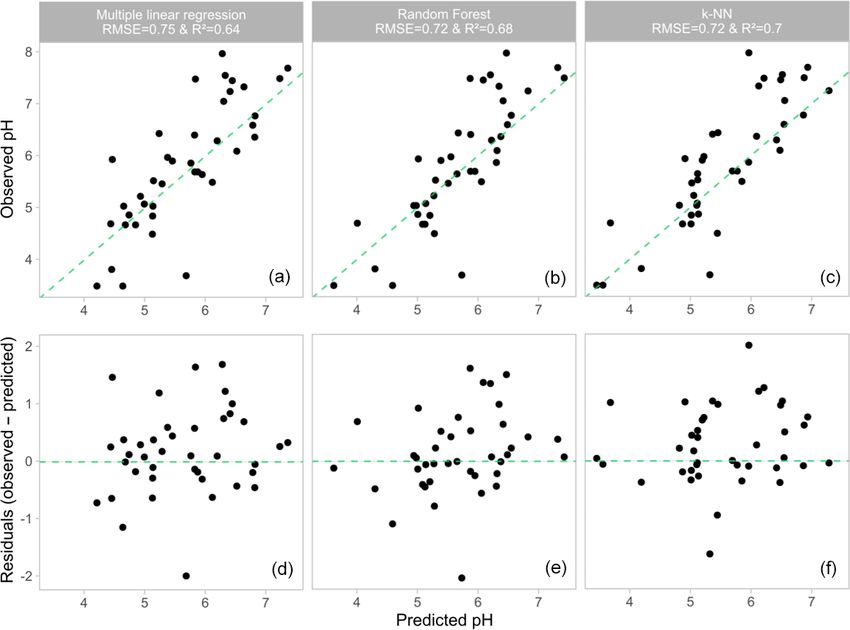
3940                                                     P. Véquaud et al.: Bacterial lipids as temperature and pH proxies in soils

Table 1. List of the soil samples collected along Mt. Shegyla, Mt. Pollino, the Peruvian Andes and the Chilean Andes, with corresponding
altitude (m), MAAT (◦ C), pH, and 3-OH-FA- and brGDGT-derived indices.

                ID   Location             Altitude (m)    MAAT (◦ C)    pH    RAN15    RAN17    RIAN    MBT’5Me    CBT’
                1    Peruvian Andes               194           26.4    3.7     2.45     0.96    0.47       0.96   −1.09
                2    Peruvian Andes               210           26.4      4     2.56     0.61    0.60       0.97   −1.92
                3    Peruvian Andes              1063           20.7    4.7     3.46     0.70    0.54       0.98   −1.76
                4    Peruvian Andes              1500           17.4    3.5     4.15     0.93    0.51       0.91   −1.55
                5    Peruvian Andes              1750           15.8    3.6     5.30     1.32    0.51       0.92   −1.62
                6    Peruvian Andes              1850             16    3.5     6.81     1.23    0.54       0.96   −1.76
                7    Peruvian Andes              2020           14.9    3.4     7.00     1.19    0.54       0.95   −1.68
                8    Peruvian Andes              2520           12.1    3.7     8.40     1.59    0.53       0.74   −1.42
                9    Peruvian Andes              2720           11.1    3.6     8.42     1.73    0.48       0.83   −1.45
                10   Peruvian Andes              3020            9.5    3.4    13.78     2.21    0.44       0.83   −1.21
                11   Peruvian Andes              3200            8.9    3.5     6.91     2.35    0.37       0.71   −1.48
                12   Peruvian Andes              3025           11.1    3.5     8.86     1.74    0.52       0.82   −1.66
                13   Peruvian Andes              3400            7.7    3.4     9.10     2.39    0.40       0.71   −1.39
                14   Peruvian Andes              3644            6.5    3.4     8.93     2.03    0.67       0.58   −1.21
                15   Mt. Shegyla, Tibet          3106            8.9   5.53     6.22     2.02    0.51       0.59   −0.83
                16   Mt. Shegyla, Tibet          3117            8.9   6.43     4.47     1.86    0.36       0.57   −0.35
                17   Mt. Shegyla, Tibet          3132            8.8   6.01     4.07     1.72    0.43       0.61   −0.47
                18   Mt. Shegyla, Tibet          3344            7.6   6.03     5.40     2.80    0.34       0.51   −0.67
                19   Mt. Shegyla, Tibet          3355            7.5   5.87     4.09     2.71    0.23       0.44   −0.39
                20   Mt. Shegyla, Tibet          3356            7.5   5.52     3.87     2.14    0.25       0.42   −0.70
                21   Mt. Shegyla, Tibet          4030            3.7   5.21     8.21     3.64    0.43       0.49   −1.10
                22   Mt. Shegyla, Tibet          4046            3.6   4.68     8.37     3.00    0.49       0.52   −1.17
                23   Mt. Shegyla, Tibet          4050            3.6   4.61     8.94     2.47    0.50       0.44   −1.33
                24   Mt. Shegyla, Tibet          3912            4.3   5.04     9.74     2.30    0.48       0.40   −2.39
                25   Mt. Shegyla, Tibet          3918            4.3   4.68     8.67     1.80    0.56       0.45   −2.23
                26   Mt. Shegyla, Tibet          4298            2.1   5.04    10.00     2.78    0.50       0.45   −2.04
                27   Mt. Shegyla, Tibet          4295            2.2   4.87    12.17     3.90    0.50       0.42   −1.07
                28   Mt. Shegyla, Tibet          4304            2.1   5.26    10.10     3.20    0.46       0.46   −1.14
                29   Mt. Shegyla, Tibet          4479            1.1   5.26    10.11     3.42    0.52       0.35   −1.27
                30   Mt. Shegyla, Tibet          4479            1.1   5.07     5.71     3.00    0.50       0.35   −0.84
                31   Mt. Shegyla, Tibet          4474            1.1   5.24     7.88     3.65    0.42       0.32   −1.15
                32   Mt. Pollino, Italy             0            18    6.78     2.71     1.19    0.15       0.50    0.31
                33   Mt. Pollino, Italy           200            17    6.19     2.41     1.28    0.30       0.63    0.34
                34   Mt. Pollino, Italy           400            16    6.13     4.26     2.29    0.22       0.58    0.35
                35   Mt. Pollino, Italy           600            15    6.14     4.15     2.36    0.22       0.55    0.43
                36   Mt. Pollino, Italy           800            14    4.53     3.34     2.77    0.34       0.51   −0.24
                37   Mt. Pollino, Italy          1000            13    5.41     3.06     1.83    0.28       0.48    0.10
                38   Mt. Pollino, Italy          1200            12    6.37     4.21     1.91    0.24       0.55    0.43
                39   Mt. Pollino, Italy          1400            11    5.62     5.77     4.16    0.18       0.52    0.40
                40   Mt. Pollino, Italy          1600            10    4.93     7.64     4.54    0.27       0.44   −0.13
                41   Mt. Pollino, Italy          1800              9   4.91     3.45     3.17    0.25       0.45   −0.07
                42   Mt. Pollino, Italy          2000              8   5.52     6.35     4.52    0.19       0.56    0.40
                43   Mt. Pollino, Italy          2100            7.5   5.91    10.26     3.62    0.19       0.42    0.38
                44   Mt. Pollino, Italy          2200              7   5.85     6.21     2.82    0.31       0.47    0.34
                45   Chilean Andes                690            9.2   5.38     5.01     3.51    0.42       0.41   −0.80
                46   Chilean Andes                870            8.9   5.62     5.21     2.43    0.39       0.49   −0.52
                47   Chilean Andes                891            7.9   4.94     5.18     2.69    0.53       0.44   −0.94
                48   Chilean Andes                915            NA    6.75     4.67     4.25    0.21        NA      NA
                49   Chilean Andes                980            8.5   5.63     3.87     3.83    0.28       0.46   −0.66
                50   Chilean Andes                985            5.8   4.67     6.41     3.12    0.48       0.41   −1.83
                51   Chilean Andes               1125            6.0   5.00     3.83     4.18    0.46       0.42   −1.02
                52   Chilean Andes               1151            6.0   5.89     4.74     2.89    0.33       0.43   −0.32
                53   Chilean Andes               1196            7.1   5.79     5.70     4.07    0.34       0.43   −0.40
                54   Chilean Andes               1385            NA    4.43     4.85     1.91    0.39       0.41   −2.28

Biogeosciences, 18, 3937–3959, 2021                                                         https://doi.org/10.5194/bg-18-3937-2021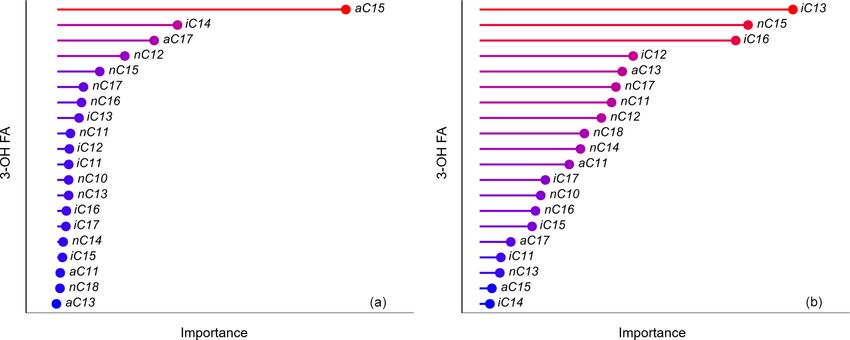
P. Véquaud et al.: Bacterial lipids as temperature and pH proxies in soils                                                 3941

titude (mean = 2448 mm yr−1 , SD = 503 mm yr−1 ; Rapp and         added just before injection as a proportion of 3 µL of standard
Silman, 2012; Nottingham et al., 2015). MAAT is comprised         to 100 µL of sample, as detailed by Huguet et al. (2019). The
between 26.4 ◦ C at 194 m altitude and 6.5 ◦ C at 3644 m alti-    different 3-OH FAs were identified based on their retention
tude (Table 1). The pH is characteristic of acidic soils (3.4–    time after extraction of the characteristic m/z 175 fragment
4.7; Table 1). Further information on these sites and soils is    (m/z 178 for the deuterated internal standard; cf. Huguet et
available in Nottingham et al. (2015).                            al., 2019).
   Soil samples were collected from 10 sites between 690 m           The RIAN index was calculated as follows (Wang et al.,
and 1385 m a.s.l. from the lake shore (20 to 50 m offshore)       2016; Eq. 1) in the range C10 –C18 :
of 10 Andean lakes located in Chile (38–39◦ S) within the
temperate forest (Table 1). High-frequency measurements of        RIAN = − log[(I + A)/N],                                   (1)
MAAT over a period of 1 year are available for the different
                                                                  where I , A and N represent the sum of all iso, anteiso and
sampling sites. MAAT is comprised between 5.75 and 9.2 ◦ C.
                                                                  normal 3-OH FAs, respectively.
Soil pH ranges between 4.4 and 6.8 (Table 1).
                                                                     RAN15 and RAN17 indices are defined as follows (Wang
2.1.2    pH measurement                                           et al., 2016; Eqs. 2 and 3):

Following sampling, soils were immediately transported to         RAN15 = [anteiso C15 ]/[normal C15 ]                       (2)
the laboratory and stored at −20 ◦ C. Soil samples from the       RAN17 = [anteiso C17 ]/[normal C17 ].                      (3)
Peruvian Andes, Mt. Pollino and Mt. Shegyla were then
freeze-dried, ground and sieved at 2 mm. The pH of the            Analytical errors associated with the calculation of RIAN,
freeze-dried samples was measured in ultrapure water with         RAN15 and RAN17 indices are respectively 0.006, 0.3 and
a 1 : 2.5 soil–water ratio. Typically, 10 mL of ultrapure water   0.2 based on the analysis of one sample injected nine times
were added to 4 g of dry soil. The soil solution was stirred      during the analysis and five samples injected in triplicate.
for 30 min before decantation for one hand pH measurement
                                                                  2.2.2   brGDGT analysis
(Carter et al., 2007).
                                                                  Sample preparation for brGDGT analysis was similar to
2.2     Lipid analyses
                                                                  that reported by Coffinet et al. (2014). Briefly, ca. 5–10 g
The brGDGTs and 3-OH FAs were analysed in all samples             of soil was extracted using an accelerated solvent extrac-
from the Peruvian Andes, Chilean Andes, Mt. Pollino and           tor (ASE 100, Thermo Scientific Dionex, USA) with a
Mt. Shegyla.                                                      dichloromethane (DCM)–methanol (MeOH) mixture (9 : 1)
                                                                  for 3 × 5 min at 100 ◦ C at a pressure of 100 bars in 34 mL
2.2.1    3-OH FA analysis                                         cells. The total lipid extract was rotary-evaporated and sepa-
                                                                  rated into two fractions of increasing polarity on a column of
Sample preparation for 3-OH FA analysis was identical             activated alumina: (i) 30 mL of heptane : DCM (9 : 1, v : v);
to that reported by Huguet et al. (2019) and Véquaud et           (ii) 30 mL of DCM : MeOH (1 : 1, v : v). GDGTs are con-
al. (2021). Soil samples were subjected to acid hydrolysis        tained in the second fraction, which was rotary evaporated.
(3 M HCl) and extracted with organic solvents. This organic       An aliquot (300 µL) was re-dissolved in heptane and cen-
fraction was then rotary-evaporated, methylated in a 1 M          trifuged using an Eppendorf MiniSpin centrifuge (Eppendorf
HCl–MeOH solution at 80 ◦ C for 1 h and separated into three      AG, Hamburg, Germany) at 7000 rpm for 1 min.
fractions over an activated silica column: (i) 30 mL of hep-         GDGTs were then analysed by high-pressure liquid chro-
tane : EtOAc (98 : 2), (ii) 30 mL of EtOAc and (iii) 30 mL        matography coupled with mass spectrometry with an atmo-
of MeOH. The 3-OH FAs contained in the second frac-               spheric pressure chemical ionization source (HPLC–APCI-
tion were derivatized at 70 ◦ C for 30 min with a solu-           MS) using a Shimadzu LCMS 2020. GDGT analysis was
tion of N,O- bis(trimethylsilyl)trifluoroacetamide (BSTFA)        performed using two Hypersil GOLD silica columns in tan-
– trimethylchlorosilane (TMCS) 99 : 1 (Grace Davison Dis-         dem (150 mm × 2.1 mm, 1.9 µm; Thermo Finnigan, USA),
covery Science, USA) before gas chromatography–mass               thermally controlled at 40 ◦ C, as described by Huguet et
spectrometry (GC–MS) analysis.                                    al. (2019). This methodology enables the separation of 5- and
   We analysed 3-OH FAs with an Agilent 6890N GC-                 6-methyl brGDGTs. Semi-quantification of brGDGTs was
5973N using a Restek RXI-5 Sil MS silica column                   performed by comparing the integrated signal of the respec-
(60 m × 0.25 mm, 0.25 µm inner diameter film thickness), as       tive compound with the signal of a C46 synthesized internal
previously described (Huguet et al., 2019). The 3-OH FAs          standard (Huguet et al., 2006) assuming their response fac-
were quantified by integrating the appropriate peak on the        tors to be identical.
ion chromatogram and comparing the area with an internal             The MBT’5Me index, reflecting the average number of
standard (3-hydroxytetradecanoic acid, 2,2,3,4,4-d5; Sigma-       methyl groups in 5-methyl isomers of GDGTs and consid-
Aldrich, France). The internal standard (0.5 mg/mL) was           ered to be related to MAAT, was calculated according to De

https://doi.org/10.5194/bg-18-3937-2021                                                  Biogeosciences, 18, 3937–3959, 2021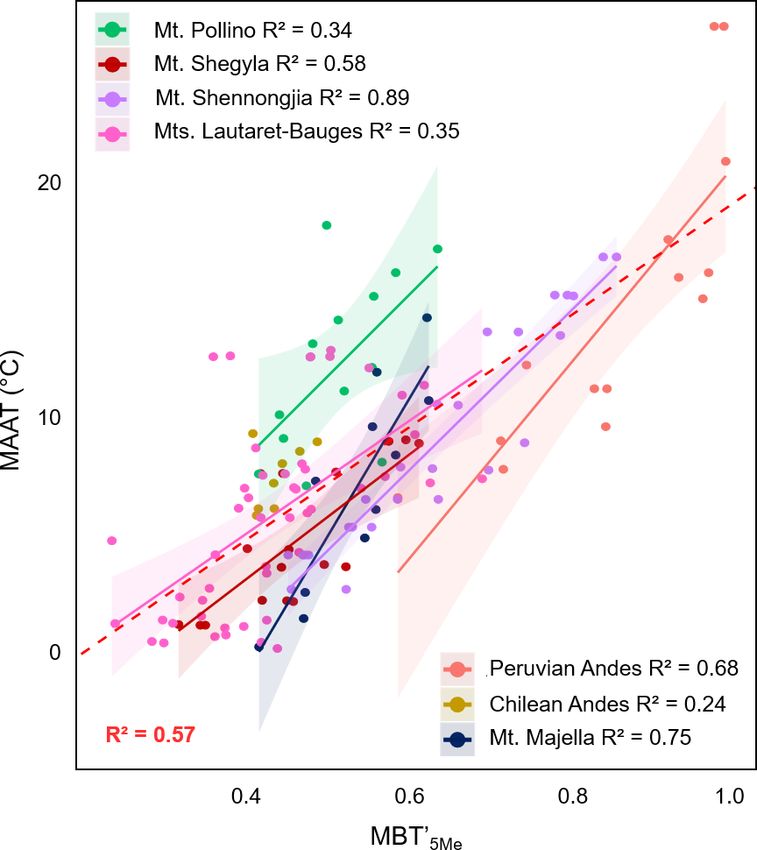
3942                                                      P. Véquaud et al.: Bacterial lipids as temperature and pH proxies in soils

Jonge et al. (2014; Eq. 4):                                               constituted to estimate the output associated with a new input
                                                                          x. The method of the k-nearest neighbours takes into account
                             [Ia+Ib+Ic]                                   the k training samples whose input is the closest to the new
MBT05Me =                                             .           (4)
                 [Ia+Ib+Ic ] + [IIa+IIb+IIc] + [IIIa]                     input x, according to a distance to be defined. This method is
                                                                          non-parametric and is used for classification and regression.
The CBT’ index, reflecting the average number of cy-
                                                                          In k-NN regression, the result is the value for this object,
clopentyl rings in GDGTs and considered to be related to
                                                                          which is the average of the values of the k-nearest neigh-
pH, was calculated as follows (De Jonge et al., 2014; Eq. 5):
                                                                          bours. Its constraints lie in the fact that, by definition, if a
CBT0 =                                                                    range of values is more frequent than the others, then it will
                                                                          be statistically predominant among the k closest neighbours.
          [Ic] + IIa0 + IIb0 + IIc0 + IIIa0 + IIIb0 + IIIc0

log                                                             . (5)     To overcome this limitation of the k-NN method, data selec-
                          ([Ia] + [IIa] + [IIIa])                         tion was performed randomly on the dataset with a stratifi-
The Roman numerals correspond to the different GDGT                       cation modality according to the MAAT or the pH. This ap-
structures presented in De Jonge et al. (2014). The 6-methyl              proach allows the limitation of the impact of extreme values
brGDGTs are denoted by an apostrophe after the Roman nu-                  as detailed below.
merals for their corresponding 5-methyl isomers. Analytical                  The random forest algorithm is also a supervised learning
errors associated with the calculation of MBT’5Me and CBT’                method used, among other things, for regressions (e.g. Ho,
indices are 0.015 and 0.02, respectively, based on the analy-             1995; Breiman, 2001; Denisko and Hoffman, 2018). This
sis of three samples in triplicate among the 44 soil samples.             model works by constructing a multitude of decision trees
                                                                          at training time and producing the mean prediction of the
2.3       Statistical analysis                                            individual trees. Decision tree learning is one of the predic-
                                                                          tive modelling approaches used to move from observations to
In order to investigate the correlations between environmen-              conclusions about the target value of an item. Decision trees
tal variables (pH, MAAT) and the relative abundances of bac-              where variables are continuous values are called regression
terial lipids (brGDGTs and 3-OH FAs) or the indices based                 trees.
on these compounds, pairwise correlation matrices were per-                  The training phase required for the random forests, k-
formed in addition to single or multiple linear regressions. As           NN and multiple linear regression was performed on 75 %
the dataset is not normally distributed, Spearman correlation             of the sample set with an iteration of 10 cross-validations
was used with a confidence level of 5 %.                                  per model. Data selection was performed randomly on the
   Principal component analyses (PCAs) were performed on                  dataset (with no pre-processing of the individual 3-OH FAs)
the different soil samples to statistically compare the 3-OH              but with a stratification modality according to the MAAT or
FA and brGDGT distributions along the different altitudinal               the pH to limit the impact of extreme values on the different
transects. The fractional abundances of the bacterial lipids              models used. Then, the robustness and precision of the dif-
(3-OH FAs and brGDGTs) were used for these PCAs, with                     ferent models were tested on the remaining 25 % of samples,
MAAT, pH and location of the sampling site representing                   considered to be an independent dataset. Simple and multi-
supplementary variables (i.e. not influencing the principal               ple linear regressions, PCA, k-NN and random forest mod-
components of the analysis).                                              els were performed with R software, version 3.6.1 (R Core
   Independent models should be used for the development                  Team, 2014), using the packages tidymodels (version 0.1.0),
of environmental calibrations as each of them has its own ad-             kknn (version 1.3.1) and ranger (version 0.11.2). A web ap-
vantages and limits. Linear regression methods are simple to              plication is available online (https://athibault.shinyapps.io/
use, but many of them suffer from the phenomenon of regres-               paleotools, last access: 12 April 2021) for the reconstruction
sion dilution, as previously noted (Naafs et al., 2017; Dearing           of 3-OH FA-derived MAAT using the machine learning mod-
Crampton-Flood et al., 2020). That is why other models than               els proposed in the present study.
ordinary least squares or single or multiple regression were
also proposed in this study (cf. Sect. 4.2. for discussion of the
models): the k-nearest neighbour (k-NN) and random forest                 3     Results
models. These models are based on machine learning algo-
rithms, which are built on a proportion of the total dataset              3.1     Distribution of bacterial lipids
(randomly defined, i.e. training dataset) and then tested on
the rest of the dataset, considered to be independent (test               3.1.1    3-OH FAs
dataset).
   The k-NN model is based on the estimation of the mean                  Representing 8 elevation transects and 168 samples, 3-OH
distances between the different samples. This is a supervised             FAs were identified in the whole dataset (Supplement Ta-
learning method (e.g. Gangopadhyay et al., 2009). A train-                ble S1; Yang et al., 2015; Wang et al., 2016; Coffinet et
ing database composed of N “input–output” pairs is initially              al., 2017; Huguet et al., 2019; Véquaud et al., 2021). Their

Biogeosciences, 18, 3937–3959, 2021                                                           https://doi.org/10.5194/bg-18-3937-2021
P. Véquaud et al.: Bacterial lipids as temperature and pH proxies in soils 3943
chain lengths range between 8 and 26 C atoms, indicat- isomers were more abundant than the 6-methyl isomers
ing that these compounds have various origins (bacteria, for all sites except for Mt. Pollino (mean 5-methyl = 44 %,
plants and fungi; (Zelles, 1999; Wang et al., 2016, and ref- SD = 11.7 %) and Mt. Majella (mean 5-methyl = 33.7 %,
erence therein). The homologues of 3-OH FAs with 10 to SD = 5.5 %; Fig. 2).
18 C atoms are considered to be produced exclusively by
Gram-negative bacteria (Wollenweber and Rietschel, 1990; 3.2 3-OH-FA- and brGDGT-derived indices
Szponar et al., 2003) and will be the only ones consid-
ered in the following. Compounds with an even carbon 3.2.1 3-OH FAs
number and normal chains were the most abundant 3-OH
The RIAN index varied between 0.1 and 0.8 among the eight
FAs in all samples (mean = 67.9 % of the total 3-OH FAs,
elevation transects (Table 1). The RIAN index ranged from
standard deviation (SD) = 6.8 %), with a predominance of
0.37 to 0.67 for the Peruvian Andes, 0.23 to 0.56 for Mt. She-
the n-C14 homologue (21.9 %, SD = 3.23 %; Fig. 1). Iso
gyla, 0.15 to 0.34 for Mt. Pollino, 0.21 to 0.53 for the Chilean
(mean = 22.9 %, SD = 5.01 %) and anteiso (mean = 6.33 %,
Andes, 0.26 to 0.80 for Mt. Rungwe (Huguet et al., 2019),
SD = 1.79 %) isomers were also present. It must be noted
0.16 to 0.46 for Mt. Majella (Huguet et al., 2019), 0.20 to
that anteiso isomers were only detected for odd carbon-
0.69 for Mt. Shennongjia (Wang et al., 2016) and 0.13 to
numbered 3-OH FAs (Yang et al., 2015; Wang et al., 2016;
0.56 for the French Alps (Véquaud et al., 2021).
Coffinet et al., 2017; Huguet et al., 2019).
The RAN15 varied greatly among the different sites (Ta-
The distribution of 3-OH FAs in the soils of the different
ble 1). It was in the same range along Mt. Rungwe (1.04-
altitudinal transects did not show a large variability (Fig. 1).
5.73) and Mt. Majella (0.68–6.43; Huguet et al., 2019). In
Thus, there was no major difference in the relative abun-
contrast, its upper limit was higher for Mt. Shennongjia
dances of most of the 3-OH FAs (i-C11 , a-C11 , n-C11 , i-C12 ,
(0.68–10.18; Wang et al., 2016), Mt. Shegyla (4.07–12.17),
a-C13 , n-C13 , i-C14 , n-C15 , i-C16 , a-C17 and n-C17 ) between
Mt. Pollino (2.41–10.26), the Peruvian Andes (2.45–13.77)
the eight study sites, even though slight differences could
and the French Alps (1.44–12.26). The range of variation in
be observed for some compounds as detailed below. For ex-
RAN15 was narrower for the Chilean Andes (3.82–6.40).
ample, the Peruvian samples were characterized by higher
The RAN17 values were similar among the different alti-
average proportions of n-C18 3-OH FA and lower contribu-
tudinal transects (Table 1), ranging from 1.72 to 3.90 along
tion of the n-C10 and n-C12 homologues than those from the
Mt. Shegyla, 0.73 to 4.75 along Mt. Majella (Huguet et
other transects. Soils from Mt. Shegyla were characterized
al., 2019), 1.19 to 4.54 along Mt. Pollino, 1.91 to 4.25 for
by lower average proportions of n-C14 3-OH FAs and higher
the Chilean Andes and 1.12 to 3.57 along Mt. Shennongjia
abundances of i-C17 compounds compared to the other tran-
(Wang et al., 2016). The range of RAN17 values was nar-
sects (Fig. 1).
rower for Mt. Rungwe (0.33–1.62; Huguet et al., 2019) and
the Peruvian Andes (0.61–2.39) and wider for the French
3.1.2 brGDGTs
Alps (0.89–6.42; Véquaud et al., 2021) compared to the other
sites.
The relative abundances of brGDGTs were compared be-
tween the same transects as for 3-OH FAs, representing a 3.2.2 brGDGTs
total of 168 samples. The 5- and 6-methyl isomers were sep-
arated in most of the samples (Fig. 2, Table S2), except in The range of variation in the MBT’5Me index was homoge-
older dataset, i.e. soils from Mt. Rungwe (Coffinet et al., neous along most transects (0.32–0.63; Table 1), except the
2014, 2017). The brGDGT data from Mt. Rungwe will not Peruvian Andes, with higher values (0.58–0.98; Table 1). Re-
be further considered in this study. garding the CBT’ index, it showed similar ranges along the
The brGDGT distribution was dominated by acyclic com- Chilean Andes (−2.28 to −0.32) and Mt. Shegyla (−2.39 to
pounds (Ia, IIa, IIa’, IIIa, IIIa’) which represent on aver- −0.35; Table 1). This index showed different ranges of vari-
age ca. 83.4 % of total brGDGTs (SD = 14.5 %; Fig. 2). The ations along the other altitudinal transects, Mt. Shennongjia
tetramethylated (Ia-c; mean = 39.3 %, SD of 20.5 %) and (−1.18 to 0.50; Yang et al., 2015), Mt. Pollino (−0.24 to
the pentamethylated (IIa–c; 44.8 %, SD = 12.8 %) brGDGTs 0.43) and the Peruvian Andes (−1.91 to −1.09). Finally, the
were predominant over the hexamethylated ones (IIIa–c; CBT’ values varied within a narrow range along Mt. Ma-
Fig. 2). The 5-methyl isomers were on average present in jella (0.23–0.59; Huguet et al., 2019) and within a wide range
a higher proportion (mean = 71.9 %, SD = 23.4 %) than the along the French Alps (−2.29 to 0.52; Véquaud et al., 2021).
6-methyl compounds (Fig. 2).
High variability in the brGDGT distribution was ob-
served among the different transects. The relative abun-
dance of brGDGT Ia was much higher in the Peruvian
soils (mean = 83 %, SD = 12.6 %) than in the other transects
(mean between 17.3 % and 61.7 %; Fig. 2). The 5-methyl
https://doi.org/10.5194/bg-18-3937-2021 Biogeosciences, 18, 3937–3959, 20213944 P. Véquaud et al.: Bacterial lipids as temperature and pH proxies in soils Figure 1. Average distribution of 3-OH FAs along the eight altitudinal transects investigated in this study. Data from Mt. Majella and Mt. Rungwe were taken from Huguet et al. (2019). Data from Mt. Shennongjia were taken from Wang et al. (2016). Data from Mt. Bauges and Mt. Lautaret-Galibier were taken from Véquaud et al. (2021). Figure 2. Average distribution of 5- and 6-methyl brGDGTs, along Mt. Shegyla, Mt. Pollino Majella, Lautaret-Bauges, the Peruvian Andes and the Chilean Andes. Data from Mt. Majella were taken from Huguet et al. (2019). Data from Mt. Shennongjia were taken from Yang et al. (2015). Data from Mt. Bauges and Mt. Lautaret-Galibier were taken from Véquaud et al. (2021). Biogeosciences, 18, 3937–3959, 2021 https://doi.org/10.5194/bg-18-3937-2021
P. Véquaud et al.: Bacterial lipids as temperature and pH proxies in soils 3945
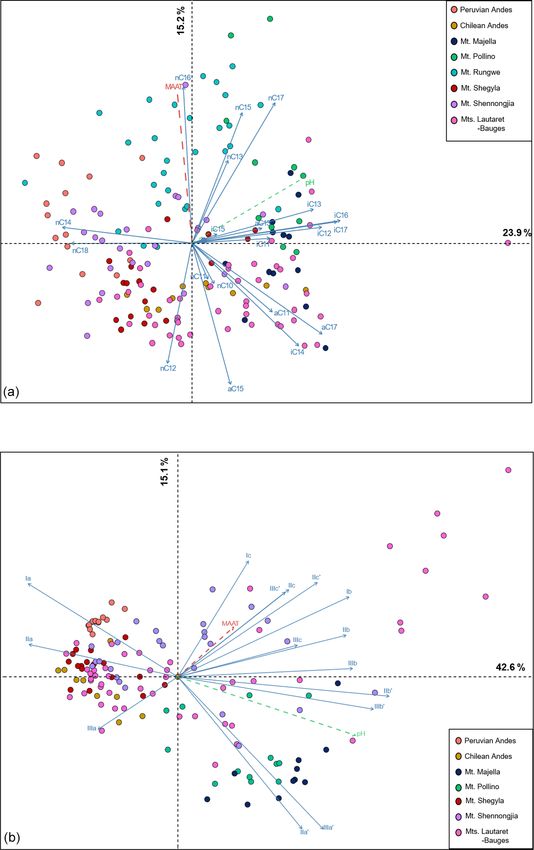
3.3 Principal component analysis and clustering of tween 3-OH-FA-derived indices and environmental variables
3-OH FA and brGDGT distribution was further investigated using an extended soil dataset, and
the corresponding results were compared with those derived
Principal component analyses were performed to refine the from the brGDGTs, used as an established reference proxy.
comparison of bacterial lipid distribution (3-OH FAs and
brGDGTs) among the different altitudinal transects. 4.1.1 Relationships between pH and bacterial
lipid-derived proxies
3.3.1 3-OH FAs
The relationship between RIAN and pH was investigated
The first two axes of the 3-OH FA PCA explained 39.1 % along each of the altitudinal transects (Fig. 4a, Table S3). No
of the total variance in the dataset (Fig. 3a). Dimension 1 significant linear relationship was obtained for the Peruvian
(23.9 %) opposed samples from Mt. Pollino in the right quad- Andes, Mt. Rungwe, Mt. Pollino and Mt. Majella (Huguet et
rant to Peruvian soils and samples from Mt. Shennongjia. al., 2019), and weak to moderate correlations were observed
Dimension 2 (15.2 %) especially separated individuals from along Mt. Shegyla and Lautaret-Bauges (R 2 = 0.29–0.46;
Chile and Mt. Rungwe. The Wilks’ test showed that the loca- Table S3). In contrast, strong regressions between RIAN and
tion of the sampling sites was the best variable discriminating pH were observed along Mt. Shennongjia (R 2 = 0.71) and
the distribution of the individuals in the PCA. in the Chilean Andes (R 2 = 0.66). A weak linear relation-
Principal component analysis performed on the tempera- ship between RIAN and pH (R 2 = 0.34, RMSE = 0.99, p =
ture (RAN15 , RAN17 ) and pH (RIAN) indices derived from 7.39 × 10⁻¹⁷ ) was also obtained when considering the 168
3-OH FAs showed that most of the variance was carried samples for the eight elevation transects altogether. There-
by the first two axes of the PCA (Axis 1 = 56.09 %, Axis fore, our results confirm the general influence of pH on the
2 = 35.29 %; Fig. S2). The first axis was highly correlated relative abundance of 3-OH FAs (Huguet et al., 2019) but
with the RAN15 (r = 0.87) and RAN17 (r = 0.93) as well as suggest that strong linear correlations between RIAN and pH
with MAAT (r = −0.67), while Axis 2 showed strong corre- can only be obtained (i) at a local level and (ii) only for some
lations with the RIAN (r = 0.96) and pH (r = −0.61). The of the sites.
PCA allowed the visualization of relationships at the scale of As previously suggested (Huguet et al., 2019), the absence
the whole dataset between MAAT and RAN15 and RAN17 or weakness of linear correlations between RIAN and pH
(r = −0.61; r = −0.64, respectively) and between pH and may be at least partly due to the small range of variation in
RIAN (r = −0.53). pH (< 2 units) along some mountains, such as Mt. Rungwe,
Mt. Majella and the Peruvian Andes (Fig. 4a, Table 1; Huguet
3.3.2 brGDGTs
et al., 2019). Transects for the Peruvian Andes and Mt. Ma-
The first two axes of the brGDGT PCA explained 57.7 % jella were also characterized by the absence of relationships
of the total variance in the dataset (Fig. 3b). Dimension 1 between pH and the brGDGT-derived CBT’ index, support-
(42.6 %) strongly discriminated soils from Mt. Majella and, ing the hypothesis that narrow pH ranges limit the potential
to a lesser extent, Mt. Pollino in the right quadrant from those of obtaining linear relationships between indices based on
from Mt. Shegyla, the Peruvian Andes and the Chilean An- bacterial lipids and pH. Nevertheless, the existence of a nar-
des in the left quadrant. Mt. Majella and Mt. Pollino were row pH range was not the only limiting factor in obtaining
also discriminated negatively along dimension 2 (15.1 %). a strong linear regression between RIAN and pH. Indeed,
Samples from Mt. Shennongjia and Lautaret-Galibier were MAAT rather than soil pH was the dominant driver of soil
distributed over the entire PCA. As for the 3-OH FAs, Wilks’ bacterial diversity and community composition for the Peru-
test showed that the location of the sampling sites was the vian transect (determined using 16S rRNA sequencing (Not-
best variable discriminating the distribution of the brGDGTs tingham et al., 2018) and phospholipid fatty acids (Whitaker
in the PCA. et al., 2014)), consistent with the weak correlation between
soil pH and bacterial lipids. The weakness of the RIAN–pH
relationship may also be partly due to the heterogeneity of
4 Discussion soils encountered along a given altitudinal transect, repre-
senting specific microenvironments, and to the large diversity
4.1 3-OH-FA- and brGDGT-derived proxies of bacterial communities in soils from different elevations
(Siles and Margesin, 2016). The distribution of 3-OH FAs
Previous studies conducted on soils from individual altitudi- varies greatly among Gram-negative bacterial species (Bhat
nal transects revealed (1) local linear relationships between and Carlson, 1992), which may account for the significant
MAAT or pH and 3-OH FA indices and (2) the potential for variability in RIAN values observed in soils from a given
combined calibrations using simple linear regressions (Wang transect. Altogether, these results suggest that linear models
et al., 2016; Huguet et al., 2019; Véquaud et al., 2021). In are not the most suitable for establishing a global calibration
the present study, the existence of linear relationships be- between RIAN and pH in soils.
https://doi.org/10.5194/bg-18-3937-2021 Biogeosciences, 18, 3937–3959, 20213946 P. Véquaud et al.: Bacterial lipids as temperature and pH proxies in soils Figure 3. PCA biplot of (a) 3-OH FA fractional abundances in soil samples from the eight altitudinal transects and (b) brGDGT fractional abundances in soil samples from seven of the eight altitudinal transects. The brGDGT data from Mt. Rungwe, for which 5- and 6-methyl isomers were not separated, were not included in the PCA. Biogeosciences, 18, 3937–3959, 2021 https://doi.org/10.5194/bg-18-3937-2021
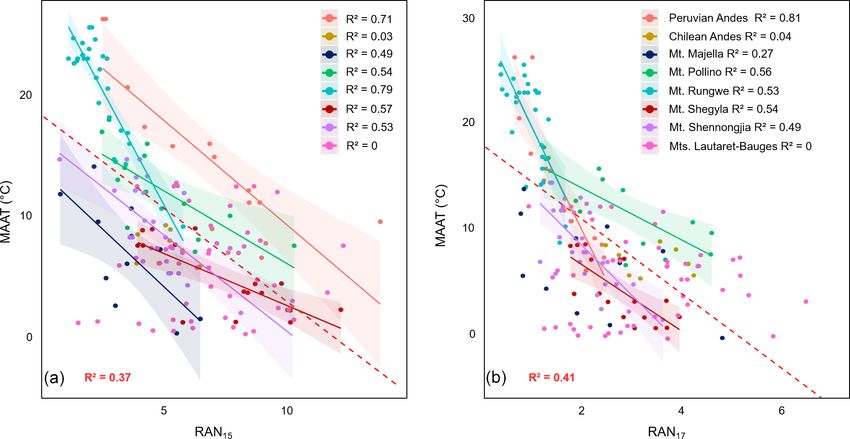
P. Véquaud et al.: Bacterial lipids as temperature and pH proxies in soils                                                          3947

Figure 4. Linear regressions between (a) pH and RIAN and (b) pH and CBT’ along the eight altitudinal transects investigated. Dotted lines
represent the 95 % confidence interval for each regression, and coloured areas represent the 95 % confidence interval for each regression.
Data for Mt. Majella and Mt. Rungwe were taken from Huguet et al. (2019). Data from Mt. Shennongjia were taken from Yang et al. (2015)
and Wang et al. (2016). Data from Mt. Bauges and Mt. Lautaret-Galibier were taken from Véquaud et al. (2021). Only significant regressions
(p < 0.05) are shown.

   Concerning GDGTs, moderate to strong relationships be-              between C10 and C18 (Wang et al., 2016). It cannot be ruled
tween brGDGT-derived CBT’ index and pH were observed                   out that some of the compounds used to calculate the RIAN
along five of the seven altitudinal transects investigated             index are preferentially synthesized, as part of the homeo-
(Fig. 4b, Table S3). All the individual linear relationships           viscous mechanism, in response to environmental variables
between CBT’ and pH, where present, had similar slopes                 other than pH. This calls for a better understanding of the
and ordinates and share (for most of the samples) the same             ecology of 3-OH-FA-producing bacteria and their adaptation
95 % confidence intervals (p value < 0.5). This resulted in            mechanisms.
a strong linear relationship between CBT’ index and pH
values for the dataset (R 2 = 0.68, RMSE = 0.71, n = 140),             4.1.2   Relationships between MAAT and bacterial
which is weaker than the global calibration (R 2 = 0.85,                       lipid-derived proxies
RMSE = 0.52, n = 221) proposed by De Jonge et al. (2014).
   The discrepancy in relationships between temperature and            RAN15 was previously shown to be correlated with MAAT
brGDGTs and 3-OH FAs might partly be due to differences                along Mt. Rungwe, Mt. Majella and Mt. Shennongjia (Wang
in the relative abundance of these lipids among bacterial              et al., 2016; Huguet et al., 2019). Moderate to strong linear
communities. The brGDGTs are produced by a more re-                    correlations (R 2 = 0.49–0.79) between RAN15 and MAAT
stricted and less diverse number of bacterial species than 3-          were also observed along most of the individual transects in-
OH FAs, which are arguably biosynthesized by a large di-               vestigated (Fig. 5a, Table S3), except along the Chilean and
versity of Gram-negative bacteria species (e.g. Wakeham et             Lautaret-Bauges transects. The individual correlations do not
al., 2003, Zelles et al., 1995; Zelles, 1999). So far, only bac-       share the same 95 % confidence intervals, and even when
teria from the Acidobacteria phylum were identified as pu-             some of them present similar slopes, the regression lines
tative brGDGT producers in soils (Sinninghe Damsté et al.,             display significantly different intercepts (p value > 0.05)
2018). The hypothetical lower diversity of brGDGT produc-              (Fig. 5a). This supports the hypothesis of a site-dependent
ers, in contrast with 3-OH FAs, might explain the more ho-             effect of the linear RAN15 –MAAT relationship previously
mogenous response and lower scatter of the relationships be-           made by Huguet et al. (2019).
tween pH and CBT’ index. Moreover, the CBT’ index is a ra-                Similarly to RAN15 , RAN17 was moderately to strongly
tio based on a restricted number of compounds, representing            correlated (R 2 = 0.53–0.81) with MAAT along five out of
the direct dependence of the degree of cyclization of bacte-           eight individual transects (Fig. 5b, Table S3). The small
rial GDGTs on pH. Conversely, the RIAN index is calculated             range of variation in MAAT along the Chilean transect (6.0–
from the relative abundances of all the individual 3-OH FAs            9.2 ◦ C) (Table 1), associated with that of the RAN15 /RAN17 ,

https://doi.org/10.5194/bg-18-3937-2021                                                         Biogeosciences, 18, 3937–3959, 2021
3948                                                 P. Véquaud et al.: Bacterial lipids as temperature and pH proxies in soils

Figure 5. Linear regressions between (a) MAAT and RAN15 and (b) MAAT and RAN17 along the eight altitudinal transects investigated.
Dotted lines represent the 95 % confidence interval for each regression, and coloured areas represent the 95 % confidence interval for each
regression. Data from Mt. Majella and Mt. Rungwe were taken from Huguet et al. (2019). Data from Mt. Shennongjia were taken from
Wang et al. (2016). Data from Mt. Bauges and Mt. Lautaret-Galibier were taken from Véquaud et al. (2021). Only significant regressions
(p < 0.05) are shown.

could explain the lack of a linear relationship between the             tions based on RAN15 or RAN17 may be more appropriate
MAAT and these indices. As for the French Alps (Mt. Bauges              for palaeotemperature reconstructions in soils.
and Mt. Lautaret-Galibier), the influence of local environ-                The difficulties in establishing global linear
mental parameters (pH and to a lesser extent soil moisture              RAN15 /RAN17 –MAAT calibrations may partly be due
and grain size, related to vegetation and soil types, or thermal        to the fact that microbial diversity, especially for 3-OH-
regimes associated with the snow cover) on 3-OH FA dis-                 FA-producing Gram-negative bacteria (Margesin et al.,
tribution was shown to be predominant over that of MAAT                 2009; Siles and Margesin, 2016), can vary greatly from one
(Véquaud et al., 2021). In contrast with RAN15 , the lin-               soil to another, resulting in variation in the RAN15 /RAN17
ear regressions between RAN17 and MAAT along Mt. She-                   indices, as also assumed for the RIAN. The strong regional
gyla, Mt. Shennongjia, Mt. Rungwe and the Peruvian Andes                dependence of the 3-OH FA distribution may thus explain
transects share confidence intervals at 95 % and have simi-             the weak correlation between 3-OH-FA-derived indices
lar slope and intercept values (p value < 0.05; Fig. 5b, Ta-            (RAN15 , RAN17 and RIAN) and environmental variables
ble S3), suggesting that RAN17 could be a more effective                (MAAT or pH) at a global level. This regional dependency
global proxy for MAAT reconstructions than RAN15 .                      was further supported by the PCA of the relative abundance
   In order to test the hypothesis that RAN17 rather than               of 3-OH FAs across the global dataset, which showed that
RAN15 is a more effective global proxy for MAAT, the global             the individuals were grouped based on the sampling location
calibrations between RAN15 /RAN17 and MAAT based on                     (Fig. 3a).
the entire soil dataset (n = 168) were compared. The two                   In addition to 3-OH FAs, the relationships between
linear regressions had similar moderate determination co-               brGDGT distribution and MAAT were investigated along
efficients (R 2 = 0.37 and 0.41 for RAN15 and RAN17 , re-               the seven transects for which the 5- and 6-methyl brGDGT
spectively) and similar high RMSE (RMSE = 5.46 ◦ C and                  isomers were separated (Mt. Shegyla, Mt. Pollino Majella,
5.28 ◦ C for RAN15 and RAN17 , respectively; Table S3).                 Lautaret-Bauges, Mt. Shennongjia, the Peruvian Andes and
For all transects (except for the Mt. Majella RAN17 –                   the Chilean Andes). These individual transects showed mod-
MAAT relationship), the individual local regressions be-                erate to strong relationships between MAAT and MBT’5Me
tween RAN15 /RAN17 and MAAT outperformed the pro-                       (R 2 0.35–0.89; Fig. 6 and Table S3), with similar slopes and
posed global linear calibrations in terms of determination co-          ordinates (except for the Peruvian Andes), and shared 95 %
efficients (0.49–0.81) and RMSE (1.98–3.57 ◦ C; Table S3),              confidence intervals for most of the samples. A distinct rela-
suggesting that local rather than global linear transfer func-          tionship between MBT’5Me and MAAT was observed along
                                                                        the Peruvian Andes and Mt. Majella transects (Fig. 6a), as

Biogeosciences, 18, 3937–3959, 2021                                                         https://doi.org/10.5194/bg-18-3937-2021
P. Véquaud et al.: Bacterial lipids as temperature and pH proxies in soils 3949
accurate than those obtained between the RAN15 /RAN17 and
MAAT (Table S3). This confirms that the MBT’5Me index
can be applied at a global scale using a simple linear regres-
sion model as previously shown (De Jonge et al., 2014; Naafs
et al., 2017), in contrast with the RAN15 and RAN17 proxies,
for which only strong local calibrations with MAAT were
found.
As a similar conclusion was obtained for the RIAN–pH
proxy, it appears necessary to use more complex models to
develop global calibrations between 3-OH-FA-derived prox-
ies and MAAT or pH. This novel method allows the com-
plexity and specificity of each environmental site to be taken
into account.
4.2 Development of new models for the reconstruction
of MAAT and pH from 3-OH FAs
Several complementary methods were recently used to de-
rive calibrations with environmental parameters from organic
proxies. Most calibrations between lipid distribution and en-
vironmental variables were based on simple linear regres-
sion models, most often the ordinary least square regression
(e.g. for brGDGTs: De Jonge et al., 2014; Wang et al., 2016)
as it is simple and easy to implement and understand. Other
Figure 6. Linear regressions between (a) MAAT and MBT’5Me
linear models, such as Deming regression (Naafs et al., 2017)
along seven of the eight altitudinal transects investigated. Data from
or Bayesian regression (Tierney and Tingley, 2014; Dearing
Mt. Rungwe (Coffinet et al., 2014), for which 5- and 6-methyl
brGDGTs were not separated, were not included in this graph. Dot- Crampton-Flood et al., 2020), were also used. Nevertheless,
ted lines represent the 95 % confidence interval for each regres- these single linear regression methods rely on a given index
sion, and coloured areas represent the 95 % confidence interval for (e.g. MBT’5Me or CBT’ for brGDGTs) which is correlated
each regression. Data from Mt. Majella were taken from Huguet et with environmental parameters. This represents a limitation
al. (2019). Data from Mt. Bauges and Mt. Lautaret-Galibier were as the relative distribution of bacterial lipids can be con-
taken from Véquaud et al. (2021). Data from Mt. Shennongjia were comitantly influenced by several environmental parameters
taken from Yang et al. (2015). The global soil calibration by De (e.g. Véquaud et al., 2021) and can also depend on the diver-
Jonge et al. (2014) was applied to all these transects. Only signifi- sity of the bacteria producing these compounds (Parker et al.,
cant regressions (p < 0.05) are shown. 1982; Bhat and Carlson, 1992; Zelles, 1999). In contrast, us-
ing bacterial lipid relative abundances rather than a single in-
dex in the relationships with environmental variables appears
also observed for the RIAN and RAN15 indices (Figs. 4a and less restrictive and more representative of the environmental
5a). The singularity of the Peruvian soils is also visible in the complexity. Other models can be used in this way, such as
PCA performed on the brGDGT distribution (Fig. 3b), where those based on multiple regressions (e.g. Peterse et al., 2012;
the samples from this region are pooled separately from the De Jonge et al., 2014; Russell et al., 2018), describing the re-
rest of the dataset. This specific trend is difficult to explain, lationships between one or several explained variables (e.g.
even though the Peruvian Andes are subjected to warmer cli- bacterial lipid abundances) and one or several explanatory
matic conditions (Table 1) than the other temperate transects, variables (e.g. MAAT, pH). Multiple regressions can reveal
which may in turn affect the nature of the microbial commu- the presence of linear relationships among several known
nities encountered in the soils and the bacteria lipid distri- variables but cannot take into account non-linear influences,
bution (Siles and Margesin, 2016; Hofmann et al., 2016; De which may occur in complex environmental settings. This
Jonge et al., 2019). limitation, common to all linear models, can be overcome
A moderate linear relationship between MAAT and using non-parametric methods such as some of the machine
MBT’5Me (MAAT = 24.3 × MBT’5Me − 5.03, R 2 = 0.57, learning algorithms (e.g. nearest neighbours or random for-
RMSE = 3.39 ◦ C, n = 140; Table S3) was observed after est; Dunkley Jones et al., 2020). The reliability of the latter
combining the data for the seven aforementioned altitu- models lies in the fact that they are non-linear, which helps
dinal transects. This global relationship follows a similar capture the intrinsic complexity of the environmental setting,
trend as the calibration proposed by De Jonge et al. (2014) and that they avoid the regression dilution phenomenon ob-
(MAAT = 31.45 × MBT’5Me − 8.57) and is more robust and served in most linear models. Moreover, their robustness is
https://doi.org/10.5194/bg-18-3937-2021 Biogeosciences, 18, 3937–3959, 20213950 P. Véquaud et al.: Bacterial lipids as temperature and pH proxies in soils
improved by the fact that they are built on a randomly de- This model, which takes into account the Gram-negative bac-
fined proportion of the total dataset and then tested on the rest terial 3-OH FAs (C10 -C18 ; Wilkinson et al., 1988), presents
of the dataset, considered to be independent. Last, these ma- a higher strength than the global linear relationships be-
chine learning algorithms are flexible and are continuously tween 3-OH-FA-derived indices and MAAT (R 2 = 0.37 and
evolving when adding new samples. 0.41, RMSE = 5.5 ◦ C and 5.3 ◦ C for RAN15 and RAN17 ,
As shown in Sect. 4.1., robust global calibrations between respectively; Table 2). The multiple linear regression also
3-OH-FA-derived indices (RIAN, RAN15 and RAN17 ) and improves the accuracy and robustness of MAAT prediction
MAAT or pH could not be established using a simple lin- in comparison with single linear relationships, with lower
ear regression model, contrary to what was observed with RMSE (3.0 ◦ C), variance in the residuals (9.2 ◦ C; Fig. 7d)
brGDGT-derived indices. Therefore, three different indepen- and mean absolute error (MAE; 2.3 ◦ C) than with the RAN15
dent and complementary models were tested to potentially and RAN17 calibrations (RMSE of 5.5 and 5.3 ◦ C, variance
establish stronger statistical relationships between 3-OH FA of 29.8 and 27.9 ◦ C, MAE of 4.0 and 3.9 ◦ C for RAN15 and
distributions and pH or MAAT at the global level: (i) a RAN17 , respectively; Table 2).
parametric model – multiple linear regression, (ii) two non- Similarly to the multiple linear regression model (Fig. 7a),
parametric models – random forest (e.g. Ho, 1995; (Denisko the random forest (Fig. 7b) and k-NN (Fig. 7c) calibrations
and Hoffman, 2018) and k-NN algorithms (e.g. Gangopad- are characterized by strong determination coefficients (R 2
hyay et al., 2009). As discussed above, the multiple linear 0.83 and 0.77, respectively). The variance in residuals, MAE
regression model allows the determination of linear relation- and RMSE of the random forest calibration are slightly lower
ships between MAAT or pH and the individual relative abun- than those of the multiple linear regression and k-NN mod-
dances of 3-OH FAs instead of indices derived from the els (Table 2). An advantage of the random forest algorithm
latter. As for the two non-parametric models, they present lies in the fact that the weight of the different variables used
among other things the advantage of taking into account non- to define the model can be quantified using the permutation
linear environmental influences. importance method (Breiman, 2001). The a-C15 , i-C14 , a-
The three models, based on a supervised machine learning C17 , n-C12 and n-C15 as well as to a lesser extent n-C17 ,
approach, were applied to the total soil dataset (n = 168). All n-C16 and i-C13 3-OH FAs were observed to be the homo-
the 3-OH FA homologues of Gram-negative bacterial origin logues predominantly used by the model to estimate MAAT
(i.e. with chain lengths between C10 and C18 ; Wilkinson et values (Fig. 9a). They include all the 3-OH FAs involved in
al., 1988) were included in the models, whatever their abun- the calculation of the RAN15 and RAN17 indices, especially
dance, to keep the maximum variability and take into account the a-C15 homologue. This may explain why linear relation-
the specificity and complexity of each altitudinal transect. In- ships between the RAN15 /RAN17 and MAAT could be es-
deed, the nature of the individual 3-OH FAs whose fractional tablished along some, but not all, of the altitudinal transects
abundance is mainly influenced by MAAT or pH may be site- investigated until now (Wang et al., 2016; Huguet al., 2019;
dependent, as previously observed (Véquaud et al., 2021). Véquaud et al., 2021; this study). Nevertheless, other indi-
The performances of these three models were compared with vidual 3-OH FAs than those appearing in the calculation of
those of the linear calibrations between 3-OH-FA-derived in- the RAN15 and RAN17 also have a major weight in the ran-
dices (RAN15 , RAN17 , RIAN) and MAAT or pH (Table 2). dom forest model and seem to be influenced by temperature
changes, explaining the moderate determination coefficients
4.2.1 Temperature calibrations of the global RAN15 /RAN17 –MAAT linear relationships ob-
served in this study.
The multiple linear regression model yielded a strong rela- On the whole, the strength and accuracy of the multiple
tionship between 3-OH FA relative abundances and MAAT linear regression, k-NN and random forest models are much
(Fig. 7a, Eq. 6): higher than those based on the RAN15 and RAN17 indices
(Table 2). This is likely related to the fact that the three afore-
mentioned models integrate the whole suite of 3-OH FA ho-
MAAT(◦ C) = mologues (C10 to C18 ) and thus better capture the complex-
− 59.02 × [nC10 ] + 102.1 × [iC11 ] + 2628.49 ity of the response of soil Gram-negative bacteria and their
lipid distribution to temperature changes than the RAN15 and
×[aC11 ] − 165.58 × [nC11 ] − 79.799 × [nC12 ] + 89.93
RAN17 indices. They also present the advantage of increas-
×[iC13 ] + 205.06 × [aC13 ] − 136.25 × [nC13 ] − 309.71 ing the range of temperature, which may be predicted by
× [iC14 ] − 43.16 × [nC14 ] − 9.27 × [iC15 ] − 308.53 more than 4 ◦ C in comparison with the RAN15 and RAN17
× [aC15 ] + 66.06 × [nC15 ] − 60.57 × [iC16 ] + 15.53 calibrations (Table 2). Indeed, even though the lower limit of
MAAT estimates for the three models tested in the present
× [nC16 ] + 13.52 × [iC17 ] − 228.76 × [aC17 ] − 91.12
study is slightly higher than those based on the RAN15 and
× [nC17 ] + 43.71 RAN17 indices, the upper limit of the MAAT, which can be
(n = 168; R 2 = 0.79; RMSE = 3.0 ◦ C) . (6) estimated using the multiple linear regression, random forest
Biogeosciences, 18, 3937–3959, 2021 https://doi.org/10.5194/bg-18-3937-2021You can also read


