The Portable Ice Nucleation Experiment (PINE): a new online instrument for laboratory studies and automated long-term field observations of ...
←
→
Page content transcription
If your browser does not render page correctly, please read the page content below
Atmos. Meas. Tech., 14, 1143–1166, 2021
https://doi.org/10.5194/amt-14-1143-2021
© Author(s) 2021. This work is distributed under
the Creative Commons Attribution 4.0 License.

The Portable Ice Nucleation Experiment (PINE): a new online
instrument for laboratory studies and automated long-term field
observations of ice-nucleating particles
Ottmar Möhler1 , Michael Adams2, , Larissa Lacher1, , Franziska Vogel1, , Jens Nadolny1 , Romy Ullrich1 ,
Cristian Boffo3,4 , Tatjana Pfeuffer3 , Achim Hobl3 , Maximilian Weiß5 , Hemanth S. K. Vepuri6 , Naruki Hiranuma6 ,
and Benjamin J. Murray2
1 Instituteof Meteorology and Climate Research, Karlsruhe Institute of Technology, Karlsruhe, Germany
2 School  of Earth and Environment, University of Leeds, Leeds, UK
3 Bilfinger Noell GmbH, Würzburg, Germany
4 Fermi National Accelerator Laboratory, Batavia, IL, USA
5 Palas GmbH, Karlsruhe, Germany
6 Department of Life, Earth and Environmental Sciences, West Texas A&M University, Canyon, TX, USA
 These authors contributed equally to this work.

Correspondence: Ottmar Möhler (ottmar.moehler@kit.edu)

Received: 5 August 2020 – Discussion started: 1 September 2020
Revised: 14 December 2020 – Accepted: 21 December 2020 – Published: 12 February 2021

Abstract. Atmospheric ice-nucleating particles (INPs) play         activity of mineral aerosols. Results from a first field cam-
an important role in determining the phase of clouds, which        paign conducted at the Atmospheric Radiation Measurement
affects their albedo and lifetime. A lack of data on the spatial   (ARM) Southern Great Plains (SGP) observatory in Okla-
and temporal variation of INPs around the globe limits our         homa, USA, from 1 October to 14 November 2019 with the
predictive capacity and understanding of clouds containing         latest PINE design (a commercially available PINE chamber)
ice. Automated instrumentation that can robustly measure           are also shown, demonstrating PINE’s ability to make auto-
INP concentrations across the full range of tropospheric tem-      mated field measurements of INP concentrations at a time
peratures is needed in order to address this knowledge gap. In     resolution of about 8 min with continuous temperature scans
this study, we demonstrate the functionality and capacity of       for INP measurements between −10 and −30 ◦ C. During this
the new Portable Ice Nucleation Experiment (PINE) to study         field campaign, PINE was continuously operated for 45 d in
ice nucleation processes and to measure INP concentrations         a fully automated and semi-autonomous way, demonstrat-
under conditions pertinent for mixed-phase clouds, with tem-       ing the capability of this new instrument to also be used for
peratures from about −10 to about −40 ◦ C. PINE is a cloud         longer-term field measurements and INP monitoring activi-
expansion chamber which avoids frost formation on the cold         ties in observatories.
walls and thereby omits frost fragmentation and related back-
ground ice signals during the operation. The development,
working principle and treatment of data for the PINE in-
strument is discussed in detail. We present laboratory-based       1   Introduction
tests where PINE measurements were compared with those
from the established AIDA (Aerosol Interaction and Dynam-          Atmospheric ice-nucleating particles (INPs) induce ice for-
ics in the Atmosphere) cloud chamber. Within experimen-            mation in atmospheric clouds and thus are important for ini-
tal uncertainties, PINE agreed with AIDA for homogeneous           tiating precipitation in mixed-phase clouds and determining
freezing of pure water droplets and the immersion freezing         the phase of clouds, their albedo, lifetime and other impor-
                                                                   tant properties (DeMott et al., 2010). However, the details of

Published by Copernicus Publications on behalf of the European Geosciences Union.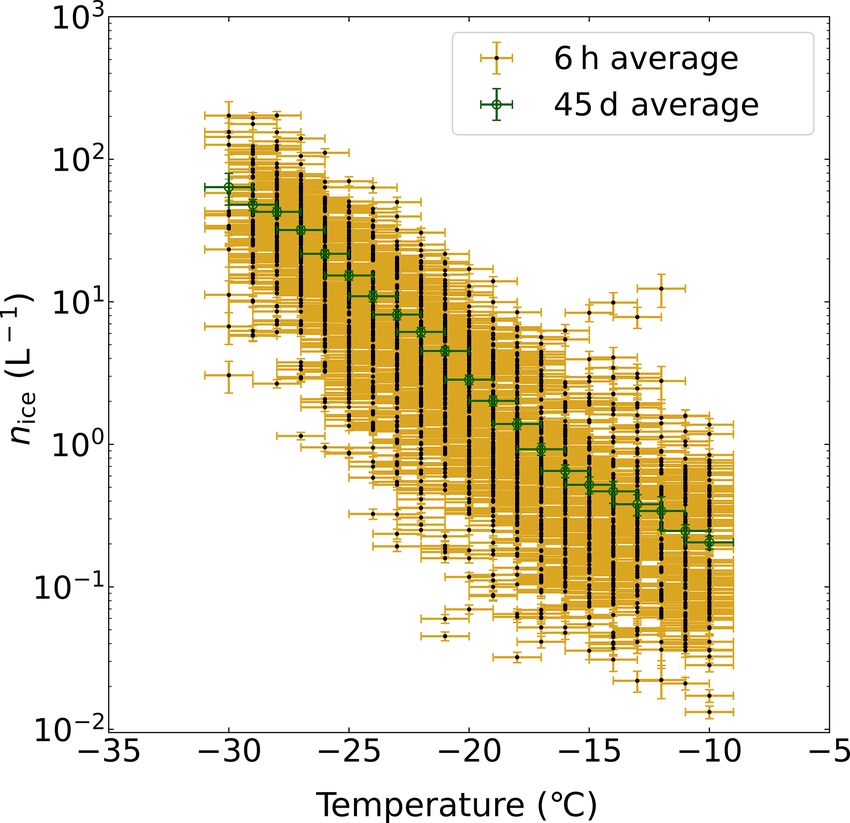
1144                                                        O. Möhler et al.: The Portable Ice Nucleation Experiment (PINE)

these aerosol–cloud–climate interactions remain highly un-             Existing parameterizations are applied in models to cal-
certain (Boucher et al., 2013; Fan et al., 2017; Lohmann,           culate and predict primary ice formation in clouds; how-
2017). This is partly due to the fact that such clouds are rather   ever, the atmospheric INP data that we can compare with
complex systems and that the knowledge on the formation,            global fields of model-predicted INP concentrations are lim-
the concentration and the fate of ice crystals is still uncertain   ited in spatial, temporal and concentration ranges (Burrows
(Heymsfield et al., 2017; Korolev et al., 2017).                    et al., 2013; Vergara-Temprado et al., 2017). Hence, there
   In the absence of homogeneous freezing, the cloud ice            is an urgent need for more INP observation and monitor-
phase is initiated in various ways by INPs, a very small frac-      ing not only for constraining INP predictions by models and
tion of atmospheric aerosol particles (Vali et al., 2015). In       representing a fuller range of INP sources in those models,
mixed-phase clouds, immersion freezing is thought to be the         but also to extend the database for a better understanding
dominating freezing mechanism (de Boer et al., 2011; Hande          of temperature-dependent INP concentrations throughout the
and Hoose, 2017; Hoose et al., 2010). Vergara-Temprado              atmosphere and the year. Existing measurements of ambi-
et al. (2018) showed INPs to have a strong control of cloud         ent INP concentrations at mixed-phase cloud temperatures
reflectivity over the Southern Ocean. Mülmenstädt et al.            (Kanji et al., 2017) show a great variability not only across
(2015) and Field and Heymsfield (2015) showed the ice or            the temperature range from about −5 to −35 ◦ C (10 orders of
snow phase to exist in a large fraction of precipitating clouds,    magnitudes), but also at a single temperature (∼ 4 orders of
in particular over the continents. This underlines the impor-       magnitude). Different aerosol types were found to dominate
tance of INPs for cloud radiative properties and precipitation      the INP population at specific temperatures.
formation, but it should be noted here that the cloud ice phase        Most of the previous INP measurements were only sensi-
not only depends on the primary ice formation by INPs, but is       tive to immersion freezing INPs in the temperature range of
also largely influenced by a cascade of secondary ice forma-        mixed-phase clouds and were carried out at boundary layer
tion and interaction processes, in particular at temperatures       field sites which were considered to be predominantly influ-
above −15 ◦ C (Field et al., 2016). Increased ice crystal con-      enced by different aerosol types. Measurements in the free
centrations can for example lead to rapid cloud glaciation and      troposphere were either performed at high-altitude mountain
associated dissipation (Campbell and Shiobara, 2008; Pauk-          stations (Boose et al., 2016a, b; DeMott et al., 2003a; Conen
ert and Hoose, 2014), as also observed recently in a labora-        et al., 2015; Lacher et al., 2018a, b) or with aircraft-based
tory cloud chamber experiment (Desai et al., 2019).                 measurements (Rogers et al., 2001; DeMott et al., 2003b;
   Throughout the troposphere, INPs are difficult to identify       Prenni et al., 2009; Pratt et al., 2010; Eidhammer et al., 2010;
and to quantify due to their low and largely variable number        Field et al., 2012), but most of them were also limited to mea-
fraction compared to the total aerosol concentration (DeMott        sure immersion freezing INPs at higher temperatures. De-
et al., 2010; Kanji et al., 2017). This fraction strongly de-       Mott et al. (2003b) also measured the concentration of INPs
pends not only on temperature and relative humidity condi-          active in the deposition mode at temperatures below −40 ◦ C.
tions, but also on the particle type, size and surface properties      The identification of INP types in ambient air remains
(Pruppacher and Klett, 2010; Holden et al., 2019). Neverthe-        challenging. Most ambient studies focus on sampling INPs in
less, cloud, weather and climate models need to formulate           campaigns over a limited time period and focus on specific
and quantify primary ice formation as accurately as possible        air masses like Saharan dust events (Boose et al., 2016b),
(Vergara-Temprado et al., 2018; Waliser et al., 2009). This         biogenic source regions (O’Sullivan et al., 2018) or marine
is achieved by calculating the abundance of INPs with pa-           environments (Mason et al., 2015; McCluskey et al., 2018),
rameterizations based on either laboratory ice-nucleation ex-       or they use back trajectories to identify source regions (e.g.
periments (Hoose and Möhler, 2012; Murray et al., 2012;             Lacher et al., 2017; Wex et al., 2019). Depending on the
Sesartic et al., 2013; Spracklen and Heald, 2014; Vergara-          specific campaign goals and objectives, different instruments
Temprado et al., 2018) or field measurements (DeMott et al.,        and methods were used, like continuous flow diffusion cham-
2010; McCluskey et al., 2018; Tobo et al., 2013; Wilson             bers (CFDCs) with higher time resolution to for example
et al., 2015). A number of different parameterizations for          characterize changing air masses (Boose et al., 2016a; Lacher
the various pathways of atmospheric ice nucleation in super-        et al., 2018b), aerosol-filter-based offline methods to achieve
cooled liquid and cirrus clouds have been developed under           high sensitivity for characterizing INPs at higher tempera-
different assumptions, based on either temperature- and time-       tures or in clean environments (Wex et al., 2019), or a com-
dependent ice formation rates according to classical nucle-         bination of both (Welti et al., 2018). What is missing so far is
ation rate formulations (Barahona and Nenes, 2009; Kärcher          the long-term monitoring of INPs with high time resolution
and Lohmann, 2002, 2003), the number concentration of               and over a wide temperature range.
larger aerosol particles (DeMott et al., 2010, 2015), or the           An increasing number of new methods and instruments for
temperature-dependent ice nucleation active site (INAS) den-        INP measurements have been developed and compared to
sity on the surface of aerosol particles (Connolly et al., 2009;    each other during the previous years (DeMott et al., 2011;
Harrison et al., 2019; Niemand et al., 2012; Ullrich et al.,        Hiranuma et al., 2015; Wex et al., 2015; DeMott et al.,
2017).                                                              2018). The most recent and comprehensive INP instrument

Atmos. Meas. Tech., 14, 1143–1166, 2021                                              https://doi.org/10.5194/amt-14-1143-2021
O. Möhler et al.: The Portable Ice Nucleation Experiment (PINE) 1145
and method intercomparison study was the Fifth Interna- 2 Basic principles and milestones of the PINE
tional Workshop on Ice Nucleation phase 2 (FIN-02), and development
many of the latest developments for atmospheric INP mea-
surements are included and described with respective refer- The idea for PINE resulted from the experience in operating
ences in the overview paper by DeMott et al. (2018). Most the AIDA facility for cloud experiments at simulated condi-
of the INP methods showed reasonable agreement with each tions of updraughting atmospheric air parcels. Cloud forma-
other, but many of them are time and operator intensive. A tion in the rigid but large AIDA chamber with a volume of
general feature is that offline methods based on aerosol fil- 84 m3 is induced in a controlled way by lowering the pres-
ter samples have poor time resolution depending on the re- sure at different rates, starting from well-controlled thermo-
quired aerosol sampling time of hours to days and require dynamic conditions (Möhler et al., 2003, 2005). With a vol-
intensive manpower and time for both operation and offline ume of only about 10 L, the PINE cloud simulation chamber
analysis. Most online instruments can only be operated peri- is much smaller, transportable and operated in a fully auto-
odically, and also require operator time during the measure- mated sequence. Similar to the AIDA cloud chamber, PINE
ments, but can be operated for INP measurements at higher also uses the principle of pressure reduction by controlled
time resolution in particular at low temperature or in pol- pumping of air out of the cloud chamber. Therefore, the tem-
luted environments where concentrations are higher. Only perature in the chamber decreases due to expansion cooling,
recently, newly developed INP instruments with a higher de- while the relative humidity increases. This causes the aerosol
gree of automation have become available (Bi et al., 2019; particles, which are present in the chamber prior to the expan-
Brunner and Kanji, 2021). The automated CFDC instrument sion, to act as cloud condensation nuclei (CCN) and/or INPs
used by Bi et al. (2019) performed INP measurements dur- to form liquid cloud droplets and ice crystals, depending on
ing a period of 1 month in 2018 at temperatures between −20 the temperature, ice supersaturation and the type of aerosol.
and −30 ◦ C. The CFDC instrument called HINC-Auto (Hor- The starting temperature of each expansion run can be set
izontal Ice Nucleation Chamber) used by Brunner and Kanji in a wide range from about −10 to −60 ◦ C, depending on
(2021) autonomously measured immersion freezing INPs for the capacity of the cooling system. Large aerosol particles,
90 consecutive days but only at one temperature of −30 ◦ C. droplets and ice crystals are measured and counted with an
A combination of both high time resolution and wide tem- optical particle counter (OPC). Placing the OPC in the verti-
perature range for long-term INP measurements, together cally oriented pump tube below the cloud chamber was one
with a comprehensive set of high-resolution aerosol analyt- of the critical development ideas for PINE (see patent appli-
ics, would challenge the comparison to potential driving fac- cations DE 102018210643A1 and US 20200003671). PINE
tors for atmospheric ice nucleation. can be operated both for ice nucleation research in the labora-
This paper presents the development, technical descrip- tory and for INP measurements in field campaigns including
tion, working principle, and first laboratory and field applica- long-term monitoring activities.
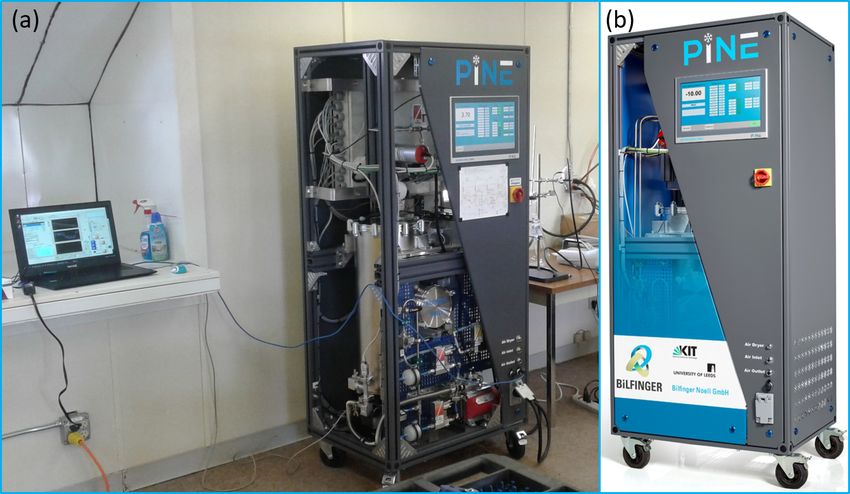
tions of the new Portable Ice Nucleation Experiment (PINE). The first version of PINE was successfully tested in Jan-
PINE is the first fully automated instrument for laboratory uary 2016. It consisted of a simple perplex chamber of 10 L
ice nucleation studies and long-term field observations of volume with manual valve and flow control, as well as a we-
INPs in a wide temperature range. This paper demonstrates las 2300 single-particle optical detector from Palas GmbH,
the instrument’s ability to measure in the mixed-phase cloud Karlsruhe, Germany. Another prototype chamber of about
temperature regime from −10 to −40 ◦ C. PINE is also able 7 L volume was then built of stainless steel and also oper-
to measure ice nucleation at cirrus cloud temperatures to ated in a cold room for further proof-of-concept experiments.
about −65 ◦ C, which is the topic of ongoing studies. Sim- Based on the development and operational experience with
ilar to the AIDA (Aerosol Interaction and Dynamics in the the prototype versions, we developed the first mobile ver-
Atmosphere) cloud simulation chamber, PINE is based on sions PINE-1A and PINE-1B with their own cooling systems
a pumped expansion principle to induce ice and water super- and a control system for semi-autonomous operation during
saturated conditions for aerosol particles sampled either from laboratory ice nucleation measurements and field INP obser-
laboratory setups or natural environments. The instrument is vations. Because both systems are almost identical, we only
operated in repeated cycles of sampling the aerosol into a refer to PINE-1A in the following sections, for simplicity.
pre-cooled cloud chamber, activating the aerosol particles as PINE-1A can be operated in a temperature range from −10
supercooled droplets and ice crystals by expanding the air in- to about −40 ◦ C, was characterized in a series of laboratory
side the cloud chamber and refilling the cloud chamber with experiments and was used in a first field campaign. As a next
fresh aerosol for the next cycle (see Sect. 4). step, the version PINE-c was developed, which is now com-
mercially available from Bilfinger Noell GmbH in Germany
(see https://www.noell.bilfinger.com/pine/#c167514, last ac-
cess: 3 February 2021). PINE-c is operated in the same way
as PINE-1A but received a few new components and fea-
tures, making it more compact and autonomous for opera-
https://doi.org/10.5194/amt-14-1143-2021 Atmos. Meas. Tech., 14, 1143–1166, 2021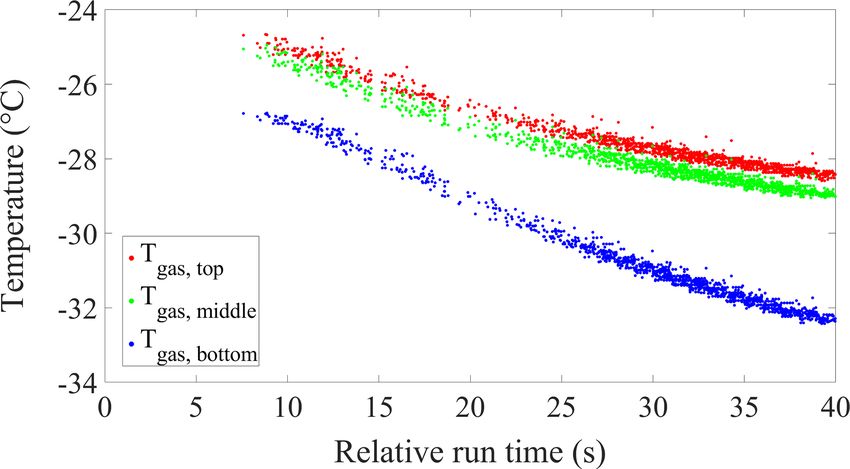
1146                                                       O. Möhler et al.: The Portable Ice Nucleation Experiment (PINE)

                                                                   Both the prototype version PINE-1A and the commercial
                                                                   version PINE-c (see Table 1 and Sect. 6) are equipped with
                                                                   two Nafion membrane diffusion dryers (Perma Pure, MD-
                                                                   700-24S-1, length 62 cm) in parallel, in order to reduce the
                                                                   flow through one single dryer and thus enhance the drying
                                                                   efficiency.
                                                                      Figure A1 shows the PINE sample flow dryer setup with
                                                                   two Nafion diffusion dryers and other major components.
                                                                   The sample flow passes the straight Nafion tube of 1.7 cm
                                                                   diameter and 62 cm length from top to bottom. The Nafion
                                                                   tube is located inside an airtight stainless-steel tube of 2.5 cm
                                                                   diameter. A second air flow passes the annular gap between
                                                                   the coaxial Nafion and stainless-steel tubes from bottom to
                                                                   top (counterflow arrangement). For simplicity, the PINE sys-
                                                                   tem uses ambient air for this counterflow but at reduced
                                                                   absolute pressure. The absolute pressure reduction also re-
                                                                   duces the water vapour partial pressure compared the sample
                                                                   flow inside the Nafion tube at ambient pressure. This water
                                                                   vapour partial pressure difference across the Nafion mem-
                                                                   brane, which is permeable for water molecules, drives a dif-
                                                                   fusional flow of water molecules from the sample flow to
                                                                   the counterflow. The molar flux of water molecules increases
Figure 1. Scheme of a PINE instrument with its five basic compo-   with the pressure difference across the membrane and the
nents.
                                                                   residence time of the sample air inside the Nafion tube. As
                                                                   seen in Fig. A2, the drying efficiency increases with pressure
tion in both field and lab studies. This will be detailed in       reduction. The pressure of the counterflow air is controlled
Sect. 3, together with a general technical description of the      with a pressure controller (Wagner Mess- und Regeltechnik
new PINE instrument. The typical working principle and op-         GmbH, type P-702), located between the dryer and the vac-
eration of PINE will be explained in Sect. 4. In Sect. 5 we        uum pump, and the volumetric flow rate of the counterflow
summarize and discuss some first results from laboratory test      air is controlled with a critical orifice at the inlet side. In com-
and characterization experiments of PINE-1A in comparison          parison to conventionally used diffusion dryers with water
with the AIDA cloud chamber. Finally, in Sect. 6, we will          adsorption material, the membrane dryers used in the PINE
present and discuss some results from a first field application    setup have the great advantage that they can be operated long
of PINE-c, which continuously measured during all 45 d of          term without decreasing their drying efficiency.
a field campaign at the U.S. Department of Energy South-              Because the current PINE instrument versions are typi-
ern Great Plains (SGP) site in Oklahoma from 1 October to          cally operated with a sample flow rate of up to 4 L min−1
14 November 2019.                                                  (see Sect. 4), two Nafion dryers are used in parallel opera-
                                                                   tion, in order to limit the sample flow through each dryer to
                                                                   2 L min−1 . If needed, the dryers can then be operated with
3   PINE instrument setup                                          a maximum pressure difference of about 800 hPa to achieve
                                                                   a high drying efficiency with a drop in the sample flow dew
As illustrated in Fig. 1, PINE consists of five major parts: (I)   point temperature of at least 10 ◦ C. As mentioned above, the
an inlet system, (II) a cloud chamber, (III) a cooling system,     frost point temperature of the sample air should be close to
(IV) a particle detection system, and (V) a control and data       the wall temperature of the PINE cloud chamber. If the sam-
acquisition system. Figure 2 shows a simplified schematics         pled air is too humid, frost may form at the coldest wall sec-
of the PINE setup in the different operational flow configu-       tions, potentially causing an increasing ice background due
rations that will be discussed in Sect. 3.                         to frost artefacts. However, this was not the case when operat-
   The inlet system (Fig. 1, part I) is composed of an inlet       ing PINE-1A during a first field application for several weeks
or sampling tube, a diffusion dryer, a humidity sensor, and        at temperatures below −25 ◦ C and sample air frost point tem-
a bypass flow section with aerosol particle filter for back-       peratures around −15 ◦ C. This was tested by passing the
ground measurements. The relative humidity, measured with          sample flow through the particle filter (see Fig. 2), resulting
a dew point sensor (Vaisala DRYCAP® DMT143), has to                in zero particle counts in the detection range for ice crystals
be high enough to allow cloud droplet formation upon ex-           after about five consecutive runs (Fig. A3). This means that
pansion cooling and at the same time low enough to avoid           when the sample air is passing through the bypass particle fil-
frost formation on the chamber walls (see Sects. 4 and 5).         ter, the system detects neither aerosol particles, nor activated

Atmos. Meas. Tech., 14, 1143–1166, 2021                                              https://doi.org/10.5194/amt-14-1143-2021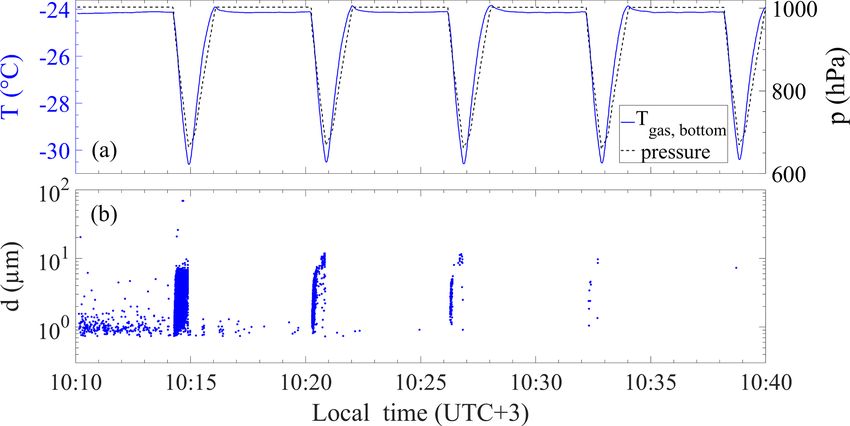
O. Möhler et al.: The Portable Ice Nucleation Experiment (PINE)                                                                           1147

Figure 2. Schematic setup of the PINE. The three figures show the same instrument but in the different run modes (a) flush, (b) expansion
and (c) refill. The thick blue lines indicate which parts of the flow setup are active in the respective modes. The sampling gas flow through
the humidity sensor (light blue line) is active all the time in a bypass line to the sampling pump. A background measurement can be done by
passing the sample flow over an aerosol filter (dashed line, a). In the flush mode (a), aerosol particles are sampled (coloured various symbols)
and activate into cloud droplets and ice crystals during the expansion mode (b, blue circles and stars, respectively). During the refill mode,
aerosol particles enter the chamber again (c, coloured various symbols).

Table 1. Configuration and operational parameters of PINE prototype version 1A as well as the currently available commercial version
PINE-c.

                                                                   PINE-1A                             PINE-c
       Chamber type                                                Stainless steel, single walled      Aluminium, thin walled
       Thermal insulation                                          2 cm thick ArmaFlex layer           Vacuum chamber
       Chamber length                                              75 cm                               57 cm
       Chamber diameter                                            15 cm                               18 cm
       Chamber volume                                              7L                                  10 L
       Cooling system                                              Chiller Lauda (RP855)               Stirling (Thales, LPT9310)
       Wall temperature range                                      0 to −33 ◦ C                        0 to −60 ◦ C
       Measurement temperature range                               −10 to −40 ◦ C                      −10 to −65 ◦ C
       Temperature uncertainty                                     ±1 ◦ C                              ±1 ◦ C
       Wall cooling rates                                          0.3 ◦ C min−1                       0.6 ◦ C min−1
       Wall heating rates                                          0.3 ◦ C min−1                       0.6 ◦ C min−1
       Particle detector                                           welas 2500                          fidas-pine
       Inlet dryer                                                 Perma Pure, MD-700-24S-1            Perma Pure, MD-700-24S-1
       Detection limit at 6 min time resolution (single run)       5 L−1                               0.5 L−1
       Detection limit at 1 h time resolution (10 runs)            0.5 L−1                             0.05 L−1
       Detection limit at 24 h time resolution (240 runs)          0.02 L−1                            0.002 L−1

droplets nor ice crystals. In the commercial version, the stan-           ticles smaller than 2 µm diameter. It decreased to about 50 %
dard location of the dryers is next to the cloud chamber with             for particles with an aerodynamic diameter of about 4 µm.
vertical orientation, so that the sampled air flows in upward             The dryers can also be mounted above the PINE chamber for
direction through the dyers and then passes a 90◦ bend, a hor-            a strictly vertical sample flow, for which a further reduced
izontal distance of 50 cm and another 90◦ bend to then flow               particle loss can be expected. More systematic sampling ef-
downward into the PINE cloud chamber. The aerosol particle                ficiency measurements for different configurations and oper-
loss for this setup was measured to be less than 20 % for par-            ations will be performed in the future.

https://doi.org/10.5194/amt-14-1143-2021                                                      Atmos. Meas. Tech., 14, 1143–1166, 2021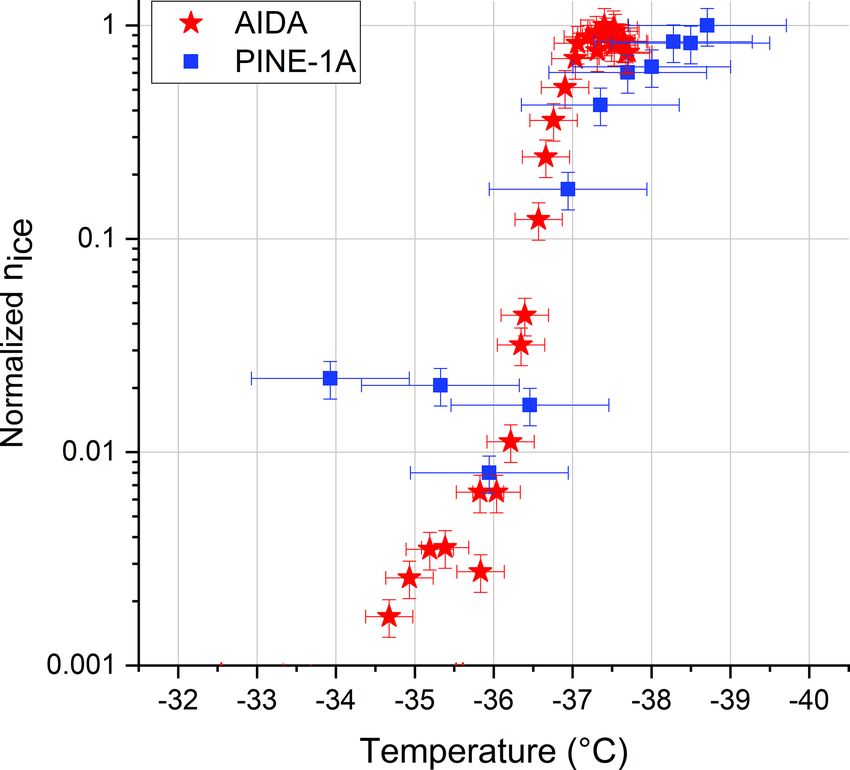
1148                                                      O. Möhler et al.: The Portable Ice Nucleation Experiment (PINE)

   The heart of a PINE instrument is a temperature-controlled     in Sect. 4. The OPC is mounted to the pump tube, with a
cloud chamber (part II in Fig. 1). The PINE-1A cloud cham-        minimum distance to the cloud chamber in order to mini-
ber has a volume of about 7 L and is made of stainless steel,     mize warming of the cold air flow from the cloud chamber
with a central cylindrical part and two cones at the top and      and thus avoid evaporation of supercooled cloud droplets and
the bottom (Table 1). With the cooling system (part III in        sublimation or melting of ice crystals. PINE-1A is equipped
Fig. 1), the wall temperature of the cloud chamber can ei-        with a welas 2500 sensor connected to a Promo® 2000 sys-
ther be controlled at a constant value or changed at constant     tem (Palas GmbH, Karlsruhe, Germany). The same sensor
cooling or heating rates of up to 0.3 ◦ C min−1 . The PINE-       has been operated for many years at the AIDA cloud cham-
1A cloud chamber is temperature-controlled with an ethanol        ber for cloud droplet and ice crystal detection (Möhler et al.,
bath chiller (Lauda RP 855; Lauda-Königshofen, Germany).          2006; Wagner and Möhler, 2013). It measures aerosol par-
This is achieved by circulating the chilled ethanol from the      ticles, water droplets and ice crystals with optical sizes be-
bath chiller through thermo-conductive ethylene propylene         tween 0.7 and 220 µm diameter, depending on the sensitivity
diene monomer rubber tubes wound around the chamber. The          setting of the photomultiplier measuring the intensity of light
wall temperature of the chamber is measured with three ther-      scattered by single particles when passing the optical detec-
mocouples attached to the outer chamber walls at three dif-       tion volume (ODV). The welas sensor records for each de-
ferent locations. The gas temperature inside the cloud cham-      tected particle the time of detection, the transit time through
ber is also measured with three thermocouples located in the      the ODV and the intensity of light scattered into a range of
bottom, middle and upper section of the chamber about 5 cm        scattering angles around 90◦ (sideward scattering). This op-
off the wall (see Fig. A4). All thermocouples have been cali-     tical arrangement is favourable for the selective detection of
brated to a reference sensor (Lake Shore, model PT-103, sen-      aspherical ice crystals, which are measured at a larger opti-
sor type platinum resistor) with an accuracy of ±0.1 ◦ C. A       cal size than spherical droplets of the same volume and can
minimum wall temperature of about −33 ◦ C can be reached          therefore more easily be distinguished from droplets by set-
with PINE-1A. With additional expansion cooling of the            ting a simple threshold for the optical size (see Sect. 4).
chamber volume (see Sect. 4), a minimum gas temperature of           The welas 2500 sensor has a well-confined ODV with a
about −40 ◦ C is then reached for ice activation of the aerosol   sample flow cross-section area Aw = 0.24 mm2 and a length
particles.                                                        lw = 0.31 mm. Because the transect time τw of particles
   PINE-c is equipped with a thin-walled aluminium cloud          through the ODV is also measured, the sample flow rate
chamber with a slightly larger volume of 10 L as compared         through the ODV can be calculated as
to PINE-1A (see Table 1). Mainly for thermal insulation, the
cloud chamber is located in an evacuated stainless-steel con-            Aw lw
                                                                  Fw =         .                                              (1)
tainer and is cooled with a Stirling cooler (Thales, LPT9310,             τw
Johnson et al., 2014). A dual-opposed-piston compressor
                                                                  With the count rate cp of detected particles, one can then cal-
driven by linear motors with moving-magnet-flexure-bearing
                                                                  culate the particle number concentration:
design drives a Stirling-type pulse tube. As a consequence,
there is only little vibration introduced to the cloud chamber           cp
in direct thermal contact to the pulse tube. The compressor of    np =      .                                                 (2)
                                                                         Fw
the cryocooler is force-flow air cooled. Therefore, no cooling
liquids are required and the cooling system is maintenance-       On average, the ratio of the volume flow through the ODV to
free. The combination of the low mass and heat capacity of        the total volume flow through the welas 2500 sensor is about
the thin-walled cloud chamber and the high cooling power of       0.105. This means that the sensor detects only about 10 %
the Stirling cooler allows us to cool the PINE-c cloud cham-      of the particles sampled from the cloud chamber. The PINE-
ber at a rate of up to approximately 0.6 ◦ C min−1 without        c version uses a new OPC called fidas-pine (Palas GmbH,
any notable effects of measurement disturbance (see Sect. 6).     Karlsruhe, Germany). This new OPC was developed espe-
The heating rate of the chamber can also automatically be set     cially for the PINE-c instrument and analyses the full sample
to a value up to 0.6 ◦ C min−1 . Therefore, faster temperature    flow of up to 5 L min−1 for particles in a size range similar to
scans than with PINE-1A can be achieved for temperature-          the welas 2500 sensor. For PINE-c, the particle number con-
dependent ice nucleation and INP measurements. PINE-c can         centration can still be calculated with Eq. (2), just by replac-
also be cooled to a lower wall temperature of −60 ◦ C and can     ing the flow rate through the ODV of the welas 2500 sensor
therefore be operated at cirrus cloud temperatures in upcom-      by the total sample flow rate Fem during the expansion mode
ing studies.                                                      (see Sect. 4). Therefore, fidas-pine has a 10-times-higher de-
   The PINE particle detection system (part IV in Fig. 1)         tection rate of particles and thus a 10-times-lower INP con-
consists of an OPC connected to the control and data ac-          centration detection threshold than PINE-1A.
quisition system (part V in Fig. 1). Depending on the OPC            PINE is controlled via a bespoke LabVIEW program,
type, aerosol particles, activated cloud droplets and ice crys-   which sets the respective measurement condition; displays
tals are detected during the different run modes as described     the parameters such as particle size, temperature, pressure

Atmos. Meas. Tech., 14, 1143–1166, 2021                                            https://doi.org/10.5194/amt-14-1143-2021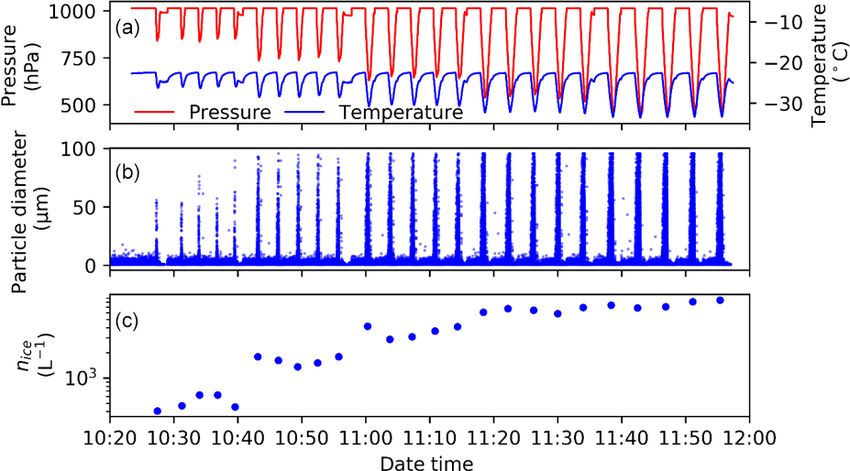
O. Möhler et al.: The Portable Ice Nucleation Experiment (PINE)                                                               1149

and flows; and saves the data internally. Metadata describ-             The refill mode (Fig. 2c) is the final run mode and is car-
ing the experiment are saved automatically using LabVIEW,            ried out to safely re-pressurize the PINE chamber to the start
such as date and time; type of OPC used; and its configura-          pressure. Once this pressure is reached, the sample flow is
tion, temperature and pressure conditions.                           immediately switched back to pass the cloud chamber, start-
                                                                     ing the next run with the same series of flush, expansion and
                                                                     refill modes. A full run takes about 4 to 6 min, depending
4   PINE operating principle                                         on the flush time, the pump flow rate during the expansion
                                                                     mode and the end pressure. The higher the sample flow rate,
The PINE instrument can either be used in an individual-
                                                                     the faster the air in the cloud chamber is replenished and re-
operator-controlled mode for laboratory ice nucleation ex-
                                                                     newed for the next run, and the shorter the flush time that can
periments and measurements or in a fully automated mode
                                                                     be chosen. The lower the minimum pressure during expan-
for long-term field measurements and observations of INPs.
                                                                     sion, the longer the refill mode time.
The instrument’s settings during a laboratory or field cam-
                                                                        Figures 3 to 6 show results from a PINE-1A operation on
paign and the data storage systems of PINE are organized in
                                                                     25 March 2018 during the HyICE field campaign, which in-
a well-defined sequence of operations and runs. All data and
                                                                     cludes a series of 59 identical runs. Each run to ok about
metadata are saved automatically using the LabVIEW pro-
                                                                     6 min, so the whole operation lasted almost 6 h. During this
gram.
                                                                     time, the ambient total aerosol concentration varied between
    An operation is defined as a specific series of runs, which
                                                                     about 900 and 2300 cm−3 , with the majority of particles
can be, for example, performed at one temperature, and dur-
                                                                     smaller than 0.5 µm in diameter, and PINE-1A sampled am-
ing a specific sampling time. Each run is composed of a se-
                                                                     bient air at a flow rate of 3 L min−1 . The flush time was set
quence of three modes called “flush”, “expansion” and “re-
                                                                     to 4 min. Each expansion was started at a wall temperature
fill”. The flow settings of PINE in these three run modes are
                                                                     of about −26 ◦ C with pump flow rate of 4 L min−1 and took
illustrated in Fig. 2. In the flush mode (Fig. 2a), the sample
                                                                     about 40 s. An example of one these 59 runs is depicted in
flow is passed through the cloud chamber to fill it with the
                                                                     Fig. 3, which shows the end of the flush mode, the expansion
aerosol under investigation. This can either be ambient air at
                                                                     mode and the refill mode. The data time series are plotted
a field station where PINE measures INP concentrations or
                                                                     as a function of the time in seconds relative to the start of
an aerosol generated in a laboratory for ice nucleation stud-
                                                                     the expansion mode. A temperature and pressure decrease of
ies. For PINE-1A and PINE-c, the sample flow rate is lim-
                                                                     about 6 ◦ C and 300 hPa, respectively, is observed during the
ited to about 4 L min−1 (see Sect. 4). In the flush mode, the
                                                                     expansion (Fig. 3a). Here, only the data from the lowest of
sample flow can also be passed through an aerosol filter for
                                                                     the three gas temperature sensors (see Fig. A4) are plotted,
background, particle-free measurements.
                                                                     which reaches a minimum value of about −32 ◦ C at the end
    In the expansion mode (Fig. 2b), the sample flow is kept
                                                                     of the expansion after about 40 s.
constant but switched to a bypass line around the cloud
                                                                        The relative humidity is not directly measured in the PINE
chamber. At the same time, a valve at the chamber inlet is
                                                                     cloud chamber but can be calculated from the change in the
closed, and the OPC flow rate is set to a value between 2
                                                                     temperature-dependent water saturation pressure, assuming
and 5 L min−1 , such that the pressure in the cloud chamber
                                                                     ice-saturated conditions at the start of the expansion and
is lowered at a constant rate and to a pre-defined minimum
                                                                     omitting water vapour sources and sinks during the expan-
pressure. This forced gas expansion in the cloud chamber
                                                                     sion. This assumption is reasonable because the frost point
causes an adiabatic cooling and thereby an increase in the
                                                                     temperature of the air sampled into the chamber was slightly
relative humidity. When the relative humidity exceeds ice or
                                                                     higher than the average wall temperature. The excess water
water saturation, the aerosol particles in the cloud chamber,
                                                                     vapour quickly condenses to the cold chamber walls, so that
which were sampled during the flush mode, are then activated
                                                                     the water vapour partial pressure at the start of the expan-
to form liquid cloud droplets and/or ice crystals, depending
                                                                     sion equals the ice saturation pressure calculated as func-
on the temperature and the type of aerosols. Both droplets
                                                                     tion of the wall temperature at the start of the expansion
and ice crystals are measured with an OPC downstream of
                                                                     (pw,0 = psat,ice (Tg,0 )), and the corresponding saturation ra-
the chamber. Ice crystals are distinguished from droplets by
                                                                     tio with respect to liquid water is Sw = 0.79 at the same start
their larger optical size, as discussed later in this section. The
                                                                     temperature Tg,0 = −26 ◦ C. During the expansion mode, the
expansion mode flow rate Fem is limited to 2 and 5 L min−1
                                                                     liquid water saturation ratio was then calculated as
because both the welas 2500 and fidas-pine OPCs can only
be operated to a maximum sample flow rate of 5 L min−1 .                        pw
Smaller flow rates can cause cloud droplet evaporation or ice        Sw =                  ,                                    (3)
                                                                            psat,liq (Tg )
crystal sublimation in the tube connection between the cloud
chamber and the OPC. The end pressure is typically 200 to            with
300 hPa lower than the start pressure that is given by the pres-
                                                                                  p
sure of the aerosol sampled during the flush mode.                   pw = pw,0       ,                                          (4)
                                                                                  p0

https://doi.org/10.5194/amt-14-1143-2021                                                  Atmos. Meas. Tech., 14, 1143–1166, 2021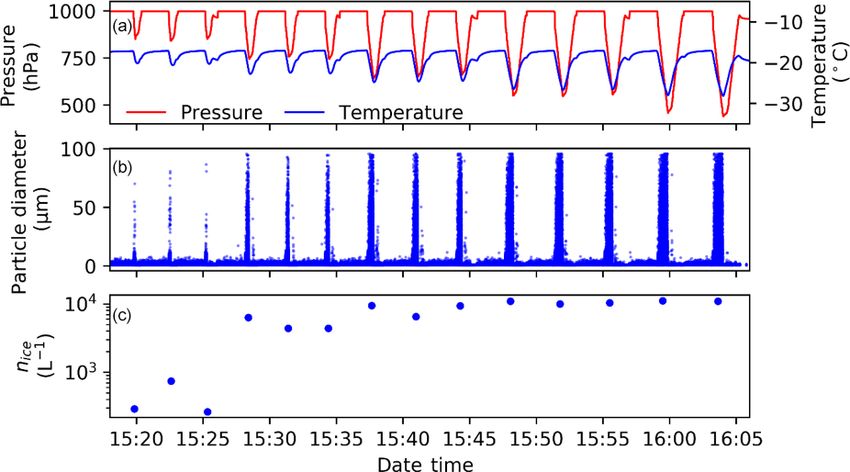
1150                                                          O. Möhler et al.: The Portable Ice Nucleation Experiment (PINE)

Figure 3. A typical run of PINE-1A showing both cloud droplet formation and ice formation during the cloud expansion mode. (a) Lowest
gas temperature (T ; blue line) and pressure (p; black line) measured in the chamber. (b) Calculated liquid water saturation ratio (Sw ). (c)
Optical particle diameter (d) detected in the OPC. This panel shows each single particle detected by the OPC plotted as a single blue dot at
the time of occurrence and with its measured optical diameter.

where p0 is the pressure at the start of the expansion and p             conditions, which provides a good basis for conducting se-
the pressure during the expansion. It can be seen that after             ries of immersion mode INP and freezing measurements at
about 10 s, the calculated Sw exceeds 1 (Fig. 3b). Note that             high precision. The small grey dots in this figure show the
S will in reality be limited by the growth of cloud droplets             OPC count rates of individual runs, and the bigger black cir-
but that conditions of S>1 indicate conditions where a liquid            cle shows the mean over all 59 runs of this operation. The
cloud could form. This roughly corresponds with the start                variation can partly be explained by the natural variability
of cloud droplet activation as shown in panel (c) of Fig. 3,             of the ambient aerosol concentration, which also causes a
shown by the sudden occurrence of a large number of parti-               variation of the droplet number concentration. As mentioned
cles with diameters up to 10 µm. This panel shows each sin-              above, the aerosol number concentration varied by about a
gle particle detected by the OPC plotted as a single blue dot            factor of 2 between 900 and 2300 cm−3 .
at the time of occurrence and with its measured optical diam-               Not only cloud droplets but also ice crystals were detected
eter. With ongoing pressure reduction and related cooling, a             during the same operation as shown by the occurrence of
small number of particles is detected at larger optical size,            particles larger than ∼ 10 µm (Fig. 3c). The whole size dis-
with diameters larger than the dense cloud of liquid droplets            tribution of both cloud droplet and ice crystals (Fig. 5) re-
(Fig. 3c). Those particles are identified as ice crystals formed         veals that there is only little variation from run to run, at least
by immersion freezing of only a minor droplet fraction. The              for the droplet mode with maximum diameters of ∼ 10 µm.
expansion mode stops after about 40 s, and the chamber is re-            Larger particles are identified as ice crystals and can be dis-
filled to ambient pressure within about 1 min. The next run is           tinguished from the droplets by setting a size threshold close
started with the flush mode, filling the cloud chamber again             to the end (the right edge) of the sharp droplet mode. The use
with ambient aerosol particles for the next expansion run.               of a simple size threshold to distinguish between ice crystals
Refilling causes compression of the chamber air and related              and droplets is supported by the fact that the sideward scat-
warming (see upper panel of Fig. 3). This also leads to the              tering geometry of both the welas and fidas sensors detects
evaporation of the droplets and ice crystals after some time;            aspherical particles with a much larger scattering intensity
however, the abrupt stop of particle recording is related to the         than spherical particles of the same volume and refractive in-
fact that the pump flow rate through the OPC is stopped at               dex. Järvinen et al. (2014) determined an average oversizing
the end of expansion, so that only a few particles are moving            factor of 2.2 for the welas sensor. For individual ice crystals,
through the OPC detection volume during the refill mode.                 this factor can be much larger depending on their size, shape
    For the same PINE-1A operation during the HyICE field                and orientation in the OPC detection volume.
campaign, there is little run-to-run variation for the total OPC            Based on Eq. (1), the immersion mode INP number con-
counts per second of run time (Fig. 4). This means that PINE             centration measured in one run of the PINE-1A system can
is able to reproduce the formation of the supercooled droplet            then be calculated by dividing the total number 1Nice of ice
cloud in repeated runs at constant sampling and operation                crystals detected by the total volume 1Vw of air passing the

Atmos. Meas. Tech., 14, 1143–1166, 2021                                                    https://doi.org/10.5194/amt-14-1143-2021
O. Möhler et al.: The Portable Ice Nucleation Experiment (PINE)                                                                        1151

Figure 4. Total number counts measured with PINE-1A in 1 s time          Figure 6. The data points show event temperatures of all ice crys-
intervals of 59 consecutive runs during the HyICE field campaign         tals measured with PINE-1A during the same operation of 59 runs
(operation 64 on 25 March 2018). The measured count rates are            shown in Figs. 4 and 5. The events are plotted as a function of the
plotted as a function of time relative to the start of the expansion.    relative run time at which they were detected, and the gas tempera-
The small grey dots in this figure show the OPC count rates of indi-     tures were measured at the same time with three sensors located in
vidual runs, and the bigger black circle shows the mean over all 59      the lower (blue), the middle (green) and the upper (red) part of the
runs of this operation. Before the start of the expansion, only larger   chamber.
aerosol particles are measured. The sharp increase after about 6 s of
expansion is due to CCN activation of the aerosol particles in the
chamber and the growth of droplets.
                                                                         Examples from PINE-1A at higher temperatures without ice
                                                                         crystal formation prove that this right edge of the activated
                                                                         droplet size distribution is indeed rather sharp in typical
                                                                         expansion runs (Fig. A5). For data interpretation, the size
                                                                         threshold to distinguish between droplets and ice crystals can
                                                                         be set manually; however, it varies with operation temper-
                                                                         ature and droplet number concentration. Ongoing activities
                                                                         for improving the operation and data analysis tools for PINE
                                                                         also focus on developing an automated procedure for setting
                                                                         this threshold. Counting all particles larger than this thresh-
                                                                         old as ice crystals is a simple straightforward procedure but
                                                                         neglects smaller ice particles which may also be present in
                                                                         the overlapping size range with the droplets and may cause
Figure 5. Particle size distribution for the same series of runs shown   an underestimation of the ice crystal number concentration.
in Fig. 4.                                                               Therefore, the PINE instrument was also operated next to
                                                                         the AIDA cloud chamber for homogeneous droplet freezing
                                                                         and immersion freezing experiments in order to identify and
ODV of the welas OPC during the expansion mode after the                 quantify potential systematic uncertainties and biases (see
formation of the supercooled liquid cloud:                               Sect. 5).
                                                                            In addition to detecting the accurate number of ice crys-
            1Nice    1Nice                                               tals, the quality of ice nucleation and INP measurements also
nINP,w =          =         ,                                     (5)
            1Vw     Fw 1tem                                              depends on measuring the precise temperature at which the
                                                                         ice crystals are actually nucleated, either homogeneously or
where Fw is the volumetric flow rate through the optical de-             at the surface of an INP. The variability of the gas temper-
tection volume of the welas sensor and 1tem the duration                 ature in the PINE cloud chamber during 59 expansions is
of the expansion mode from the start of liquid cloud forma-              illustrated in Fig. 6. Here, all ice crystals detected during
tion (see also Sect. 3 and Eq. 2). For the welas 2500 sensor,            the 59 expansions are plotted for the relative time after the
1Vw is about 10 % of the total volume 1Vem passing the                   start of the run in which they were measured, and the respec-
OPC during the same time. For the PINE-c system equipped                 tive gas temperature is measured with three sensors located
with a fidas-pine (fp) sensor analysing the total pump flow              in the lower (blue), the middle (green) and the upper (red)
Fem = 1Vem /1tem for particles (see Sect. 3), the INP num-               part of the chamber (see Fig. A4). First of all, one can see
ber concentration results from                                           that the number of ice crystals, and thereby also the num-
            1Nice    1Nice                                               ber of immersion freezing INPs that caused the ice forma-
nINP,fp =         =          .                                    (6)    tion in these expansions, increases with decreasing temper-
            1Vem    Fem 1tem

https://doi.org/10.5194/amt-14-1143-2021                                                    Atmos. Meas. Tech., 14, 1143–1166, 2021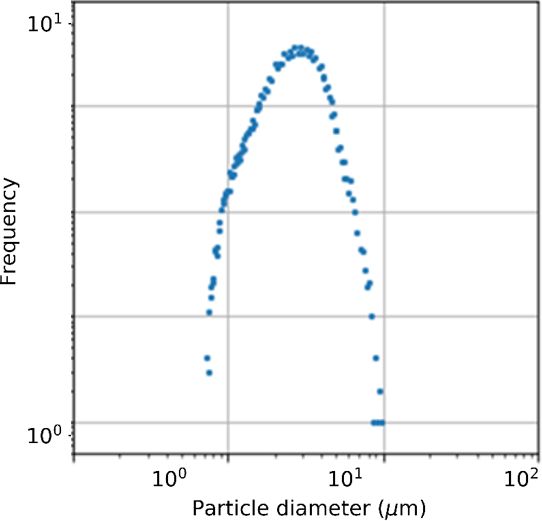
1152                                                      O. Möhler et al.: The Portable Ice Nucleation Experiment (PINE)

ature, which reflects the temperature-dependent INP num-          time resolution of 1 h. When summing up over a whole day
ber concentration in ambient air. For individual sensors, the     of subsequent runs, the detection limits are further reduced
temperature variability from run to run is less than about        to 0.02 and 0.002 L−1 , respectively.
0.5 ◦ C, clearly underlining that PINE is able to detect the
temperature-dependent ice crystal formation from run to run
at well-controlled conditions. However, there is an increas-      5   Laboratory tests of the prototype version PINE-1A
ing deviation of the temperature readings at the different lo-
                                                                  During several test series, immersion freezing and cloud
cations in the PINE cloud chamber, with the lowest temper-
                                                                  droplet freezing measurements with PINE-1A were com-
ature measured at the bottom and the largest at the top. This
                                                                  pared to the AIDA cloud camber results. For these intercom-
inhomogeneity of the temperature across the chamber arises
                                                                  parison studies, PINE-1A sampled aerosols directly from the
from the fact that there is an increasing temperature differ-
                                                                  AIDA chamber and was operated at similar wall tempera-
ence between the expanding gas and the almost constant
                                                                  tures to the AIDA cloud chamber. Therefore, the cloud ex-
wall temperature. This causes an increasing heat flux into
                                                                  pansion runs covered a similar temperature range and as
the chamber volume and thus an increasing temperature dis-
                                                                  such allowed the intercomparison of temperature-dependent
tortion and deviation from the adiabatic temperature profile.
                                                                  freezing rates or INP concentrations. Homogeneous freezing
The hereby formed warm air tends to be collected in the top
                                                                  of supercooled water droplets is known from classical nu-
part of the chamber. The related temperature variability in-
                                                                  cleation theory and from literature results (Pruppacher and
side the cloud chamber impacts the temperature uncertainty
                                                                  Klett, 2010; Koop and Murray, 2016) to occur at tempera-
for the INP and ice nucleation detection. However, it can be
                                                                  tures between about −35 and −37 ◦ C. Figure 7 shows the
assumed that most of the ice crystals detected in the PINE
                                                                  freezing of water droplets to be measured with PINE-1A
expansion mode are formed at the lowest temperature in the
                                                                  in the expected temperature range. As in the experiments
bottom part of the chamber, where all the air flowing to the
                                                                  by Benz et al. (2005), aqueous sulfuric acid particles were
OPC passes through. Since ice nucleation is a strong func-
                                                                  first added to the AIDA chamber. Then, the aerosol particles
tion of temperature, it is a good first-order approximation to
                                                                  with a diameter around 0.8 µm and a number concentration
assume the coldest temperature in the chamber to guide the
                                                                  of about 200 cm−3 were sampled into the PINE-1A cham-
ice nucleation. This assumption will be solidified by the re-
                                                                  ber for its homogeneous freezing experiments, followed by
sults of experiments presented and discussed in the following
                                                                  an AIDA cloud expansion experiment with the same aerosol.
section.
                                                                  Figure 7 shows the onset temperature of the homogeneous
   An important part of PINE operations is the background
                                                                  freezing in PINE-1A to agree with the results of the AIDA
runs during which the sampled air is guided through a fil-
                                                                  cloud expansion experiment. The PINE-1A data are plotted
ter while the operation runs are ongoing. After typically 5 to
                                                                  as a function of the temperature measured with the bottom
10 runs, the chamber becomes particle-free, and as such any
                                                                  temperature sensor, which always measures the lowest tem-
remaining particle counts indicate the presence of frost for-
                                                                  perature during a run (see Fig. 6). This result underlines the
mation on the walls or a leak in the chamber or pipework. A
                                                                  assumption that the ice formation measured with PINE is
typical background measurement, where almost no particles
                                                                  mainly controlled by the minimum temperature in the cloud
are present after five cycles, is presented in Fig. A3. Regu-
                                                                  chamber.
lar background run series are performed with PINE at least
                                                                     PINE-1A was also operated next to the AIDA cloud cham-
during longer measurement phases at low temperatures. A
                                                                  ber during the EXTRA18 campaign in February 2018. This
frost-free chamber is a prerequisite for operating PINE with
                                                                  campaign was mainly organized to test and calibrate the
the highest sensitivity. In the event of zero background con-
                                                                  newly constructed PINE-1A in preparation for a first field
ditions, the detection limit for INP number concentrations
                                                                  campaign. During this campaign, PINE-1A sampled aerosol
can be calculated by dividing the minimum number of ice
                                                                  particles directly from the AIDA chamber again and mea-
crystals detected in a certain volume of air. In one expan-
                                                                  sured their ice nucleation activity in the same temperature
sion with PINE-1A and PINE-c analysing about 0.2 and 2 L
                                                                  range covered by AIDA cloud expansion runs with the same
of air per run, respectively, the resulting one count detection
                                                                  aerosols. Arizona test dust (ATD) and illite NX aerosols
threshold is 5 and 0.5 L−1 , respectively (see also Table 1).
                                                                  where used during this campaign. These aerosols are well
Note that the detection limit of PINE-1A is a factor of 10
                                                                  studied for their ice nucleation activities and were also used
lower because only about 10 % of the pump flow during the
                                                                  in previous intercomparison experiments for INP instruments
expansion is analysed, whereas the OPC of PINE-c detects
                                                                  (DeMott et al., 2011, 2018; Hiranuma et al., 2015). We used
all ice crystals in the pump flow. If 10 consecutive runs are
                                                                  the same aerosol sources as Steinke et al. (2015) for ATD
conducted and summed up in 1 h, assuming the total run time
                                                                  and Hiranuma et al. (2015) for illite NX, and the methods for
is set to 6 min, about 10 times more volume of air is anal-
                                                                  generating and characterizing these aerosols are described in
ysed, and all ice crystals detected can be summed up, so that
                                                                  these papers.
the INP detection limits are reduced by a factor of 10 to 0.5
and 0.05 L−1 for PINE-1A and PINE-c, respectively, with a

Atmos. Meas. Tech., 14, 1143–1166, 2021                                            https://doi.org/10.5194/amt-14-1143-2021
O. Möhler et al.: The Portable Ice Nucleation Experiment (PINE) 1153
for each individual run as function of gas temperature mea-
sured with the sensor in the bottom of the PINE-1A cloud
chamber. The measured number concentration of ice crys-
tals equals the number concentration of ice-active ATD par-
ticles measured in an AIDA cloud chamber experiment with
the same aerosol (Fig. 9). For the PINE measurements, we
estimate a temperature uncertainty of ±1 ◦ C, mainly caused
by the inhomogeneous temperature distribution in the PINE
cloud chamber during the expansion run (see Fig. 6). The
temperature uncertainty during AIDA cloud expansion ex-
periments is ±0.3 ◦ C. The estimated uncertainty for the ice
number concentration is ±20 % for both PINE and AIDA,
mainly due to the uncertainty in the dimension of the ODV
of the welas sensor and the measured transect time of parti-
cles passing the ODV (see Eq. 1).
The same measurements as for ATD were also performed
with illite NX aerosol (Figs. 10 and 11) but with both AIDA
and PINE-1A starting their cloud expansions at a slightly
lower temperature of about −22 ◦ C because of the somewhat
Figure 7. Homogeneous freezing of supercooled water droplets lower ice nucleation activity of illite NX compared to ATD.
measured with PINE-1A and with AIDA during a PINE charac- Within the given uncertainty ranges, the PINE-1A data are
terization campaign in December 2018. For this measurement, the in excellent agreement with the AIDA data for both ATD
PINE-1A was equipped with a welas 2500 OPC and sampled sul-
(Figs. 8 and 9) and illite NX (Figs. 10 and 11). This also
furic acid aerosol directly from the AIDA chamber. PINE-1A was
operated at a wall temperature of about −32.5 ◦ C, the expansion run
underlines the assumption that the ice formation in PINE
was done with a flow rate of 5 L min−1 , and reached a minimum gas is mainly controlled by the coldest temperature in the bot-
temperature of −39 ◦ C. The AIDA expansion was started at a tem- tom part of the chamber and that the number concentration
perature of about −31 ◦ C and reached a minimum temperature of of ice crystals, and thus the number concentration of ice-
about −38 ◦ C. active aerosol particles in laboratory experiments and of INPs
during field measurements, can be calculated with Eqs. (5)
and (6) within the above given uncertainty estimates for the
The supercooling or minimum temperature reached in a number concentration and the nucleation temperature. We
PINE expansion can be controlled by two parameters, the should note here that these uncertainty limits are so far only
pump flow rate and the end pressure. This allows for a quick justified by comparison of PINE with AIDA results. Further
scan through a certain temperature range of ice nucleation systematic uncertainties like the loss of large ice crystals be-
activity. Both higher pump flow rates and lower end pres- tween the PINE cloud chamber and OPC, size range overlap
sure cause a larger supercooling of the air in the cloud cham- of small ice crystals with large aerosol particles not activated
ber, which means a lower minimum temperature at the end to droplets, or the sampling efficiency of large aerosol par-
of expansion. An example is shown in Fig. 8. In this opera- ticles into the cloud chamber may have to be considered for
tion, PINE-1A sampled ATD aerosol directly from the AIDA calculating the overall accuracy of INP measurements.
chamber and measured the number fraction fice of ice-active A more comprehensive uncertainty assessment for PINE
ATD particles in a series of runs starting from a tempera- may result from recent intercomparison studies with other
ture of about −18 ◦ C. The expansion flow rate was 5 L min−1 methods and instruments and ongoing long-term operation
in all runs, but the end pressure was stepwise reduced ev- in field campaigns. For long-term measurements, another
ery three runs from about 800 hPa at the beginning to about important parameter is the precision for repeated measure-
500 hPa at the end of this operation (see panel a of Fig. 8). ments at the same sampling and operating conditions. In a
This caused a stepwise decrease in the minimum gas tem- recent test experiment at the AIDA cloud chamber, the new
perature in the cloud chamber, as also shown in panel (a). commercial PINE-04-01 instrument sampled a mixed aerosol
The welas 2500 single-particle data (Fig. 8, panel b) indi- (ammonium sulfate and natural dust) for more than 8 h from
cate an increasing amount of ice formation with decreasing the AIDA chamber (Fig. A6). During this experiment, a
minimum temperature. This stepwise increase in the number mean ice-active particle number fraction of 1.8 × 10⁻⁴ was
concentration of ice crystals or INPs is shown in panel (c) of measured with a standard deviation of 2.1 × 10⁻⁵ , which
Fig. 8, which depicts the time series of the ice crystal number corresponds to a relative uncertainty of about 12 %. Dur-
concentrations measured at the end of each expansion. ing this operation, an average number Nice of about 90 ice
Figure 9 depicts the ice crystal number fraction calculated crystals was measured during one run. Therefore, the rela-
with Eq. (5) divided by the aerosol number concentration tive uncertainty from counting statistics can be calculated as
https://doi.org/10.5194/amt-14-1143-2021 Atmos. Meas. Tech., 14, 1143–1166, 20211154 O. Möhler et al.: The Portable Ice Nucleation Experiment (PINE)
Figure 8. Repeated runs of PINE-1A sampling ATD aerosol from the AIDA cloud chamber during the EXTRA18 campaign. The runs were
started at the same temperature of about −18 ◦ C (blue line), but the minimum expansion pressure (red line) and thus also the minimum
gas temperature in the PINE cloud chamber were stepwise changed every third run (a). Therefore, the number of ice crystals formed by
immersion freezing also stepwise increased, as shown in the single-particle plot from the welas 2500 OPC data (b) and the ice crystal
concentration measured at the end of each expansion (c).
will also include uncertainty analysis for low-counting cases
close to the PINE detection limit.
6 Field measurements with PINE-c
We performed ground-based INP measurements with PINE-c
at the SGP observatory in Oklahoma, where long-term mea-
surements provide statistical context (https://www.arm.gov/
capabilities/observatories/sgp, last access: 3 February 2021).
During the ExINP-SGP campaign (https://www.arm.gov/
research/campaigns/sgp2019exinp, last access: 3 Febru-
ary 2021), we have successfully operated PINE-c (Fig. A7)
via remote control for INP concentration measurements on
a continuous basis for 45 consecutive days. During the en-
tire campaign, PINE-c was operated with an expansion mode
time of 60 to 90 s, resulting in an average sampled gas vol-
ume of 3.7 ± 0.6 L. This resulted in the minimum detectable
INP concentration of about 0.2 to 0.3 L−1 for a single run of
approximately 8 min duration. PINE-c was set to automated
Figure 9. Ice-active particle fraction fice measured with PINE-1A
for ATD as a function of temperature (see also Fig. 8), in compari-
wall temperature control with ramping back and forth be-
son to fice measured in an AIDA cloud expansion experiment with tween −5 and −35 ◦ C every 90 min, without any substantial
the same aerosol, right after the PINE-1A runs were finished. technical issues during the whole campaign period.
Shown in Fig. 12 is the overall summary of compiled
Nice (T ) spectra measured during the ExINP-SGP cam-
√ paign. Individual data points (black dots) represent 6 h time-
Nice /Nice = 10.5 %, which is close to the relative standard averaged cumulative INP concentrations with a temperature
deviation of the run-by-run data from the mean value. For interval of 1 ◦ C for each expansion. Here, we display the
measurements with a much lower number of ice crystals de- PINE-c Nice data for the temperature segment of −10 ◦ C ≥
tected in one run or a consecutive number of runs, the mea- T ≥ −30 ◦ C. This temperature range represents the PINE-c
surement uncertainty from counting statistics can be much condition, where ice nucleation through immersion freezing
larger. Next versions of the PINE analysis software tools was possible below the frost point temperature of the sam-
Atmos. Meas. Tech., 14, 1143–1166, 2021 https://doi.org/10.5194/amt-14-1143-2021You can also read