Joint cloud water path and rainwater path retrievals from airborne ORACLES observations
←
→
Page content transcription
If your browser does not render page correctly, please read the page content below
Atmos. Chem. Phys., 21, 5513–5532, 2021
https://doi.org/10.5194/acp-21-5513-2021
© Author(s) 2021. This work is distributed under
the Creative Commons Attribution 4.0 License.

Joint cloud water path and rainwater path retrievals from airborne
ORACLES observations
Andrew M. Dzambo1,2 , Tristan L’Ecuyer1 , Kenneth Sinclair3,4 , Bastiaan van Diedenhoven5 , Siddhant Gupta2 ,
Greg McFarquhar2 , Joseph R. O’Brien6 , Brian Cairns3 , Andrzej P. Wasilewski3,7 , and Mikhail Alexandrov3,5
1 Department   of Atmospheric and Oceanic Sciences, University of Wisconsin–Madison, Madison, WI, USA
2 Cooperative  Institute for Mesoscale Meteorological Studies (CIMMS), University of Oklahoma, Norman, OK, USA
3 NASA Goddard Institute for Space Studies, New York, USA
4 Universities Space Research Association (USRA), Columbia, MD 21046, USA
5 Center for Climate Systems Research, Columbia University, New York, USA
6 School of Aerospace Sciences, University of North Dakota, Grand Forks, ND 58202, USA
7 SciSpace LLC, New York City, NY, USA

Correspondence: Andrew M. Dzambo (dzamboam@ou.edu)

Received: 13 August 2020 – Discussion started: 19 August 2020
Revised: 19 January 2021 – Accepted: 26 February 2021 – Published: 9 April 2021

Abstract. This study presents a new algorithm that combines    also more than twice as likely in unstable environments.
W-band reflectivity measurements from the Airborne Precip-     Comparisons against in situ cloud microphysical probe data
itation Radar – third generation (APR-3) passive radiometric   spanning the range of thermodynamic stability and meteoro-
cloud optical depth and effective radius retrievals from the   logical conditions encountered across the southeast Atlantic
Research Scanning Polarimeter (RSP) to estimate total liq-     basin demonstrate that the combined APR-3 and RSP dataset
uid water path in warm clouds and identify the contributions   enable a robust joint cloud–precipitation retrieval algorithm
from cloud water path (CWP) and rainwater path (RWP).          to support future ORACLES precipitation susceptibility and
The resulting CWP estimates are primarily determined by        cloud–aerosol–precipitation interaction studies.
the optical depth input, although reflectivity measurements
contribute ∼ 10 %–50 % of the uncertainty due to attenuation
through the profile. Uncertainties in CWP estimates across
all conditions are 25 % to 35 %, while RWP uncertainty esti-   1   Introduction
mates frequently exceed 100 %.
   Two-thirds of all radar-detected clouds observed during     Stratocumulus clouds (Sc hereafter) are the dominant cloud
the ObseRvations of Aerosols above CLouds and their intEr-     type over Earth’s subtropical oceans. Significant advances in
actionS (ORACLES) campaign that took place from 2016–          our understanding of subtropical Sc have been documented
2018 over the southeast Atlantic Ocean have CWP between        in many previous studies including their typical cloud frac-
41 and 168 g m−2 and almost all CWPs (99 %) between 6          tions (Stephens et al., 2012; King et al., 2013; L’Ecuyer et
to 445 g m−2 . RWP, by contrast, typically makes up a much     al., 2019), radiative impacts (Hang et al., 2019), and associ-
smaller fraction of total liquid water path (LWP), with more   ated precipitation processes using data from past field exper-
than 70 % of raining clouds having less than 10 g m−2 of       iments (Stevens et al., 2003), long-term ground-based data
rainwater. In heavier warm rain (i.e., rain rate exceeding     collection (Mann et al., 2014; Yang et al., 2018), and space-
40 mm h−1 or 1000 mm d−1 ), however, RWP is observed to        borne remote sensors (Fox and Illingworth, 1997; L’Ecuyer
exceed 2500 g m−2 . CWP (RWP) is found to be approxi-          and Stephens, 2002; Lebsock et al., 2011; Chen et al., 2011;
mately 30 g m−2 (7 g m−2 ) larger in unstable environments     Lebsock et al., 2011; Douglas and L’Ecuyer, 2019; Werner
compared to stable environments. Surface precipitation is      and Deneke, 2020). Despite these advances, until recently
                                                               observations of cloud and precipitation processes over the

Published by Copernicus Publications on behalf of the European Geosciences Union.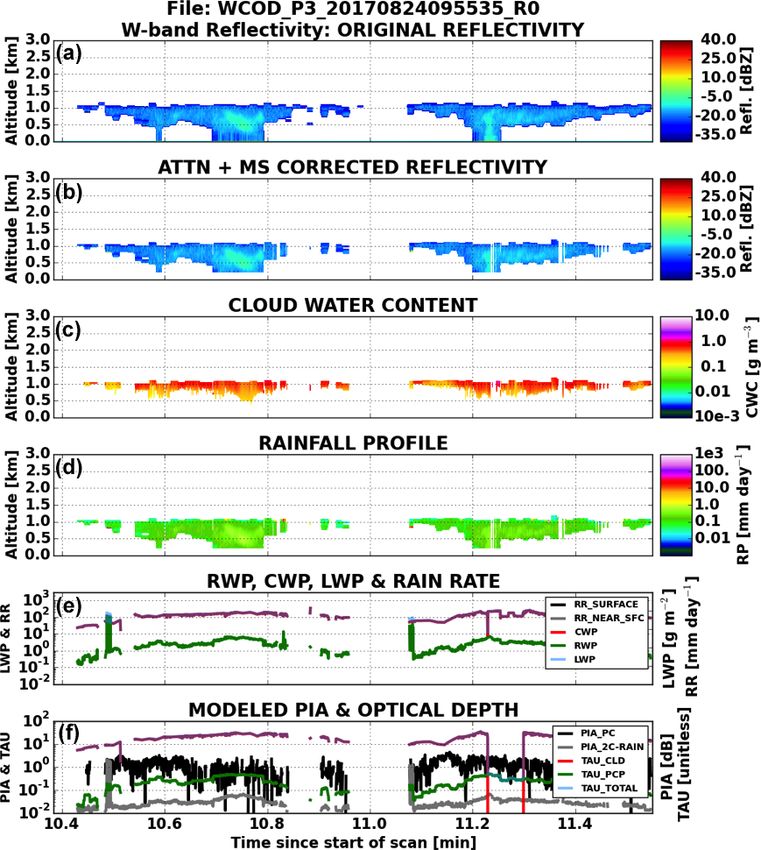
5514                                            A. M. Dzambo et al.: Joint cloud water path and rainwater path retrievals

southeast Atlantic Ocean were very limited. The Sc cloud         tions present using spaceborne sensors such as improved spa-
deck over the southeast Atlantic Ocean is influenced by a        tiotemporal data resolution (Dzambo et al., 2019), helping to
biomass-burning aerosol layer from July through October          fulfill a fundamental need to construct datasets required to
(Zuidema et al., 2016), complicating our understanding of        validate spaceborne remote sensing algorithms and further
global radiation and climate impacts (Cochrane et al., 2019;     explore ORACLES science objectives.
Redemann et al., 2021, and references therein). Prior to the        We develop and test a joint radar–radiometer cloud wa-
beginning of the ObseRvations of Aerosols above CLouds           ter path (CWP) and rainwater path (RWP) retrieval using
and their intEractionS (ORACLES) experiment, the 2000            W-band reflectivity profiles from the Airborne Precipitation
SAFARI field campaign was the only other airborne field          Radar – third generation (APR-3) and cloud properties from
campaign to collect measurements of the expansive cloud          the Research Scanning Polarimeter (RSP), both of which
deck over the southeast Atlantic (Haywood et al., 2003).         flew aboard the NASA P-3 aircraft during all of ORACLES.
Such measurements of the southeast Atlantic Sc deck are          This algorithm (referred to as WCOD hereafter) is analogous
critically needed, given the general lack of process-level un-   to that described in Lebsock and L’Ecuyer (2011) and up-
derstanding of cloud–aerosol–precipitation processes (Hou        dated from the algorithm described in Dzambo et al. (2019).
et al., 2018; Mülmenstädt et al., 2020) and the consequent       Both CWP and RWP are evaluated using available in situ
uncertainties they propagate in modern-day global climate        cloud probe measurements. The next section describes each
models (e.g., Stephens et al., 2010; Sockol and Small Gris-      dataset in more detail, with the subsequent sections describ-
wold, 2017; Cesana et al., 2019).                                ing the algorithm mechanics, typical and limiting cases for
   Two main themes often emerge from cloud–aerosol–              this algorithm, and evaluation of these retrieved variables.
precipitation studies: (1) disentangling cloud–aerosol–
precipitation processes from meteorological controls is per-
haps the biggest challenge (Zhou et al., 2015; Douglas and       2     Datasets
L’Ecuyer, 2019, 2020), and (2) partitioned cloud and precip-
itation datasets are especially limited and must be developed    The APR-3 and RSP flew aboard the NASA P-3 during OR-
using robust retrieval techniques with well-quantified uncer-    ACLES, allowing high-resolution profiles of rainwater con-
tainties (Lebsock et al., 2011; Lebsock and L’Ecuyer, 2011;      tent and cloud water path to be simultaneously retrieved.
Mace et al., 2016; Cadeddu et al., 2020). Many studies have      Cloud and precipitation properties retrieved from these in-
shown that both aerosols and precipitation change cloud mor-     struments are evaluated using available in situ cloud probe
phology and vertical radiation or heating profiles (e.g., Al-    datasets described in Sect. 2.3.
brecht 1989; Feingold et al., 1996; Wood, 2005; Nelson et
al., 2016; Nelson and L’Ecuyer, 2018; Zhang and Zuidema,         2.1    The Airborne Precipitation Radar – third
2019; Abel et al., 2020; Painemal et al., 2020), and hence ac-          generation (APR-3)
curate quantification and collocation of macrophysical cloud
properties are required. The solution for a collocated synergy   The APR-3 measured profiles of collocated Ku (13 GHz),
of measurement platforms was met during ORACLES. Al-             Ka (35 GHz), and W (95 GHz) band reflectivity and Doppler
though cloud–aerosol–precipitation interactions are not the      velocity, revealing cloud vertical structure and precipita-
primary focus of this study, this work is highly motivated       tion properties in unprecedented detail (Dzambo et al.,
by the need for synergy between ORACLES measurement              2019; hereafter D19). For ORACLES, the W-band reflec-
platforms in order to address ORACLES Level 2 and 3 sci-         tivity channel is used exclusively because the Ka band and
ence objectives (Redemann et al., 2021) involving the aerosol    Ku band’s sensitivities were too low to detect many of the
semi-direct effect (Koch and Del Genio, 2010; Das et al.,        observed Sc decks. The APR-3 W-band channel has a sen-
2020) and aerosol indirect effects (e.g., Twomey, 1977; Al-      sitivity between −35 and −38 dBZ at a range of 1 km. Un-
brecht, 1989; McFarquhar and Wang, 2006; Diamond et al.,         der typical operating configurations at high altitude (approx-
2018; Kacarab et al., 2020).                                     imately 7 km), which represent the bulk of the data used
   Understanding the interplay between cloud and precipita-      for this study, the W-band channel has sensitivity of around
tion processes is critically important to the design and de-     −30 dBZ. The effects of non-uniform beam filling and mul-
velopment of experiments and frameworks for comparisons          tiple scattering are minimal, given that the radar has a nar-
between modeling and observation platforms (Mace et al.,         row beamwidth of 0.9◦ . Over the course of the three OR-
2016; Witte et al., 2019). Simultaneous retrievals of cloud      ACLES campaigns, the APR-3 collected over 18 million
and precipitation properties from spaceborne remote sensors      reflectivity profiles with vertical resolutions ranging from
have enhanced our understanding of global cloud–aerosol–         35 to 8.6 m depending on the radar’s operational configura-
precipitation interactions (e.g., L’Ecuyer and Stephens, 2002;   tion. During ORACLES 2016, over 3 million reflectivity pro-
Lebsock and L’Ecuyer, 2011; Mace et al., 2016), and similar      files at each frequency were collected primarily in very sta-
algorithms adapted for airborne platforms can reinforce our      ble, non-precipitating, or lightly precipitating regions off the
understanding through eliminating some inevitable limita-        coast of Namibia, while close to 7 million profiles were col-

Atmos. Chem. Phys., 21, 5513–5532, 2021                                            https://doi.org/10.5194/acp-21-5513-2021
A. M. Dzambo et al.: Joint cloud water path and rainwater path retrievals                                                    5515

lected in 2017 in marginally stable environments containing         the depth of the profile, we note that the polarimetric re cor-
more inhomogeneous clouds with both convective and strati-          responds to about 1–2 optical depth within cloud top, which
form warm rain south of Saõ Tomé. In 2018, nearly 8 million         typically corresponds to a depth of 50–100 m (Alexandrov et
reflectivity profiles were collected sampling mostly homo-          al., 2012). Finally, the RSP re has recently been validated to
geneous cloud with some convective rain near the Equator,           within 1 µm against a Cloud Droplet Probe (Alexandrov et
noting very similar sampling environments to 2017. A com-           al., 2018) with typical values between 5 and 15 µm during
parison of WCOD retrieval data between 2016 and 2017 is             ORACLES (see Figs. 5 and 9 in Miller et al., 2020).
discussed in much greater detail in D19, and a brief overview          The uncertainty associated with each instrument is more
of precipitation frequency during each campaign year is pre-        thoroughly described in Sect. 3, but a few important notes
sented in Redemann et al. (2021). Finally, surface noise or         of caution regarding interpretation of COD and re data are
“ground clutter” is limited to about 200 m (sometimes less)         presented here:
in the W-band observations. More details about the APR-3
observations during ORACLES are described in Dzambo et               1. Optical depth retrievals for very bright clouds have low
al. (2019).                                                             accuracy because reflectance is almost saturated at its
                                                                        semi-infinite value (Nakajima and King, 1990). Very
2.2   The Research Scanning Polarimeter (RSP)                           bright reflectances exceeding the limits of the lookup
                                                                        table employed in the algorithm further reduce the ac-
The Research Scanning Polarimeter (RSP) is an airborne ver-             curacy of estimated liquid water path (LWP). The fre-
sion of the Earth Observing Scanning Polarimeter (EOSP)                 quency of this occurrence during ORACLES is low and
(Travis, 1992; Cairns et al., 2003). The RSP makes po-                  is estimated at 0.5 %.
larimetric and total intensity measurements in nine spectral         2. During the 2016 deployment, aerodynamic interfer-
bands ranging from the visible to shortwave infrared. The               ences with other instruments on the NASA P-3 aircraft
RSP has a 0.8◦ field of view and uses along-track scanning              caused the scanner of the RSP not to function properly,
to make up to 152 measurements every 0.84 s. The measure-               leading to extensive data loss (see Table 1). For this pa-
ments sweep approximately ±60◦ from nadir along the air-                per, only data that are not substantially affected by this
craft’s track. Cloud top height is derived from the RSP ob-             issue were used.
servations using a multi-angle parallax method (Sinclair et
al., 2017). Subsequently, RSP data are mapped so that multi-         3. Cloud retrievals from RSP are only available when the
angle views are available as a function of location at cloud            P-3 aircraft was flying above cloud top and the solar-
top (Alexandrov et al., 2012).                                          viewing geometry was such that the scattering angles
   The RSP retrieves properties of the cloud droplet size dis-          required for the polarimetric drop size retrievals were
tribution at cloud top, namely the effective radius (re ) and           sampled.
effective variance (ve , not used in this study), using the po-
larized reflectances of the cloudbow in the scattering an-          2.3     Cloud probes
gle region between 135 and 165◦ (Alexandrov et al., 2012).
The single scattering properties of cloud (or rain) droplets        2.3.1    Overview
are directly linked to the shape of the cloudbow, which en-
ables a simple retrieval of cloud properties using Mie calcu-       The CWP and RWP retrievals from the APR-3 and RSP data
lations (Alexandrov et al., 2012). Cloud optical depth (COD)        are evaluated against the cloud CWP and RWP derived us-
is retrieved using radiometric reflection in the non-absorbing      ing the droplet number distribution (i.e., n(D)) sampled by
864 nm band, which may be affected by overlying aerosols,           a suite of in situ cloud probes. In situ sampling of the ma-
and the droplet size retrieval (see Nakajima and King, 1990).       rine Sc was conducted during vertical cloud profiles (Gupta
Unlike the reflectance-based COD retrieval, multi-angle po-         et al., 2021) when the aircraft ascended or descended through
larimetric cloud top retrievals rely only on the shape of the       the cloud layer at a vertical velocity of around 5 m s−1 . Data
cloudbow, not its intensity, and therefore is nearly unaffected     from the in situ probes were averaged to 1 s resolution, and
by above-cloud aerosol layers and cloud 3-D effects (Alexan-        hence the droplet n(D) was available at a vertical resolution
drov et al., 2012). The multi-angle measurements can ro-            of 5 m. The in situ cloud probes available during ORACLES
bustly detect optically thin clouds and the presence of multi-      included components of the Droplet Measurement Technolo-
ple cloud layers (Sinclair et al., 2017).                           gies (DMT) Cloud, Aerosol, and Precipitation Spectrome-
   For the ORACLES experiment, RSP measurements offer               ter (CAPS; comprised of a Cloud and Aerosol Spectrometer
reliable data to constrain retrieved cloud water path. COD          or CAS, a Cloud Imaging Probe or CIP, and a DMT hot-
and re retrieved from the 0.865 µm measurements are used,           wire probe), the DMT Cloud Droplet Probe version 2 (CDP),
with re corresponding to the cloud top and assumed through          and the Stratton Park Engineering Company (SPEC) two-
the depth of the profile (implications of this limitation are de-   dimensional stereo probe (2DS). Each of these instruments
scribed in the next section). Although we assume re through         is briefly described in the next subsections, with more details

https://doi.org/10.5194/acp-21-5513-2021                                             Atmos. Chem. Phys., 21, 5513–5532, 2021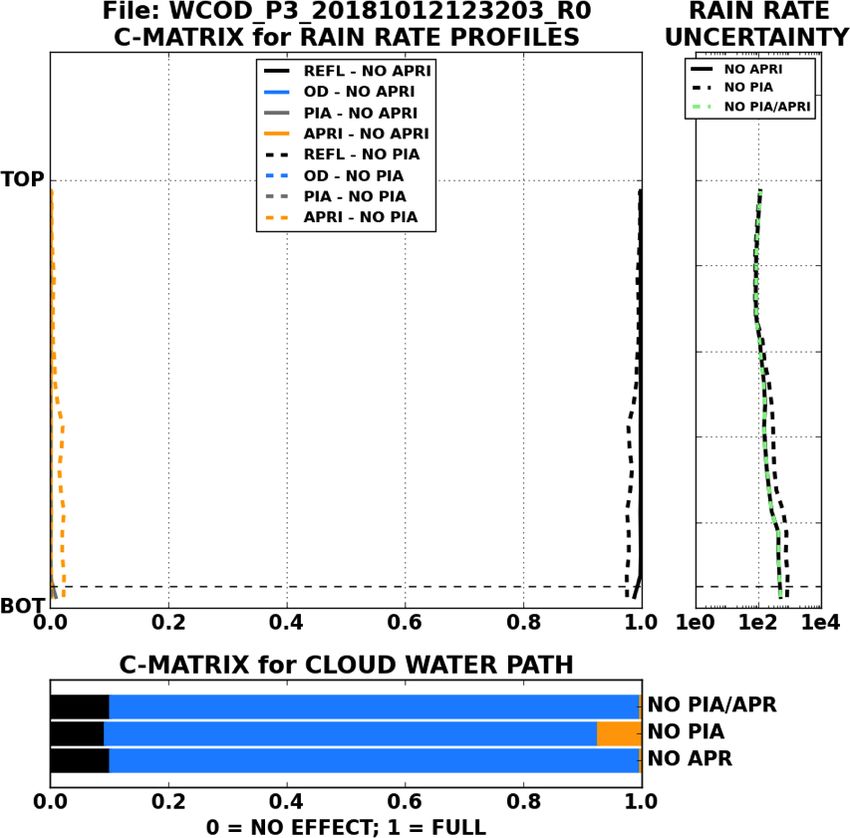
5516                                               A. M. Dzambo et al.: Joint cloud water path and rainwater path retrievals

Table 1. Description of data availability for the ORACLES 2016–2018 field campaigns. The 27 September 2016 flight was classified a
“transit flight” but is included in this analysis because the transit flight took place entirely in the experiment area between Walvis Bay,
Namibia, and Ascension Island and is denoted by a single asterisk (*). No ER-2 data are included in this study. “Y” denotes available data
for a given flight, whereas “N” indicates no data available. For the cloud probes (CPs), the instruments used to derive CWP and RWP are
listed.

                 APR-3     RSP    CPs                         APR-3     RSP     CPs                        APR-3     RSP    CPs
                  2016     2016   2016                         2017     2017    2016                        2018     2018   2018
 30 Aug 2016                                   12 Aug 2017                                  27 Sep 18        Y        Y     CAS, 2DS
 31 Aug 2016        Y       Y     N            13 Aug 2017       Y       Y      CAS, 2DS    30 Sep 2018      Y        Y     CAS, 2DS
 2 Sep 2016         Y       N     N            15 Aug 2017       Y       Y      CAS, 2DS    2 Oct 2018       Y        Y     CAS, 2DS
 4 Sep 2016         Y       N     N            17 Aug 2017       Y       Y      CAS, 2DS    3 Oct 2018       Y        Y     CAS, 2DS
 6 Sep 2016         Y       N     CAS, 2DS     18 Aug 2017       Y       Y      CAS, 2DS    5 Oct 2018       Y        Y     CAS, 2DS
 8 Sep 2016         Y       N     CAS, 2DS     19 Aug 2017       N       N      CAS, 2DS    7 Oct 2018       Y        Y     CAS, 2DS
 10 Sep 2016        Y       Y     CAS, 2DS     21 Aug 2017       Y       Y      CAS, 2DS    10 Oct 2018      Y        Y     CDP-2, 2DS
 12 Sep 2016        Y       N     CAS, 2DS     24 Aug 2017       Y       Y      CAS, 2DS    12 Oct 2018      Y        Y     CDP-2, 2DS
 14 Sep 2016        Y       Y     CAS, 2DS     26 Aug 2017       Y       Y      CAS, 2DS    15 Oct 2018      Y        Y     CDP-1, 2DS
 18 Sep 2016        Y       Y     CAS, 2DS     28 Aug 2017       Y       Y      CAS, 2DS    17 Oct 2018      Y        Y     CDP-2, 2DS
 20 Sep 2016        Y       Y     CAS, 2DS     30 Aug 2017       Y       Y      CAS, 2DS    19 Oct 2018      Y        Y     CDP-2, 2DS
 24 Sep 2016        Y       N     CAS, 2DS     31 Aug 2017       Y       Y      CAS, 2DS    21 Oct 2018      Y        Y     CDP-2, 2DS
 25 Sep 2016        Y       N                                                               23 Oct 2018      Y        Y     CDP-2, 2DS
 27 Sep 2016*       Y       N

on each instrument given in Gupta et al. (2021), Redemann               proportional to its diameter and produces a two-dimensional
et al. (2021), and references therein.                                  shadow image. The 2DS is a stereo probe with horizontally
                                                                        (H) and a vertically (V) mounted arrays measuring droplet
2.3.2   Instruments                                                     n(D) simultaneously and independently. However, due to
                                                                        soot deposition on the inside of the receive side optical lens
The CAS and the CDP sample particle n(D) as a function                  for the V channel, only data from the H channel data were
of particle diameter D by measuring the intensity of light              available for ORACLES 2016. To maintain consistency, 2DS
emitted by a laser which is then scattered over some scatter-           n(D) from the H channel is used for 2017 and 2018 as
ing angles (between 4–12◦ ) by particles passing through the            well, despite the availability of n(D) from the V channel
probe’s sample volume (Baumgardner et al., 2001; Lance et               for these deployments. This decision is justified by the fact
al., 2010). The CAS and CDP data were both processed us-                that available n(D) data between the H and V channels were
ing the University of North Dakota Airborne Data Processing             highly correlated: the Pearson correlation coefficients were
and Analysis Software Package (ADPAA), an open-source                   0.94 (N = 6125) and 0.98 (N = 9886) for 2017 and 2018
software (Delene, 2011). Both the CAS and CDP can mea-                  respectively. The 2DS data were processed using the Univer-
sure particles with 0.5(2) < D < 50 µm and particles with               sity of Illinois/Oklahoma Optical Probe Processing Software
D > 3 µm are identified as cloud droplets in this study. CAS            (UIOOPS; McFarquhar et al., 2018) and were used to deter-
data were available for most of the research flights across the         mine droplet n(D) for 50 < D < 1280 µm.
three deployments (Table 1), and therefore CAS data are used               The droplet n(D) from the CAS and CDP (D < 50 µm)
for n(D) over 3 < D < 50 µm. For research flights starting              as well as 2DS (50 < D < 1280 µm) were combined and
from 10 October 2018, the CAPS components had an instru-                droplet concentration (Nc ), re , and liquid water content
ment malfunction and CDP data were used. The CDP has                    (LWC) were calculated for each 1 s average. LWC was cal-
been deployed in numerous field campaigns and has been                  culated by integrating the droplet mass distribution over the
used for evaluation of cloud properties from various remote             entire size range (third moment of the droplet size distri-
sensing platforms (e.g., King et al., 2013; Alexandrov et al.,          bution), and a 1 s average is recorded as a cloud sample if
2018; Sarkar et al., 2020).                                             Nc > 10 cm−3 and LWC > 0.05 g m−3 . The LWP was calcu-
   The SPEC 2DS is used to sample droplet n(D) beyond                   lated for each cloud profile by integrating the LWC for each
the detection limit of the CAS and CDP, i.e., for D > 50 µm.            cloud sample from cloud base to cloud top. Since droplets
The 2DS is an optical array probe (OAP) that consists of                with D > 50 µm are typically classified as drizzle, LWP cal-
two arrays with 128 photodiodes (mounted both horizon-                  culated using LWC over the 3 < D < 50 µm (D > 50 µm)
tally and vertically), where each photodiode has an effec-              size range was classified as the in situ CWP (RWP). A com-
tive pixel size of 10 µm (Lawson et al., 2006). The droplet             parison of in situ CWP and RWP and retrieval-based CWP
n(D) is determined as each droplet passing through the probe            and RWP is presented in Sect. 5. Uncertainties of probe-
sampling volume occludes a certain number of photodiodes                derived CWP and RWP are unavailable at this time but ac-

Atmos. Chem. Phys., 21, 5513–5532, 2021                                                    https://doi.org/10.5194/acp-21-5513-2021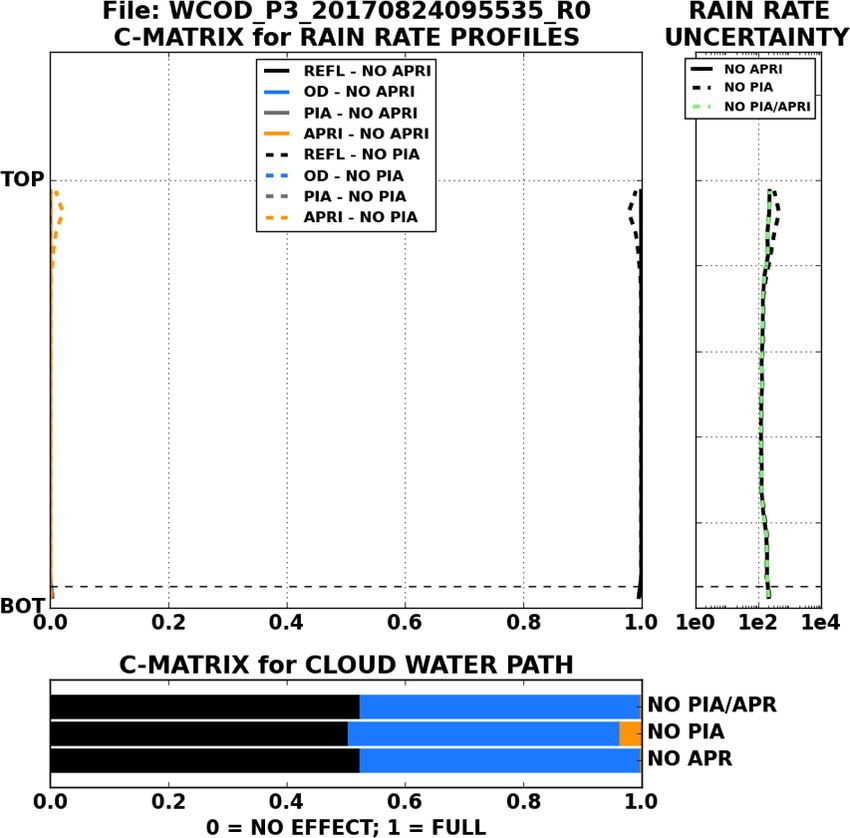
A. M. Dzambo et al.: Joint cloud water path and rainwater path retrievals 5517
knowledge the sizing uncertainty in CAS/CDP sizing is ap- the integral constraints from the observed COD and PIA. The
proximately 10 % with corresponding N uncertainties of less visible optical depth observed by the RSP includes contribu-
than 50 %. tions from cloud water content (CWC) and rainwater con-
tent (RWC) and can be modeled as (also see Lebsock and
L’Ecuyer, 2011)
3 Retrieval methodology
Htop
Z
The joint APR-3 and RSP cloud and precipitation retrieval 3Qext CWC RWC
τmod = + dz. (4)
algorithm (hereafter, denoted WCOD) is an extension of 4ρw re,cld re,pcp
the radar-only rainfall algorithm described in Dzambo et Hbot
al. (2019). This updated algorithm explicitly accounts for On the right-hand side of Eq. (4), ρw is the density of liq-
cloud water, constrained using the RSP COD estimate (sen- uid water, Qext is the extinction efficiency (set to 2 in the
sitive to cloud water and rainwater contents), which pro- limit of geometric optics), and re,cld and re,pcp are the ef-
vides additional insights into how cloud water and rainwa- fective radii corresponding to the cloud water and rainwater
ter contents are distributed through each radar profile. Such contents. The cloud effective radius in this case is directly
partitioning has been done before with ground-based radar input from available RSP data, whereas the rain effective ra-
(e.g., Cadeddu et al., 2020; Wu et al., 2020) and satellite ob- dius is parameterized following Abel and Boutle (2012) via
servations (Lebsock and L’Ecuyer, 2011; Mace et al., 2016). a lookup table. Assumptions about the vertical variation of
An airborne analogue to this partitioning method is presented CWC and re,cld are discussed in Sect. 3.2. Equation (4) sup-
in this section. plies the physical model for the optical depth constraint in
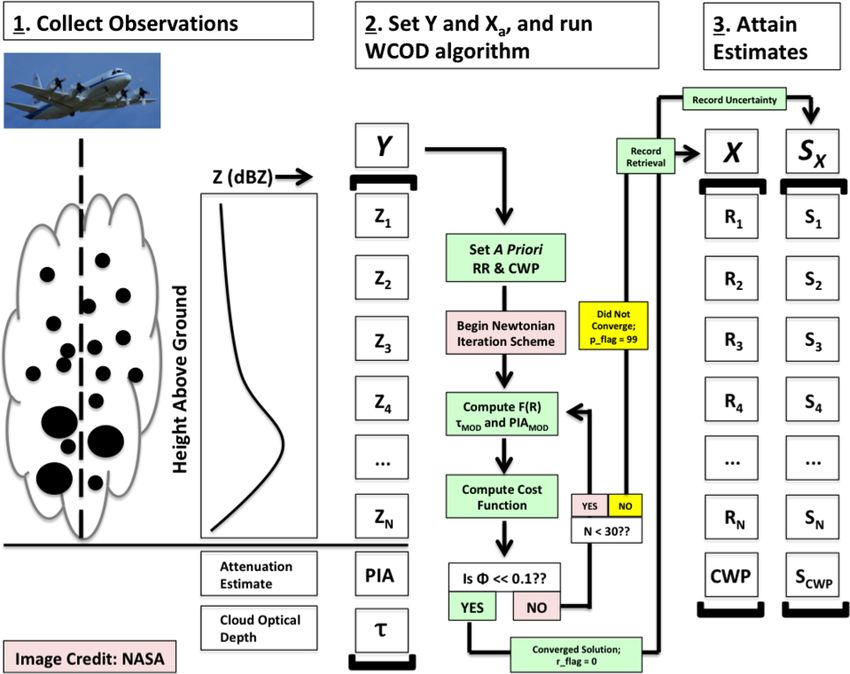
Eq. (3). The algorithm mechanics described in this subsec-
3.1 Retrieval mechanics
tion are further illustrated in Fig. 1.
The mechanics of the algorithm presented here closely fol-
3.2 Observation and model uncertainties
low those outlined in Lebsock and L’Ecuyer (2011), where
CloudSat W-band radar reflectivity measurements and a The available data from ORACLES enables finer tuning of
cloud optical depth constraint from MODIS are used to infer several key assumptions made in D19. First, PIA is estimated
precipitation rate and cloud water path. The only difference by taking the difference between σ0 in a given radar pro-
between the WCOD approach and Lebsock and L’Ecuyer file and the observed surface backscatter (or σ0 ) in a nearby
(2011), aside from the data sources, is the explicit use of a clear-sky profile. This reduces the need for the lookup ta-
cloud top effective radius. The WCOD algorithm uses a radar ble (LUT) of clear-sky σ0 and has the benefit of fixing the
reflectivity profile (Z), a COD (τ ), and path-integrated atten- measurement uncertainty to that of the APR-3 measurement
uation (PIA) constraints, uncertainty (1 dB). For most radar data, clear-sky PIA esti-
Y = [Z1 , Z2 , . . ., ZN , τ, PIA] , (1) mates are possible using this technique; however, the LUT
approach is still needed for estimating PIA and PIA uncer-
to solve for a profile of rainwater contents or rainfall rates tainty for scenes with extensive unbroken cloud cover. Sec-
(R) and a cloud water path (CWP), ond, the vertical resolution of the radar and the added τ con-
straint allow CWP to be appropriately distributed through the
X = [R1 , R2 , . . ., RN , CWP] , (2) observed cloud. Retrieving a complete profile of CWC re-
where the subscript N represents the total number of reflec- quires vertically resolved cloud measurements insensitive to
tivity measurements, and RN is either the rainwater content precipitation, which are not generally available from remote
or rainfall rate at the surface. The algorithm attempts to min- sensing instrumentation. Nevertheless, reasonable CWC es-
imize a cost function: timates are necessary to constrain attenuation due to cloud
h i water. In Lebsock and L’Ecuyer (2011) and D19, cloud water
8 (X, Xa , Z) = [F (R) − Z]T SZ−1 [F (R) − Z] content was parameterized as a function of cloud top height
h i (H ) and surface rain rate (R) (i.e., Eq. 10 in Lebsock and
+ (X − Xa )T Sa−1 (X − Xa ) L’Ecuyer, 2011),
(τmod − τ )2 (PIAmod − PIA)2 log10 (CWP) = 2.147 + 0.011H
+ + , (3)
στ2 2
σPIA + 0.132log10 (R) [Nimbostratus],
where X represents the retrieved precipitation rates and CWP, log10 (CWP) = 2.186 + 0.017H
Xa represent the a priori precipitation rates and CWP (de- + 0.129log10 (R) [Congestus],
scribed in Sect. 3.3), and τmod and PIAmod represent the mod-
eled optical depth and path-integrated attenuation respec- and CWC was assumed to be constant with altitude. The
tively. The last two terms on the right-hand side of Eq. (3) are algorithm introduced here instead assumes that the cloud
https://doi.org/10.5194/acp-21-5513-2021 Atmos. Chem. Phys., 21, 5513–5532, 2021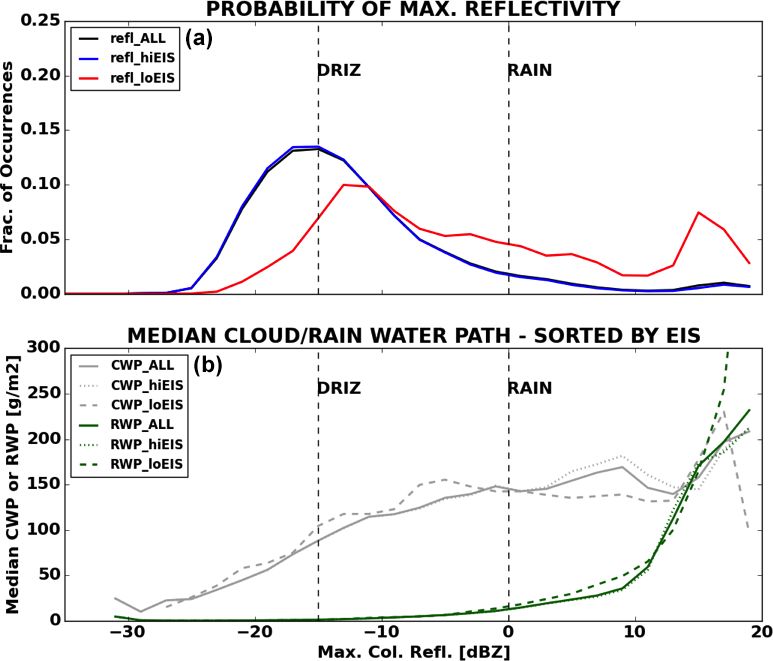
5518                                                A. M. Dzambo et al.: Joint cloud water path and rainwater path retrievals

Figure 1. A diagram highlighting the algorithm mechanics described in Sect. 3 of the text. For the final retrieval vector X and corresponding
uncertainties Sx , both rainfall rate and rainwater content are retrieved at each level. CWP is retrieved directly from this procedure, while
RWP is computed by integrating the column RWC and adjusted following the sub-cloud evaporation procedure described in the text.

base altitude occurs at the altitude of maximum reflectivity, a          the cloud (Gupta et al., 2021). During ORACLES, the maxi-
characteristic of precipitating warm clouds, and CWP is dis-             mum radar reflectivity sometimes occurs at or near cloud top,
tributed from the top of the cloud (i.e., the first radar reflec-        meaning the entire CWP would be distributed into the top 1–
tivity) down to this altitude following Bennartz (2007), who             3 radar bins and result in unreasonably large CWCs. To cir-
suggested that cloud water content (CWC) increases propor-               cumvent this potential problem, CWP is distributed through
tionally to height (H ) vertically, i.e.,                                the top six radar bins if the cloud spans six or more bins
                                                                         (six bins corresponds to approximately 200 m of cloud depth
CWC ∝ H                                                         (5)      from radar profiles taken at transit altitudes) or spans the en-
          Htop
          Z                                                              tire profile if the cloud spans fewer than six bins. Otherwise,
                                                                         CWP is distributed from the top of the cloud to the altitude
CWP =          CWC (z) dz,                                      (6)
                                                                         of maximum reflectivity if the maximum radar reflectivity is
        Hbot                                                             greater than −15 dBZ, which several studies have suggested
                                                                         is representative of drizzle onset (Mace and Sassen, 2000;
where H is the in-cloud altitude.
                                                                         Liu et al., 2008) and assumed to be cloud base in this study.
   Preliminary results from ORACLES show that CWC in-
                                                                         This methodology is very similar to the methodology pre-
creases with height approximately following Eq. (5), though
                                                                         sented by Wu et al. (2020), ensuring all CWC occurred above
entrainment near the cloud top can result in CWC becom-
                                                                         cloud base. We also note that the retrieved CWP is insensi-
ing constant or decreasing rapidly with altitude at the top of

Atmos. Chem. Phys., 21, 5513–5532, 2021                                                     https://doi.org/10.5194/acp-21-5513-2021
A. M. Dzambo et al.: Joint cloud water path and rainwater path retrievals 5519
tive to the number of radar bins used for inferring CWC in rates is set to an a priori value of 0.1 mm h−1 with a vari-
the column (not shown). ance that extends 3 orders of magnitude around this value
We account for uncertainty in the CWC profile inferring (i.e., allowing retrieved rainfall rates to vary between 10−4
CWP using the following two approximations: and 102 mm h−1 ).
The a priori constraint for CWP is estimated using an ad-
CWP = γad τc ρw re (7) justed adiabatic water model:
and ZH
CWPa = zfad 0ad dz. (12)
CWP = γconst τc ρw re , (8)
0.8H
where τc is the optical depth from the cloud water compo- The terms z, fad , and 0ad (T , p) represent the altitude in
nent, ρw is the density of liquid water, re is the cloud top cloud (where H is equal to the distance between cloud top
effective radius, and γad in Eq. (7) is valid for cases when and cloud base following our definitions), the degree of adi-
CWC increases with altitude in cloud (i.e., the adiabatic as- abaticity (1 = fully adiabatic; anything less is sub-adiabatic),
sumption, with γad = 5/9), whereas γconst is valid if the cloud and the adiabatic increase of liquid water content with height.
has a vertically invariant drop distribution (i.e., γconst = 2/3). Following Merk et al. (2016) the terms fad and 0ad are set
These models introduce uncertainty of about 20 % in the to 0.8 and 2.0 g m−3 km−1 respectively, although in practice
CWP estimates. The RSP effective radii contribute additional 0ad is a function of both pressure and temperature and can
uncertainties of 5 % to the CWP retrieval (Alexandrov et al., vary between 0.3 and 1 (Albrecht et al., 1990; Merk et al.,
2018). Given this assumption for CWC through the profile, 2016). Computing the exact value using the local thermody-
we do account for variability in re through the profile and namic state offers no additional value to the algorithm given
uncertainty that may arise from variable re through each pro- the large uncertainty associated with the a priori estimate.
file. Finally, reliable uncertainty estimates of COD in regimes Using the full radar profile for the a priori CWP estimate fol-
with high reflectance are not available at this time and are lowing this method would result in extremely large and un-
also not accounted for in this version of the algorithm. realistic CWP; thus, the a priori CWP is computed using the
With this model for the vertical distribution of cloud water, radar bins closest to the cloud top. Finally, in the absence of
the error covariance matrices in Eq. (3) are constructed as RSP data, the a priori CWP and distribution of CWC through
2 2 2 the radar profile defaults to Eq. (10) in Lebsock and L’Ecuyer
Sy (Z) = σZ_meas + σatt + σZ_DSD , (9)
(2011); this procedure replicates CWC as in the first version
Sy (τ ) = στ2_meas + σcwp
2
+ σr2e , (10) of WCOD (i.e., 2C-RAIN described in D19).
and 3.4 Contribution matrices
2
Sy (PIA) = σPIA_meas , (11) To assess the relative contribution of each source of uncer-
tainty to the retrieved CWP and rainfall rates at each level,
2
where σZ_meas 2 , and σ 2
, σatt Z_DSD are the uncertainties from the contribution matrix (or C matrix) is computed. Following
the measured reflectivity, modeled attenuation, and drop size Lebsock and L’Ecuyer (2011),
distribution assumptions respectively; στ2_meas is the uncer-
tainty in the measured COD; σcwp 2 is the uncertainty in the Sx = Ca + CZ + Cτ + CPIA , (13)
CWP estimate between Eqs. (7) and (8); σr2e is the uncertainty Ca = S−1 (14)
a ,
2
in re ; and σPIA_meas is the uncertainty in the measured PIA.
LT L
In the present work, we adopt the Abel and Boutle (2012) CZ = K T S−1
Z K, Cτ = , (15)
raindrop size distribution and retain the 2 dB uncertainty in στ2
reflectivity adopted by Lebsock and L’Ecuyer (2011) to al- and
low for potential overestimation of the error from the DSD.
Though it is beyond the scope of the present study, collo- MT M
CPIA = 2
, (16)
cated Ka-band and Ku-band radar channels could be used in σPIA
the future as a constraint on DSD parameters (e.g., slope and
shape parameters). where K, L, and M are partial derivatives of reflectivity, op-
tical depth, and PIA with respect to prescribed perturbations
3.3 A priori estimate in reflectivity, COD, and PIA respectively. Each C matrix
provides the fractional contribution of each error source to
The a priori constraint serves to keep the algorithm from re- the uncertainty in all retrieved quantities. The improved un-
trieving unrealistic precipitation rates, RWP and CWP. As certainty characterization by virtue of having high-resolution
in Lebsock and L’Ecuyer (2011), the full profile of rainfall data from ORACLES offers a unique opportunity to assess
https://doi.org/10.5194/acp-21-5513-2021 Atmos. Chem. Phys., 21, 5513–5532, 20215520 A. M. Dzambo et al.: Joint cloud water path and rainwater path retrievals
the impact of each C matrix on the final retrieved quan- reveal contributions between 0.4 and 0.55 by the observed
tities and their respective uncertainties. A similar method reflectivity, with the remaining contribution coming almost
was employed in Leinonen et al. (2018), where a multi- entirely from the observed optical depth.
frequency radar technique was developed for snowfall and
demonstrated the utility of ensuring their retrieved quantities 4.2 Trade cumulus
were well constrained by the observations. The contributions
of each algorithm input are discussed extensively in Sect. 4. The scene in Fig. 2 represents a very typical case from ORA-
CLES, for which the WCOD algorithm was optimized. To il-
lustrate the limitations of this algorithm, we examine a heav-
4 Algorithm performance and results ily precipitating trade cumulus observed by the APR-3 along
a NW-to-SE flight track just south of the Equator (Fig. 5).
A total of 1.28 million collocated RSP and APR-3 pro- The observed W-band reflectivity exceeded 20 dBZ in many
files containing valid RSP COD and re and APR-3-detected of the profiles and experienced heavy attenuation exceeding
cloud cover span all three ORACLES deployments. Re- 20 dB during the first minute of the scan. During this period,
trieved surface precipitation rates greater than 1 mm h−1 (or the algorithm corrects the near-surface reflectivity (from the
24 mm d−1 ) make up only 3 % of the total dataset. However, lowest resolvable bin up to ∼ 700 m) by 15–25 dB. For sev-
trade cumulus near the Equator and cumulus in the Sc-to- eral profiles, the propagation of errors by the algorithm result
Cu transition region around Ascension Island often contained in non-retrievable solutions indicated by missing data in the
surface precipitation rates greater than 1 mm h−1 . To demon- center of Fig. 5.
strate the algorithm’s performance across common condi- Observed optical depths by the RSP often exceeded 20.
tions observed during ORACLES, while also highlighting The heaviest precipitation within the first minute of the scan,
the algorithm’s performance in a limiting case such as trade evident in the modeled reflectivity plot (Fig. 5, top-middle
cumulus precipitation, two representative case studies are se- panel) and corroborated by the RWP and RR retrieved quan-
lected and presented in the following two subsections. A tities, results in rain optical depths approaching 5 (bottom
summary of CWP and RWP statistics for the entire ORA- panel). Corresponding RWP retrievals fall in the ∼ 300–
CLES campaign is also presented. 500 g m−2 range, with the heaviest rain containing nearly
800 g m−2 of RWP. The CWPs associated with these heaviest
4.1 Drizzling stratocumulus rain cells are below ∼ 100 g m−2 , suggesting that a substan-
tial fraction of cloud droplets have been converted to rain.
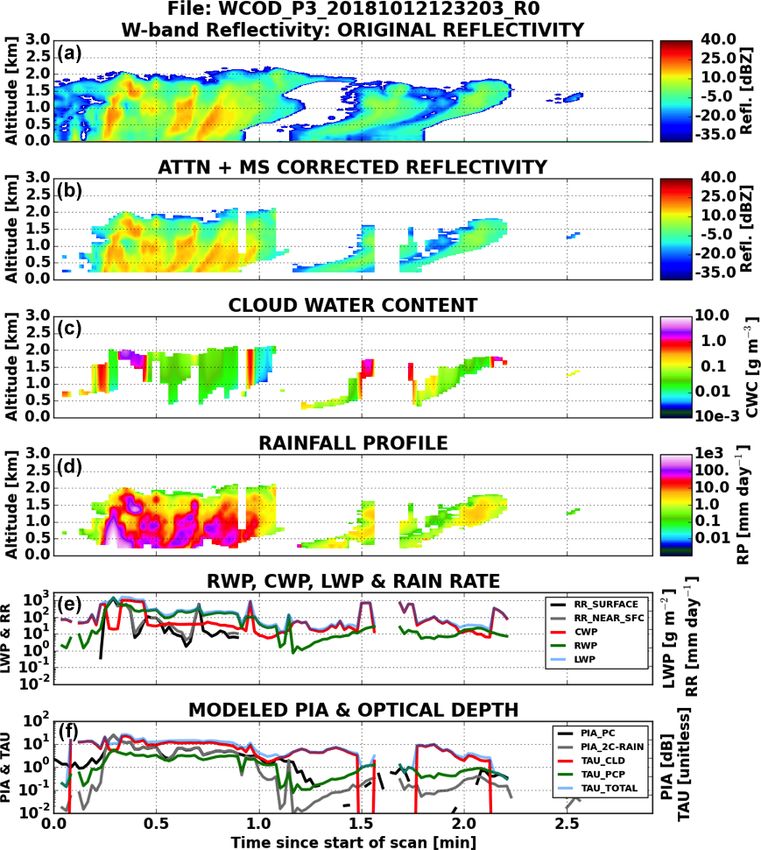
Figure 2 shows a typical drizzling Sc scene from ORA- Data contained in the second minute of the scene in Fig. 5
CLES. This scene, which spans a little over 1 min of flight tell a much different story. Total optical depths in this time
time (or ∼ 5 km), contains two drizzling cells with maximum range generally vary between 5 and 10 units, but the much
column rain rates reaching a maximum value approaching lower RWC and less than 1 dB of PIA contained in these pro-
1 mm d−1 . Nearly every profile contains a RWP between 0.1 files result in the total LWP being dominated by CWP. Noting
and 10 g m−2 . The scene shown in Fig. 2 also shows a nearly the lower reflectivity in the second half of this segment, the
uniform CWP and total optical depth. As noted previously, much larger CWP relative to RWP is indicative of less ac-
the RSP performs best over non-broken cloud, and given that tive collision–coalescence. Broken cloud is evident between
most total LWPs are under 150 g m−2 in this scene, the re- minutes 1.4 and 1.6, which introduces a potential source of
trieved CWPs are very accurate, with uncertainties between uncertainty in the RSP COD via 3-D effects.
25 %–30 %. The measurement and a priori contributions to the re-
The C-matrix computations and mean precipitation rate trieved rainfall rate at each level and retrieved CWP are
uncertainties (Fig. 3) for the weakly drizzling scene in shown in Fig. 6. From the main panel of Fig. 6, the reflec-
Fig. 1 are given in Fig. 4. The uncertainty contributions to tivity profile contributes the most to the final retrieved pre-
the retrieved precipitation rate profile come almost entirely cipitation profile, with the a priori constraint contributing
from the reflectivity. This finding follows both Lebsock and ∼ 10 %–20 % of the uncertainty in the bottom half of the
L’Ecuyer (2011) and Lebsock et al. (2011), who found that profile. PIA contributes a small but non-negligible amount of
CloudSat rainfall retrievals nearly exclusively rely on the ob- uncertainty in the lowest bins, consistent with results shown
served reflectivity profile in the retrieved precipitation rate in Lebsock and L’Ecuyer (2011). The PIA contribution often
profile for weakly (or non-) drizzling Sc. The mean uncer- exceeds 5 %–10 % for the largest rainfall rates (not shown)
tainties near cloud top in this scene reflect weak precipita- and, unsurprisingly, adds further uncertainty to near-surface
tion on the order of ∼ 10−2 mm h−1 or less. The evaporation rainfall rates (L’Ecuyer and Stephens, 2002). Near the top
model results in complete evaporation of precipitation be- of the cloud, where reflectivity exclusively contributes to
fore reaching the surface, which is expected given the mean the uncertainty, the retrieved precipitation rate uncertainties
rain drop radii near the surface were consistently less than are ∼ 100 %. Uncertainties increase with depth in the cloud,
∼ 40 µm (not shown). The C-matrix computations for CWP reaching 300 %–1000 % in the bottom of each profile, consis-
Atmos. Chem. Phys., 21, 5513–5532, 2021 https://doi.org/10.5194/acp-21-5513-2021A. M. Dzambo et al.: Joint cloud water path and rainwater path retrievals 5521 Figure 2. WCOD retrieval for a pair of lightly drizzling stratocumulus clouds observed by the APR-3 (a) on 24 August 2017. The model- corrected reflectivity (b) for this scene, along with retrieved RWC (c) and rainfall profile (d), is also shown. The bottom two panels (e, f) show retrieved water paths (cloud, rain, and total), rainfall rates (surface or evaporation-corrected rainfall rate and near-surface rainfall rate), attenuation (“PC” or observed and “WCOD” or modeled), and optical depths (cloud, rain and total). The lower LWP and optical depth values around minute 10.5 correspond to a short period where the RSP was not operating. tent with growing uncertainty due to the accumulated errors leave only profiles where the final uncertainty was deter- in attenuation corrections. At the base of the cloud, uncer- mined by the PIA, reflectivity, and optical depth. Figure 7 tainties with any appreciable PIA contribution (i.e., > 0.01) shows how the profile of mean precipitation rate uncertainty result in uncertainties exceeding 1000 % or more. Clearly changes when the PIA and a priori constraints are elimi- even successful retrievals in the first minute of this scene nated from the pool of available profiles. The mean contri- have rainfall rates near the upper limit of the range of al- bution from the a priori constraint is < 0.05 at all levels in gorithm applicability consistent with prior spaceborne radar this scene. However, removing profiles with the a priori con- rainfall retrievals (e.g., Haynes et al., 2009). straint (any profile with an a priori contribution > 0.01) re- Figure 6 also shows that the a priori constraint contributes sults in a reduction of uncertainty by factors of 2–5. Elimi- heavily in heavier rainfall. Eliminating such profiles would nating the contributions of PIA to the total uncertainty yields https://doi.org/10.5194/acp-21-5513-2021 Atmos. Chem. Phys., 21, 5513–5532, 2021
5522                                                    A. M. Dzambo et al.: Joint cloud water path and rainwater path retrievals

Figure 3. Mean contribution matrix (or C matrix) calculations rela-         Figure 4. As in Fig. 3 but for profiles where the a priori constraint
tive to cloud height for the radar profiles shown in Fig. 2. The C ma-      contributed minimal uncertainty (solid line) and profiles where the
trix for each retrieved rainfall rate, as well as CWP, was calculated       a priori or PIA constraints contributed minimal uncertainty (dashed
according to Eq. (13). Individual C-matrix profiles are normalized          lines).
to the full length of the reflectivity profile (i.e., 0: radar echo base,
1: radar echo top). Data below the dashed line indicate a C-matrix
calculation for both the surface (i.e., corrected for evaporation) and
near-surface precipitation rates and are exactly the same for both          erbate uncertainty at each altitude through the cloud. Similar
precipitation rate quantities. In the bottom panel, the contributions       to the drizzling Sc scene, the a priori uncertainty does little
from reflectivity, optical depth, PIA, and a priori uncertainties are       to affect the final uncertainty in CWP, with most uncertain-
respectively shown in black, blue, gray, and orange.                        ties falling between 25 %–30 %. The a priori constraint con-
                                                                            tributes very little to the retrieved CWP, indicating that cloud
                                                                            water is well constrained by the available observations.
a minor reduction to the mean uncertainty profile but is not                   These two test studies reveal the following general charac-
nearly as dramatic as when the a priori contribution is re-                 teristics of the WCOD algorithm:
moved. When comparing the uncertainties between Figs. 6
and 7, the uncertainty in the bottom half of the heavily pre-                 1. For cases when optical depth is appreciable and moder-
cipitating profiles scale down by factors of 2–3 compared to                     ate to heavy precipitation is falling, the CWP retrieval
the weakly drizzling profiles. This difference is almost as-                     relies more on the observed optical depth because large
suredly due to the large attenuation propagating uncertainties                   RWP affects the uncertainty in the optical depth more
deeper into the cloud (Hitschfield and Borden, 1954). Com-                       than the reflectivity, and reflectivity is subject to both at-
paring Figs. 6 and 3 also reveals less contribution by the PIA                   tenuation and DSD uncertainties that propagate deeper
especially near the surface. This could be due to one of the                     into a profile.
following two reasons:
  1. the PIA integral constraint is not linked to the retrieved
                                                                              2. For cases in weakly or non-drizzling Sc, the uncertainty
     cloud water path as in Lebsock et al. (2011) and/or
                                                                                 in the optical depth becomes larger relative to the uncer-
  2. the PIA uncertainty is manifested in the reflectivity un-                   tainty in the reflectivity due to less DSD and attenuation
     certainty through the σatt2 term, thereby distributing the                  uncertainty (even though RWP is small), resulting in a
     (little) attenuation through the column.                                    larger contribution by the reflectivity.

Optical depth contributes approximately 90 % to the total
uncertainty in CWP, with the reflectivity contributing the                    3. Regardless of the case, the measured optical depth con-
remaining 10 %. This contribution by reflectivity is signifi-                    sistently contributes a majority (i.e., between 0.5 and
cantly less than that observed by the drizzling Sc scene, pre-                   0.9 in these two cases) of the total uncertainty in any
sumably because attenuation effects through the profile exac-                    CWP retrieval.

Atmos. Chem. Phys., 21, 5513–5532, 2021                                                        https://doi.org/10.5194/acp-21-5513-2021
A. M. Dzambo et al.: Joint cloud water path and rainwater path retrievals 5523
Figure 5. Similar to Fig. 2 but for a heavily precipitating trade cumulus cloud observed by the APR-3 on 12 October 2018.
5 WCOD CWP and RWP evaluation 2018). Another issue arises with temporal comparisons of
cloud properties. While the Sc cloud deck can exist for sev-
5.1 Evaluation methodology eral days or longer, individual clouds grow and dissipate on
timescales of less than an hour. To accommodate the result-
As with any airborne-based evaluation study between in situ ing sampling mismatches, we collectively examine statistics
and remotely sensed observations, a big uncertainty is the for all quasi-simultaneous retrieval and in situ measurements
fact that the in situ and remote sensing instrumentation never across each individual campaign year excluding flights or
actually measure the same volume of cloud at the same time. data subsets where any of APR-3, RSP, or cloud probe data
This is especially difficult for precipitation, where compar- are missing. We define quasi-simultaneous as any radar pro-
ing precipitation estimates is challenging due to collocation file occurring within 5 min and within 0.125◦ latitude or lon-
issues (e.g., Meneghini et al., 2001), small-scale heterogene- gitude (∼ 13 km) of an in situ profile. For a typical aircraft
ity along short distances (e.g., Tridon et al., 2019), and gen- speed of 80 m s−1 , and noting the APR-3 collects 24 profiles
eral complications arising from diagnostics used for com- every 1.2 s, this corresponds to a maximum of 12 000 compa-
paring precipitation variables between datasets (Kay et al., rable profiles per in situ profile. For our study, this definition
https://doi.org/10.5194/acp-21-5513-2021 Atmos. Chem. Phys., 21, 5513–5532, 20215524 A. M. Dzambo et al.: Joint cloud water path and rainwater path retrievals
jority of cloud depths estimated by radar in D19) or with a
RWP less than 0.25 g m−2 are not considered in this analy-
sis. The number of profiles following this screening proce-
dure, along with the total number of WCOD profiles nearby
a cloud probe profile following the aforementioned screening
procedure, are shown in Table 2.
5.2 Comparison between in situ and retrieved CWP
and RWP
A summary of CWP and RWP retrieved and measured in situ
is presented in Fig. 8. RWP overall tends to agree somewhat
better than CWP between WCOD and the in situ estimates.
CWP data for 2018 agree best, with the mean (median) CWP
exceeding the probe estimates by 9 g m−2 (8 g m−2 ). The
mean CWP values for the WCOD and cloud probe data from
each data subset are 79 and 70 g m−2 respectively. The large
standard deviations in CWP from WCOD suggest wide vari-
ability in cloud macrophysical properties, especially given
the 3-fold sampling increase. With this in mind, the variabil-
Figure 6. Similar to Fig. 3 but for mean contribution matrix (or
ity in CWP is lowest in 2016 compared to either 2017 or 2018
C matrix) calculations relative to cloud height for the radar profiles for both WCOD and probe datasets, suggesting more simi-
shown in Fig. 5. lar cloud properties during this campaign year. We speculate
CWP would agree better if all thin, broken cloud were ob-
served, such that we could re-perform this verification tech-
nique without RWP or cloud thickness thresholds.
The mean RWP from the WCOD and cloud probe data
subsets is 15 and 9 g m−2 respectively. RWP tends to be
a fraction of the total LWP overall in most cases with the
largest RWPs again coming in 2018 for both data subsets.
Variability in RWP between WCOD and the cloud probes is
lowest for 2016, corresponding to the low variability in CWP
for 2016 as well.
Although RWP generally agrees between measurement
platforms, several sources of uncertainty will need to be ac-
counted for in future studies. Horizontal variability is one
such source of CWP uncertainty, especially in situ CWP esti-
mates where each profile was computed over at least ∼ 5 km
geometric distance. Although we can rule out the possibility
of ultra-thin cloud biasing our analysis using this verification
technique, the WCOD reflectivity screening procedure pos-
sibly removes some valid cloud cover near the cutoff of the
stated thickness threshold. Figure 9 supports this hypothesis,
as several cloud probe estimates exceeding 15 g m−2 (a proxy
for raining conditions) occur at relatively low CWP.
Figure 7. As in Fig. 6 but for profiles where the a priori constraint We also recognize the bulk validation presented here does
contributed minimal uncertainty (solid line) and profiles where the not necessarily imply point measurements between the cloud
PIA contributed minimal uncertainty (dashed lines). probes and nearest retrievable RWP from radar measure-
ments are the same. The point of this evaluation was to com-
pare the large-scale retrieval capabilities from remote sens-
of quasi-simultaneous allows for ∼ 1200 WCOD profiles per ing platforms to accurate in situ-based measurements, and
in situ profile. our efforts to match WCOD profiles within a short period of
To ensure profiles from cloud probe data represent scenes time (5 min) and within a reasonable distance (25 km) help
that would be detected by the APR-3, any probe data mea- mitigate some uncertainty with this comparison. In any case,
suring a cloud thinner than 200 m (consistent with the ma- the collocation of CWP and RWP with above-cloud aerosol
Atmos. Chem. Phys., 21, 5513–5532, 2021 https://doi.org/10.5194/acp-21-5513-2021A. M. Dzambo et al.: Joint cloud water path and rainwater path retrievals 5525
Table 2. Summary of median, mean, and standard deviation values of CWP and RWP statistics from the WCOD retrieval and cloud probe
datasets. The mean and 1σ CWP or RWP are given in parentheses. The top three rows include the number of WCOD-only profiles that were
collocated to the in situ cloud probe data. The collocation procedure is described in the text.
WCOD Cloud probes
No. of profiles (2016) 24 497 9
No. of profiles (2017) 60 418 15
No. of profiles (2018) 74 149 76
CWP (2016) 69.8 (78.4 ± 38.2) [g m−2 ] 31.7 (40.2 ± 23.2) [g m−2 ]
CWP (2017) 62.9 (78.9 ± 55.6) [g m−2 ] 27.2 (35.3 ± 19.2) [g m−2 ]
CWP (2018) 69.6 (89.3 ± 58.8) [g m−2 ] 61.6 (80.6 ± 63.3) [g m−2 ]
RWP (2016) 0.7 (3.1 ± 51.1) [g m−2 ] 0.6 (0.8 ± 0.5) [g m−2 ]
RWP (2017) 1.1 (5.9 ± 59.7) [g m−2 ] 3.2 (3.7 ± 3.5) [g m−2 ]
RWP (2018) 1.4 (30.1 ± 212.1) [g m−2 ] 4.6 (11.3 ± 18.9) [g m−2 ]
Figure 8. A comparison of WCOD derived CWP versus cloud probe estimated CWP (a) and RWP (b). Quasi-simultaneous WCOD profiles
occurring within 5 min and 0.125◦ latitude (∼ 13 km) of an in situ profile are included in this comparison. The box-and-whisker plots
represent 95 % of all data, and the red squares represent the mean values. In the top panel, WCOD CWP is the combination of all WCOD-
based retrieved CWPs estimated by the algorithm. Any flight with a missing APR-3, RSP, or cloud probe dataset was excluded from the
statistics presented for each campaign year.
data from instruments like the High Spectral Resolution Li- Fig. 9) which showed CWP dominates the total LWP signal
dar (HSRL) promises a large, enriching dataset for the study in northeast Atlantic Sc.
of aerosol semi-direct and indirect effects. Our estimates of
CWP and RWP relative to total LWP are reasonable and
expected with all aspects considered and are supported by
the recent Cadeddu et al. (2020) study (see Tables 2, 4, and
https://doi.org/10.5194/acp-21-5513-2021 Atmos. Chem. Phys., 21, 5513–5532, 20215526 A. M. Dzambo et al.: Joint cloud water path and rainwater path retrievals
As noted in many previous studies, any meaningful analy-
sis of cloud–aerosol–precipitation interactions must account
for environmental variability (Douglas and L’Ecuyer, 2019,
2020). Two common measures of environmental state in-
clude estimated inversion strength (EIS; Wood and Brether-
ton, 2006) and sea surface temperature (SST). EIS is com-
puted as
850
EIS = LTS − 0m (z700 − LCL) , (17)
where LTS is the lower tropospheric stability (defined as the
difference in potential temperature between 700 mbar and the
surface), 0m850 is the moist adiabatic lapse rate at 850 hPa, and
LCL is the lifting condensation level. We use the European
Centre for Medium-Range Weather Forecasts (ECMWF) Re-
Analysis (ERA) Interim dataset (Dee et al., 2011) for SST
and for computing EIS. Nearly all EIS values from ORA-
CLES fell between −2 and 12 K, while SSTs ranged from
Figure 9. Distributions of RWP at various CWP amounts binned 289 K near the Namibian/Angolan coast to 301 K near the
every 10 g m−2 , with boxes representing median values. Each set Equator. CWP, RWP, and maximum column precipitation
of lines represents 95 % of all WCOD (light gray) or cloud probe
rate all increase with increasing SST or decreasing EIS.
(black) RWP estimates at the given CWP bin.
Table 3 reveals that both CWP and RWP were larger in un-
stable compared to stable environments. There were nearly
30 times as many profiles collected in stable environments
6 Campaign statistics of CWP and RWP (i.e., EIS > 0 K) compared to unstable environments, demon-
strating that (with a few exceptions) the majority of collo-
Throughout the ORACLES campaign, the APR-3 radar op- cated remote sensing data collected during ORACLES sam-
erators frequently reported situations where the aircraft was pled the Sc deck. The statistics in Table 3 are further broken
flying over Sc cloud yet the APR-3 radar failed to detect down in Fig. 10. The probability of maximum reflectivity is
cloud cover. We find that, for everywhere a valid RSP COD between −20 and −15 dBZ for stable environments, whereas
and APR-3 profile was collocated, an estimated 45 % of bimodal peaks in reflectivity occur in unstable environments
cloudy scenes appeared as “clear sky” to the APR-3. We with one peak between −15 and −10 dBZ indicative of light
showed in the previous section that, while controlling for drizzle or non-precipitating cloud and a second peak between
cloud thickness and RWP representative of drizzling Sc, 10 and 20 dBZ indicative of warm rain. This result is con-
CWP values from APR-3-detected clouds are biased high sistent with the cumulative frequency by altitude diagram in
compared to in situ estimates. Further, evidence suggests that Fig. 8 of Dzambo et al. (2019).
several ultra-thin, broken, and drizzling clouds are screened Both Table 3 and Fig. 10 show that CWP in unstable en-
out of this analysis. The topic of APR-3 warm cloud de- vironments tends to exceed CWP in stable environments for
tectability will be the topic of a future paper. The cam- all values of maximum reflectivity. RWP, by contrast, is com-
paign statistics presented here, therefore, represent primarily parable in all environments for maximum reflectivities under
cloudy profiles that are either drizzling/raining or near the 0 dBZ but again tends to be larger in unstable environments
onset of precipitation. at maximum reflectivities above this value. The largest diver-
The median CWP and RWP values retrieved from the re- gence in regime-based median RWPs occurs at reflectivities
sulting scenes are 90.3 and 1.7 g m−2 respectively (Table 3). > 10 dBZ, which occurs near the maximum range of valid
For CWP, the 1σ range (68 % of values) is between 41 and W-band reflectivity measurements. This reflects the fact that
168 g−2 , while the 3σ range (99 % of values) is between CWP and RWP are sensitive to cloud thickness, and thicker
6 and 445 g m−2 . RWP, by contrast, has a 1σ range (3σ clouds prevailed more often in unstable and marginally sta-
range) of 0.6 to 7 g m−2 (0.1 to 2892 g m−2 ). The range of ble (EIS between 0 and 4 K) environments (Fig. 7 in D19).
WCOD-retrieved values demonstrates that the majority of CWP values in excess of 150 g m−2 are measured frequently
LWP across all clouds is predominately CWP, although some in all environments but are especially frequent in unstable
heavy precipitation cases can dominate the total LWP. Recall, environments.
however, that this CWP range corresponds only to predomi- A cloud containing a maximum reflectivity of −15 dBZ
nately precipitating clouds detected by the APR-3, with both or greater (i.e., the onset of drizzle) will have a RWP of at
ranges likely being lower if ultra-thin cloud were detected least ∼ 1.5 g m−2 . Conditional precipitation fractions com-
and/or not screened out. puted from the WCOD dataset reveal that about 28 % of all
Atmos. Chem. Phys., 21, 5513–5532, 2021 https://doi.org/10.5194/acp-21-5513-2021You can also read


