Retrieval of liquid water cloud properties from POLDER-3 measurements using a neural network ensemble approach - Atmos. Meas. Tech
←
→
Page content transcription
If your browser does not render page correctly, please read the page content below
Atmos. Meas. Tech., 12, 1697–1716, 2019
https://doi.org/10.5194/amt-12-1697-2019
© Author(s) 2019. This work is distributed under
the Creative Commons Attribution 4.0 License.

Retrieval of liquid water cloud properties from POLDER-3
measurements using a neural network ensemble approach
Antonio Di Noia1,a , Otto P. Hasekamp1 , Bastiaan van Diedenhoven2,3 , and Zhibo Zhang4
1 SRON   Netherlands Institute for Space Research, Sorbonnelaan 2, 3584CA Utrecht, the Netherlands
2 Center for Climate Systems Research, Columbia University, 2910 Broadway, New York, NY 10025, USA
3 NASA Goddard Institute for Space Studies, 2880 Broadway, New York, NY 10025, USA
4 Physics Department, University of Maryland – Baltimore County, 1000 Hilltop Circle, Baltimore, MD 21228, USA
a now at: Department of Physics and Astronomy, University of Leicester, University Road, LE1 7RH Leicester, UK

Correspondence: Antonio Di Noia (adn9@le.ac.uk)

Received: 1 October 2018 – Discussion started: 2 November 2018
Revised: 20 February 2019 – Accepted: 21 February 2019 – Published: 18 March 2019

Abstract. This paper describes a neural network algo-                gard, it is worthwhile to mention that every day approxi-
rithm for the estimation of liquid water cloud optical prop-         mately between 55 % and 75 % of the Earth’s surface is cov-
erties from the Polarization and Directionality of Earth’s           ered by clouds (Stubenrauch et al., 2013). In addition to their
Reflectances-3 (POLDER-3) instrument aboard the Polariza-            role in the water cycle, clouds also impact the Earth’s climate
tion & Anisotropy of Reflectances for Atmospheric Sciences           by affecting the planetary energy balance in multiple ways.
coupled with Observations from a Lidar (PARASOL) satel-              They exert a cooling effect by reflecting incoming solar radi-
lite. The algorithm has been trained on synthetic multi-angle,       ation at visible wavelengths and a warming effect by absorb-
multi-wavelength measurements of reflectance and polariza-           ing and re-emitting infrared radiation (Rossow and Lacis,
tion and has been applied to the processing of 1 year of             1990; Rossow and Zhang, 1995). The impact of clouds on
POLDER-3 data. Comparisons of the retrieved cloud prop-              climate is further complicated by the existence of a number
erties with Moderate Resolution Imaging Spectroradiometer            of feedback mechanisms involving clouds and temperature
(MODIS) products show that the neural network algorithm              (Stephens, 2004) and by cloud–aerosol interactions (Rosen-
has a low bias of around 2 in cloud optical thickness (COT)          feld et al., 2014; Fan et al., 2016). According to the latest
and between 1 and 2 µm in the cloud effective radius. Com-           reports of the Intergovernmental Panel on Climate Change
parisons with existing POLDER-3 datasets suggest that the            (IPCC), the net effect of clouds on our climate is still highly
proposed scheme may have enhanced capabilities for cloud             uncertain (Boucher et al., 2013).
effective radius retrieval, at least over land. An additional fea-      In order to reduce our uncertainty about the effect of
ture of the presented algorithm is that it provides COT and          clouds on the climate system, it is crucial to establish a global
effective radius retrievals at the native POLDER-3 Level 1B          observational basis for a number of cloud properties. These
pixel level.                                                         include cloud cover, thermodynamic phase, optical thick-
                                                                     ness, droplet concentration, height and size. The estimation
                                                                     of cloud properties by means of satellite remote sensing has
                                                                     received significant attention in the last 3 decades. The most
1   Introduction                                                     widespread estimation methods infer cloud properties from
                                                                     measurements of reflected sunlight in the visible, near and
Clouds are undoubtedly one of the most important compo-              shortwave infrared spectral domain or from measurements
nents of the Earth system. Cloud formation and transport             of emitted radiation in the longwave infrared domain. Re-
processes are among the most imposing mechanisms through             flectance measurements in visible (VIS) and near-infrared
which water is daily redistributed across our planet, with ob-       (NIR) channels with no substantial water absorption are
vious implications for meteorology and climate. In this re-

Published by Copernicus Publications on behalf of the European Geosciences Union.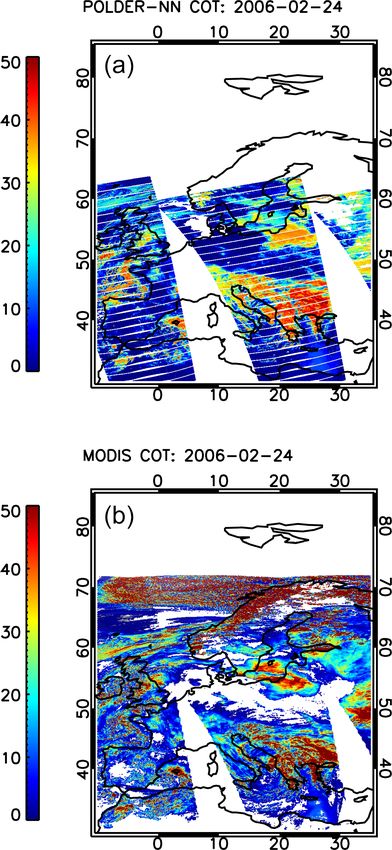
1698                                                       A. Di Noia et al.: Neural network cloud retrievals from POLDER

sensitive to the cloud optical thickness (COT), whereas re-       Scanning Polarimeter (RSP) instrument (Cairns et al., 1999),
flectance measurements in shortwave infrared (SWIR) chan-         techniques exist for estimating the complete cloud droplet
nels with significant absorption by liquid water or ice are       size distribution that rely on fewer and less-stringent assump-
sensitive to the cloud effective radius (Nakajima and King,       tions (Alexandrov et al., 2012b). In this paper we investi-
1990). Brightness temperature measurements in the thermal         gate an alternative method for the estimation of the COT and
infrared (TIR) allow the estimation of cloud top pressure         cloud effective radius from satellite multi-angle polarimet-
and temperature (Menzel et al., 2008). Furthermore, mea-          ric measurements, based on artificial neural networks (NNs).
surements in SWIR and TIR channels at which liquid wa-            NNs have been widely applied to cloud remote sensing prob-
ter and ice exhibit different absorption behaviour are suitable   lems, including cloud detection and classification (Miller and
for the estimation of the cloud thermodynamic phase (Baum         Emery, 1997; Aires et al., 2011; Taravat et al., 2015), re-
et al., 2000). The measurement principles mentioned so far        trieval of cloud properties based on traditional, plane-parallel
form the basis for the estimation of cloud properties from        radiative transfer assumptions (Cerdeña et al., 2007; Loyola
multispectral instruments such as the Moderate Resolution         et al., 2007, 2010, 2018; Håkansson et al., 2018), and three-
Imaging Spectroradiometer (MODIS), as described in King           dimensional retrievals (Cornet et al., 2004; Cornet et al.,
et al. (2003) and Platnick et al. (2003, 2017), or the Spin-      2005; Evans et al., 2008; Okamura et al., 2017). Among the
ning Enhanced Visible and Infrared Imager (SEVIRI; Roe-           attractive features of NN-based retrieval schemes are their
beling et al., 2006). Complementary information about the         high speed and their modest memory demand (at least after
cloud liquid and ice water path can be obtained from pas-         the training phase is completed), which make them suitable
sive microwave measurements (Vivekanandan et al., 1991;           for processing large amounts of measurements in very lit-
Liu and Curry, 1993), and information on the vertical struc-      tle time. Furthermore, NN retrievals have sometimes been
ture of clouds is provided by active instruments, which in-       shown to be more accurate than lookup-table (LUT) re-
clude spaceborne lidars (Wu et al., 2011) and cloud profiling     trievals with reasonably sized LUTs (Di Noia et al., 2015,
radars (Stephens et al., 2008).                                   2017; Whitburn et al., 2016). Besides the aforementioned ad-
   An additional source of information for the retrieval of       vantages, NN-based schemes also have some disadvantages
cloud properties from space is represented by multi-angle po-     with respect to other methods. One disadvantage is that they
larimetric observations, such as those provided by the Polar-     do not directly provide a measure of how well the retrieved
ization and Directionality of Earth’s Reflectances (POLDER)       parameters fit the measurements. Another disadvantage is
instruments (Deschamps et al., 1994), which will be fol-          that NN retrievals are designed by optimizing a cost func-
lowed by the by the Multi-Viewing Multi-Channel Multi-            tion that is not defined on a single retrieval but is defined on
Polarization Imaging (3MI) instrument (Fougnie et al., 2018)      a statistical sample. This means, for example, that a NN re-
in 2021. While the COT retrieval in POLDER Level 2 prod-          trieval performed on a single measurement is not necessarily
ucts follows a principle similar to that used in MODIS re-        the one that provides the best fit with that measurement when
trievals (Buriez et al., 1997), the retrieval of the cloud ef-    fed back to a radiative transfer model.
fective radius is based on the analysis of the polarized re-         While most of the NN-based cloud retrieval schemes have
flectance at scattering angles ranging from approximately         been developed for single-viewing, multispectral reflectance
140 to 165◦ . More specifically, in the presence of a liquid      measurements, the application of neural networks to multi-
water cloud, the polarized reflectance has a maximum at a         angle observations has been limited so far, with few exam-
scattering angle close to 142◦ (the primary cloudbow), and        ples in the closely related task of aerosol retrieval (Han et al.,
– if the droplet size distribution is narrow enough (effec-       2006; Di Noia et al., 2015, 2017), one in the context of
tive variance smaller than ∼ 0.05) – a number of secondary        three-dimensional cloud retrievals (Evans et al., 2008) and
maxima in the angular range from 145 to 165◦ . The scat-          a recently developed method for cloud retrievals from RSP
tering angles at which such secondary maxima occur de-            (Segal-Rozenhaimer et al., 2018). The main challenge posed
pend on the cloud effective radius (Bréon and Goloub, 1998;       by multi-angle measurements in the design of neural network
Bréon and Doutriaux-Boucher, 2005; Alexandrov et al.,             retrieval schemes lies in the variability in the combinations of
2012a). The amplitude of the angular oscillations of the po-      viewing angles at which the measurements are performed. In
larized reflectance instead depends on the effective variance,    fact, in such a situation the values taken by a measurement
with smaller effective variances leading to wider oscillations    vector are not only dependent on the atmospheric state to be
(Shang et al., 2015).                                             retrieved but are also strongly dependent on the observation
   Cloud effective radius retrievals from multi-angle po-         geometry, which makes the inverse model to be learned by
larimetry are often based on tabulated synthetic measure-         the neural network particularly complex. For instance, a vec-
ments and require an assumption about the cloud droplet           tor of multi-angle polarized radiances over a cloudy scene
size distribution, which can bias the retrievals toward certain   characterized by a certain combination of cloud parameters
cloud types (Bréon and Doutriaux-Boucher, 2005). When             (COT, effective radius, effective variance, etc.) can take dra-
polarization measurements are available at a large number         matically different values depending on whether the sampled
of viewing angles, as is the case with the airborne Research      angular interval contains the cloudbow scattering angle range

Atmos. Meas. Tech., 12, 1697–1716, 2019                                              www.atmos-meas-tech.net/12/1697/2019/
A. Di Noia et al.: Neural network cloud retrievals from POLDER                                                              1699

(approximately 135–165◦ ). This problem is especially no-          ments in three of these bands (490, 670 and 865 nm), ob-
ticeable for large-swath instruments, in which the pixel-to-       serving the Earth at up to 16 viewing angles. Its spatial res-
pixel variability in the available set of observation geometries   olution at the nadir was about 6 km, and its swath width was
is largest. In order to cope with this problem, it is important    2400 km.
to use the variables that describe the observation geometry           POLDER-3 data have been used for a wide range of appli-
as inputs for the neural network and to generate a training        cations, including aerosol retrievals (Dubovik et al., 2011;
set that reflects the real statistical distribution and correla-   Hasekamp et al., 2011; Waquet et al., 2013), retrieval of
tion structure of such variables. Given the complexity of the      cloud properties (Riedi et al., 2010; Parol et al., 2013; van
learning problem, in order to enhance the accuracy of our          Diedenhoven et al., 2014b; Desmons et al., 2017), water
neural network retrievals, in this work we adopt an approach       vapour retrievals (Riedi et al., 2013), estimation of surface
based on neural network ensembles (Hansen and Salamon,             properties (Bréon and Maignan, 2017) and validation of sur-
1990), which simply consists of training multiple neural net-      face reflection models (Kokhanovsky and Bréon, 2012).
works and averaging their outputs. This approach is known             The successor of POLDER-3 will be the 3MI instru-
to reduce random retrieval errors.                                 ment (Fougnie et al., 2018), which is expected to be
   In addition to being based on neural networks, the retrieval    launched aboard the EUMETSAT Metop Second Genera-
scheme presented in this paper differs from the existing cloud     tion A (Metop-SG A) satellite in 2021. 3MI will be based
retrieval techniques for POLDER-3 in the used input quanti-        on a similar measurement principle to that of POLDER-3
ties and in the spatial resolution of the output product. While    but will carry out its measurements in 12 spectral bands,
the operational COT product does not use polarization in-          nine of which will have polarimetric capability. Furthermore,
formation, it performs one COT retrieval for each pixel and        3MI will extend its measurement spectral range to the SWIR
each available viewing angle and then combines the COT             region in which it will also perform polarization measure-
retrievals on 20 km2 ×20 km2 “super pixels” (Buriez et al.,        ments, which are expected to allow for more accurate cloud
1997); in our scheme the COT is retrieved by combining radi-       retrievals.
ance and degree of linear polarization (DoLP) measurements
at multiple viewing angles, and the retrieval is provided at
the native POLDER-3 pixel size of 6 km2 ×7 km2 . Also the          3     Neural network design
effective radius is retrieved at the native POLDER-3 pixel
size in an attempt to avoid relying on the strong assumptions      3.1    Training set generation
about the spatial homogeneity of cloud properties that are
necessary in algorithms using the super-pixel approach (the        Our neural network approach to the retrieval of cloud proper-
super pixels defined in the existing effective radius product      ties from POLDER-3 data decomposes the retrieval task into
for POLDER-3 have a size of 150 km2 ×150 km2 ).                    four subtasks, with a different neural network dedicated to
   The paper is structured as follows. In Sect. 2 a brief de-      each. A first level of separation was made between retrievals
scription of the POLDER-3 instrument is given. In Sect. 3          over land and over ocean. Second, separate neural networks
the design of the neural network and its verification of syn-      were trained for the estimation of the COT and for the es-
thetic data are discussed. Section 4 discusses the application     timation of cloud microphysical properties (effective radius
of the neural network retrieval to a year of POLDER-3 data         and effective variance). Having separate NNs specialized on
and the comparison of the retrieval results to MODIS Level         cloud retrievals above ocean and land is expected to sim-
2 and Level 3 data and to existing POLDER-3 retrievals. Fi-        plify the training of each NN. The separation between COT
nally, in Sect. 5 conclusions are drawn.                           and microphysical properties retrievals was made because,
                                                                   given the physical nature of the retrieval problem, a differ-
                                                                   ent measurement vector appears more suitable for each of
2   The POLDER-3 instrument                                        these two retrievals. The information on COT is especially
                                                                   present in radiance, with polarization bringing additional in-
The POLDER-3 instrument was a multi-angle, multi-                  formation for small optical thicknesses. Since POLDER did
wavelength polarimeter flying aboard the Polarization &            not have spectral channels with significant absorption by liq-
Anisotropy of Reflectances for Atmospheric Sciences cou-           uid water, information about cloud droplet size in POLDER
pled with Observations from a Lidar (PARASOL) satellite            measurements is only contained in the angular and spec-
(Lier and Bach, 2008). It was launched in 2004 and was             tral dependence of polarized radiance in the cloudbow re-
a part of the satellite constellation A-Train (L’Ecuyer and        gion. For this reason, our NN scheme for COT retrieval uses
Jiang, 2010) until 2009. Initially designed to be operated for     multi-angle and multi-wavelength radiance and degree of lin-
2 years, POLDER-3 performed its measurements until late            ear polarization (DoLP) measurements, whereas the NN for
2013, when it was decommissioned. POLDER-3 performed               the effective radius and effective variance retrievals only re-
multi-angle radiance measurements in nine VIS–NIR wave-            lies on multi-angle and multi-wavelength polarized radiance
length bands (443 to 1020 nm) and polarization measure-            measurements. Furthermore, effective radius and effective

www.atmos-meas-tech.net/12/1697/2019/                                               Atmos. Meas. Tech., 12, 1697–1716, 2019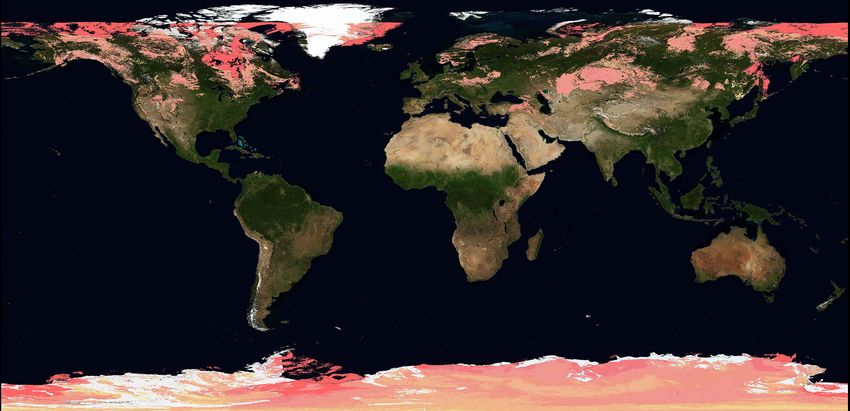
1700                                                       A. Di Noia et al.: Neural network cloud retrievals from POLDER

variance retrievals are only performed if the scattering an-
gle range at which measurements are performed includes the
cloudbow range of 135 to 165◦ , whereas this restriction does
not apply to COT retrievals. An additional differentiation be-
tween the neural network for COT retrieval over ocean and
that for COT retrieval over land concerns the measurement
vector used in the retrieval. The ocean neural network uses
reflectances at 490, 675, 860 and 1020 nm and DoLPs at 490,
675 and 860 nm as inputs, whereas the land network does not
make use of the wavelengths 860 and 1020 nm in order to
avoid dealing with the large variability in the reflective prop-
erties of land surfaces at these wavelengths. The reflectance
at 565 nm is used as an additional input in the NN for COT
retrieval over land.
   The NNs presented in this study have been trained us-
ing synthetic data. While the prior distributions of the cloud     Figure 1. Dependence of simulated TOA reflectance at 443.9 nm on
properties used to generate the training sets are the same for     the number of streams used in the radiative transfer calculations.
all the NNs, a difference lies in the treatment of the sur-
face properties between the ocean networks and the land net-
works. In the radiative transfer simulations produced in or-       creased computation time. Since the generation of our neu-
der to train the ocean network, the surface properties are pa-     ral network training dataset involves a large number of ra-
rameterized with respect to wind speed as in Cox and Munk          diative transfer simulations (of the order of 105 to 106 ), we
(1954), to chlorophyll concentration as in Morel and Mar-          were forced to limit the number of streams to 16 even if this
itorena (2001) and Chowdhary et al. (2006), and to white-          does not appear to be the most accurate choice, as choosing
cap fraction and foam albedo as in Koepke (1984). For the          a higher number of streams would have led to overly time-
land network, instead, the surface bidirectional reflectance       consuming simulations.
distribution function (BRDF) has been parameterized using             An additional limitation – not specific to our approach but
the Ross–Li model (Maignan et al., 2004, and references            caused by the 1-D homogeneous cloud assumption (Zhang
therein), and the bidirectional polarization distribution func-    and Platnick, 2011) – is that reflectance measurements in the
tion (BPDF) has been parameterized as in Maignan et al.            optical range saturate for COTs larger than ∼ 40. This means
(2009). For both land and ocean simulations, the radiative         that not enough information is available to distinguish COTs
transfer model described in Hasekamp and Landgraf (2002,           around this value from larger COTs. For this reason, we de-
2005) has been used. Clouds have been parameterized as             cided to use a maximum COT of 40 in the generation of the
spherical particles with a Gamma size distribution, with a re-     training datasets for our four neural networks.
fractive index taken from the Optical Properties of Aerosols          As pointed out in Sect. 1, a very important element in
and Clouds (OPAC) database (Hess et al., 1998). In order to        the design of a neural network algorithm dealing with multi-
reduce the computational complexity of the radiative transfer      angle large-swath measurements is how to deal with the vari-
simulations, the forward scattering peak in the phase function     ability in the set of viewing angles at which the measure-
of cloud droplets has been accounted for by means of the           ments are performed. Our approach is similar to that pro-
“MS correction” proposed by Nakajima and Tanaka (1988).            posed by Han et al. (2006) in the context of aerosol retrievals
   An important aspect to be pointed out, which may rep-           from the Multi-angle Imaging SpectroRadiometer (MISR)
resent a limitation in our approach, is that the often highly      and basically consists of using the set of viewing angles as
peaked phase functions of cloud droplets make it important         additional input quantities for the neural network. However,
to use an adequate number of streams in the forward model          a difference between the two approaches lies in the way the
calculations. For example, in Fig. 1 a plot is shown of the        neural networks are trained. While Han et al. (2006) trained
simulated top-of-atmosphere (TOA) reflectance at 443.9 nm          their neural network scheme using real MISR measurements
versus COT for 8, 16, 32 and 64 streams, assuming spher-           co-located with MODIS Level 2 aerosol properties, our neu-
ical cloud particles and a Gamma size distribution with an         ral networks are trained on synthetic data. In order to perform
effective radius of 25 µm and an effective variance of 0.03.       our simulations at viewing angle combinations representa-
The simulations were performed for a solar zenith angle of         tive of actual POLDER-3 measurements, we sampled 1 year
30◦ and assuming nadir observation. It can be seen that, for       of POLDER-3 measurements, randomly selecting 25 orbits
COT larger than approximately 20, the simulated TOA re-            per month and 5000 combinations of viewing zenith angles,
flectances critically depend on the chosen number of streams.      solar zenith angles and relative azimuth angles per orbit. We
A higher number of streams generally results in more ac-           thereby generated a database of 1.5×10⁶ angle combinations
curate radiative transfer simulations but also leads to an in-     which we used as inputs for our radiative transfer calcula-

Atmos. Meas. Tech., 12, 1697–1716, 2019                                               www.atmos-meas-tech.net/12/1697/2019/
A. Di Noia et al.: Neural network cloud retrievals from POLDER                                                                1701

tions. Since the number of angles at which POLDER-3 per-           tion of 1 % for reflectance, 2 % for polarized reflectance and
formed its measurements is also variable, we decided to only       0.7 % for DoLP. As done in previous work (Di Noia et al.,
consider measurements performed at a minimum of 14 an-             2015, 2017), such noise was added to the synthetic measure-
gles to train our neural networks. This number was chosen          ments during the training phase as a form of regularization,
in order to have a good trade-off between the benefit of hav-      as explained in Bishop (1995). The neural network archi-
ing a good number of available viewing angles and that of          tecture was chosen based on results inherited from previous
not discarding too many measurements, as would have been           work and, for all the four networks, consists of three hidden
the case if we only considered measurements performed at           layers with 40 neurons each.
16 angles (the maximum available number for POLDER-3).
Also for POLDER-3 measurements performed at more than              3.2   The ensemble approach
14 angles, only 14 angles are used in the input vector for
the neural networks. This choice was made in order to avoid        As anticipated in Sect. 1, training a neural network to invert
dealing with the difficulty of having a input vector of vari-      multi-angular measurements from a large-swath instrument
able size or, as an alternative, of passing input vectors with     is a difficult task. In an attempt to reduce the retrieval un-
missing data to the neural networks.                               certainty caused by imperfect training, we decided to train
   As discussed at the beginning of this section, the quanti-      multiple neural networks and use the average of their outputs
ties used in the input vector differ between the COT retrieval     as our final retrieval. This approach – called the “neural net-
neural networks and the effective radius retrieval neural net-     work ensemble” approach (Hansen and Salamon, 1990) – is
works. The complete list of input quantities for each network      known to reduce the random component of the neural net-
is given in Table 1. Effective variance is retrieved as an ad-     work output error and has been already applied with success
ditional parameter in the effective radius network, whereas        in remote sensing contexts (Krasnopolsky, 2007). In princi-
cloud top height is retrieved as an additional parameter in        ple, several methods exist to combine the results of multiple
both networks. The ocean and land surface parameters are           neural networks in order to build an enhanced estimator, and
not included in the output vector but are randomized in the        an overview of such methods is given by Sharkey (1996). In
training set. From a theoretical standpoint, this corresponds      this work, we have chosen to train multiple neural networks
to designing a neural network that approximates the condi-         characterized by the same architecture and on the same train-
tional expectation of the set of cloud properties x given the      ing set, varying the random initial value of the neural net-
measurement vector y, marginalized over the possible values        work weights. In practice, in this way, each ensemble mem-
of the surface properties. Mathematically, if we introduce a       ber (i.e. each individual net) is trained so that its weight vec-
vector b describing the surface properties, the neural network     tor approaches a different local minimum of the error surface
will return an approximation of the following conditional ex-      (Tresp, 2002). It is possible to prove that this method ensures
pectation:                                                         that the variance of the error of the neural network ensemble
                                                                   is smaller than the average variance of the single ensemble
           Z                                                       members (Perrone, 1993). Contrary to the error variance, the
E[x|y] =       E[x|y, b]fb (b)db,                           (1)    bias is not reduced by the ensemble approach.
           D
                                                                      The maximum reduction in variance is achieved when the
                                                                   errors of the ensemble members are uncorrelated, in which
where fb is the probability density function of b and D is the     case the reduction factor is equal to the number of ensemble
domain of fb . The same logic was followed in the treatment        members. This is not the case in our situation, as we observed
of cloud microphysical parameters in the COT retrieval NN          a significant correlation in the errors of the individual neural
and of COT in the microphysical parameter retrieval NN, i.e.       networks. For this reason, the gain obtained by using the en-
rather than making an assumption about the non-retrieved pa-       semble approach in our case is smaller than the maximum
rameters and keeping them constant in the training set, they       possible gain.
are randomized. This approach enables the training proce-
dure to adjust the weights of the NN based on the input fea-       3.3   Results on synthetic data
tures that are of direct relevance for the retrieval of the pa-
rameter at hand, preventing biases due to incorrect assump-        The results of applying the neural network retrieval scheme
tions. A “classical” equivalent of this approach would consist     on approximately 30 000 synthetic test data not used during
of averaging multiple retrievals carried out using different as-   the training process are summarized in Table 3. The average
sumptions.                                                         bias, root-mean-square error (RMSE) and correlation coeffi-
   The details of statistical distributions of the cloud, ocean    cient of the individual ensemble members are shown together
and land surface parameters used in the radiative transfer         with the corresponding statistics for the neural network en-
simulations are summarized in Table 2.                             semble. In this test, we used ensembles of five neural net-
   The measurement noise was modelled as an additive Gaus-         works. As expected, the ensemble approach does not reduce
sian random variable with a zero mean and a standard devia-        the retrieval bias but does reduce the RMSE, although not

www.atmos-meas-tech.net/12/1697/2019/                                                Atmos. Meas. Tech., 12, 1697–1716, 2019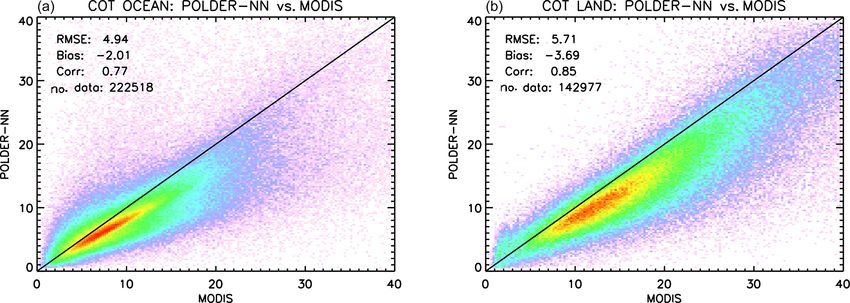
1702                                                                A. Di Noia et al.: Neural network cloud retrievals from POLDER

Table 1. List of input quantities used in the COT neural network and in the effective radius neural network. The check mark (X) indicates
that a given quantity (or set of quantities) is used in a neural network.

                              Input quantity                             COT NN (ocean)     COT NN (land)     reff NN
                              Reflectance (490 nm) – 14 angles                 X                   X
                              Reflectance (565 nm) – 14 angles                                     X
                              Reflectance (675 nm) – 14 angles                 X                   X
                              Reflectance (865 nm) – 14 angles                 X
                              Reflectance (1020 nm) – 14 angles                X
                              DoLP (490 nm) – 14 angles                        X                   X
                              DoLP (675 nm) – 14 angles                        X                   X
                              DoLP (860 nm) – 14 angles                        X
                              Pol. reflectance (490 nm) – 14 angles                                              X
                              Pol. reflectance (675 nm) – 14 angles                                              X
                              Pol. reflectance (865 nm) – 14 angles                                              X
                              Surface pressure                                 X                   X             X
                              Solar zenith angle                               X                   X             X
                              Viewing zenith angles (14 values)                X                   X             X
                              Scattering angles (14 values)                    X                   X             X

Table 2. Details of the statistical distributions of the cloud and sur-              a degradation of the retrieval accuracy can be expected
face parameters used to generate the training datasets.                              when three-dimensional effects are significant.

  Parameter                            Min     Max    Mean    Std dev.            – The impact of an incorrect assumption about the cloud
                                                                                    particle size distribution cannot be assessed, as all the
  Cloud eff. radius (µm)                 3       25    11.5       4.9
  Cloud eff. variance                 0.03     0.35     0.2      0.09
                                                                                    data are generated with an assumed Gamma size distri-
  COT                                  0.5     40.0   20.25     11.41               bution.
  Cloud top height (km)                2.0     20.0     7.0      2.88
                                                                                  – The vertical distribution of cloud effective radius and
  Li – sparse BRDF parameter           0.0     0.25    0.12      0.07               effective variance is assumed constant. This is often not
  Ross – thick BRDF parameter          0.0      1.5    0.75      0.43
  Maignan BPDF parameter              0.02     10.0    4.83      2.86
                                                                                    the case in reality (Martins et al., 2011; Zhang and Plat-
  Isotropic scatt. coeff. (490 nm)     0.0     0.89    0.04      0.04               nick, 2011; Zhang et al., 2012).
  Isotropic scatt. coeff. (670 nm)     0.0     0.87    0.16      0.11
  Isotropic scatt. coeff. (865 nm)     0.0     0.80    0.28      0.11
                                                                                 All the aforementioned assumptions may lead to biases
  Isotropic scatt. coeff. (1020 nm)    0.0     0.80    0.28      0.11         in the retrieved cloud properties (Zhang and Platnick, 2011;
                                                                              Zhang et al., 2012; Miller et al., 2018). The assessment of the
  Wind speed (m s−1 )                  0.01       7    3.83      1.43
                                                                              performance of our neural network scheme when applied to
  Chlorophyll concentration           10−5      2.0     1.0      0.58
  Whitecap fraction                     0.0     0.1    0.05      0.03         real measurements is be the object of the next section.

                                                                              4     Application to POLDER-3 data
in a dramatic way, as the errors of the individual networks
are highly correlated. The results of the synthetic retrievals                As pointed out in Sect. 3.3, testing the retrieval algorithm
over ocean and those over land are very similar. The COT,                     against synthetic data only gives an indication of its perfor-
effective radius and effective variance are generally well re-                mance under idealized conditions. In order to assess the per-
trieved, whereas the quality of the cloud height retrievals is                formance of our neural network scheme, we used it to pro-
not as high.                                                                  cess the entire POLDER-3 2006 Level 1B dataset and com-
   While the results reported in Table 3 serve as an internal                 pared the retrieved COTs and effective radii to MODIS-Aqua
consistency check for the neural network performance, they                    Collection 6 Level 2 and Level 3 retrievals and to the avail-
cannot be used to predict the performance of our neural net-                  able POLDER-3 Level 2 data. The results of this comparison
works when applied to real measurements. In fact, our sim-                    are discussed in the following subsections.
ulation set-up entails a number of simplifications which are
typically not satisfied in real scenarios. Some of the most im-               4.1    Comparison to MODIS Level 2 data: selected
portant simplifications are the following:                                           examples

  – Training and test data have both been generated using                     In order to evaluate the performances of our neural net-
    a one-dimensional radiative transfer model. Therefore,                    work retrieval, we have compared our retrievals to the

Atmos. Meas. Tech., 12, 1697–1716, 2019                                                          www.atmos-meas-tech.net/12/1697/2019/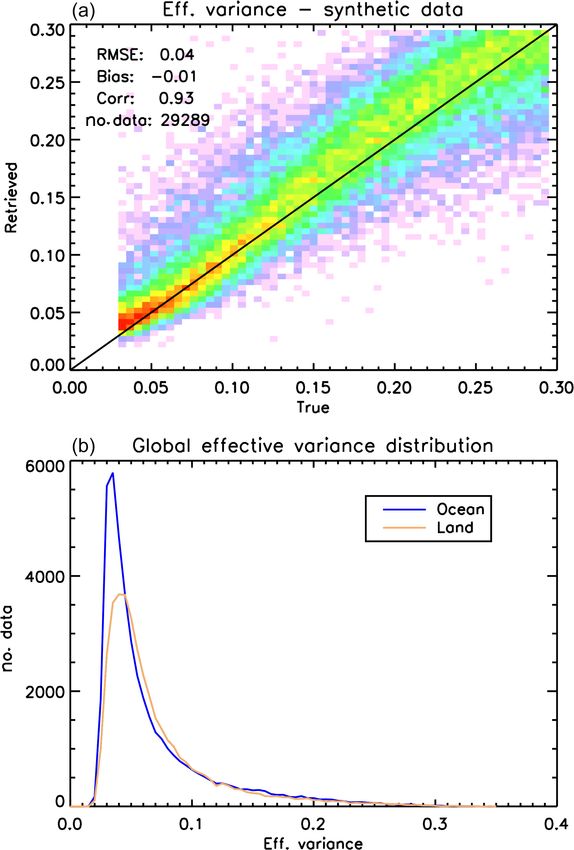
A. Di Noia et al.: Neural network cloud retrievals from POLDER 1703
Table 3. Average bias, RMSE and correlation coefficient of the individual neural networks, and corresponding statistics for the NN ensemble,
over the synthetic test datasets.
Individual Ensemble
Surface Parameter Bias RMSE Corr. Bias RMSE Corr.
COT −1.75 1.67 0.99 −1.75 1.41 0.99
Eff. radius (µm) 0.10 1.14 0.98 0.10 0.93 0.99
Ocean
Eff. variance −0.01 0.04 0.93 −0.01 0.03 0.95
Cloud height (m) −433 2307 0.63 −433 2284 0.64
COT 0.39 1.95 0.99 0.39 1.65 0.99
Eff. radius (µm) 0.06 1.09 0.99 0.06 0.9 0.99
Land
Eff. variance −0.01 0.04 0.92 −0.01 0.03 0.95
Cloud height (m) −270 2280 0.62 −270 2248 0.64
Figure 2. Global distribution of snow cover and sea ice on 24 February 2006. Snow covered areas are shown in light pink, and sea ice areas
are shown in dark pink. Data are from the MODIS-Aqua Normalized Difference Snow Index (NDSI) and sea ice products. Image is from
NASA Worldview (https://worldview.earthdata.nasa.gov, last access: 11 March 2019).
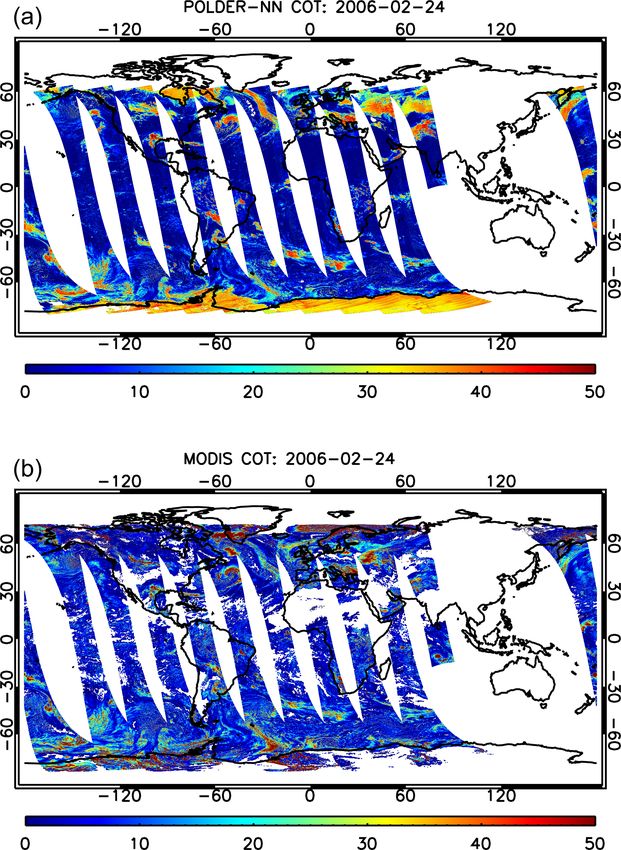
MODIS Level 2 product remapped on the POLDER-3 In Fig. 4, a global map of the COT retrieved by the neural
official sinusoidal grid (Zeng et al., 2011), made avail- network algorithm for POLDER-3 is shown together with an
able from Centre National d’Études Spatiales (CNES) and analogous maps produced by regridding the MODIS Level
Lille University’s ICARE data archive (https://www.icare. 2 product on the POLDER-3 resolution. The neural network
univ-lille1.fr/archive/?dir=PARASOL/PM-L2/, last access: product covers a narrower swath with respect to the MODIS
11 March 2019). In this section we present the results of product, as only pixels observed at a minimum of 14 viewing
a global comparison between our retrieval and the MODIS angles are considered in the NN retrieval.
Level 2 product on 24 February 2006 as an example. This In general, the spatial patterns of COTs seem to be well
date is particularly interesting because it contains a wide va- captured by the NN retrieval, but a number other aspects can
riety of situations, including cases that may prove challeng- be noticed in the maps. A first important remark is that at
ing for our retrieval of cloud properties. A ZIP file containing this stage we have not yet developed a cloud detection algo-
daily global plots for the entire year 2006 is provided at the rithm for our neural network product. As a consequence, the
following FTP address: ftp://ftp.sron.nl/open-access-data/ neural network will process all the available ground pixels
antonion/10.5194-amt-2018-345/Supplement (last access: regardless of whether they are actually covered by clouds.
15 March 2019). Nevertheless, it is interesting to see that over areas such as
As shown in Fig. 2, snow-covered areas were present in the Sahara – where a large number of cloud-free pixels are
several regions in the Northern Hemisphere, such as Central present – the NN correctly reports COTs very close to zero.
Asia, northeastern Europe, Scandinavia and North America. As explained in Sect. 3.1, the NN has been trained on a va-
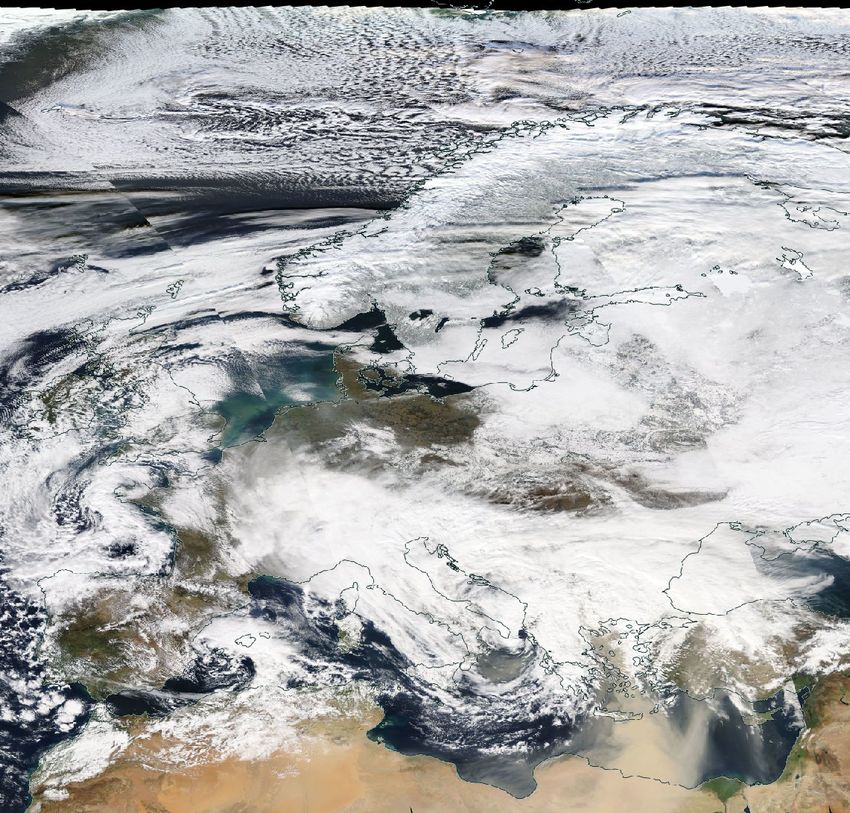
Furthermore, a significant dust outbreak took place over the riety of synthetic scenes, including situations of small COTs
Eastern Mediterranean Sea, as shown in Fig. 3. on bright, desert-like surfaces. However, the NN has not been
www.atmos-meas-tech.net/12/1697/2019/ Atmos. Meas. Tech., 12, 1697–1716, 2019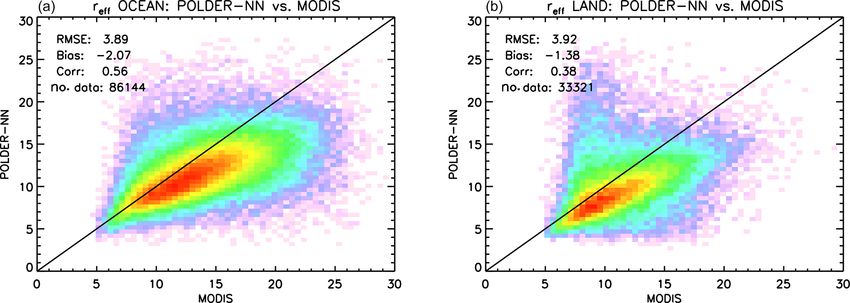
1704 A. Di Noia et al.: Neural network cloud retrievals from POLDER
Figure 3. A mosaic of MODIS-Aqua images showing Europe
on 24 February 2006. Image from NASA Worldview (https://
worldview.earthdata.nasa.gov, last access: 11 March 2019).
trained on snow-covered synthetic scenes, and in such sit-
uations our neural network scheme seems to detect large
COTs. This is clearly visible in Fig. 4, where an extended
area of large retrieved COT can be seen over Central Asia.
Figure 4. Global cloud optical thickness maps on 24 February 2006
This area corresponds to the snow-covered region shown in
produced by the POLDER-3 neural network (a) and by MODIS (b).
Fig. 2. Similar features can be observed over North America.
In general, distinguishing snow from clouds using POLDER-
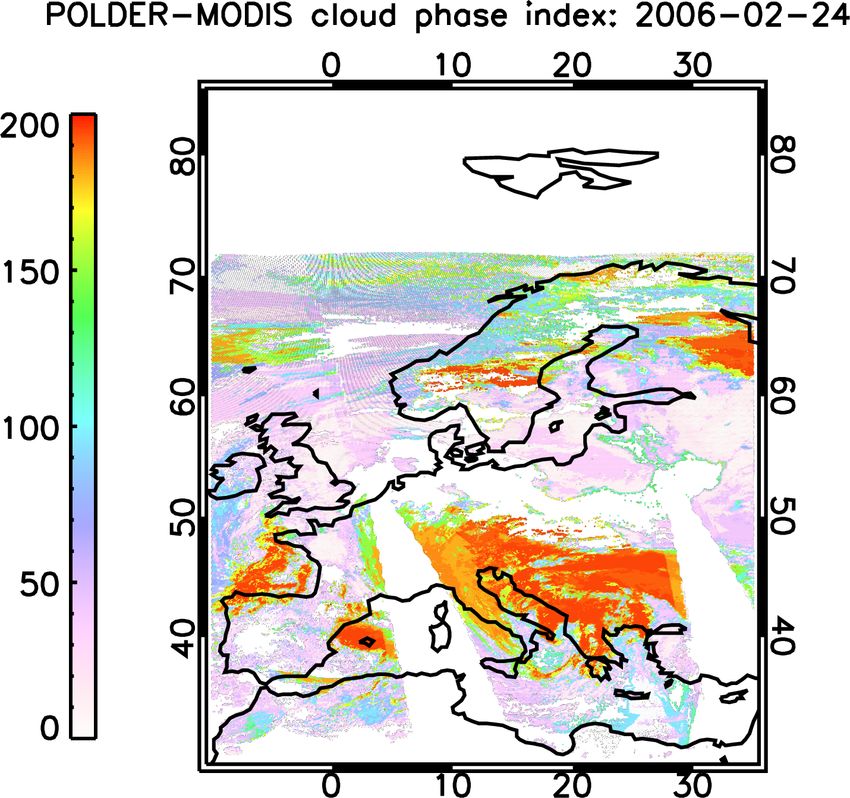
3 channels is extremely challenging if the observation geom- the cloud phase index (CPI) product, described in Riedi et al.
etry does not sample the cloudbow region (Bréon and Colzy, (2010), which can be used to estimate the cloud thermody-
1999). However, incorporating snow-covered scenes in the namic phase from combined POLDER-3 and MODIS data.
training set would be an interesting subject for future re- Values of the CPI lower than 50 indicate liquid water clouds
search in view of the application of our method to 3MI. In and values larger than 150 indicate ice clouds, whereas in-
fact, 3MI will provide measurements at 1.6 µm, where snow termediate values indicate mixed-phase clouds. A map of the
has high absorption and can therefore be distinguished from CPI over Europe for the selected date is shown in Fig. 6.
clouds (Warren, 1982; Krijger et al., 2005, 2011) . An anal- The regions in which the NN retrieves much larger COTs
ogous behaviour of the NN COT retrievals can be observed than MODIS generally coincide with regions marked as ice
over cloud-free regions covered by sea ice, such as the Hud- clouds in the CPI map (CPI systematically larger than 170).
son Bay, which appears to be covered by sea ice in Fig. 2 and These are not represented in the NN training set, and there-
exhibits large retrieved COTs in Fig. 4. fore the quality of the NN retrieval cannot be guaranteed over
Other areas in which the NN retrievals differ significantly this type of clouds.
from MODIS data need a more careful inspection. Figure 5 In order to explain the origin of the bias in the retrieved
shows retrieved COT maps over Europe for the NN algo- COT over ice clouds, we can reason as follows. The re-
rithm and for MODIS. Both MODIS and the POLDER-3 NN flectance of a cloud layer at nonabsorbing wavelengths can
generally see large COTs over the Balkans and in an area be approximated as follows (van Diedenhoven et al., 2014a):
approximately centred around the Russian enclave of Kalin-
ingrad. However, additional areas of large COTs can be seen τ (1 − g)
in the NN map and not in the MODIS map. One approxi- R(µ0 ) = , (2)
2µ0 + τ (1 − g)
mately covers northeastern Italy, and a smaller one is centred
on northwestern Spain, down the Bay of Biscay. A plausible where µ0 is the cosine of the solar zenith angle, τ is the total
explanation for this behaviour can be obtained by looking at optical thickness and g is the asymmetry parameter of the
Atmos. Meas. Tech., 12, 1697–1716, 2019 www.atmos-meas-tech.net/12/1697/2019/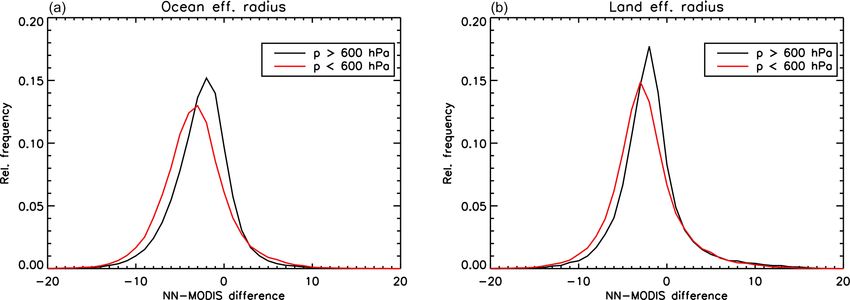
A. Di Noia et al.: Neural network cloud retrievals from POLDER                                                              1705

                                                                   Figure 6. POLDER–MODIS Cloud Phase Index over Europe on
                                                                   24 February 2006. Data from ICARE – Laboratoire d’Optique At-
                                                                   mosphérique (LOA), University of Lille 1.

                                                                       Histograms of the ratio between the COT retrieved by the
                                                                   NN scheme and that retrieved by MODIS over liquid water
                                                                   clouds (CPI < 50), ice clouds (CPI > 150) and mixed-phase
                                                                   clouds (50 ≤ CPI ≤ 150) are shown in Fig. 7 for the selected
                                                                   date. It can be seen that the peak of the histogram for ice
                                                                   clouds does not lie too far from the value predicted based
                                                                   on our simple approximation. The histogram for liquid wa-
                                                                   ter clouds, instead, is much more peaked around a value of
                                                                   approximately 0.8.
Figure 5. Cloud optical thickness maps over Europe on 24 Febru-        Since our NN algorithm for COT retrieval does not just
ary 2006 produced by the POLDER-3 neural network algorithm (a)     rely on single reflectance values but also uses the angular
and by MODIS (b).                                                  variability of reflectance and DoLP, it is expected that incor-
                                                                   porating ice clouds in the training dataset may help to im-
                                                                   prove the COT retrieval accuracy over this type of clouds, at
scattering phase function. If we take Eq. (2) as the reflectance   least reducing the spread of the histogram in Fig. 7.
of an ice cloud layer of optical thickness τice , with asymmetry       In order to carry out a global quantitative comparison be-
parameter gice , and assume the asymmetry parameter gliq of        tween the COTs retrieved by the neural network and those
a liquid water cloud in our retrieval, a liquid water cloud of     retrieved by MODIS over liquid water clouds, the following
optical thickness τliq with the same reflectance as that of the    filtering criteria have been applied:
true ice cloud satisfies the relationship
                                                                     – The MODIS cloud fraction had to be larger than 0.95.
τliq (1 − gliq ) = τice (1 − gice ).                        (3)
                                                                     – The CPI had to be smaller than 50.
Therefore, we can expect the estimated liquid water cloud
optical thickness to be related to the true ice cloud optical        – Ocean regions affected by sun glint were not consid-
thickness as approximately                                             ered.

         1 − gice                                                     A pixel was flagged as affected by glint if observed from
τliq =              τice .                                (4)      at least one viewing direction satisfying the following condi-
         1 − gliq
                                                                   tions:
Given that in the MODIS Collection 6 algorithm an ice
cloud optical model with an asymmetry parameter of 0.75              – The relative azimuth angle was between −90 and 90◦ .
is assumed (Holz et al., 2016), and that liquid water cloud
                                                                     – The absolute difference between viewing zenith angle
droplets typically have an asymmetry parameter of around
                                                                       and solar zenith angle was smaller than 10◦ .
0.85, based on Eq. (4) it is expected that our retrievals over
ice clouds are biased by a factor of around 1.66 (van Dieden-         The results of the comparison are shown in Fig. 8, where
hoven et al., 2014b).                                              it can be seen that the POLDER-3 neural network algorithm

www.atmos-meas-tech.net/12/1697/2019/                                               Atmos. Meas. Tech., 12, 1697–1716, 2019
1706 A. Di Noia et al.: Neural network cloud retrievals from POLDER
Figure 7. Histogram of NN-to-MODIS COT ratios on 24 Febru-
ary 2006 over liquid water clouds (CPI < 50), ice clouds (CPI >
150) and mixed-phase clouds (50 ≤ CPI ≤ 150).
Figure 9. Global plots of POLDER-3 neural network versus
MODIS cloud effective radius (in µm) on 24 February 2006 over
ocean (a) and land (b).
– The maximum scattering angle was not smaller than
165◦ .
Figure 8. Global plot of POLDER-3 neural network versus MODIS
COT on 24 February 2006. Such conditions were applied on top of the criteria men-
tioned above for the comparison of the retrieved COTs. The
results of the comparison are presented separately for ocean
tends to retrieve systematically lower COTs with respect to and land in Fig. 9. Over both surface types, a negative bias
MODIS, with a bias of around −2. Overall, the two datasets in POLDER retrieved effective radii with respect to MODIS
look fairly well correlated, with a correlation coefficient of effective radii using the 2.13 µm band is observed. The bias
0.79. is around −2 µm over ocean and −1 µm over land. The corre-
A similar comparison between the NN retrieval and lation coefficients are worse than for the COT, which is to be
MODIS has been performed for the cloud effective ra- expected given the differences in sensitivity to vertical and
dius. Since the information on the cloud effective radius in horizontal inhomogeneities between the polarimetric and bi-
POLDER-3 measurements mostly resides in the polarized ra- spectral methods (Miller et al., 2016, 2018). Nevertheless, it
diance in the cloudbow scattering angle range, only pixels appears that the NN retrievals are still capable of capturing
containing observations within this range were used in the some of the global patterns in the spatial variability in the
comparison. More precisely, a POLDER-3 pixel was consid- cloud effective radius.
ered eligible for effective radius retrieval if it was observed Global histograms of the effective radii retrieved by the
in a scattering angle range satisfying the following two con- POLDER-3 NN over ocean and land are shown in Fig. 10.
ditions: These seem to reflect the general knowledge of the fact
that cloud droplets over land tend to be smaller than over
– The minimum scattering angle was not larger than 135◦ ; ocean (Han et al., 1994; Bréon and Colzy, 2000; Bréon and
Atmos. Meas. Tech., 12, 1697–1716, 2019 www.atmos-meas-tech.net/12/1697/2019/A. Di Noia et al.: Neural network cloud retrievals from POLDER 1707
Scatter plots of the NN vs. MODIS effective radii over
ocean and land are shown in Fig. 13. The NN-retrieved ef-
fective radii show a negative bias with respect to MODIS.
Such bias appears fairly consistent between ocean and land.
Looking at the scatter plot, there seems to be a “cluster” of
points over land for which the NN retrieves much larger ef-
fective radii than MODIS. A preliminary investigation shows
that these situations preferentially occur over southeastern
China, around the Río de la Plata estuary in South America
and along the southern part of the Bight of Biafra in Africa.
This is shown in Fig. 14, which depicts a map of the data
points over land where the MODIS retrieved effective radii
smaller than 10 µm while the neural network retrieved ef-
fective radii larger than 18 µm. It is not clear, at this stage,
if particular cloud types are associated with these areas or if
that effect is caused by the presence of aerosols above clouds,
Figure 10. Global histograms of cloud effective radii retrieved by
the POLDER-3 neural network over ocean and land on 24 Febru-
which is at least possible over western central Africa (Waquet
ary 2006. et al., 2009). Aerosols above clouds were not modelled in the
training set of our neural network scheme and may have an
impact on our retrievals when scattering angles between 100
and 120◦ are present in the measurement vector, as Waquet
Doutriaux-Boucher, 2005), thereby providing us with an ad- et al. (2009) show that TOA polarized reflectances in this
ditional sanity check for our retrievals. scattering angle range are significantly higher over a cloud
with an aerosol layer above than they would be in absence
4.2 Global comparison with MODIS Level 2 data of an aerosol layer. We have tried to identify cases of aerosol
above clouds by means of an empirical filter on polarized re-
The comparison presented in Sect. 4.1, which refers to a par- flectances between 100 and 120◦ , but so far we have found
ticular day, highlights a number of features in the behaviour no conclusive indications regarding their impact on our cloud
of our NN retrieval algorithm. We carried out a more sys- property retrievals. An additional element that can be noticed
tematic comparison by looking at the entire Level 2 dataset in the scatter plots in Fig. 13 (and in all the subsequent plots)
for the year 2006. In order to make the size of our datasets is that the number of available data points over land is much
more manageable, we chose to rebin both the neural network smaller than over ocean. This is a result of filtering for high
retrievals and MODIS retrievals on a 1◦ × 1◦ grid. The data clouds, which reduced the ratio between the number of land
used in the regridding were filtered according to the same and ocean data points from ∼ 55 % to roughly 39 %.
criteria explained earlier in this section for the example date The bias observed in the retrieved effective radii seems
24 February. The fact that the same criteria were applied to consistent with results obtained with other algorithms (Bréon
both datasets, and the fact that the MODIS retrievals had al- and Doutriaux-Boucher, 2005). The negative bias present in
ready been remapped to the POLDER spatial resolution prior our COT retrievals is possibly explained by the presence
to the regridding, should minimize the risk of introducing of residual cases of broken clouds in our dataset, which
greater biases at this processing stage. are known to cause negative POLDER–MODIS differences
The results of this global comparison for COT are shown (Zeng et al., 2012). On the contrary, the differences in the
separately for ocean and land scenes in Fig. 11. As for the assumed cloud model should not be an important cause for
effective radius, we observed a distinct behaviour in our re- the observed bias, as the uncertainty induced by changing the
trievals between cases of “low clouds” (cloud top pressures assumed cloud model in MODIS retrievals is estimated to be
larger than 600 hPa) and cases of “high clouds” (cloud top small (Platnick et al., 2017), with the exception of retrieval
pressures lower than 600 hPa). As shown in Fig. 12, effective at special scattering angles such as cloudbow and glory (Cho
radius retrievals appear less biased with respect to MODIS, et al., 2015). However, these situations only account for a
both over ocean and land over low clouds. It is important to very small fraction of MODIS retrievals.
note that both the POLDER-3 and the MODIS retrievals used
in the rebinning were preliminarily filtered for ice using the 4.3 Effective variance retrievals: preliminary results
POLDER–MODIS CPI, but it is still possible that cases ex-
ist in which the cloud phase identification is imperfect. This As pointed out in Sect. 3.1, our NN scheme for cloud prop-
result suggested us to filter out clouds higher than 600 hPa in erty retrievals does not assume a fixed effective variance but
our global effective radius comparison. This filter has been retrieves the effective variance together with the effective
used in all the comparisons that are shown hereinafter. radius. This design choice is different from what is done
www.atmos-meas-tech.net/12/1697/2019/ Atmos. Meas. Tech., 12, 1697–1716, 20191708 A. Di Noia et al.: Neural network cloud retrievals from POLDER Figure 11. Global comparison between neural-network-based POLDER-3 cloud optical thickness retrieval, and MODIS retrievals over ocean (a) and land (b) encompassing the full year 2006 on a 1◦ × 1◦ spatial grid. Figure 12. Histograms of MODIS–NN effective radius retrieval differences (in µm) over ocean (a) and land (b), differentiated by cloud top pressure range. in most of the existing cloud retrieval algorithms. In gen- hand, experiments on synthetic data seem to suggest that the eral, most cloud retrieval schemes assume a cloud model NN should be able to retrieve effective variance within the with a fixed effective variance ranging from 0.1 to 0.15, de- typically assumed range of this parameter. On the other hand, pending on the algorithm (Arduini et al., 2005, and refer- when applied to real POLDER-3 measurements, the algo- ences therein). In particular, a value of 0.1 is assumed in the rithm has a strong preference for effective variances around MODIS Collection 6 products (Platnick et al., 2017). In the 0.05 over ocean and 0.06 over land, both smaller than the training set of our NN retrieval algorithms, effective variance value assumed in the MODIS product. It is important to em- was assumed to be uniformly distributed between 0.03 and phasize that, given the broad prior distribution used to train 0.35. In the interpretation of the NN retrievals, this can be the NN, the behaviour of the NN when applied to real data regarded as a sort of “prior distribution” for cloud effective appears to be entirely driven by the measurements. It is inter- variance. As shown in Table 3, our NN scheme seems ca- esting to note that the result we observed over ocean has been pable of retrieving cloud effective variance to a good accu- recently found also by another study based on SEVIRI mea- racy when applied to synthetic measurements. This impres- surements over marine stratocumulus clouds, currently under sion is corroborated by the upper panel of Fig. 15, which is review (Benas et al., 2019), using a method that is completely a scatter plot of retrieved versus true effective variances on a independent of the one presented in this article. However, it set of synthetic measurements over ocean. This test gives us must be noted that the effective variances we retrieved over some confidence in the possibility of retrieving effective vari- land are smaller than those suggested by other studies fo- ance from POLDER-3 measurements. In the lower panel of cussed on continental clouds (Miles et al., 2000; Khaiyer Fig. 15, a global histogram of effective variances retrieved by et al., 2005). Therefore, additional research will be needed the NN over land and ocean on 24 February 2006 is shown. on the interpretation of our effective variance retrievals. Histograms for other dates, which are available at the URL indicated in Sect. 4.1, are very similar to this one. On one Atmos. Meas. Tech., 12, 1697–1716, 2019 www.atmos-meas-tech.net/12/1697/2019/
A. Di Noia et al.: Neural network cloud retrievals from POLDER                                                                     1709

Figure 13. Global comparison between neural-network-based POLDER-3 effective radius retrieval, and MODIS retrievals over ocean (a)
and land (b), encompassing the full year 2006 on a 1◦ × 1◦ spatial grid. Effective radius values are in µm.

Figure 14. Occurrence map of cases with MODIS effective radius
smaller than 10 µm and NN effective radius larger than 18 µm, over
land, during the year 2006.

4.4   Comparison to existing POLDER-3 data and
      MODIS Level 3 data

In order to gain further insight on the behaviour of our re-
trieval algorithm, we carried out a global intercomparison
between our retrieved COTs and effective radii to existing
POLDER-3 retrievals. COT data at a spatial resolution of
20 km2 ×20 km2 are available from the existing POLDER-
3 Level 2 product, whereas effective radius data are not in-
cluded in the POLDER-3 Level 2 product, but are available            Figure 15. (a) Scatter plot of retrieved versus true cloud effective
from the Cloud Droplet Radius (CDR) product. Both prod-              variance of synthetic data. (b) Global histograms of cloud effective
ucts are available from the ICARE data archive mentioned in          variance retrieved by the POLDER-3 neural network over ocean and
Sect. 4.1.                                                           land on 24 February 2006.
   Also, for the comparison between the neural network re-
trievals and the existing POLDER-3 products, we have cho-
sen a regular 1◦ × 1◦ grid. In order to better understand the        uct. These retrievals are known to be more sensitive to the
difference between our retrievals and existing POLDER-3              upper cloud layers compared to the standard MODIS product
products, we compared retrievals from both products to the           using the 2.13 µm channel (Platnick, 2000) and are therefore
MODIS MYD08_D3 daily product (Platnick et al., 2015).                expected to be more comparable to polarimetric retrievals
This also allowed us to compare effective radius retrievals to       (Miller et al., 2016).
MODIS retrievals using the 3.7 µm channel, which are not               The results of comparing neural network COT retrievals to
available in the combined POLDER–MODIS Level 2 prod-                 POLDER-3 Level 2 retrievals are shown separately for ocean

www.atmos-meas-tech.net/12/1697/2019/                                                   Atmos. Meas. Tech., 12, 1697–1716, 2019
1710 A. Di Noia et al.: Neural network cloud retrievals from POLDER
Figure 16. Global comparison between POLDER-3 neural- Figure 17. Global comparison between POLDER-3 neural-
network-based and Level 2 cloud optical thickness retrievals over network-based and CDR cloud effective radius retrievals over
ocean (a) and land (b) encompassing the full year 2006 on a 1◦ ×1◦ ocean (a) and land (b) encompassing the full year 2006 on a 1◦ ×1◦
spatial grid. spatial grid. Effective radius values are in µm.
whereas the opposite seems to occur over land, where the
and land in Fig. 16. The correlation between the two retrieval
neural network retrievals exhibit a significantly smaller bias
schemes is high, although the NN retrievals are slightly lower
versus MODIS compared to the CDR retrievals. Both over
than the Level 2 retrievals, with a low bias of around −1
ocean and land, the bias of our neural network retrievals ap-
over ocean and of around −1.5 over land. A possible rea-
pears – in absolute value – smaller than 2 µm. An additional
son for these systematic differences may lie in the different
difference between our cloud effective radius retrievals and
treatment of the cloud microphysical properties in the two
the CDR product is the fact that the latter seems to present a
algorithms. POLDER-3 Level 2 COT retrievals assume wa-
large number of cases in which the retrieved effective radius
ter droplets with a constant effective radius of 9 µm over land
“saturates” to a value of 20 µm, whereas this does not seem
and 11 µm over ocean and an effective variance of 0.15 (Zeng
to be the case for the NN retrieval. This difference proba-
et al., 2012), whereas in our retrieval these parameters are not
bly results from the different choices made in generating the
fixed but are varied randomly in the training set.
training set for the NN and the tabulated values for the CDR
A similar comparison is shown in Fig. 17 for cloud effec-
retrieval.
tive radius retrievals. In this case, the agreement between the
neural network and existing POLDER-3 data is better over
ocean than over land. A moderate negative bias of the neural 5 Conclusions
network retrievals versus the CDR product exists over ocean,
whereas over land the agreement is generally poor. We de- In this paper we have presented a neural network algo-
cided, then, to compare both datasets to gridded MODIS re- rithm to retrieve the microphysical properties of liquid wa-
trievals using the 3.7 µm channel. The results are shown in ter cloud from satellite multi-angle, multi-wavelength polari-
Fig. 18 for ocean and Fig. 19 for land. As expected, the neg- metric measurements. The proposed approach is based on
ative bias of neural network retrievals versus MODIS 3.7 µm four ensembles of neural networks trained for synthetic mea-
effective radii is smaller than that versus the 2.6 µm prod- surements. Two NN ensembles are dedicated to the retrieval
uct. The existing CDR product seems more accurate and of cloud optical thickness separately over ocean and land,
more precise than the neural network product over ocean, whereas the other two are used in order to retrieve the cloud
Atmos. Meas. Tech., 12, 1697–1716, 2019 www.atmos-meas-tech.net/12/1697/2019/You can also read