Pollution trace gases C2H6, C2H2, HCOOH, and PAN in the North Atlantic UTLS: observations and simulations
←
→
Page content transcription
If your browser does not render page correctly, please read the page content below
Atmos. Chem. Phys., 21, 8213–8232, 2021
https://doi.org/10.5194/acp-21-8213-2021
© Author(s) 2021. This work is distributed under
the Creative Commons Attribution 4.0 License.

Pollution trace gases C2H6, C2H2, HCOOH, and PAN in the North
Atlantic UTLS: observations and simulations
Gerald Wetzel1 , Felix Friedl-Vallon1 , Norbert Glatthor1 , Jens-Uwe Grooß2 , Thomas Gulde1 , Michael Höpfner1 ,
Sören Johansson1 , Farahnaz Khosrawi1 , Oliver Kirner3 , Anne Kleinert1 , Erik Kretschmer1 , Guido Maucher1 ,
Hans Nordmeyer1 , Hermann Oelhaf1 , Johannes Orphal1 , Christof Piesch1 , Björn-Martin Sinnhuber1 ,
Jörn Ungermann2 , and Bärbel Vogel2
1 Karlsruhe Institute of Technology, Institute of Meteorology and Climate Research, Karlsruhe, Germany
2 Research centre Jülich, Institute of Energy and Climate Research – Stratosphere (IEK-7), Jülich, Germany
3 Karlsruhe Institute of Technology, Steinbuch Centre for Computing, Karlsruhe, Germany

Correspondence: Gerald Wetzel (gerald.wetzel@kit.edu)

Received: 25 November 2020 – Discussion started: 15 December 2020
Revised: 19 April 2021 – Accepted: 20 April 2021 – Published: 27 May 2021

Abstract. Measurements of the pollution trace gases ethane      these species or their precursor substances are transported
(C2 H6 ), ethyne (C2 H2 ), formic acid (HCOOH), and peroxy-     by strong tropospheric winds over large distances, depending
acetyl nitrate (PAN) were performed in the North Atlantic       on their particular atmospheric lifetime of up to months. Ob-
upper troposphere and lowermost stratosphere (UTLS) re-         servations are compared to simulations with the atmospheric
gion with the airborne limb imager GLORIA (Gimballed            models EMAC (ECHAM5/MESSy Atmospheric Chemistry)
Limb Observer for Radiance Imaging of the Atmosphere)           and CAMS (Copernicus Atmosphere Monitoring Service).
with high spatial resolution down to cloud top. Observa-        These models are qualitatively able to reproduce the mea-
tions were made during flights with the German research         sured VMR enhancements but underestimate the absolute
aircraft HALO (High Altitude and LOng Range Research            amount of the increase. Increasing the emissions in EMAC
Aircraft) in the frame of the WISE (Wave-driven ISen-           by a factor of 2 reduces the disagreement between simulated
tropic Exchange) campaign, which was carried out in au-         and measured results and illustrates the importance of the
tumn 2017 from Shannon (Ireland) and Oberpfaffenhofen           quality of emission databases used in chemical models.
(Germany). Enhanced volume mixing ratios (VMRs) of up
to 2.2 ppbv C2 H6 , 0.2 ppbv C2 H2 , 0.9 ppbv HCOOH, and
0.4 ppbv PAN were detected during the flight on 13 Septem-
ber 2017 in the upper troposphere and around the tropopause     1   Introduction
above the British Isles. Elevated quantities of PAN were
measured even in the lowermost stratosphere (locally up         Organic compounds in the troposphere like ethane, ethyne,
to 14 km), likely reflecting the fact that this molecule has    formic acid, and secondary (not directly emitted) pollutants
the longest lifetime of the four species discussed herein.      like peroxyacetyl nitrate are involved in many atmospheric
Backward trajectory calculations as well as global three-       processes. These pollutants can be transported into remote
dimensional Chemical Lagrangian Model of the Stratosphere       regions due to their long lifetime under appropriate atmo-
(CLaMS) simulations with artificial tracers of air mass ori-    spheric conditions. In particular, rapid vertical transport by
gin have shown that the main sources of the observed pol-       deep convection followed by strong horizontal transport as-
lutant species are forest fires in North America and anthro-    sociated with the upper troposphere subtropical jet stream
pogenic pollution in South Asia and Southeast Asia up-          is a particularly efficient means by which surface pollutants
lifted and moved within the Asian monsoon anticyclone           can be transported long distances (e.g. Lu et al., 2019; Al-
(AMA) circulation system. After release from the AMA,           varado et al., 2020). At these altitudes, such hydrocarbons
                                                                and nitrogen-containing substances (like peroxyacetyl ni-

Published by Copernicus Publications on behalf of the European Geosciences Union.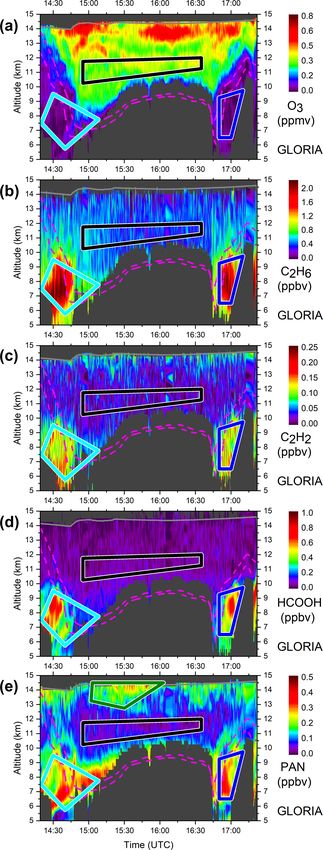
8214                                                                                    G. Wetzel et al.: Pollution trace gases

trate) may also influence the amount of ozone. This is im-         released by the backward reaction of (R1) may contribute to
portant because ozone is known to be an effective green-           an increase of tropospheric ozone far away from the PAN
house gas in the upper troposphere and lowermost strato-           sources (Singh, 1987; Fadnavis et al., 2014; Ungermann et
sphere (UTLS) region since it largely influences the radiation     al., 2016).
budget around the tropopause (de Forster and Shine, 1997;             Scientific flights of the airborne limb imager GLORIA
Hansen et al., 1997; Xie et al., 2008; Riese et al., 2012).        (Gimballed Limb Observer for Radiance Imaging of the At-
   Tropospheric emissions of ethane (C2 H6 ), the most impor-      mosphere; Friedl-Vallon et al., 2014; Riese et al., 2014)
tant non-methane hydrocarbon (NMHC) constituent of natu-           were carried out aboard HALO (High Altitude and LOng
ral gas, are connected with biomass burning and natural gas        Range Research Aircraft) during the WISE (Wave-driven
losses (Rudolph, 1995; Singh et al., 2001). The production         ISentropic Exchange) campaign in autumn 2017 above the
of fossil fuels together with biofuel use also are important       North Atlantic. This atmospheric region is characterized by
sources of this molecule (Xiao et al., 2008). It is removed        intense dynamical activity reflected in complex structures
from the atmosphere by reaction with the hydroxyl (OH) rad-        like tropopause folds and air masses of different origins. Tro-
ical (Xiao et al., 2008). The mean lifetime of C2 H6 is about      pospheric pollutants like C2 H6 , C2 H2 , HCOOH, and PAN
2 months (Rudolph, 1995), enabling it to be transported far        were observed together with stratospheric trace gases like O3
away from its source regions.                                      in the UTLS region with high temporal and spatial resolu-
   The trace gas ethyne (C2 H2 ) is emitted into the tropo-        tion. An important goal of these measurements was to iden-
sphere by combustion of biofuels and fossil fuels, as well as      tify possible atmospheric regions with enhanced amounts of
biomass burning (Xiao et al., 2007). As in the case of C2 H6 ,     these pollutant trace gases far away from the emission loca-
the reaction with the OH radical is also responsible for the       tions. A description of the GLORIA instrument, data analy-
loss of C2 H2 in the atmosphere. The mean lifetime of C2 H2        sis, and chemical modelling are given in Sect. 2. A discussion
is shorter compared to the one of C2 H6 and amounts to about       of observed vertical volume mixing ratio (VMR) profiles of
2 weeks (Xiao et al., 2007) but still allows for long-range        trace species follows in Sect. 3 together with a comparison
transport of this species.                                         of the measured data to simulations of the chemistry cli-
   Formic acid (HCOOH) has many different sources. Di-             mate model EMAC (ECHAM5/MESSy Atmospheric Chem-
rect emissions from plants, biomass burning, and fossil fuel       istry) and to assimilated data of CAMS (Copernicus Atmo-
combustion are important contributors to the tropospheric          sphere Monitoring Service). A discussion on the possible ori-
abundances of this molecule (Mungall et al., 2018). A sec-         gin of air masses at the Earth’s boundary layer detected by
ondary photochemical formation takes place from anthro-            GLORIA is also included in this section.
pogenic and biogenic precursors (Yuan et al., 2015) such as
the oxidation of volatile organic compounds (Khare et al.,
1999). The loss of HCOOH is possible due to wet and dry            2     GLORIA instrument, data analysis, and modelling
deposition as well as oxidation with the OH radical (Paulot
et al., 2011). The atmospheric mean lifetime of HCOOH is           In the following subsections, we give an overview of the
very variable and ranges from 1 or 2 d in the boundary layer       GLORIA instrument and the flights with the HALO aircraft,
up to a few weeks in the free troposphere (Millet et al., 2015).   together with the corresponding data analysis and a descrip-
   The molecule peroxyacetyl nitrate (CH3 COO2 NO2 ), com-         tion of atmospheric modelling performed for this study.
monly named as PAN, is formed via a three-body reaction of
peroxyacetyl (CH3 COO2 ) with nitrogen dioxide (NO2 ) and          2.1    GLORIA instrument and HALO flights
a third partner M (mainly N2 or O2 ):
                                                                   The cryogenic Fourier transform limb emission spectrom-
CH3 COO2 + NO2 + M ↔ CH3 COO2 NO2 + M.                     (R1)
                                                                   eter GLORIA operates in the thermal infrared spectral re-
The reverse reaction of (R1) is the thermal decomposition of       gion between about 7 and 13 µm using a two-dimensional
PAN and defines the main loss of this molecule in the atmo-        detector array observing 128 vertical and 48 horizontal in-
sphere (Fischer et al., 2014) while photolysis becomes dom-        terferograms per measurement (Friedl-Vallon et al., 2014;
inant in the UTLS region (Fadnavis et al., 2014). Two minor        Riese et al., 2014, and references therein). The interfer-
loss processes of PAN are reactions with OH and dry deposi-        ograms are Fourier transformed into the spectral domain
tion (Fischer et al., 2014). The mean atmospheric lifetime of      and radiometrically calibrated using in-flight measurements
PAN is very variable since it is strongly dependent on the am-     of two black bodies (Kleinert et al., 2014). Furthermore,
bient temperature. While the mean lifetime amounts to only         spectra in the horizontal direction were averaged to im-
1 h at temperatures of 298 K, it rises up to a few months un-      prove the signal-to-noise ratio such that the noise equiv-
der cold upper tropospheric conditions (Singh, 1987; Fischer       alent spectral radiance (NESR) finally amounts to about
et al., 2014). Hence, enhanced PAN amounts (which serve as         1.5 × 10⁻⁸ W (cm2 sr cm−1 )−1 . Spectra recorded with max-
an NO2 reservoir) can be transported over wide geographi-          imum optical path difference of 8.0 cm, which corresponds
cal regions in the middle and upper troposphere. Thus, NO2         to an un-apodized spectral resolution of 0.0625 cm−1 , were

Atmos. Chem. Phys., 21, 8213–8232, 2021                                             https://doi.org/10.5194/acp-21-8213-2021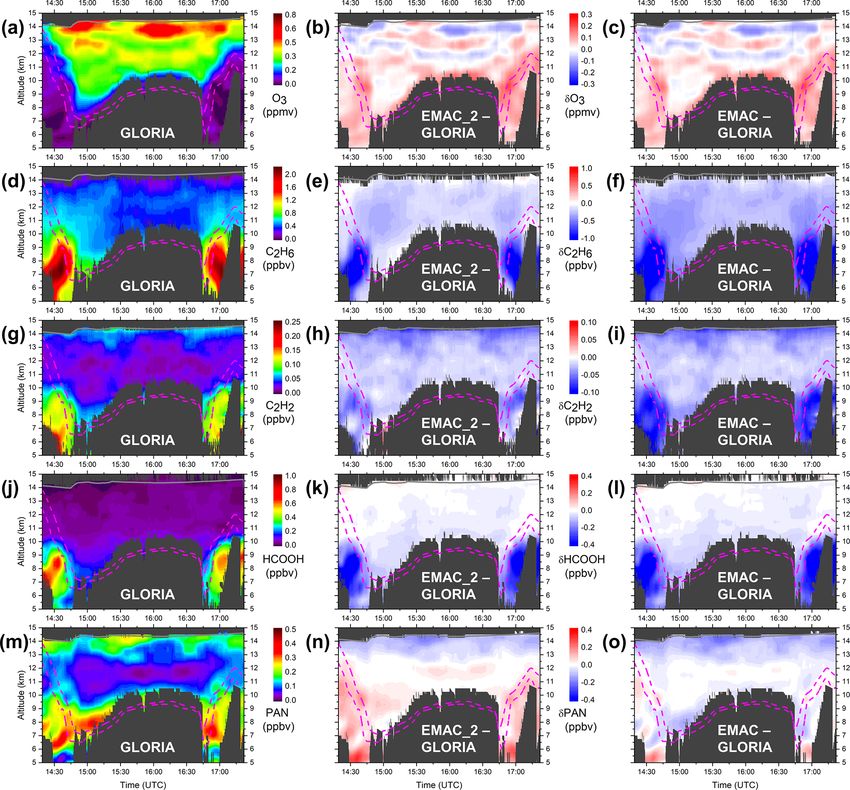
G. Wetzel et al.: Pollution trace gases 8215
spect to atmospheric state and instrument parameters (Ja-
cobians) calculated by KOPRA. The inverse problem of
radiative transfer is solved by KOPRAFIT with a Gauss–
Newton iterative method (Rodgers, 2000) in combination
with a Tikhonov–Phillips regularization approach (Phillips,
1962; Tikhonov, 1963) using a constraint with respect to a
first derivative of the a priori profile of the target species. A
detailed description of the general retrieval process together
with the validation of major species (e.g. O3 , HNO3 , and
ClONO2 ) observed by GLORIA is given by Johansson et
al. (2018).
In a first step cloud-affected spectra are filtered out us-
ing a cloud index as described in Spang et al. (2004). Spec-
tra with a colour ratio of the mean radiance in two spectral
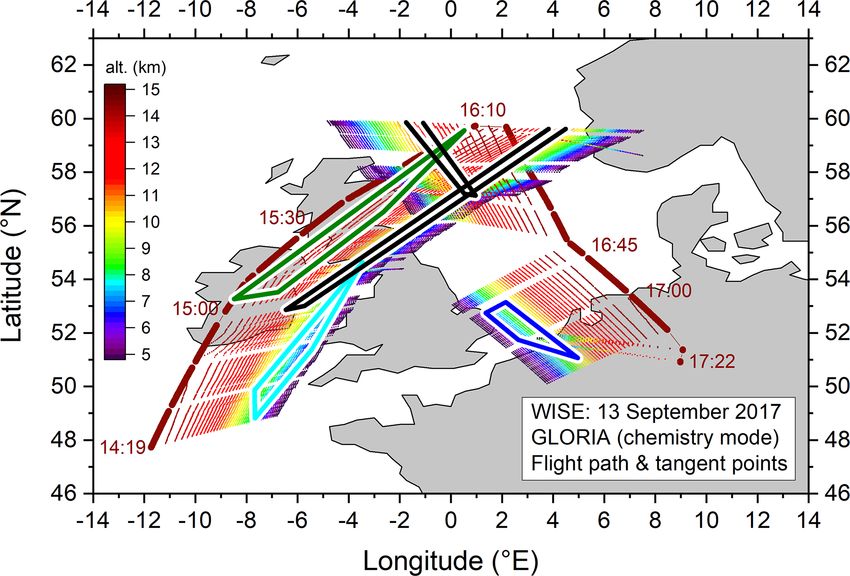
Figure 1. Path of the HALO flight on 13 September 2017 during the windows (788.20–796.25 and 832.30–834.40 cm−1 ) larger
WISE campaign (large dark brown points) together with GLORIA than 2 were chosen for the retrieval process. Prior to the
tangent points (small points with changing colour according to alti- trace gas retrievals, the pointing elevation angle was re-
tude). Measurement times are given in coordinated universal time trieved to compensate for systematic misalignment of the line
(UTC). Coloured framed zones mark areas of special interest as of sight (LOS) of the instrument according to the method
discussed in Sect. 3. Note that only observations performed in the described in Johansson et al. (2018). The final pointing
chemistry mode are shown. (LOS) error was estimated to 0.01◦ . Vertical profiles of at-
mospheric species were taken from a climatological atmo-
sphere (Remedios et al., 2007), updated with surface concen-
used for this study. These so-called chemistry mode spectra tration data from NOAA ESRL GMD (National Oceanic and
are apodized with the Norton and Beer (1976) “strong” func- Atmospheric Administration, Earth System Research Labo-
tion. Due to the high spectral resolution, these measurements ratory, Global Monitoring Division; Montzka et al., 1999).
allow for the retrieval of many species with minor contribu- Subsequently, a temperature retrieval was carried out using
tion to the spectra by the separation of individual spectral pressure–temperature a priori data from the European Cen-
lines from continuum-like emissions. A comprehensive de- tre for Medium-Range Weather Forecasts (ECMWF), which
scription of technical details of the GLORIA instrument is was interpolated to the GLORIA vertical retrieval grid. Spec-
given by Friedl-Vallon et al. (2014) and Riese et al. (2014). tral windows around 811 and 957 cm−1 containing appropri-
In this study, we report results from the WISE aircraft ate CO2 transitions were used for this analysis. The total er-
campaign, which was dedicated mainly to the investiga- ror of the temperature retrieval calculations is estimated to
tion of dynamical processes and the evolution of air masses about 1.5 K (Johansson et al., 2018).
within the context of stratosphere–troposphere exchange. The spectral analysis of the target species C2 H6 , C2 H2 ,
Sixteen flights with HALO were performed from Shannon HCOOH, and PAN is impeded by overlapping features of
(Ireland) and Oberpfaffenhofen (Germany) between 31 Au- so-called disturbing gases in the corresponding spectral re-
gust and 21 October 2017, in a region within about 40◦ W gion. Hence, the retrieval of these pollution trace gases is
and 15◦ E longitude and 40 and 75◦ N latitude. In the follow- more challenging compared to the species discussed in Jo-
ing sections, we focus on results of the flight on 13 Septem- hansson et al. (2018). A careful selection of appropriate mi-
ber 2017 where strong enhancements in the VMR of the crowindows is essential to perform retrievals of these pollu-
pollutant species C2 H6 , C2 H2 , HCOOH, and PAN were ob- tants with good accuracy. Test retrievals were used to identify
served by GLORIA. Figure 1 shows the flight path consisting microwindows that combine limited overlap of spectral sig-
of two main legs together with tangent points of GLORIA natures of disturbing gases with a high sensitivity to changes
where the instrument was operated in the chemistry mode. in the abundance of target gases. Main interfering species
were either adjusted simultaneously together with the target
2.2 Data analysis of measured spectra molecule or pre-fitted in a different spectral interval.
The analysis of C2 H6 was performed in four microwin-
Radiances are calculated with the Karlsruhe Optimized dows within the ν9 band between 819 and 833 cm−1 (see
and Precise Radiative transfer Algorithm (KOPRA; Stiller Fig. 2a). Many overlapping features of so-called disturbing
et al., 2002) based on spectroscopic parameters from the gases are visible in this spectral region: first of all H2 O and
high-resolution transmission molecular absorption database CO2 . The error budget of C2 H6 is shown in Fig. 2b. At
(HITRAN; Gordon et al., 2017). The retrieval itself is per- higher altitudes with low C2 H6 values, the total error of this
formed with the procedure KOPRAFIT (Höpfner et al., molecule is dominated by the temperature error. Lower down
2002) using derivatives of the radiance spectrum with re- in the VMR maximum region, the systematic spectroscopic
https://doi.org/10.5194/acp-21-8213-2021 Atmos. Chem. Phys., 21, 8213–8232, 2021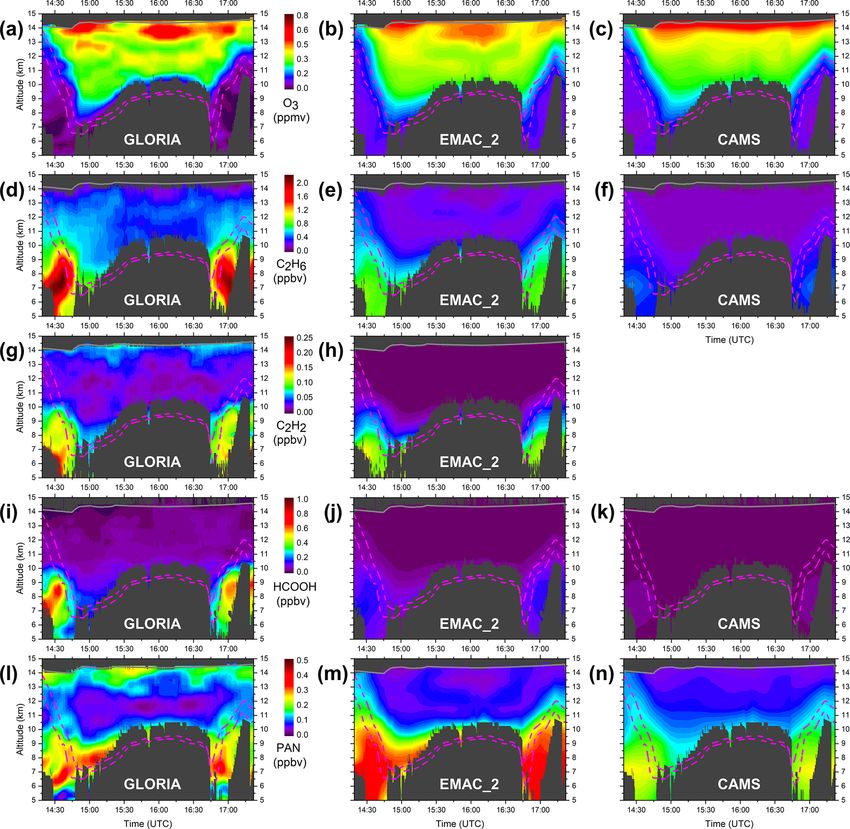
8216 G. Wetzel et al.: Pollution trace gases
error of C2 H6 (as given in HITRAN) governs the error bud- 2.3 Model simulations
get. The total error of C2 H6 remains within about 15 % in the
altitude region of the upper troposphere. 2.3.1 EMAC
Retrieval calculations of C2 H2 were carried out in the R-
branch region of the ν5 band. Figure 3a shows spectral con- Retrieved vertical profiles of trace species are compared
tributions of relevant species in four microwindows between to a multi-year simulation of the chemistry climate model
759 and 781 cm−1 that have been found most appropriate to ECHAM5/MESSy Atmospheric Chemistry (EMAC). This
derive C2 H2 from GLORIA spectra. The corresponding re- Eulerian model includes submodels describing tropospheric
trieval error budget of C2 H2 is given in Fig. 3b. The random and middle atmosphere processes (Jöckel et al., 2010). The
noise error is dominating the budget over nearly the complete core model is the fifth generation European Centre Ham-
altitude range. The total error of C2 H2 stays within 10 %– burg general circulation model (ECHAM5; Roeckner et al.,
15 % in the region of the VMR maximum in the upper tropo- 2006) that is connected to the submodels using the inter-
sphere. face Modular Earth Submodel System (MESSy). For the
The analysis of the molecule HCOOH was performed in present study we applied EMAC (ECHAM5 version 5.3.02,
the spectral range between 1086 and 1117 cm−1 (see Fig. 4a). MESSy version 2.53) with a spherical truncation of T106
Three microwindows were chosen including the strong Q- (corresponding to a resolution of approximately 1.125◦ by
branch of the HCOOH ν6 vibrational band. The spectral re- 1.125◦ in latitude and longitude) with 90 hybrid pressure
gion is dominated by spectral features due to O3 , CO2 , CFC- levels from the ground up to 0.01 hPa. Meteorological data
12, and HCFC-22 transitions. The spectroscopic part of the fields are specified using a Newtonian relaxation technique
total error is dominant in the altitude region of the HCOOH of the surface pressure and prognostic variables below 1 hPa
VMR maximum in the upper troposphere (see Fig. 4b). Here, with the ECMWF reanalysis ERA-Interim (Dee et al., 2011).
the total HCOOH error stays within 10 %. Apart from this The simulation was initialized on 1 May 2017 and includes
altitude region, the error budget is governed by the random a comprehensive chemistry setup from the troposphere to
noise part and the total error increases significantly (mainly the lower mesosphere. Rate constants of gas-phase reac-
in the upper part of the profile with low HCOOH values). tions originate from Atkinson et al. (2007) and Sander et
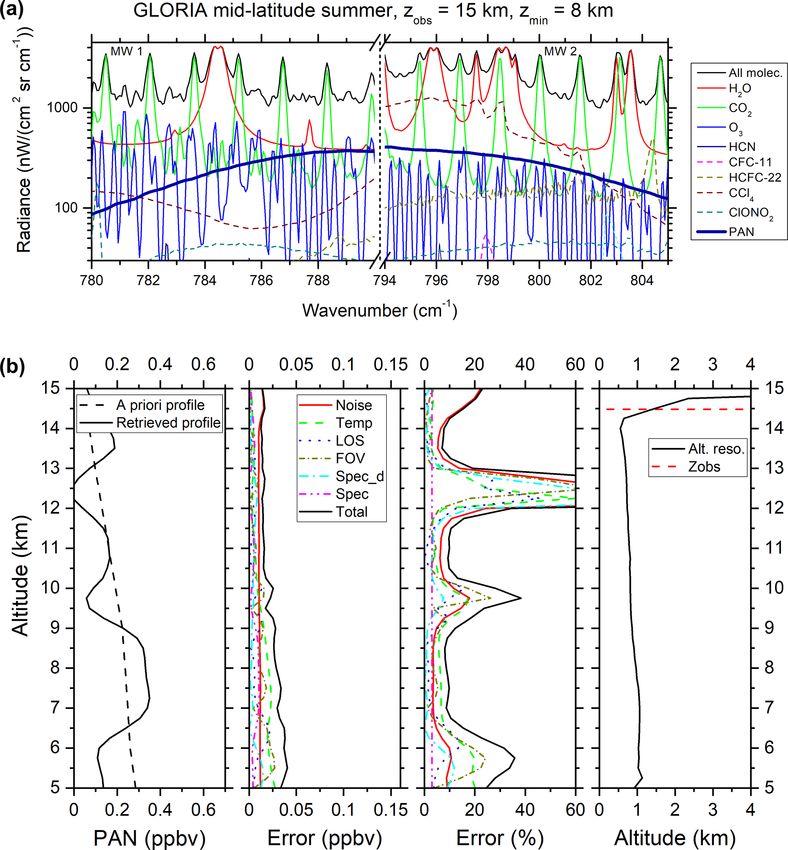
The retrieval of PAN was conducted in two broad mi- al. (2011). Photochemical reactions of precursor substances
crowindows of the ν16 band between 780 and 805 cm−1 (see important for the build-up of the species PAN (Fischer et
Fig. 5a). The spectral gap between these microwindows was al., 2014) were integrated into the model setup. For sur-
chosen such that the strong CO2 Q-branch at 792 cm−1 was face emissions of non-methane volatile organic compounds
excluded from the data analysis. Besides CO2 , the molecules (NMVOCs), a data set of the MACCity emission inventory
H2 O and CCl4 are the main interfering species in the spec- (MACC/CityZEN; Granier et al., 2011), and ACCMIP (At-
tral region of PAN. The retrieval error budget is depicted in mospheric Chemistry and Climate Model Intercomparison
Fig. 5b. Besides random noise, further error sources like in- Project; Lamarque et al., 2013) was used. Emission sources
accuracies in the FOV and the retrieved temperature profile from biomass burning; agricultural waste burning; fossil fu-
contribute to the total PAN error that remains within 10 % in els; and ship, road, and aircraft, as well as biogenic, emis-
altitude regions with enhanced PAN amounts. sions are considered. For the simulated year 2017, most
Besides the retrieval of the above-mentioned pollutant recent available emissions of 2010 are repeated. In addi-
gases, the tracer species ozone was also inferred from the tion to this EMAC standard run, a second model simulation
recorded spectra. Many spectral ozone lines are available (called EMAC_2) was performed using NMVOC emissions
in the mid-infrared spectral region. Transitions between 780 enhanced by a factor of 2 as recommended by Monks et
and 788 cm−1 within the ν2 band were chosen for the re- al. (2018). The model output data were saved every 5 h dur-
trieval process similar to the method described in Johansson ing the time period of the GLORIA observations. The model
et al. (2018). The total ozone error is within 10 % with a ver- output to the GLORIA measurements was interpolated in
tical resolution of 0.3 to 1.5 km. time and space to the observation geolocations.
The altitude resolution of all retrievals, calculated from the
full width at half maximum of the rows of the averaging ker- 2.3.2 CAMS
nel matrix, was used as an a posteriori quality filtering of
the retrieved data. Only vertical profile parts with an altitude The Copernicus Atmosphere Monitoring Service (CAMS)
resolution of better than 2 km were finally used for the data produced by ECMWF is a reanalysis data set that produces
interpretation. continuous data on atmospheric composition (Inness et al.,
2019). The Integrated Forecast System (IFS) of ECMWF was
integrated to allow for the data assimilation and modelling of
aerosols, chemically reactive species, and greenhouse gases.
Apart from assimilated ozone, no stratospheric chemistry is
simulated by the model system. In this study, CAMS reanal-
Atmos. Chem. Phys., 21, 8213–8232, 2021 https://doi.org/10.5194/acp-21-8213-2021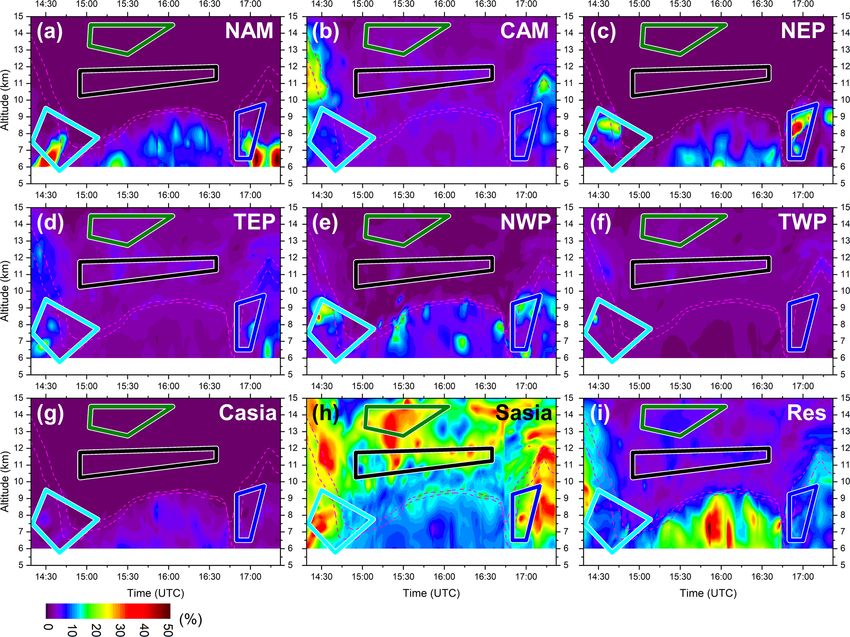
G. Wetzel et al.: Pollution trace gases                                                                                                  8217

Figure 2. Simulated limb emission spectra (with spectral resolution of GLORIA) for a mid-latitude summer standard atmosphere (Remedios
et al., 2007) in four microwindows in the spectral region of the C2 H6 ν9 band centred at 822 cm−1 for a tangent altitude of 8 km. Emissions
of individual species contributing to the combined spectrum (all molecules, black line) are shown (a). Retrieved C2 H6 VMR vertical profile
(and a priori profile) of the limb sequence measured at 13 September 2017 at 16:55 UTC combined with absolute and relative errors and the
altitude resolution (Alt. reso.), determined from the full width at half maximum of the rows of the averaging kernel matrix, together with the
observer altitude (zobs ). The following individual 1σ errors are shown: spectral noise (red solid line), temperature (green dashed line), line
of sight (LOS; blue dotted line), field of view (FOV; dark yellow short dash dotted line), spectroscopic data of disturbing gases (cyan dash
dotted line), spectroscopic data of target molecule C2 H6 (dash dotted magenta line), and total error (solid black line) (b).

yses were used with a horizontal resolution of about 80 km.               3     Results and discussion
The vertical resolution consists of 60 pressure levels up to
0.1 hPa. Three-dimensional model output fields are available              In this section, vertical profiles retrieved from GLORIA
every 3 h. Detailed information on the CAMS model archi-                  measurements during the WISE campaign on 13 Septem-
tecture is given by Inness et al. (2019). An evaluation study of          ber 2017 over the North Atlantic region are shown. Observed
CAMS using aircraft observations was carried out by Wang                  GLORIA chemistry mode data are compared to EMAC and
et al. (2020). Biases of assimilated species like ozone are               CAMS simulation results. The possible origin of air masses
found to be less than 20 %, whereas discrepancies for gases               detected by GLORIA is also discussed.
like C2 H6 and PAN are generally larger.
                                                                          3.1    GLORIA measurements

                                                                          Retrieved volume mixing ratios of C2 H6 , C2 H2 , HCOOH,
                                                                          and PAN together with O3 inferred from limb emission spec-
                                                                          tra during the WISE flight on 13 September 2017 are dis-

https://doi.org/10.5194/acp-21-8213-2021                                                    Atmos. Chem. Phys., 21, 8213–8232, 2021
8218                                                                                       G. Wetzel et al.: Pollution trace gases

Figure 3. Simulated limb emission spectra for four microwindows within the C2 H2 ν5 band centred at 730 cm−1 for a tangent altitude of
8 km (a) and the error budget for a C2 H2 vertical profile obtained on 13 September 2017 at 16:55 UTC (b). Annotation as per Fig. 2.

played in Fig. 6. Ozone is a molecule with highest concen-           servations performed in this altitude range (e.g. Cortesi et al.,
trations in the stratosphere (Brasseur and Solomon, 2005).           2007; Livesey et al., 2008; Bourgeois et al., 2020).
Hence, it can be used as a tracer to diagnose detected air              Measured concentrations of the species C2 H6 are shown
masses whether they are of stratospheric or tropospheric ori-        in Fig. 6b. The VMR distribution of C2 H6 is in parts anti-
gin. The general shape of O3 VMR is strongly correlated              correlated to the one of ozone. Two regions of stronger en-
with the tropopause as shown in Fig. 6a. There are two re-           hanced VMR up to about 2.2 ppbv can be seen in the up-
gions where stratospheric air comes down to about 7 km               per troposphere at the beginning and at the end of the mea-
(around 14:45 and around 16:50 UTC). Here, the tropopause            surement period over the region south of Ireland and near
layer reaches these low altitudes in the form of a strato-           the coastline of the Netherlands and Belgium. In the strato-
spheric intrusion, while at the beginning and the end of             sphere, no stronger enhanced C2 H6 VMR levels are visible
the measurement phase the troposphere extends up to about            and values remain below about 0.6 ppbv, which can be con-
12 km. Trajectory calculations have shown that, due to a             firmed by mid-latitude satellite observations (Rinsland et al.,
west-southwesterly mid- and upper tropospheric air flow in           2005; Glatthor et al., 2009; Wiegele et al., 2012). For in-
the region of the flight path shown in Fig. 1, GLORIA has            stance, up to about 1.7 ppbv C2 H6 was observed by the At-
sounded virtually the same air mass twice, yielding to a kind        mospheric Chemistry Experiment (ACE) instrument in the
of symmetry in the horizontal trace gas distribution before          mid-latitude upper troposphere, but with less spatial resolu-
and after 16:10 UTC. Measured stratospheric ozone volume             tion compared to GLORIA. In addition, in situ aircraft mea-
mixing ratios are within 0.1 and 0.8 ppmv. These values are          surements recorded C2 H6 amounts of more than 2 ppbv in
in line with other mid-latitude remote sensing and in situ ob-       the mid-latitude upper troposphere (Rudolph, 1995; Monks

Atmos. Chem. Phys., 21, 8213–8232, 2021                                                https://doi.org/10.5194/acp-21-8213-2021
G. Wetzel et al.: Pollution trace gases                                                                                          8219

Figure 4. Simulated limb emission spectra for three microwindows within the HCOOH ν6 band centred near 1105 cm−1 for a tangent altitude
of 8 km (a) and the error budget for a HCOOH vertical profile obtained on 13 September 2017 at 16:55 UTC (b). Annotation as per Fig. 2.

et al., 2018, and references therein) in accordance with the          ble at high altitudes in the troposphere during early and late
high values seen by GLORIA.                                           times of the GLORIA observations with values up to 0.9
   The same behaviour as seen for C2 H6 is present in the             ppbv. Comparable amounts were seen by airborne in situ
vertical and horizontal distribution of C2 H2 amounts (see            measurements in the mid-latitude upper troposphere (Reiner
Fig. 6c). Elevated volume mixing ratios of up to 0.2 ppbv             et al., 1999; Singh et al., 2000) with VMR maxima of up
in the upper troposphere are clearly visible at the beginning         to 0.6 ppbv. Very high upper-tropospheric HCOOH mixing
and close to the end of the observation period. In the strato-        ratios of 3.1 ppbv and 2.0 ppbv were observed by the space-
sphere, measured C2 H2 values appear noisy and stay clearly           borne ACE Fourier transform spectrometer in two preced-
below 0.1 ppbv most of the time. C2 H2 VMR measured by                ing years in austral spring (Rinsland et al., 2006). In con-
GLORIA lies within the range of satellite (Rinsland et al.,           trast, stratospheric HCOOH values are low and not higher
2005; Wiegele et al., 2012) and aircraft in situ data (Xiao et        than 0.1 ppbv. These values are in accordance with space-
al., 2007, and references therein) obtained in the same alti-         borne mid-latitude observations by the ACE Fourier trans-
tude region at mid-latitudes with values of up to 0.45 ppbv           form spectrometer and the MIPAS instrument in the altitude
as seen by the Michelson Interferometer for Passive Atmo-             regime considered here (Rinsland et al., 2006; Grutter et al.,
spheric Sounding (MIPAS) instrument under biomass burn-               2010).
ing conditions in October 2007 (Wiegele et al., 2012).                   The two-dimensional cross section of PAN is shown in
   Measured HCOOH volume mixing ratios are depicted in                Fig. 6e. The distribution of VMR maxima and minima is
Fig. 6d. As in the case of the previously mentioned species           more structured compared to the one of the previously re-
C2 H6 and C2 H2 , large amounts of HCOOH are also visi-               garded pollution trace gases. Increased amounts of PAN up

https://doi.org/10.5194/acp-21-8213-2021                                               Atmos. Chem. Phys., 21, 8213–8232, 2021
8220                                                                                       G. Wetzel et al.: Pollution trace gases

Figure 5. Simulated limb emission spectra for two microwindows within the PAN ν16 band centred near 792 cm−1 for a tangent altitude of
8 km (a) and the error budget for a PAN vertical profile obtained on 13 September 2017 at 16:55 UTC (b). Annotation as per Fig. 2.

to 0.4 ppbv are not only visible at the beginning and end of         cher et al. (2014) exhibits mid-latitude middle and upper-
the observation period in the upper troposphere but also in the      tropospheric PAN values of more than 0.5 ppbv over the
lowermost stratosphere around 15:00 UTC, at altitudes of 7           Northern Atlantic during summer. These different shapes of
to 8 km. Somewhat less enhanced quantities are noticeable            VMR distributions might be explained by very long lifetimes
near 14 km around 15:30 UTC. Elevated PAN amounts of                 of PAN under cold UTLS conditions and by the fact that PAN
comparable magnitude have also been detected in the UTLS             is not emitted directly but dependent on the availability of
region by space-borne instruments. The Cryogenic Infrared            precursor substances as described in Sect. 1.
Spectrometers and Telescopes for the Atmosphere (CRISTA)
experiment detected up to 0.35 ppbv PAN in the mid-latitude          3.2   Comparison to model simulations
UTLS over East Asia and the western Pacific (Ungermann et
al., 2016). The ACE Fourier transform spectrometer recorded          The comparison of measured species to model simulations
0.52 ppbv PAN at 11.5 km in a biomass burning plume above            is presented in Figs. 7 and 8. The observed data have been
eastern Africa in autumn 2005 (Coheur et al., 2007) and up           temporally smoothed with a 39-point adjacent averaging rou-
to 0.6 ppbv PAN were seen by the MIPAS instrument un-                tine to permit a more realistic comparison given the different
der biomass burning conditions in the upper troposphere in           horizontal resolutions of the measurement and the EMAC
October 2007 (Wiegele et al., 2012). PAN mixing ratios of            and CAMS simulations. For O3 , both simulations gener-
up to 0.2 ppbv were detected by airborne in situ measure-            ally reproduce the tropospheric and stratospheric concentra-
ments in the free troposphere (Singh et al., 2000, 2001). A          tions seen by GLORIA (see Fig. 7a–c) but with coarser spa-
compilation of different aircraft observations given by Fis-         tial structure. The chemistry climate model EMAC is able
                                                                     to simulate finer structures while CAMS only produces a

Atmos. Chem. Phys., 21, 8213–8232, 2021                                                https://doi.org/10.5194/acp-21-8213-2021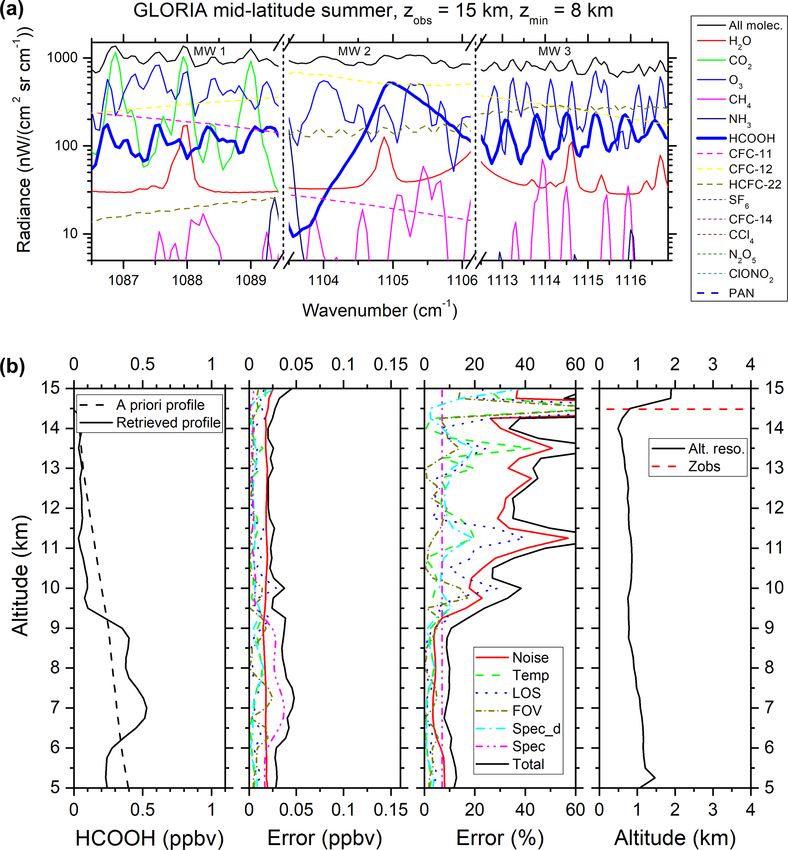
G. Wetzel et al.: Pollution trace gases                                                                                         8221

                                                                       smooth distribution of assimilated ozone. Both models tend
                                                                       to slightly overestimate the amount of ozone in the tro-
                                                                       posphere. This is also visible in Fig. 8a–c where differ-
                                                                       ences between both EMAC runs (with and without enhanced
                                                                       NMVOC emissions) and GLORIA observations are shown.
                                                                       The amount of simulated ozone in the EMAC_2 run is only
                                                                       slightly higher (less than 10 ppbv) compared to the EMAC
                                                                       simulation without enhanced NMVOC emissions (VMR dif-
                                                                       ferences in Fig. 8b and c are therefore nearly the same).
                                                                          Comparisons for C2 H6 are displayed in Fig. 7d–f. Both
                                                                       models are able to qualitatively reproduce the temporal and
                                                                       spatial region of enhanced upper-tropospheric C2 H6 as ob-
                                                                       served by GLORIA. As in the case of ozone, EMAC again
                                                                       is able to display finer structures in the vertical and hori-
                                                                       zontal distribution of C2 H6 compared to CAMS. However,
                                                                       deficits in the simulated absolute C2 H6 quantities are clearly
                                                                       visible in both models, especially in the case of CAMS. A
                                                                       considerable underestimation of CAMS C2 H6 with respect
                                                                       to airborne observations was already reported by Wang et
                                                                       al. (2020). The EMAC_2 simulation with increased NMVOC
                                                                       emissions at least reduces the difference to the GLORIA ob-
                                                                       servations compared to the EMAC run without these stronger
                                                                       NMVOC emissions (see Fig. 8d–f).
                                                                          For C2 H2 , we note that EMAC predicts elevated concen-
                                                                       trations in much the same region where GLORIA reports en-
                                                                       hancements (see Fig. 7g–h). In addition, the measured VMRs
                                                                       in the upper troposphere are only a little underestimated in
                                                                       terms of their absolute amount by the EMAC_2 simulation
                                                                       using raised NMVOC emissions. In the stratosphere, simu-
                                                                       lated C2 H2 amounts are too low compared to the measure-
                                                                       ment. Using standard NMVOC emissions in EMAC leads to
                                                                       an increased underestimation of C2 H2 amounts compared to
                                                                       GLORIA (see Fig. 8g–i).
                                                                          The comparison of the species HCOOH is shown in
                                                                       Figs. 7i–k and 8j–l. Elevated HCOOH concentrations, as
                                                                       recorded by GLORIA in the upper troposphere, are clearly
                                                                       underestimated by both models, especially in the CAMS sim-
                                                                       ulation, although the atmospheric region of the (too weak)
                                                                       enhanced HCOOH amounts in the models agrees with the
                                                                       measured one. However, the EMAC_2 simulation at least re-
                                                                       duces differences with respect to the GLORIA observations.
                                                                          Looking at the temporal and spatial distribution of PAN
                                                                       the situation appears somewhat different to the comparisons
                                                                       discussed above (see Figs. 7l–n and 8m–o). The princi-
                                                                       pal behaviour of enhanced PAN values in the upper tropo-
                                                                       sphere is captured by both atmospheric models. EMAC pro-
Figure 6. Horizontal and vertical VMR distributions of (a) O3 ,
                                                                       duces slightly finer structures in the stratosphere compared to
(b) C2 H6 , (c) C2 H2 , (d) HCOOH, (e) PAN as seen by GLORIA
                                                                       CAMS. However, the measured small-scale variations in the
above the North Atlantic region on 13 September 2017. Flight alti-
tude is shown as grey line; dynamical tropopause (2 and 4 potential    amount of PAN especially near 14:30 UTC between 6 and
vorticity units from ECMWF) is plotted as dashed magenta lines.        8 km are not reproduced by the EMAC_2 simulation with
Cyan, blue, and green (only PAN) boxes mark regions with en-           enhanced NMVOC emissions, while the observed elevated
hanced VMR levels (for pollutant species not for O3 ); black boxes     PAN values around 15:00 UTC in the lowermost stratosphere
comprise a region with low mixing ratios. For all these boxes, back-   from 7 to 8 km are also visible in the model output. Apart
ward trajectories are calculated (see discussion in Sect. 3).          from the regions with the highest measured PAN amounts,
                                                                       EMAC_2 tends to overestimate the concentration of PAN be-

https://doi.org/10.5194/acp-21-8213-2021                                                Atmos. Chem. Phys., 21, 8213–8232, 2021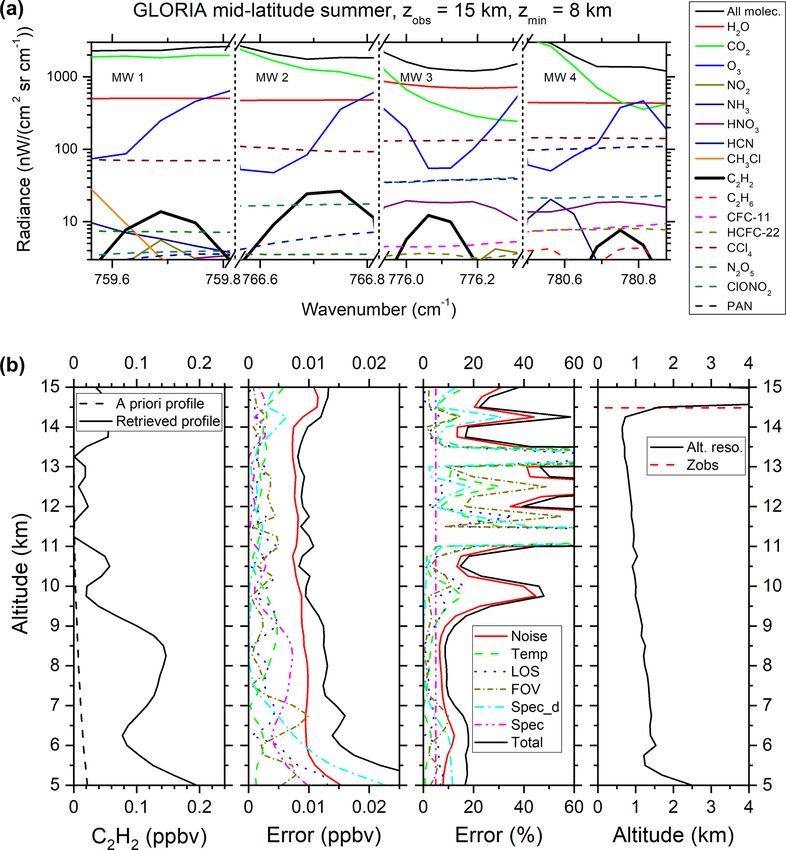
8222                                                                                      G. Wetzel et al.: Pollution trace gases

Figure 7. Horizontal and vertical VMR distributions of GLORIA (repeated from Fig. 6 but temporally smoothed, left column), EMAC_2
(middle column), and CAMS (right column) of (a–c) O3 , (d–f) C2 H6 , (g–h) C2 H2 , (i–k) HCOOH, and (l–n) PAN, as seen on 13 Septem-
ber 2017. The EMAC_2 simulation includes NMVOC emissions enhanced by a factor of 2 as recommended by Monks et al. (2018). No
CAMS data for C2 H2 are available. Annotation as per Fig. 6.

low about 13 km (what is not the case in the standard EMAC          lower absolute quantities. The different shapes of the hori-
run). Interesting VMR variations are also seen by GLORIA            zontal and vertical distributions of PAN VMR is most prob-
in the stratosphere above 13 km. The PAN VMR maximum                ably caused by long-range atmospheric transport. Compared
detected around 15:40 UTC near 14 km is not visible in the          to the species discussed before, sources and sinks are differ-
model simulations. The PAN VMR minima near 15:00 UTC                ent, and atmospheric lifetime of PAN is considerably longer.
and between 16:00 and 16:15 UTC at about 13.5 km are                In the following subsection, we will focus on the origin of the
reflected as a VMR minimum in EMAC_2, although with                 polluted air masses, which have been detected by GLORIA.

Atmos. Chem. Phys., 21, 8213–8232, 2021                                               https://doi.org/10.5194/acp-21-8213-2021
G. Wetzel et al.: Pollution trace gases 8223
Figure 8. Horizontal and vertical VMR distributions of GLORIA (temporally smoothed, left column), EMAC_2 (enhanced NMVOC emis-
sions) minus GLORIA (middle column), and EMAC (standard NMVOC emissions) minus GLORIA (right column) of (a–c) O3 , (d–f) C2 H6 ,
(g–i) C2 H2 , (j–l) HCOOH, and (m–o) PAN, as seen on 13 September 2017. Annotation as per Fig. 6.
3.3 Origin of polluted air masses 3.3.1 CLaMS backward trajectory calculations
To estimate the geographical region (within the Earth’s up-
per planetary boundary layer) of the origin of the measured To obtain a more detailed insight into the origin and trans-
enhanced amounts of the pollutants and their pathways, we port pathways of air masses, backward trajectories with the
performed backward trajectory calculations as well as global three-dimensional Chemical Lagrangian Model of the Strato-
three-dimensional CLaMS simulations with artificial tracers sphere (CLaMS; McKenna et al., 2002a, b; Pommrich et al.,
of air mass origin as described in the following subsections. 2014) were performed starting from the GLORIA measure-
ments. Although pure trajectories do not include mixing pro-
cesses, they are well suited to analyse the history of trans-
port pathways of air parcels in the tropics and in the region
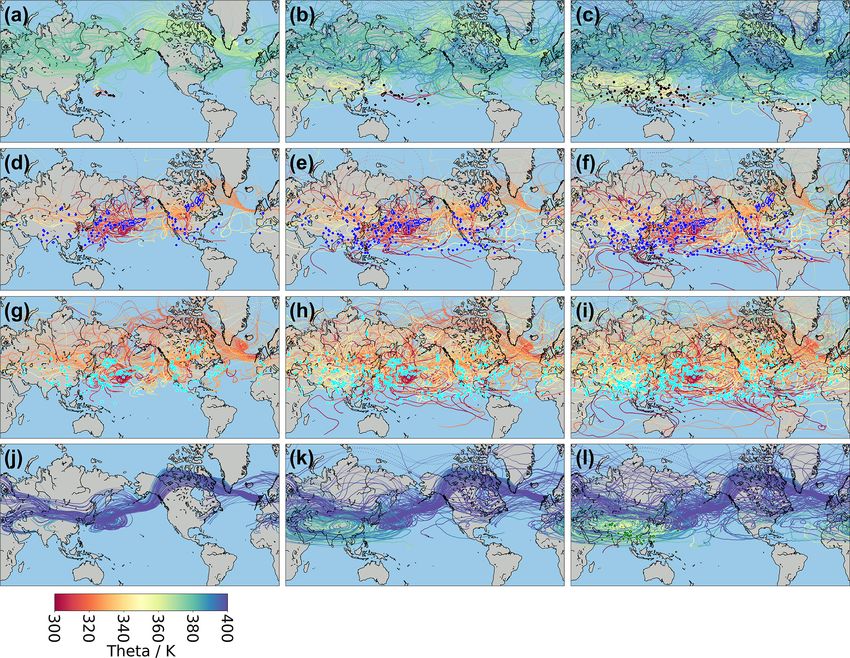
https://doi.org/10.5194/acp-21-8213-2021 Atmos. Chem. Phys., 21, 8213–8232, 20218224 G. Wetzel et al.: Pollution trace gases of the Asian monsoon into the UTLS (Vogel et al., 2014; Li enhanced amounts of PAN are visible in contrast to the non- et al., 2018; Ploeger et al., 2012). In this study, 20, 40, and elevated values of C2 H6 , C2 H2 , and HCOOH. The corre- 60 d diabatic backward trajectories with a horizontal resolu- sponding trajectory calculations (Fig. 9j–l) exhibit no PBL tion of 1◦ ×1◦ were calculated using ERA-Interim reanalysis penetration areas in the case of 20 and 40 d backward trajec- wind data (Dee et al., 2011). Frequently employed trajectory tories. However, the 60 d backward calculations clearly show lengths to study transport processes in particular in the Asian areas over densely populated Southeast Asia where trajecto- monsoon region ranged from a couple of weeks to a few ries entered the PBL. The ascending air masses are clearly months depending on the transport times from Earth’s sur- visible in the changing colour of the potential temperature face to atmospheric altitudes (e.g. Chen et al., 2012; Bergman along the trajectories (Fig. 9l). This potential source region et al., 2013; Garny and Randel, 2016; Müller et al., 2016; is located well within the Asian summer monsoon pollution Li et al., 2018; Vogel et al., 2019; Legras and Bucci, 2020; pump (Lelieveld et al., 2018; Randel et al., 2010). The tra- Hanumanthu et al., 2020). The transport of air from the plan- jectory calculations show that the air parcels with enhanced etary boundary layer to regions with enhanced PAN between PAN are slowly uplifted by diabatic heating superimposed 13 and 14.5 km (about 400 K) needs up to 60 d, therefore a on the anticyclonic motion within about 40 d, which Vogel et maximum trajectory length of 60 d was chosen for our anal- al. (2019) referred to as an “upward spiralling range”. Subse- ysis. quent transport (within about 20 d) occurred along the sub- These trajectories were generated for defined areas, where tropical jet to the extratropical UTLS over the Atlantic in enhanced or low VMRs of pollutants have been detected by agreement to previous aircraft measurements of long-lived GLORIA. Selected regions are displayed as coloured boxes trace gases (like CH4 , H2 O, CO, N2 O, and SF6 ) in the ex- in Fig. 6. High amounts of pollutants are recorded within tratropical UTLS over the Atlantic (e.g. Müller et al., 2016; the cyan and blue boxes mainly in the upper troposphere. Vogel et al., 2016). In this study, it is demonstrated that also Air masses marked in these two boxes are located near the for the pollutant PAN, with a lifetime of up to a few months, stratospheric intrusion. This region was probed twice: first is this transport pathway from the Asian monsoon region to at the beginning and second at the end of the flight (see the extratropical UTLS important. Since PAN has this long Fig. 1). In addition, the green box marks enhanced quanti- lifetime in the free and upper troposphere, which is longer ties of observed PAN found in the stratosphere between 13 than the lifetimes of C2 H6 , C2 H2 , and HCOOH, it is likely and 14.5 km (Fig. 6e). In contrast, the black box stands for that some amount of PAN still exists in the stratospheric re- an air mass where low pollution VMRs have been observed. gion of the green box while concentrations of the three other Figure 9 gives an overview of the trajectory calculations. It pollutant species are already depleted. is obvious that air masses were transported by westerly winds Backward trajectory calculations are very useful to iden- to the place of GLORIA observations. If we first regard the tify both the origin of an air parcel in the PBL and its detailed black box (as defined in Fig. 6) in the lowermost strato- transport pathways and transport times; however, mixing pro- sphere, where low mixing ratios for all pollutant species dis- cesses between different air parcels are neglected. Therefore, cussed here were observed, we find that only few trajec- we use in addition global three-dimensional CLaMS simu- tories penetrate the upper planetary boundary layer (PBL) lations considering mixing of air parcels to characterize the limit of 800 hPa on their way back from the GLORIA ob- origin of air masses. servation points within 20, 40, and 60 d (Fig. 9a–c). Fur- ther, most of these areas are located over the southern part 3.3.2 Artificial tracers of air mass origin calculations of the North Pacific where we would not expect much pollu- tion in the PBL. In contrast, looking at the cyan and blue The Lagrangian three-dimensional chemistry transport boxes (of Fig. 6), marking mainly air masses in the up- model CLaMS (Pommrich et al., 2014, and references per troposphere near the flank of the stratospheric intrusion therein) was used to calculate artificial tracers of air mass with generally high amounts of the pollutants, we find lots origin (e.g. Vogel et al., 2016, 2019). These artificial tracers of trajectories going into the PBL not only over the North refer to marked geographical regions in the boundary layer Pacific region but also over densely populated regions in of the global atmosphere. An overview of these regions is Southeast Asia (Fig. 9d–i) where we expect direct anthro- given in Fig. 10 which is an updated configuration compared pogenic emissions or precursors of the considered species to previous studies using artificial tracers of air mass origin in (Lelieveld et al., 2001). Furthermore, marked areas of PBL CLaMS. The upper limit of the model boundary layer follows penetration are also visible over the North American conti- the orography and extends to about 2–3 km above the Earth’s nent, especially in Canada where forest fires were frequent surface. In the currently used simulation, the model dynam- and intense in August and September 2017 (Pumphrey et al., ics are driven by horizontal winds from the ERA-Interim re- 2020; Torres et al., 2020; Hooghiem et al., 2020; Khaykin analysis (Dee et al., 2011) provided by ECMWF. Transport et al., 2018). These widespread Canadian fires correlate well of air masses from the model boundary into the free tropo- with the marked PBL areas. Finally, we look at the green sphere and above is considered from 1 May 2017, which is region in the stratosphere around 14 km (see Fig. 6) where the starting time of the simulation. Every 24 h (time step for Atmos. Chem. Phys., 21, 8213–8232, 2021 https://doi.org/10.5194/acp-21-8213-2021
G. Wetzel et al.: Pollution trace gases                                                                                                8225

Figure 9. Backward trajectory calculations performed by CLaMS using ERA-Interim wind data. Trajectories start at the GLORIA tangent
points and are shown for 20 d (left column), 40 d (middle column), and 60 d (right column) within defined regions: black (a–c), blue (d–f),
cyan (g–i), and green (j–l) as displayed in Fig. 6. Trajectory colours denote the potential temperature (which is also a measure of altitude)
along the trajectory as indicated in the colour bar. Coloured encircled areas (black, blue, cyan, and green) mark regions where the backward
trajectory penetrates the upper edge of the planetary boundary layer (800 hPa). For better clarity, only every tenth trajectory is displayed.
Hence, encircled areas may occur where no trajectory is drawn.

mixing in CLaMS), air masses in the model boundary layer                 America, Northeast Pacific, Northwest Pacific, and the Trop-
are marked by the different tracers of air mass origin and               ical Eastern Pacific and also stems from, to a smaller part,
can be transported like a chemical tracer to other regions of            Central America. Up to about 40 % in these boxes origi-
the free troposphere or stratosphere, and subsequent mixing              nate from the South Asian region which includes the Tibetan
processes between different air masses can occur. Therefore,             Plateau, Eastern China, Northern India, Indian Ocean, Bay of
the value of the individual artificial tracer of air mass ori-           Bengal, Indian subcontinent, Southeast Asia, and Warm pool
gin counts the percentage of an air mass that originated in              (see Fig. 10). This is consistent with the findings of the trajec-
the specific model boundary layer region since 1 May 2017                tory calculations as shown in the previous section. Air masses
considering advection and mixing processes.                              in the stratosphere within the green box where enhanced PAN
   The results of the CLaMS simulation are displayed in                  mixing ratios were detected by GLORIA come mainly from
Fig. 11. The origin of air masses seen inside the cyan and               the South Asian region. This is also in agreement with the
blue boxes (which contain the largest values of C2 H6 , C2 H2 ,          PBL penetration region of the backward trajectories as dis-
HCOOH, and PAN; see Fig. 6) below the tropical side of                   cussed before. Concerning the black box in the stratosphere
the stratospheric intrusion stems from, to a large part, North           with low concentrations of C2 H6 , C2 H2 , HCOOH, and PAN,

https://doi.org/10.5194/acp-21-8213-2021                                                   Atmos. Chem. Phys., 21, 8213–8232, 2021
8226                                                                                               G. Wetzel et al.: Pollution trace gases

Figure 10. Geographical locations of the artificial tracers of air mass origin used in the CLaMS model for the HALO WISE campaign in
2017. In some regions, the artificial tracers are defined to separate between continental and maritime areas as well as by different geopotential
heights (e.g. Tibetan Plateau). The geographical locations of the artificial tracers of air mass origin used in previous CLaMS simulations can
be found in Vogel et al. (2019).

it is obvious that only fragments of air originate from the                   First, enhanced volume mixing ratios of the pollutant
North American, Northeast Pacific, and Northwest Pacific re-               gases C2 H6 , C2 H2 , HCOOH, and PAN were recorded by
gions. Some patches of South Asian air masses are visible in               the GLORIA instrument in the upper troposphere with high
the black box zone, obviously from regions without enhanced                temporal and spatial resolution. It is important to empha-
amounts of the pollutants discussed here.                                  size that these enhancements were detected far away from
   The artificial tracers of air mass origin mark specific geo-            the emission sources of these species. This is possible due
graphical regions in the model boundary layer and are there-               to their long atmospheric lifetimes in the order of weeks
fore very useful to identify the origin of observed air masses             to months under free tropospheric conditions. Since PAN
including atmospheric mixing processes. However, some re-                  has the longest lifetime of this foursome, elevated quantities
gions on the Earth’s surface where high emissions of chemi-                of this molecule could be measured even in the lowermost
cal tracers such as C2 H6 , C2 H2 , HCOOH, and PAN (or their               stratosphere. Backward trajectories and artificial tracers of
precursors) really occur are not included in the CLaMS simu-               air mass origin calculations indicate that the main sources
lations. Nevertheless, CLaMS simulations are useful to show                of the emitted species are, on the one hand, biomass for-
that the enhanced PAN mixing rations in the lower strato-                  est fires in North America which reached their maximum
sphere (green box) are mainly from South Asia in agreement                 a couple of weeks before the GLORIA flight (Pumphrey et
to the trajectory calculations.                                            al., 2020; Torres et al., 2020) when air masses detected by
                                                                           GLORIA passed this region. On the other hand, another im-
                                                                           portant source region is located in the vast region of South
4   Conclusions                                                            Asia and Southeast Asia where the Asian monsoon anti-
                                                                           cyclone governs the circulation regime during the summer
GLORIA observations of pollutant trace gases shown in this
                                                                           months. Here, huge amounts of pollutants are lifted upwards
work were performed during a flight of the WISE aircraft
                                                                           into the upper troposphere and further transported to northern
campaign around the British Isles on 13 September 2017.
                                                                           mid-latitudes via strong wind fields like the subtropical jet
One of the special characteristics of these remote sensing
                                                                           stream (see e.g. Ungermann et al., 2016; Vogel et al., 2016;
measurements are the high temporal and spatial resolution
                                                                           Lelieveld et al., 2018; Legras and Bucci, 2020). Indeed, an-
of the data. As discussed in Sect. 3.1, the amounts of these
                                                                           other GLORIA measurement carried out about 6 weeks ear-
gases are in line with data from previously performed satel-
                                                                           lier on 31 July 2017 during the StratoClim (Stratospheric
lite and in situ aircraft measurements. The pollutants can be
                                                                           and upper tropospheric processes for better climate predic-
transported into remote regions due to their long lifetime un-
                                                                           tions) campaign over India and Nepal also shows elevated
der appropriate atmospheric conditions, like convective pro-
                                                                           amounts of more than 0.2 ppbv of C2 H2 , more than 0.2 ppbv
cesses combined with strong wind regimes of the upper tro-
                                                                           of HCOOH, and more than 0.5 ppbv of PAN (Johansson et
posphere. The following main results can be stated.
                                                                           al., 2020). These values are of comparable magnitude to the

Atmos. Chem. Phys., 21, 8213–8232, 2021                                                       https://doi.org/10.5194/acp-21-8213-2021
G. Wetzel et al.: Pollution trace gases 8227 Figure 11. Artificial tracers of air mass origin calculations performed with CLaMS for the GLORIA observation grid showing the horizontal and vertical distributions of fraction of air originating from the boundary layer of different geographical regions as defined in Fig. 10. Results are shown for zones from the North American, Central American, and Pacific regions (a–f) and zones for Central Asia (g) and South Asia (Sasia), which comprise the subregions INO, IND, NIN, TIB, ECH, BoB, SEA, and Wpool (g). The residual part (Res) displayed in (i) includes all global regions except the zones shown in (a–h) and is of little importance for the GLORIA observations. Annotations as per Fig. 6. ones observed during the WISE campaign. Our study demon- HCOOH, and, to a lesser extent, PAN. The EMAC_2 simula- strates that PAN, with a lifetime of up to a few months, is tion using NMVOC emissions enhanced by a factor of 2 (as transported from sources in Asia to the northern extratropical recommended by Monks et al., 2018) only slightly underes- UTLS within about 2 months caused by the Asian monsoon timates the C2 H2 concentrations, while simulated values for which has implications for ozone and thus possibly for the C2 H6 and HCOOH are also too low. Compared to the EMAC radiative budget in that part of the atmosphere. standard emission run, the EMAC_2 simulation reduces dif- Second, the chemistry climate model EMAC and the ferences to the GLORIA observations for these gases. In con- CAMS assimilation system are able to simulate tropospheric trast, the size of elevated PAN values is overestimated by the and stratospheric dynamical ozone VMR structures as seen EMAC_2 model run. However, this does not hold for the lo- by GLORIA although with coarser spatial resolution com- cal PAN VMR enhancements detected near 14 km, which are pared to the measurement (particularly for CAMS). In addi- not captured by EMAC_2 nor by CAMS. tion, both models reproduce the temporal and spatial region This study has shown that observations of pollutant of enhanced upper tropospheric VMR levels of the measured species are further needed since biomass burning and wild- pollutant species (C2 H2 not available in CAMS). However, fires will still occur in the future and seem to have increased CAMS clearly underestimates the amount of elevated C2 H6 , in the last years (Witze, 2020). There is still potential to im- https://doi.org/10.5194/acp-21-8213-2021 Atmos. Chem. Phys., 21, 8213–8232, 2021
8228                                                                                            G. Wetzel et al.: Pollution trace gases

prove chemical models with regard to reproducing the mea-               edge the computing time for the CLaMS simulations granted on the
sured VMR enhancements of the pollutant gases in more de-               supercomputer JURECA at Jülich Supercomputing Centre (JSC)
tail. The rather coarse model resolution together with deficits         under the VSR project ID JICG11. We acknowledge support by
in the vertical transport from convection in the meteorologi-           Deutsche Forschungsgemeinschaft and the Open Access Publishing
cal fields used to drive the model impede the reproduction of           Fund of Karlsruhe Institute of Technology.
measured structures of the pollutant trace gas concentrations.
A further aspect is to improve the emission databases in the
                                                                        Financial support. The article processing charges for this open-
models, because the simulated amount of pollution species is
                                                                        access publication were covered by the Karlsruhe Institute of Tech-
strongly dependent on the local emission place and the inten-           nology (KIT).
sity of the emissions.

                                                                        Review statement. This paper was edited by Peter Haynes and re-
Data availability. GLORIA measurements are available in the             viewed by three anonymous referees.
database HALO-DB (https://halo-db.pa.op.dlr.de/mission/96, Wet-
zel et al., 2021) and will be available on the KITopen reposi-
tory. The CAMS model data are available from ECMWF (https://
apps.ecmwf.int/data-catalogues/cams-reanalysis, ECMWF, 2020).           References
EMAC and CLaMS data are available upon request.
                                                                        Alvarado, L. M. A., Richter, A., Vrekoussis, M., Hilboll, A., Kalisz
                                                                          Hedegaard, A. B., Schneising, O., and Burrows, J. P.: Unex-
Author contributions. GW wrote the paper and performed the bulk           pected long-range transport of glyoxal and formaldehyde ob-
of the data analysis, with input from all co-authors. SJ, AK, JU, MH,     served from the Copernicus Sentinel-5 Precursor satellite dur-
and NG performed the GLORIA data processing. FFV, TG, EK,                 ing the 2018 Canadian wildfires, Atmos. Chem. Phys., 20, 2057–
GM, HN, and CP operated GLORIA during the WISE campaign in                2072, https://doi.org/10.5194/acp-20-2057-2020, 2020.
Shannon and Oberpfaffenhofen. OK and FK performed the EMAC              Atkinson, R., Baulch, D. L., Cox, R. A., Crowley, J. N., Hamp-
simulations and designed the sensitivity studies. BV and JUG per-         son, R. F., Hynes, R. G., Jenkin, M. E., Rossi, M. J., and Troe, J.:
formed the CLaMS trajectory and artificial tracers of air mass ori-       Evaluated kinetic and photochemical data for atmospheric chem-
gin calculations. BMS, HO, and JO directed the research and flight        istry: Volume III – gas phase reactions of inorganic halogens,
planning. All authors commented on and improved the article.              Atmos. Chem. Phys., 7, 981–1191, https://doi.org/10.5194/acp-
                                                                          7-981-2007, 2007.
                                                                        Bergman, J. W., Fierli, F., Jensen, E. J., Honomichl, S., and Pan, L.
                                                                          L.: Boundary layer sources for the Asian anticyclone: Regional
Competing interests. The authors declare that they have no conflict
                                                                          contributions to a vertical conduit, J. Geophys. Res.-Atmos., 118,
of interest.
                                                                          2560–2575, https://doi.org/10.1002/jgrd.50142, 2013.
                                                                        Bourgeois, I., Peischl, J., Thompson, C. R., Aikin, K. C., Campos,
                                                                          T., Clark, H., Commane, R., Daube, B., Diskin, G. W., Elkins,
Special issue statement. This article is part of the special issue        J. W., Gao, R.-S., Gaudel, A., Hintsa, E. J., Johnson, B. J., Kivi,
“WISE: Wave-driven isentropic exchange in the extratropical upper         R., McKain, K., Moore, F. L., Parrish, D. D., Querel, R., Ray,
troposphere and lower stratosphere (ACP/AMT/WCD inter-journal             E., Sánchez, R., Sweeney, C., Tarasick, D. W., Thompson, A.
SI)”. It is not associated with a conference.                             M., Thouret, V., Witte, J. C., Wofsy, S. C., and Ryerson, T.
                                                                          B.: Global-scale distribution of ozone in the remote troposphere
                                                                          from the ATom and HIPPO airborne field missions, Atmos.
Acknowledgements. We acknowledge support by the German Re-                Chem. Phys., 20, 10611–10635, https://doi.org/10.5194/acp-20-
search Foundation (Deutsche Forschungsgemeinschaft, DFG Prior-            10611-2020, 2020.
ity Program SPP 1294). We are grateful to the WISE coordination         Brasseur, G. P. and Solomon, S.: Aeronomy of the Middle Atmo-
team for excellently conducting the aircraft campaign. Results are        sphere: Chemistry and Physics of the Stratosphere and Meso-
based on the efforts of all members of the GLORIA team, including         sphere, Third revised and enlarged edition, Atmospheric and
the technology institutes ZEA-1 and ZEA-2 at Forschungszentrum            Oceanographic Sciences Library, 32, Springer, Dordrecht, 2005.
Jülich and the Institute for Data Processing and Electronics at the     Chen, B., Xu, X. D., Yang, S., and Zhao, T. L.: Climatolog-
Karlsruhe Institute of Technology. We would also like to thank the        ical perspectives of air transport from atmospheric boundary
pilots and ground-support team at the Flight Experiments facility         layer to tropopause layer over Asian monsoon regions dur-
of the Deutsches Zentrum für Luft- und Raumfahrt (DLR-FX). We             ing boreal summer inferred from Lagrangian approach, Atmos.
thank ECMWF for providing CAMS data. The EMAC simulations                 Chem. Phys., 12, 5827–5839, https://doi.org/10.5194/acp-12-
were performed on the supercomputer ForHLR funded by the Min-             5827-2012, 2012.
istry of Science, Research and the Arts Baden-Württemberg and by        Coheur, P.-F., Herbin, H., Clerbaux, C., Hurtmans, D., Wespes,
the Federal Ministry of Education and Research. The CLaMS activ-          C., Carleer, M., Turquety, S., Rinsland, C. P., Remedios, J.,
ities contribute to the DFG project AMOS (HALO-SPP 1294/VO                Hauglustaine, D., Boone, C. D., and Bernath, P. F.: ACE-FTS
1276/5-1) funded by the German Research Foundation (Deutsche              observation of a young biomass burning plume: first reported
Forschungsgemeinschaft, DFG). The authors gratefully acknowl-             measurements of C2 H4 , C3 H6 O, H2 CO and PAN by infrared

Atmos. Chem. Phys., 21, 8213–8232, 2021                                                    https://doi.org/10.5194/acp-21-8213-2021
You can also read


