African volcanic emissions influencing atmospheric aerosols over the Amazon rain forest
←
→
Page content transcription
If your browser does not render page correctly, please read the page content below
Atmos. Chem. Phys., 18, 10391–10405, 2018
https://doi.org/10.5194/acp-18-10391-2018
© Author(s) 2018. This work is distributed under
the Creative Commons Attribution 4.0 License.

African volcanic emissions influencing atmospheric aerosols over
the Amazon rain forest
Jorge Saturno1 , Florian Ditas1 , Marloes Penning de Vries1 , Bruna A. Holanda1 , Mira L. Pöhlker1 ,
Samara Carbone2,3 , David Walter1 , Nicole Bobrowski4,1 , Joel Brito2,5 , Xuguang Chi6 , Alexandra Gutmann7 ,
Isabella Hrabe de Angelis1 , Luiz A. T. Machado8 , Daniel Moran-Zuloaga1 , Julian Rüdiger9 , Johannes Schneider1 ,
Christiane Schulz1 , Qiaoqiao Wang10 , Manfred Wendisch11 , Paulo Artaxo2 , Thomas Wagner1 , Ulrich Pöschl1 ,
Meinrat O. Andreae1,12 , and Christopher Pöhlker1
1 Biogeochemistry,   Multiphase Chemistry, and Particle Chemistry Departments, and Satellite Research Group,
Max Planck Institute for Chemistry, P.O. Box 3060, 55020 Mainz, Germany
2 Department of Applied Physics, Institute of Physics, University of São Paulo (USP), Rua do Matão,

Travessa R, 187, CEP 05508-900, São Paulo, SP, Brazil
3 Institute of Agrarian Sciences, Federal University of Uberlândia, Uberlândia, Minas Gerais, Brazil
4 Institute for Environmental Physics, University of Heidelberg, Heidelberg, Germany
5 Laboratory for Meteorological Physics, Université Clermont Auvergne, Clermont-Ferrand, France
6 Institute for Climate and Global Change Research & School of Atmospheric Sciences,

Nanjing University, Nanjing, 210093, China
7 Department of Chemistry, Johannes Gutenberg University, Mainz, Germany
8 Centro de Previsão de Tempo e Estudos Climáticos, Instituto Nacional de

Pesquisas Espaciais, Cachoeira Paulista, Brazil
9 Atmospheric Chemistry, University of Bayreuth, Dr.-Hans-Frisch-Straße 1–3, 95448 Bayreuth, Germany
10 Institute for Environmental and Climate Research, Jinan University, Guangzhou, 511443, China
11 Leipziger Institut für Meteorologie (LIM), Universität Leipzig, Stephanstr. 3, 04103 Leipzig, Germany
12 Scripps Institution of Oceanography, University of California San Diego, La Jolla, CA 92098, USA

Correspondence: Jorge Saturno (j.saturno@mpic.de) and Christopher Pöhlker (c.pohlker@mpic.de)

Received: 8 December 2017 – Discussion started: 15 December 2017
Revised: 13 June 2018 – Accepted: 22 June 2018 – Published: 23 July 2018

Abstract. The long-range transport (LRT) of trace gases           tions are used to investigate the volcanic event. Under the
and aerosol particles plays an important role for the com-        volcanic influence, hourly mean sulfate mass concentrations
position of the Amazonian rain forest atmosphere. Sulfate         in the submicron size range reached up to 3.6 µg m−3 at the
aerosols originate to a substantial extent from LRT sources       Amazon Tall Tower Observatory, the highest value ever re-
and play an important role in the Amazonian atmosphere as         ported in the Amazon region. The substantial sulfate injec-
strongly light-scattering particles and effective cloud conden-   tion increased the aerosol hygroscopicity with κ values up
sation nuclei. The transatlantic transport of volcanic sulfur     to 0.36, thus altering aerosol–cloud interactions over the rain
emissions from Africa has been considered as a source of          forest. Airborne measurements and satellite data indicate that
particulate sulfate in the Amazon; however, direct observa-       the transatlantic transport of volcanogenic aerosols occurred
tions have been lacking so far. This study provides obser-        in two major volcanic plumes with a sulfate-enhanced layer
vational evidence for the influence of emissions from the         between 4 and 5 km of altitude. This study demonstrates how
Nyamuragira–Nyiragongo volcanoes in Africa on Amazo-              African aerosol sources, such as volcanic sulfur emissions,
nian aerosol properties and atmospheric composition dur-          can substantially affect the aerosol cycling and atmospheric
ing September 2014. Comprehensive ground-based and air-           processes in Amazonia.
borne aerosol measurements together with satellite observa-

Published by Copernicus Publications on behalf of the European Geosciences Union.
10392                                   J. Saturno et al.: African volcanic emissions influencing aerosols over the Amazon

1   Introduction                                                  culminated in the formation of a lava lake in late 2014 (Bo-
                                                                  browski et al., 2017; Campion, 2014), led to 2 orders of mag-
Sulfate aerosol particles are produced in the atmosphere          nitude higher SO2 mass emissions from the Nyiragongo–
by the oxidation of sulfur dioxide (SO2 ) emitted by fossil       Nyamuragira complex compared to the 2014–2017 average
fuel (FF) combustion, volcanic emissions, and by the oxida-       (Barrière et al., 2017). The emissions from Nyamuragira in
tion of reduced sulfur compounds, such as DMS (Andreae            2014 have been estimated at ca. 2.3 Tg SO2 year−1 (Fioletov
and Rosenfeld, 2008). These particles scatter solar radia-        et al., 2016).
tion and act as efficient cloud condensation nuclei (CCN;            In the Amazon rain forest, biogenic sulfate aerosol is sus-
Stevens and Feingold, 2009). Anthropogenic SO2 emis-              tained by oceanic DMS emissions and to a lesser degree
sions have increased over the 20th century to a maximum           by hydrogen sulfide (H2 S), methanethiol (MeSH), and DMS
(120 Tg SO2 year−1 ) around the year 1980 and declined            emissions from soils and vegetation (Andreae and Andreae,
somewhat thereafter to around 100 Tg SO2 per year, but they       1988; Jardine et al., 2015; Martin et al., 2010). Occasional
are still the most important source of sulfur to the atmosphere   anthropogenic sulfur injections have been attributed to open
(Boucher et al., 2013; http://edgar.jrc.ec.europa.eu/overview.    biomass burning and fossil fuel combustion emissions either
php?v=431, last access: 6 September 2017). Volcanic emis-         from Brazil or, via LRT, from Africa (Andreae et al., 1990;
sions are the predominant natural source of SO2 and account       Talbot et al., 1988). Fossil fuel sources (e.g., ship traffic,
for about 5 % of total annual SO2 emissions (Textor et al.,       power plants) do not often influence aerosol particles mea-
2004; Yang et al., 2017). The emitted SO2 is oxidized in          sured in the remote Amazon forest (Saturno et al., 2017) but
the atmosphere to gaseous sulfuric acid, which is converted       can be important downwind of populated areas like Man-
to sulfate aerosol particles (Chin et al., 1996; Reiner and       aus, Brazil (Kuhn et al., 2010; Martin et al., 2016). Recent
Arnold, 1994). According to Chin and Jacob (1996), vol-           measurements during the South AMerican Biomass Burning
canic sulfur emissions can account for 20–40 % of sulfate         Analysis (SAMBBA) campaign, which focused on biomass
aerosol particle mass concentrations in the troposphere and       burning (BB) emissions, found no correlation between sul-
might therefore be able to substantially alter the atmospheric    fate aerosol and various kinds of BB aerosol particles (Brito
composition. Observational evidence of drastic changes hun-       et al., 2014). On the other hand, aircraft observations of haze
dreds of kilometers downwind of volcanic eruptions affect-        layers at 2–4 km of altitude over the Amazon rain forest have
ing physical and chemical aerosol properties can be found         shown high sulfate enrichment in comparison to the bound-
in Mather et al. (2003) and Robock (2000, 2007). Some ex-         ary layer and the free troposphere concentrations (Andreae
amples are the Pinatubo eruption in 1991 that reached the         et al., 1988). These haze layers have been linked to LRT of
stratosphere (> 10 km of height; Kirchner et al., 1999), the      aerosol particles from Africa (Holanda et al., 2018). A mod-
2014–2015 tropospheric effusive eruption of the Holuhraun         eled global sulfate source attribution study showed that peak
volcano in Iceland (Ilyinskaya et al., 2017), during which        sulfate concentrations in southern Africa occur between June
the emissions affected the cloud-drop effective radius (reff ),   and August. For this 3-month period, estimated emissions
while other cloud properties, like the cloud optical depth and    from combustion sources were 0.81 Tg S, decreasing in the
the cloud liquid water path, remained unaffected (Malavelle       following 3 months to 0.66 Tg S (Yang et al., 2017). Obser-
et al., 2017), and the eruptive SO2 emissions of the Cal-         vations in the Amazon rain forest have shown that sulfate and
buco volcano in Chile, which reached southern Africa af-          organic aerosol (OA) mass concentrations can increase up to
ter being transported over the Atlantic Ocean (Sangeetha          10 times from the wet to the dry season with a rather stable
et al., 2018). Moreover, a connection between tropical vol-       sulfate-to-OA mass ratio throughout the year (Andreae et al.,
canic explosive eruptions and El Niño-like events has been        2015; Fuzzi et al., 2007; Martin et al., 2010).
described recently (Khodri et al., 2017). Besides explosive–         Northeasterly and southeasterly trade winds (north and
effusive eruptions, small eruptions and passive degassing ac-     south of the intertropical convergence zone, ITCZ) are able
count for relatively stable SO2 fluxes (23.0 ± 2.3 Tg year−1 ,    to transport aerosols over large distances given the typically
2005–2015) and on average emit approximately 1 order of           weak wet deposition in this latitude band (Wang et al., 2016).
magnitude more SO2 compared to explosive eruptions (Carn          During the Amazonian dry season (August–November), the
et al., 2017). To what extent volcanic passive sulfur emis-       transport of African smoke from southern Africa savanna and
sions can affect cloud properties is still debated (Ebmeier et    shrubland fires is an important source of aerosol in addition
al., 2014; Malavelle et al., 2017).                               to regional emissions (Andreae et al., 1994). Even though
   There are several active volcanoes in Africa. The              the potential impact of the transatlantic transport of African
Nyamuragira–Nyiragongo neighboring volcanoes in the               sulfur emissions has been suggested before based on trans-
Democratic Republic of the Congo (DRC) were among the             port models (Yang et al., 2017), no ground-based evidence
strongest passively degassing volcanoes worldwide between         has been reported previously in the literature concerning the
2004 and 2014, with around 150 days of satellite-detected         impact of African volcanic sources.
degassing in 2014 (Carn et al., 2016). The strong passive de-        To analyze a major degassing period of the Nyamuragira
gassing activity of Nyamuragira, which started in 2011 and        in September 2014 and the subsequent transatlantic trans-

Atmos. Chem. Phys., 18, 10391–10405, 2018                                         www.atmos-chem-phys.net/18/10391/2018/
J. Saturno et al.: African volcanic emissions influencing aerosols over the Amazon 10393 port of the volcanic plume, this paper combines satellite and backward trajectory data with measurements at the Amazon Tall Tower Observatory as well as during the ACRIDICON- CHUVA aircraft campaign in the Amazon Basin. This com- prehensive data set indicates that the African volcanic SO2 emissions were oxidized to particulate sulfate, which reached the central Amazon rain forest and influenced aerosol physi- cal and chemical properties significantly. 2 Data and methods 2.1 Ground-based instrumentation The ground-based aerosol data presented here were col- lected at the Amazon Tall Tower Observatory (ATTO) site (called T0a in the GoAmazon2014/5 experiment; Martin et al., 2016) located in the Uatumã Sustainable Development Figure 1. ATTO site and Nyamuragira volcano locations. Reserve, Amazonas, Brazil. Details about the ATTO site in- frastructure, instrumentation, and an overview of running measurements can be found in Andreae et al. (2015). Figure 1 aerosol particles, ω0 , at this wavelength, which is de- shows the ATTO site location and the location of the Nya- fined as the ratio of scattering to extinction coefficients muragira volcano in the DRC (1.41◦ S, 29.2◦ E; 3058 m a.s.l). (extinction = scattering + absorption). Strong BB- and FF- The long-term measurements at ATTO started in 2012. A influenced observations were defined as periods when MBCe systematic backward trajectory (BT) analysis of air masses exceeded the 75th percentile (0.27 µg m−3 ) and the absorp- arriving at ATTO can be found in C. Pöhlker et al. (2018). tion wavelength dependence was above or within the BC- The ATTO aerosol measurements were taken on a triangu- only regime, respectively. A detailed discussion on the ab- lar mast (02◦ 08.6020 S, 59◦ 00.0330 W; 130 m above sea level, sorption wavelength dependence can be found in Saturno et a.s.l.) using a 25 mm diameter, 60 m high, stainless steel tube al. (2017). with a laminar sampling flow rate of 30 L min−1 . The in- An aerosol chemical speciation monitor (ACSM; Aero- struments were installed inside an air-conditioned container dyne Research Inc., Billerica, USA) was used to measure on- where the temperature was kept between 29 and 31 ◦ C. All line non-refractory aerosol chemical composition (Carbone aerosol data were aggregated to hourly mean values. More et al., 2018). These measurements started in February 2014 at details on the aerosol sampling setup can be found elsewhere the ATTO site. The technique resolves the submicron aerosol (Moran-Zuloaga et al., 2017; Pöhlker et al., 2016; Saturno et chemical species in the following categories: organics, sul- al., 2017). fate, nitrate, ammonium, and chloride (Ng et al., 2011). In Equivalent black carbon (BCe ) mass concentrations, this study, we only use organics and sulfate mass concentra- MBCe , were calculated from absorption measurements by tion data, Morg and Msulfate , respectively. a multi-angle absorption photometer (MAAP; model 5012; Cloud condensation nuclei (CCN) number concentrations, Thermo Electron Group, Waltham, USA). The details of the NCCN , were measured with a CCN counter (CCNC; model instrument are described elsewhere (Petzold and Schönlin- CCN-100; Droplet Measurement Technologies, Longmont, ner, 2004). The BC mass absorption cross section (MAC) USA), which was deployed at the ATTO site starting in was retrieved from fitting MAAP absorption coefficients March 2014. The instrument scanned over a range of differ- at 637 nm wavelength and refractory black carbon (rBC) ent supersaturations and particle diameters; more details can mass concentrations were measured by using a single- be found elsewhere (Pöhlker et al., 2016). The hygroscopic- particle soot photometer (SP2) revision D (Droplet Mea- ity parameter, κ, retrieved for a CCN activation ratio of 50 % surement Technologies, Longmont, USA). Details of the is used in this study. Condensation nuclei number concen- technique can be found in Stephens et al. (2003). The trations (> 5 nm), NCN , were measured with a condensation MAC calculations are described in Saturno et al. (2017). particle counter (CPC; model 5412; Grimm Aerosol Technik, Light-scattering coefficients were measured using a three- Germany). wavelength integrating nephelometer (Aurora 3000; Ecotech Pty Ltd., Knoxfield, Australia). For details of the instru- 2.2 Airborne in situ measurements ment, see Müller et al. (2011). Absorption and inter- polated scattering measurements at a 637 nm wavelength Chemical species of submicron aerosol particles were mea- were used to calculate the single scattering albedo of dry sured using a compact time-of-flight aerosol mass spec- www.atmos-chem-phys.net/18/10391/2018/ Atmos. Chem. Phys., 18, 10391–10405, 2018
10394                                    J. Saturno et al.: African volcanic emissions influencing aerosols over the Amazon

trometer (C-ToF-AMS) installed onboard the German High-            els (Van Hoek and Claas, 2010). The row anomaly strongly
Altitude and Long Range Research Aircraft (HALO; http:             affects the reliability of observations; therefore all affected
//www.halo.dlr.de, last access: 13 September 2017), a mod-         pixels were removed from the data set prior to analysis.
ified business jet G550 (Gulfstream, Savannah, USA). The              The OMI SO2 vertical column density (VCD) data pre-
C-ToF-MS details are presented in Drewnick et al. (2005)           sented in this paper were retrieved using the NASA principal-
and Schulz et al. (2018). A single-particle soot photome-          component-based algorithm with an a priori vertical profile
ter (SP2; Droplet Measurement Technologies, Longmont,              representative of a volcanic plume in the middle troposphere
USA) was used to measure rBC mass concentration. The               (TRM; Li et al., 2013, 2017). The assumption that the vol-
measurements took place between 6 September and 1 Oc-              canic plume is located in the mid-troposphere is justified by
tober 2014 during the “Aerosol, Cloud, Precipitation, and          the elevation of the volcano (3058 m), the strength of the
Radiation Interactions and Dynamics of Convective Cloud            eruption, and, particularly, the HYSPLIT trajectory analysis
Systems” (ACRIDICON) – “Cloud Processes of the Main                presented later in this paper. It is, however, important to note
Precipitation Systems in Brazil: A Contribution to Cloud           that the sensitivity of the satellite measurements depends sys-
Resolving Modeling and to the GPM (Global Precipitation            tematically on plume altitude. Thus, the absolute values of
Measurement)” (CHUVA) campaign over the Amazon rain                the SO2 VCD derived from the satellite observations over-
forest (Machado et al., 2014). More details on the flight tra-     estimate or underestimate the true values if the plume is lo-
jectories and instrumentation can be found in Wendisch et          cated at a higher or lower altitude, respectively. Fortunately,
al. (2016). In this study, only data up to 7 km of altitude have   this does not influence our study, as the focus of this pa-
been used.                                                         per is on the spatial pattern of the SO2 plumes and not on
                                                                   the SO2 amount. The level-2 data were downloaded from
2.3   Air mass trajectories                                        https://mirador.gsfc.nasa.gov/ (last access: 27 October 2017)
                                                                   and gridded to a regular 0.1◦ × 0.1◦ grid for easily handling.
To investigate the probability of the volcanic sulfate plume
reaching the ATTO site, trajectories were calculated us-
ing the National Oceanic and Atmospheric Administration            3   Results and discussion
(NOAA) hybrid single-particle Lagrangian integrated tra-
jectory HYSPLIT model (Draxler and Hess, 1997, 1998;               The Amazonian dry season (August–November) Msulfate
Stein et al., 2015). NOAA Global Data Assimilation System          hourly mean median over 3 years of measurements at
(GDAS; Kleist et al., 2009) data at 1◦ × 1◦ resolution were        the ATTO site was 0.60 µg m−3 (0.41–0.79, interquartile
used as meteorological input for HYSPLIT.                          range, IQR) as shown in Fig. 2a. This value slightly in-
                                                                   creased under the influence of BB (median: 0.83 µg m−3 )
2.4   Satellite SO2 vertical column density data                   and did not change significantly during FF combustion in-
                                                                   fluence (median: 0.56 µg m−3 ). During African dust advec-
As one of the most abundant gases in a volcanic plume, SO2         tion periods when mineral dust particles are usually mixed
is often used as a tracer for volcanic emissions by a variety of   with BB emissions and sea-salt aerosol particles, Moran-
spectroscopic remote sensing techniques. The strong charac-        Zuloaga et al. (2017) measured sulfate mass concentra-
teristic absorption features in the UV spectral range allow for    tions of ∼ 0.44 µg m−3 using energy-dispersive X-ray anal-
the quantification of SO2 using differential optical absorp-       ysis and M. L. Pöhlker et al. (2018) reported a Msulfate
tion spectroscopy (DOAS; see, e.g., Platt and Stutz, 2008 and      of ∼ 0.25 ± 0.19 µg m−3 measured by ACSM; both studies
Richter and Wagner, 2011) both from the ground (e.g., Bo-          were conducted at the ATTO site. All these values and also
browski and Platt, 2007; Galle et al., 2003) and from space        measurements over the South Atlantic Ocean (Huang et al.,
(e.g., Eisinger and Burrows, 1998; Khokhar et al., 2005 and        2018) were well below the Msulfate median values measured
Krueger, 1985).                                                    at ATTO between 21 and 30 September 2014 (1.60 µg m−3 ;
   The ozone monitoring instrument (OMI) onboard the Na-           see Fig. 2a). Note that the Msulfate median corresponding to
tional Aeronautics and Space Administration (NASA) Aura            21–30 September 2014 is higher than 99.3 % of the data
satellite, launched in 2004, detects backscattered solar radi-     measured during the dry seasons and the FF combustion-
ation in the UV–Vis range (Levelt et al., 2006). The polar-        influenced periods, and it is higher than at least 75 % of the
orbiting instrument crosses the Equator at 13:30 LT (local         data measured in the BB-influenced periods. Regarding the
time). DOAS analysis of OMI spectra yields column den-             single scattering albedo, ω0, 637 , shown in Fig. 2b, the lowest
sities of trace gases such as NO2 , SO2 , and HCHO with a          average was observed during FF-influenced periods, indicat-
spatial resolution of about 13 × 24 km2 away from the swath        ing the presence of dark aerosol particles rich in BC, which
edges. The OMI wide swath of 2600 km allowed for daily             contrasts with the higher ω0, 637 observed in September 2014.
global coverage until the first occurrence of the so-called row    As can be seen in Fig. 2, the ATTO observations between
anomaly in June 2007, an instrumental problem that causes          21 and 30 September 2014 are remarkably different from
grievous radiance errors in up to half of the OMI ground pix-      strong BB-influenced and FF combustion-influenced peri-

Atmos. Chem. Phys., 18, 10391–10405, 2018                                          www.atmos-chem-phys.net/18/10391/2018/
J. Saturno et al.: African volcanic emissions influencing aerosols over the Amazon 10395
culated (Fig. 3b) corresponds to approximately 200 000 km2
around the volcanoes. Nyamuragira produced frequent in-
tensive SO2 emission events in 2014 with a mean emission
of 14.4 × 10⁶ kg SO2 day−1 (Barrière et al., 2017). Multi-
year OMI SO2 VCD daily averages from 11◦ S to 17◦ N are
summarized in Fig. S1 in the Supplement as a function of
time and longitude. The figure shows observations during
the ATTO measurement period (March 2012 to July 2017)
and a snapshot of September 2014. According to Barrière
et al. (2017), the emissions from June to October 2014 were
mostly due to lava fountaining activity in Nyamuragira, char-
acterized by strong tremors. The high emission activity of
Nyamuragira at the end of 2014 was also observed by in situ
measurements from November 2014 to October 2015, when
SO2 emission fluxes reached up to 12.7 × 10⁶ kg day−1 (Bo-
browski et al., 2017). These emissions were often transported
westward, as can be observed in HYSPLIT forward trajecto-
ries calculated for 2014 (Fig. S2).
Fortunately, during the high emission period mentioned
above, specifically in September–October 2014, ground and
airborne measurement campaigns took place in the Amazon
Basin (Andreae et al., 2015; Wendisch et al., 2016; Martin
et al., 2017). Satellite SO2 VCD observations over central
Africa and the Atlantic Ocean were examined during this
Figure 2. Box and whisker plots of hourly mean (a) sulfate period in order to precisely identify the plume trajectory. A
mass concentration, Msulfate , and (b) single scattering albedo at map of gridded OMI SO2 TRM VCD observations from 7 to
637 nm, ω0, 637 , during different periods and conditions including 17 September 2014 is available as a Supplement (Fig. S3).
the dry season average 2014–2016, biomass burning and fossil fuel
Two emission events were observed at the Nyamuragira lo-
combustion-influenced conditions, and the period of interest from
cation, one on 7 September and another on 12 September.
21 to 30 September 2014. The white segment inside the box repre-
sents the median. The lower and upper box edges represent the first The latter exhibits a clear westward transport of the SO2
and the third quartiles, respectively. The whiskers represent the low- plume starting from 13 to 17 September. Figure 4 shows
est and highest observations within the 99.3 % confidence interval. SO2 VCD observations during this period within the re-
gion between 20◦ W–30◦ E and 15◦ S–5◦ N with SO2 VCD
larger than 2.5 × 10¹⁴ molecules cm−2 . Several sets of trajec-
ods in terms of Msulfate and ω0, 637 . Given this, the elevated tory calculations were performed. First, three to seven start-
Msulfate observed in September 2014 could not be explained ing locations were selected within the SO2 plumes detected
by combustion sources. Therefore, the possibility of an addi- by OMI on 12–17 September 2014. At each location, 15-
tional sulfate source, like volcanogenic sulfate aerosol, was day (360 h) forward trajectories were started at the time of
considered. In the following section, satellite data and an air the satellite overpass (11:00–14:00 UTC) at seven altitudes
mass trajectory analysis are used to study the possibility of a spaced equally between 1 and 7 km. The resulting trajecto-
volcanic plume reaching the Amazon rain forest during the ries initialized at 4 km of altitude on 13 September are in best
period of interest. The last two sections are dedicated to a dis- agreement with the satellite data and are shown in Fig. 4. All
cussion of the aerosol physicochemical properties measured starting parameters were systematically varied and very con-
by aircraft and ground-based instruments. sistent patterns were found (see Fig. S4). The trajectories are
superimposed on the map presenting all SO2 plumes detected
3.1 Satellite measurements and trajectory analysis of by OMI between 12 and 17 September. Trajectories started
the volcanic plume within the leading edge of the plume are in good agreement
with the OMI data, as after 24 h (second marker) both trajec-
Given that the Nyamuragira and Nyiragongo volcanoes are tories are located within the plume detected on 14 Septem-
so close to each other (within ∼ 15 km), their emissions ber, and after 48 h (third marker) both trajectories are located
detected by remote sensors are often treated as a paired within the plume detected on 15 September.
source (Carn et al., 2017). Hereafter, the term “Nyamura- This approach of using the OMI data to evaluate the tra-
gira” refers to the couple Nyamuragira–Nyiragongo in this jectories was used also with the purpose of minimizing un-
text. Time series of area-averaged OMI SO2 observations certainties by calculating shorter trajectories instead of ini-
are shown in Fig. 3a. The area where the average was cal- tializing them from the volcano location. It should be noted
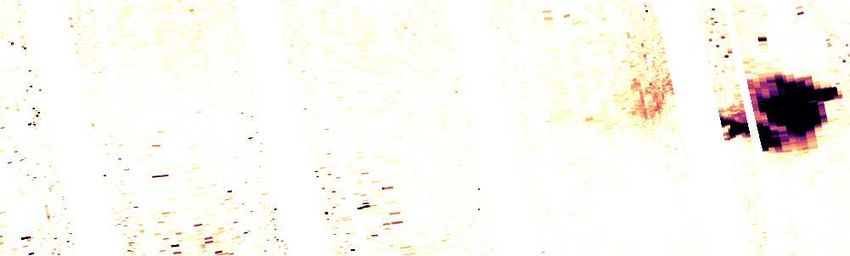
www.atmos-chem-phys.net/18/10391/2018/ Atmos. Chem. Phys., 18, 10391–10405, 201810396 J. Saturno et al.: African volcanic emissions influencing aerosols over the Amazon Figure 3. (a) Time series of daily-averaged OMI SO2 TRM VCD observations corresponding to the averages over the area delimited by 27.2◦ E, 3.4◦ S, 31.2◦ E, and 0.6◦ N. (b) Map of eastern Africa showing the averaging area (orange square). The location of Nyamuragira is represented by a black triangle. Figure 4. Map of SO2 plumes with VCD > 2.5 × 10¹⁴ molecules cm−2 color-coded by date of observation. The 15-day forward trajectories started at 4 km (above mean sea level, a.m.s.l.) at four locations within the plume detected on 13 September 2014 (light blue) are indicated by black lines with markers at 24 h intervals. here that the trajectory calculations by HYSPLIT yield a This discrepancy may be due to inaccuracy in the individ- line that can be understood as the center line of a propa- ual trajectories, or the SO2 plumes might have been be- gating plume that widens both by stochastic uncertainty in low the OMI detection limit. The southernmost trajecto- the model calculations and by dispersive processes in the at- ries reach South America and come within several hun- mosphere. Consequently, the location of the plume becomes dred kilometers of ATTO within 15 days, which is well more uncertain the longer the model is run, and the physical within the HYSPLIT uncertainty estimated at 15–30 % size of the plume increases as well. Given the 9000 km dis- of the trajectory length (https://www.arl.noaa.gov/hysplit/ tance between the volcanoes and ATTO, the uncertainty in hysplit-frequently-asked-questions-faqs/faq-hg11/, last ac- the calculated plume trajectory position would become very cess: 19 March 2018). One trajectory reached the direct large. To mitigate this problem, we use a multistep approach vicinity of ATTO on 25 September at 1.8 km of altitude, in which we follow the emissions using the satellite-observed whereas another trajectory passed an area south of ATTO at locations of the SO2 plume for the initial days and then cal- an altitude of 1.5 km on 24 September. As discussed above, culate forward trajectories from the observed location of the the locations along the trajectory should be interpreted as the plume. centers of a plume, which had dispersed both vertically and The two southernmost trajectories in Fig. 4 make a sharp horizontally. This dispersion is not considered in the trajec- turn after 15 September, which is in agreement with the ob- tory mode of HYSPLIT (Stein et al., 2015), but of course served pattern, although there is no longer an exact match takes place in reality by turbulent and convective processes. with the respective OMI observations (in red and maroon). Consequently, a trajectory “parcel” moving at 1.8 km of alti- Atmos. Chem. Phys., 18, 10391–10405, 2018 www.atmos-chem-phys.net/18/10391/2018/
J. Saturno et al.: African volcanic emissions influencing aerosols over the Amazon                                                 10397

Figure 5. Density of 15-day backward trajectories started from ATTO at an altitude of 300 m a.m.s.l. every hour starting at 00:00 UTC on
20 September 2014 to 23:00 UTC on 30 September 2014.

tude will certainly be dispersed to the surface in the highly
convective Amazonian lower troposphere (Andreae et al.,
1988).
   In addition to the plume forward trajectory analysis, back-
ward trajectories initiated at the ATTO site at an altitude of
300 m (approximately 170 m aboveground) were calculated
for 360 h. These trajectories were initiated every hour from
20 September 00:00 UTC to 30 September 23:00 UTC. The
results, presented as a trajectory density plot in Fig. 5, in-
dicate that during this time period essentially all air masses
come from southern Africa and a significant number of tra-
jectories passes the area west of the volcano (e.g., 0–10◦ E,
0–10◦ S), where the volcanic plume was detected.

3.2   Airborne aerosol observations

Enhanced sulfate aerosol mass concentrations were observed
above 3 km of altitude over the Amazon Basin during the
ACRIDICON-CHUVA campaign, which were substantially
greater than the concentrations measured at lower altitudes
for some flights. A map including all airborne observa-
tions on the different flights can be found in the Supple-
ment (Fig. S5). However, given the multiple sulfate aerosol
sources, sulfate itself cannot be used as a tracer of vol-
canic emissions. In order to distinguish the volcanogenic sul-        Figure 6. Sulfate layer observations over the Amazon rain forest.
fate from other aerosol sources like BB, which is impor-              The figure shows the Msulfate vertical profile observed during flight
tant during this time of the year, we examined the Msulfate           AC14 (21 September 2014). Color-coded sulfate-to-OA values are
vertical profiles together with their sulfate-to-OA mass ratio        truncated at a maximum of 6.
(Msulfate /Morg ). A list of the ACRIDICON-CHUVA flights
and Msulfate vertical profiles are presented as Supplement Ta-
ble S1 and Fig. S6, respectively.                                     on 27 September 2014. The average Msulfate observed dur-
   From the different airborne observations, the elevated             ing flight AC14 was 1.1 ± 0.5 µg m−3 between 3 and 6 km
plumes observed on flights AC14 (21 September 2014)                   of height. This sulfate-enhanced layer exhibits the highest
and AC17 (27 September 2014) exhibited median sulfate-                sulfate-to-OA ratio and can be distinguished from lower lay-
to-OA mass ratios larger than 1.0, indicating strong vol-             ers below 3 km of height, which are characteristically rich in
canogenic influence. The Msulfate vertical profile measured           OA due to BB and biogenic emissions. Usually, BB aerosol
on 21 September 2014 (AC14) is presented in Fig. 6. The               particles have been shown to have higher OA mass con-
observations show a sulfate-enhanced layer between 4 and              centrations than other aerosol particles (McNaughton et al.,
5 km of height, which was also observed during flight AC17            2011; Saturno et al., 2017). The concentrations of rBC in the

www.atmos-chem-phys.net/18/10391/2018/                                               Atmos. Chem. Phys., 18, 10391–10405, 2018
10398                                       J. Saturno et al.: African volcanic emissions influencing aerosols over the Amazon

Figure 7. Map of gridded OMI SO2 VCD observed on 12 September 2014. Two plumes are shown on the map; the first one emitted on
7 September 2014 and the second one emitted on 12 September 2014. The 15-day backward trajectories initialized at several points along
the track of flight AC14 (21 September 2014) at flight altitude are shown as continuous lines with dots. Trajectories starting at points where
sulfate-to-OA ratios > 1 are shown in color (see Table 1 for details), and all other trajectories are shown in gray; dots are placed at 24 h
intervals. The path of flight AC14 is marked in pink, with stars denoting the starting points of the backward trajectories. The locations of the
ATTO site and Nyamuragira are marked with a pink circle and a triangle, respectively.

Table 1. Measurements at points along the track of flight AC14 (21 September 2014) selected as starting points for backward trajectories
presented in Fig. 7. Data points with a sulfate-to-OA ratio > 1 are emphasized by bold font.

      Time (UTC)      Latitude (◦ N)    Longitude (◦ E)    Altitude (km)      Msulfate (µg m−3 )   Sulfate-to-OA ratio    Color in Fig. 7
      15:14                   −2.75             −60.34               1.61                   1.2                     0.5   Gray
      16:19                   −3.19             −60.21               4.50                   1.0                     1.1   Blue
      16:36                   −4.00             −59.50               4.50                   3.0                     2.9   Green
      16:54                   −5.20             −59.25               4.49                   3.1                     7.8   Red
      17:11                   −6.45             −58.98               6.45                   0.6                     0.8   Gray
      17:46                   −4.52             −59.40               6.43                   0.5                     0.8   Gray
      19:40                   −4.44             −59.41               7.68                   1.2                     1.0   Gray
      21:41                   −3.79             −59.55               4.79                   1.8                     2.2   Light blue
      21:59                   −3.04             −60.20               0.90                   1.2                     0.3   Gray

region between 4 and 5 km were also very low (9 ng m−3 )                    AC17 a similar pattern is observed, with three out of four
compared to the values below 3 km of altitude (270 ng m−3 ;                 (colored) trajectories started within the sulfate plume origi-
Holanda et al., 2018), ruling out a combustion source for the               nating from central Africa and half of the other trajectories
sulfate. In light of all the observations (i.e., enhanced sul-              clearly coming from regions more to the south (see Fig. S7
fate layer above 4 km of height, high sulfate-to-OA ratio,                  and Table S2).
very low rBC mass concentration) the most plausible expla-                     Figures 4, 5, and 7 show that the trajectories agree well but
nation for the source of this sulfate plume is the LRT of vol-              not perfectly with the ground-based, airborne, and satellite
canogenic aerosols.                                                         measurements, which is mainly caused by the uncertainty of
   Backward trajectories were calculated from several points                such long trajectories. Nevertheless, the fact that forward and
along the flight paths. Figure 7 shows backward trajecto-                   backward trajectories calculated from various starting points
ries started at nine points along the AC14 (21 September                    and times agree on the sulfate source is a further indication
2014) flight track for which sulfate-to-OA ratios larger (col-              that the sulfate plumes observed at and near ATTO originate
ored lines) or smaller than 1 (gray lines) were detected; the               from the Nyamuragira volcano. Combined with the westward
flight and aerosol data measured at each point are presented                transport pattern derived from SO2 satellite data and the lack
in Table 1. Figure 7 clearly shows that the colored trajecto-               of an alternative strong sulfate source, this makes quite a con-
ries, with one exception, initialized within the sulfate plume              vincing case.
originate from central Africa, whereas the gray trajectories,
started outside of the sulfate plume, appear to originate from              3.3   Ground-based aerosol observations
South America or from more southern regions over or across
the Atlantic Ocean. The air mass trajectory analysis supports               The arrival of African volcanic emissions over the Amazon
our hypothesis that the AC14 observations were likely the                   rain forest is reflected in the aerosol physical and chem-
result of probing the volcanic plume emitted on 7 Septem-                   ical properties measured at the ATTO site. The most ev-
ber, the first one detected by OMI (see Fig. S3). For flight                ident effect was the significant increase in Msulfate . The

Atmos. Chem. Phys., 18, 10391–10405, 2018                                                   www.atmos-chem-phys.net/18/10391/2018/
J. Saturno et al.: African volcanic emissions influencing aerosols over the Amazon 10399
90th percentile of Msulfate measured at the ATTO site dur-
ing the dry season 2014 was used as a threshold to define
the volcanic influence event (Nya2014) as the time when
this threshold was exceeded. By this criterion, the Nya2014
event spanned from 21 September 2014 at 02:00 UTC to
1 October 2014 at 01:00 UTC. Figure 8 shows different
aerosol parameters measured before, during, and after the
Nya2014 event. The NCN , shown in Fig. 8a, did not vary
greatly from the values typical of the season (Pöhlker et
al., 2016). The average NCN during the dry season in
2014 was (1.3 ± 0.6) × 103 particles cm−3 , whereas during
the Nya2014 event, there were three peaks lasting for a
few hours with particle number concentrations higher than
3000 particles cm−3 on 27, 29, and 30 September 2014,
likely related to BB plumes (details in M. L. Pöhlker et
al., 2018).
On the other hand, during the Nya2014 period, Msulfate av-
eraged 1.7 ± 0.6 µg m−3 , which was significantly above the
dry season 2014 average of 0.7 ± 0.3 µg m−3 ; see Fig. 8b.
The highest Msulfate value observed at the ATTO site was
3.6 µg m−3 (hourly mean) on 26 September 2014. For com-
parison, during the SAMBBA campaign in southern Ama-
zonia, Msulfate barely exceeded 1.0 µg m−3 despite organics
nearly reaching 100 µg m−3 , MBCe of 5 µg m−3 , and NCN
above 25 × 103 particles cm−3 during the peak of biomass
burning (Brito et al., 2014). A long-term measurement study
also conducted in southern Amazonia reported Msulfate of
1.1 ± 0.7 µg m−3 during the dry season, with a maximum
of 3.3 µg m−3 for aerosol particles with diameters smaller
than 2 µm (Artaxo et al., 2002). It is important to note that
the observations by Artaxo et al. (2002) were made under
strong BB influence with average elemental carbon (EC)
mass concentrations, MEC , of 3.8 ± 4.2 µg m−3 , with a max-
imum of 25 µg m−3 . In contrast, the BCe measurements at
the ATTO site during the Nya2014 event had an average of
0.4 ± 0.1 µg m−3 , with a maximum of 0.8 µg m−3 , indicating
that the BB influence was relatively weak during the period
of interest, with some short (a few hours) spikes due to the
influence of nearby fire events; see Fig. 8b. At a sampling
site impacted by Manaus emissions, the submicron Msulfate
was about 0.2 µg m−3 during the wet season, rarely exceed-
ing 0.6 µg m−3 (de Sá et al., 2017). Therefore, even con-
sidering a range of pollution sources, our measurements at
ATTO during the Nya2014 event are the highest submicron Figure 8. Different aerosol properties measured during the
sulfate concentration ever reported in the Amazon Basin; Nya2014 event (gray shaded area). These time series include
see Martin et al. (2010) for a summary of wet and dry sea- ATTO hourly means of (a) aerosol particle number concentration,
son aerosol observations. For comparison, the ACRIDICON- NCN , (b) sulfate and BCe mass concentration, (c) sulfate-to-OA
CHUVA airborne measurements are also included in Fig. 8b. mass ratio with color-coded aerosol particle single scattering albedo
The Msulfate measured on flight AC14 was significantly en- at a 637 nm wavelength, and (d) hygroscopicity parameter, κ, at
original time resolution with color-coded particle activation diame-
hanced between 3 and 6 km of altitude, reaching a median of
ter. Dry season averages are shown as dashed lines. ACRIDICON-
1.0 µg m−3 and a 75th percentile of 1.6 µg m−3 . Previous air-
CHUVA flight medians and interquartile ranges from 3 to 6 km of
craft measurements during the SAMBBA campaign reported altitude are shown in (b) and (c).
a Msulfate flight average of 0.48 µg m−3 (Allan et al., 2014).
The increased Msulfate period was accompanied by an en-
hanced sulfate-to-OA mass ratio according to the ATTO ob-
www.atmos-chem-phys.net/18/10391/2018/ Atmos. Chem. Phys., 18, 10391–10405, 201810400 J. Saturno et al.: African volcanic emissions influencing aerosols over the Amazon
servations (Fig. 8c). The Nya2014 sulfate-to-OA average ACRIDICON-CHUVA campaign probed a sulfate-enhanced
over about 10 days was 0.38 ± 0.09, significantly higher layer between 4 and 5 km of height on 21 September 2014.
than the dry season average of 0.18 ± 0.15. During some Additionally, this layer exhibited very low rBC concentra-
BB pulses, decreased sulfate-to-OA ratios were observed, but tions and an increased sulfate-to-OA mass ratio with medi-
the whole Nya2014 period was exceptionally high compared ans higher than 1 for measurements between 3 and 6 km of
to typical dry season conditions. The sulfate-to-OA values height.
measured at ground level were usually lower than the air- The ground-based Msulfate measured at the ATTO site
borne values observed between 3 and 6 km of height because reached hourly mean levels up to 3.6 µg m−3 on 26 Septem-
the OA sources (BB and biogenic emissions) are located at ber 2014, the highest values ever reported in the Amazon
ground level and the LRT sulfate that arrives at higher alti- Basin. The sulfate-to-OA mass ratio increased from a dry
tudes is diluted upon vertical mixing. The possibility of FF season average of 0.18 ± 0.15 to an average of 0.38 ± 0.09
burning was ruled out as an important sulfur source during upon volcanic influence, which spanned about 10 days. In-
the event discussed here because of the particularly high dry creased sulfate-to-OA ratios and single scattering albedo
aerosol ω0 measured during the event (0.89 ± 0.04), as can (ω0 ) suggest a rather low influence of BB and FF sources. In
be observed in the color-coded data in Fig. 8c. Usually, FF terms of aerosol hygroscopicity, the values of κ (for 0.10 %
emissions rich in BC present characteristically low ω0 (0.2– supersaturation) measured during the volcanic event reached
0.3; Bond and Bergstrom, 2006) and its addition would have an average of 0.26 ± 0.04 (and a maximum of 0.36), the high-
lowered the value of ω0 . Instead, an increase in ω0 was ob- est levels observed under dry season conditions (average of
served to values higher than 0.90 during the period of maxi- 0.21 ± 0.03).
mum Msulfate (26–27 September 2014). The evidence presented here shows one particular event of
The effects of the volcanic sulfur plume on aerosol hygro- volcanic SO2 emissions in Africa influencing aerosol particle
scopicity were explored by analyzing the κ values measured chemical composition, hygroscopicity, and optical properties
at different supersaturations. Higher κ values were measured in the Amazon Basin. Therefore, our study indicates that
for the accumulation-mode aerosol (particles with a diame- these emissions and their transatlantic transport could po-
ter greater than 100 nm; Fig. 8d; note the color-coded parti- tentially affect Amazonian cloud microphysical properties.
cle activation diameter, Da ). During the Nya2014 event, the However, the extent and relevance of the episodic volcanic
κ values increased significantly, especially when the maxi- influence on the Amazonian atmosphere would require more
mum Msulfate was observed. For example, the average κ for a extensive studies. Beyond the effects and implications of this
supersaturation of 0.10 % (Da = 167–179 nm, 25th and 75th particular event, the results of our study represent a reference
percentile, respectively) was 0.26 ± 0.04 during the Nya2014 case of the dynamics and conditions of transatlantic aerosol
event, with a maximum of 0.36. Similarly, the particle hygro- transport from southern Africa to South America. This could
scopicity was also increased at Jungfraujoch (Switzerland) help us to understand the intercontinental advection of other
under the influence of the Eyjafjallajökull volcanic emissions aerosol species, such as combustion aerosol particles that are
in 2010 (Bukowiecki et al., 2011). In that case the Aitken- more difficult to trace.
mode particles (10 to 50 nm diameter) were more strongly
affected than the accumulation-mode particles because of the
shorter aging period of the sulfate particles. The Nya2014 Data availability. The data presented in this paper can be ac-
κ average was slightly higher than the 2014 dry season av- cessed via e-mail request to Jorge Saturno (j.saturno@mpic.de) or
erage of 0.21 ± 0.03 for 0.10 % supersaturation (excluding Christopher Pöhlker (c.pohlker@mpic.de). OMI data are available
the volcanic event) and significantly higher than a strong online at https://doi.org/10.5067/Aura/OMI/DATA2022 (Li et al.,
2006).
BB event average of 0.18 ± 0.01 for 0.10 % supersaturation,
whose high OA content (sulfate-to-OA ratio < 0.04) caused a
significant drop in κ (M. L. Pöhlker et al., 2018).
The Supplement related to this article is available
4 Summary and conclusions online at https://doi.org/10.5194/acp-18-10391-2018-
supplement.
Satellite SO2 observations showed two explosive events at
the Nyamuragira volcano on 7 and 12 September 2014.
These emissions were observed to be transported far over the
Author contributions. JSa, FD, MPdV, BAH, MLP, DW, LATM,
South Atlantic Ocean. Modeled air mass trajectories, start- JSc, CS, MW, PA, TW, UP, MOA, and CP designed the research.
ing at the satellite-observed plume locations, showed that JSa, FD, MPdV, BAH, MLP, SC, DW, JB, XC, IHdA, DMZ, JSc,
the plume was transported towards South America, eventu- CS, TW, MOA, and CP performed the measurements and/or con-
ally reaching the region of the Amazon Tall Tower Observa- tributed to the data analysis. All authors contributed to the discus-
tory in central Amazonia. Airborne observations during the sion and interpretation of the results and writing the paper.
Atmos. Chem. Phys., 18, 10391–10405, 2018 www.atmos-chem-phys.net/18/10391/2018/J. Saturno et al.: African volcanic emissions influencing aerosols over the Amazon 10401
Competing interests. The authors declare that they have no conflict
of interest. The article processing charges for this open-access
publication were covered by the Max Planck Society.
Acknowledgements. This work has been supported by the Max Edited by: Ken Carslaw
Planck Society (MPG) and the Paul Crutzen Graduate School Reviewed by: Evgenia Ilyinskaya and one anonymous referee
(PCGS). For the operation of the ATTO site, we acknowledge
the support of the German Federal Ministry of Education and
Research (BMBF contract 01LB1001A) and the Brazilian Min-
istério da Ciência, Tecnologia e Inovação (MCTI/FINEP con- References
tract 01.11.01248.00) as well as the Amazon State University
(UEA), FAPEAM, LBA/INPA, and SDS/CEUC/RDS-Uatumã. We Allan, J. D., Morgan, W. T., Darbyshire, E., Flynn, M. J., Williams,
acknowledge the generous support of the ACRIDICON-CHUVA P. I., Oram, D. E., Artaxo, P., Brito, J., Lee, J. D., and Coe,
campaign by the Max Planck Society, the German Aerospace Cen- H.: Airborne observations of IEPOX-derived isoprene SOA in
ter (DLR), FAPESP (São Paulo Research Foundation), and the the Amazon during SAMBBA, Atmos. Chem. Phys., 14, 11393–
German Science Foundation (Deutsche Forschungsgemeinschaft, 11407, https://doi.org/10.5194/acp-14-11393-2014, 2014.
DFG). This study was also supported by EU Project HAIC un- Andreae, M. O. and Andreae, T. W.: The cycle of biogenic sul-
der FP7-AAT-2012-3.5.1-1 and by the German Science Foun- fur compounds over the Amazon Basin: 1. Dry season, J. Geo-
dation within DFG SPP HALO under contract no. VO1504/4- phys. Res., 93, 1487, https://doi.org/10.1029/JD093iD02p01487,
1 and contract no. JU 3059/1-1. The ACRIDICON-CHUVA air- 1988.
craft measurements presented here were supported by BMBF grant Andreae, M. O. and Rosenfeld, D.: Aerosol–cloud–
no. 01LG1205E (ROMIC-SPITFIRE) and by DFG (SCHN1138/1- precipitation interactions. Part 1. The nature and sources
2). This paper contains results of research conducted under the of cloud-active aerosols, Earth-Sci. Rev., 89, 13–41,
Technical/Scientific Cooperation Agreement between the National https://doi.org/10.1016/j.earscirev.2008.03.001, 2008.
Institute for Amazonian Research, the State University of Ama- Andreae, M. O., Browell, E. V., Garstang, M., Gregory, G. L., Har-
zonas, and the Max-Planck-Gesellschaft e.V.; the opinions ex- riss, R. C., Hill, G. F., Jacob, D. J., Pereira, M. C., Sachse,
pressed are the entire responsibility of the authors and not of the G. W., Setzer, A. W., Dias, P. L. S., Talbot, R. W., Torres, A.
participating institutions. We gratefully acknowledge the support of L., and Wofsy, S. C.: Biomass-burning emissions and associ-
the Instituto Nacional de Pesquisas da Amazônia (INPA). We would ated haze layers over Amazonia, J. Geophys. Res., 93, 1509,
like to especially thank all the people involved in the technical, lo- https://doi.org/10.1029/JD093iD02p01509, 1988.
gistical, and scientific support of the ATTO project, in particular Andreae, M. O., Berresheim, H., Bingemer, H., Jacob, D. J., Lewis,
Reiner Ditz, Jürgen Kesselmeier, Alberto Quesada, Niro Higuchi, B. L., Li, S.-M., and Talbot, R. W.: The atmospheric sulfur cycle
Susan Trumbore, Matthias Sörgel, Thomas Disper, Andrew Crozier, over the Amazon Basin: 2. Wet season, J. Geophys. Res., 95,
Uwe Schulz, Steffen Schmidt, Antonio Ocimar Manzi, Alcides 16813, https://doi.org/10.1029/JD095iD10p16813, 1990.
Camargo Ribeiro, Hermes Braga Xavier, Elton Mendes da Silva, Andreae, M. O., Anderson, B. E., Blake, D. R., Bradshaw,
Nagib Alberto de Castro Souza, Adi Vasconcelos Brandão, Amaury J. D., Collins, J. E., Gregory, G. L., Sachse, G. W., and
Rodrigues Pereira, Antonio Huxley Melo Nascimento, Feliciano de Shipham, M. C.: Influence of plumes from biomass burn-
Souza Coehlo, Thiago de Lima Xavier, Josué Ferreira de Souza, ing on atmospheric chemistry over the equatorial and tropical
Roberta Pereira de Souza, Bruno Takeshi, and Wallace Rabelo South Atlantic during CITE 3, J. Geophys. Res., 99, 12793,
Costa. Jorge Saturno is grateful for PhD scholarship funding from https://doi.org/10.1029/94JD00263, 1994.
Fundación Gran Mariscal de Ayacucho (Fundayacucho) and ac- Andreae, M. O., Acevedo, O. C., Araùjo, A., Artaxo, P., Barbosa, C.
knowledges Loreto Donoso, Martin Brüggemann, and David Cabr- G. G., Barbosa, H. M. J., Brito, J., Carbone, S., Chi, X., Cintra,
era for support and stimulating discussions. Moreover, we appre- B. B. L., da Silva, N. F., Dias, N. L., Dias-Júnior, C. Q., Ditas, F.,
ciate the support of Jošt V. Lavrič, Tobias Könemann, Thomas Ditz, R., Godoi, A. F. L., Godoi, R. H. M., Heimann, M., Hoff-
Klimach, Björn Nillius, Luciana V. Rizzo, Henrique M. Barbosa, mann, T., Kesselmeier, J., Könemann, T., Krüger, M. L., Lavric,
Patrick Schlag, Jing Ming, Florian Dinger, Hang Su, Yafang Cheng, J. V., Manzi, A. O., Lopes, A. P., Martins, D. L., Mikhailov, E.
and Stephan Borrmann. We thank the GoAmazon2014/5 team, in F., Moran-Zuloaga, D., Nelson, B. W., Nölscher, A. C., Santos
particular Scot T. Martin. We also thank the ACRIDICON-CHUVA Nogueira, D., Piedade, M. T. F., Pöhlker, C., Pöschl, U., Que-
campaign team. sada, C. A., Rizzo, L. V., Ro, C.-U., Ruckteschler, N., Sá, L. D.
We acknowledge the NOAA Air Resources Laboratory (ARL) A., de Oliveira Sá, M., Sales, C. B., dos Santos, R. M. N., Sat-
for the provision of the HYSPLIT transport and dispersion model urno, J., Schöngart, J., Sörgel, M., de Souza, C. M., de Souza,
and READY website (http://www.ready.noaa.gov, last access: 14 R. A. F., Su, H., Targhetta, N., Tóta, J., Trebs, I., Trumbore,
November 2017) used in this publication. We also acknowledge S., van Eijck, A., Walter, D., Wang, Z., Weber, B., Williams,
NASA for providing the OMI/SO2 total column level-2 data avail- J., Winderlich, J., Wittmann, F., Wolff, S., and Yáñez-Serrano,
able online from the Goddard Earth Sciences Data and Information A. M.: The Amazon Tall Tower Observatory (ATTO): overview
Services Center (GES DISC). of pilot measurements on ecosystem ecology, meteorology, trace
Finally, we appreciate the constructive comments by Evgenia gases, and aerosols, Atmos. Chem. Phys., 15, 10723–10776,
Ilyinskaya and one anonymous referee, which were very fruitful to https://doi.org/10.5194/acp-15-10723-2015, 2015.
improve important aspects of the paper. Artaxo, P., Martins, J. V., Yamasoe, M. A., Procópio, A.
S., Pauliquevis, T. M., Andreae, M. O., Guyon, P., Gatti,
www.atmos-chem-phys.net/18/10391/2018/ Atmos. Chem. Phys., 18, 10391–10405, 201810402 J. Saturno et al.: African volcanic emissions influencing aerosols over the Amazon L. V., and Cordova Leal, A. M.: Physical and chemi- emissions measured from space, Sci. Rep., 7, 44095, cal properties of aerosols in the wet and dry seasons https://doi.org/10.1038/srep44095, 2017. in Rondônia, Amazonia, J. Geophys. Res., 107, 8081, Chin, M. and Jacob, D. J.: Anthropogenic and natural https://doi.org/10.1029/2001JD000666, 2002. contributions to tropospheric sulfate: A global model Barrière, J., Oth, A., Theys, N., D’Oreye, N., and Kervyn, F.: analysis, J. Geophys. Res.-Atmos., 101, 18691–18699, Long-term monitoring of long-period seismicity and space-based https://doi.org/10.1029/96JD01222, 1996. SO2 observations at African lava lake volcanoes Nyiragongo and Chin, M., Jacob, D. J., Gardner, G. M., Foreman-Fowler, M. S., Nyamulagira (DR Congo), Geophys. Res. Lett., 44, 6020–6029, Spiro, P. A., and Savoie, D. L.: A global three-dimensional model https://doi.org/10.1002/2017GL073348, 2017. of tropospheric sulfate, J. Geophys. Res.-Atmos., 101, 18667– Bobrowski, N. and Platt, U.: SO2 /BrO ratios studied in five 18690, https://doi.org/10.1029/96JD01221, 1996. volcanic plumes, J. Volcanol. Geotherm. Res., 166, 147–160, de Sá, S. S., Palm, B. B., Campuzano-Jost, P., Day, D. A., New- https://doi.org/10.1016/j.jvolgeores.2007.07.003, 2007. burn, M. K., Hu, W., Isaacman-VanWertz, G., Yee, L. D., Thal- Bobrowski, N., Giuffrida, G. B., Arellano, S., Yalire, M., Liotta, M., man, R., Brito, J., Carbone, S., Artaxo, P., Goldstein, A. H., Brusca, L., Calabrese, S., Scaglione, S., Rüdiger, J., Castro, J. M., Manzi, A. O., Souza, R. A. F., Mei, F., Shilling, J. E., Springston, Galle, B., and Tedesco, D.: Plume composition and volatile flux S. R., Wang, J., Surratt, J. D., Alexander, M. L., Jimenez, J. of Nyamulagira volcano, Democratic Republic of Congo, during L., and Martin, S. T.: Influence of urban pollution on the pro- birth and evolution of the lava lake, 2014–2015, Bull. Volcanol., duction of organic particulate matter from isoprene epoxydi- 79, 90, https://doi.org/10.1007/s00445-017-1174-0, 2017. ols in central Amazonia, Atmos. Chem. Phys., 17, 6611–6629, Bond, T. C. and Bergstrom, R. W.: Light Absorption by Carbona- https://doi.org/10.5194/acp-17-6611-2017, 2017. ceous Particles: An Investigative Review, Aerosol Sci. Technol., Draxler, R. R. and Hess, G. D.: Description of the HYSPLIT_4 40, 27–67, https://doi.org/10.1080/02786820500421521, 2006. modeling system, Tech. Rep. NOAA Technical Memo ERL Boucher, O., Randall, D., Artaxo, P., Bretherton, C., Feingold, G., ARL-224, Silver Spring, Maryland, USA, available at: http: Forster, P., Kerminen, V.-M., Kondo, Y., Liao, H., Lohmann, U., //www.hysplit.uhu.es/hysplitweb08/document/arl-224.pdf (last Rasch, P., Satheesh, S. K., Sherwood, S., Stevens, B., and Zhang, access: 14 November 2017), 1997. X. Y.: Clouds and Aerosols, in: Climate Change 2013 – The Draxler, R. R. and Hess, G. D.: An overview of the HYSPLIT Physical Science Basis, edited by: Intergovernmental Panel on 4 modelling system for trajectories, dispersion and deposition, Climate Change, 571–658, Cambridge University Press, Cam- Aust. Met. Mag., 47, 295–308, 1998. bridge, 2013. Drewnick, F., Hings, S. S., DeCarlo, P., Jayne, J. T., Gonin, M., Brito, J., Rizzo, L. V., Morgan, W. T., Coe, H., Johnson, Fuhrer, K., Weimer, S., Jimenez, J. L., Demerjian, K. L., Bor- B., Haywood, J., Longo, K., Freitas, S., Andreae, M. O., rmann, S., and Worsnop, D. R.: A New Time-of-Flight Aerosol and Artaxo, P.: Ground-based aerosol characterization during Mass Spectrometer (TOF-AMS) – Instrument Description and the South American Biomass Burning Analysis (SAMBBA) First Field Deployment, Aerosol Sci. Technol., 39, 637–658, field experiment, Atmos. Chem. Phys., 14, 12069–12083, https://doi.org/10.1080/02786820500182040, 2005. https://doi.org/10.5194/acp-14-12069-2014, 2014. Ebmeier, S. K., Sayer, A. M., Grainger, R. G., Mather, T. Bukowiecki, N., Zieger, P., Weingartner, E., Jurányi, Z., Gysel, M., A., and Carboni, E.: Systematic satellite observations of the Neininger, B., Schneider, B., Hueglin, C., Ulrich, A., Wichser, impact of aerosols from passive volcanic degassing on lo- A., Henne, S., Brunner, D., Kaegi, R., Schwikowski, M., To- cal cloud properties, Atmos. Chem. Phys., 14, 10601–10618, bler, L., Wienhold, F. G., Engel, I., Buchmann, B., Peter, T., and https://doi.org/10.5194/acp-14-10601-2014, 2014. Baltensperger, U.: Ground-based and airborne in-situ measure- Eisinger, M. and Burrows, J. P.: Tropospheric sulfur dioxide ob- ments of the Eyjafjallajökull volcanic aerosol plume in Switzer- served by the ERS-2 GOME instrument, Geophys. Res. Lett., land in spring 2010, Atmos. Chem. Phys., 11, 10011–10030, 25, 4177–4180, https://doi.org/10.1029/1998GL900128, 1998. https://doi.org/10.5194/acp-11-10011-2011, 2011. Fioletov, V. E., McLinden, C. A., Krotkov, N., Li, C., Joiner, J., Campion, R.: New lava lake at Nyamuragira volcano revealed by Theys, N., Carn, S., and Moran, M. D.: A global catalogue combined ASTER and OMI SO2 measurements, Geophys. Res. of large SO2 sources and emissions derived from the Ozone Lett., 41, 7485–7492, https://doi.org/10.1002/2014GL061808, Monitoring Instrument, Atmos. Chem. Phys., 16, 11497–11519, 2014. https://doi.org/10.5194/acp-16-11497-2016, 2016. Carbone, S., Brito, J. F., Xu, L., Ng, N. L., Rizzo, L. V., Stern, R., Fuzzi, S., Decesari, S., Facchini, M. C., Cavalli, F., Emblico, L., Cirino, G. G., Holanda, B. A., Senna, E., Wolff, S., Saturno, J., Mircea, M., Andreae, M. O., Trebs, I., Hoffer, A., Guyon, P., Chi, X., Souza, R. A. F., Arana, A., de Sá, M., Pöhlker, M. L., Artaxo, P., Rizzo, L. V., Lara, L. L., Pauliquevis, T., Maenhaut, Andreae, M. O., Pöhlker, C., Barbosa, H. M. J., and Artaxo, P.: W., Raes, N., Chi, X., Mayol-Bracero, O. L., Soto-García, L. L., Long-term chemical composition and source apportionment of Claeys, M., Kourtchev, I., Rissler, J., Swietlicki, E., Tagliavini, submicron aerosol particles in the central Amazon basin (ATTO), E., Schkolnik, G., Falkovich, A. H., Rudich, Y., Fisch, G., and to be submitted to Atmos. Chem. Phys. Discuss., 2018. Gatti, L. V.: Overview of the inorganic and organic composition Carn, S. A., Clarisse, L., and Prata, A. J.: Multi- of size-segregated aerosol in Rondônia, Brazil, from the biomass- decadal satellite measurements of global volcanic de- burning period to the onset of the wet season, J. Geophys. Res.- gassing, J. Volcanol. Geotherm. Res., 311, 99–134, Atmos., 112, D01201, https://doi.org/10.1029/2005JD006741, https://doi.org/10.1016/j.jvolgeores.2016.01.002, 2016. 2007. Carn, S. A., Fioletov, V. E., McLinden, C. A., Li, C., Galle, B., Oppenheimer, C., Geyer, A., McGonigle, A. J., Ed- and Krotkov, N. A.: A decade of global volcanic SO2 monds, M., and Horrocks, L.: A miniaturised ultraviolet spec- Atmos. Chem. Phys., 18, 10391–10405, 2018 www.atmos-chem-phys.net/18/10391/2018/
You can also read