No anomalous supersaturation in ultracold cirrus laboratory experiments
←
→
Page content transcription
If your browser does not render page correctly, please read the page content below
Atmos. Chem. Phys., 20, 1089–1103, 2020
https://doi.org/10.5194/acp-20-1089-2020
© Author(s) 2020. This work is distributed under
the Creative Commons Attribution 4.0 License.

No anomalous supersaturation in ultracold
cirrus laboratory experiments
Benjamin W. Clouser1,2 , Kara D. Lamb1,3 , Laszlo C. Sarkozy2 , Jan Habig4 , Volker Ebert5 , Harald Saathoff4 ,
Ottmar Möhler4 , and Elisabeth J. Moyer2
1 Department   of Physics, University of Chicago, Chicago, IL, USA
2 Department   of the Geophysical Sciences, University of Chicago, Chicago, IL, USA
3 currently at Cooperative Institute for Research in the Environmental Sciences, Boulder, CO, USA
4 Institute of Meteorology and Climate Research, Karlsruhe Institute of Technology, 76021 Karlsruhe, Germany
5 Physikalisch-Technische Bundesanstalt, 38116 Braunschweig, Germany

Correspondence: Benjamin W. Clouser (bclouser@uchicago.edu) and Elisabeth J. Moyer (moyer@uchicago.edu)

Received: 13 February 2019 – Discussion started: 1 April 2019
Revised: 26 November 2019 – Accepted: 11 December 2019 – Published: 28 January 2020

Abstract. High-altitude cirrus clouds are climatically impor-     1   Introduction
tant: their formation freeze-dries air ascending to the strato-
sphere to its final value, and their radiative impact is dis-
proportionately large. However, their formation and growth        As air rises into the stratosphere, it is freeze-dried by con-
are not fully understood, and multiple in situ aircraft cam-      densation as it passes through the coldest regions of the
paigns have observed frequent and persistent apparent wa-         upper troposphere and lower stratosphere (UT/LS). The
ter vapor supersaturations of 5 %–25 % in ultracold cirrus        temperature-dependent saturation vapor pressure over ice
(T < 205 K), even in the presence of ice particles. A variety     therefore plays a strong role in setting the water vapor con-
of explanations for these observations have been put forth,       centration of the stratosphere as a whole (e.g., Brewer, 1949),
including that ultracold cirrus are dominated by metastable       and in determining the abundance and characteristics of ra-
ice whose vapor pressure exceeds that of hexagonal ice. The       diatively important tropical cold cirrus. Inadequate under-
2013 IsoCloud campaign at the Aerosol Interaction and Dy-         standing of saturation vapor pressure, or incomplete relax-
namics in the Atmosphere (AIDA) cloud and aerosol cham-           ation of air to saturation, would result in excess stratospheric
ber allowed explicit testing of cirrus formation dynamics         water and errors in both chemistry models and radiative forc-
at these low temperatures. A series of 28 experiments al-         ing calculations. For example, an apparent supersaturation of
lows robust estimation of the saturation vapor pressure over      20 % at 190 K over expected values (from the Murphy–Koop
ice for temperatures between 189 and 235 K, with a vari-          parametrization, henceforth MK; Murphy and Koop, 2005)
ety of ice nucleating particles. Experiments are rapid enough     corresponds to a difference of about 0.7 ppmv H2 O. If uni-
(∼ 10 min) to allow detection of any metastable ice that may      formly distributed, this additional stratospheric water would
form, as the timescale for annealing to hexagonal ice is hours    increase global surface radiative forcing by about 0.2 W m−2
or longer over the whole experimental temperature range. We       (Forster and Shine, 1999). Incomplete dehydration would
show that in all experiments, saturation vapor pressures are      also change the radiative effect of the cirrus produced by
fully consistent with expected values for hexagonal ice and       freeze-drying ascending air, but the magnitude and even sign
inconsistent with the highest values postulated for metastable    of this effect are not well known. Reduced cirrus ice con-
ice, with no temperature-dependent deviations from expected       tent would reduce longwave and shortwave cloud forcing,
saturation vapor pressure. If metastable ice forms in ultracold   with opposing cooling and warming effects. Modeling stud-
cirrus clouds, it appears to have a vapor pressure indistin-      ies show effects that are of comparable magnitude to the di-
guishable from that of hexagonal ice to within about 4.5 %.       rect effect of water but disagree on the sign (Gettelman and
                                                                  Kinnison, 2007; Tan et al., 2016). Furthermore, some expla-

Published by Copernicus Publications on behalf of the European Geosciences Union.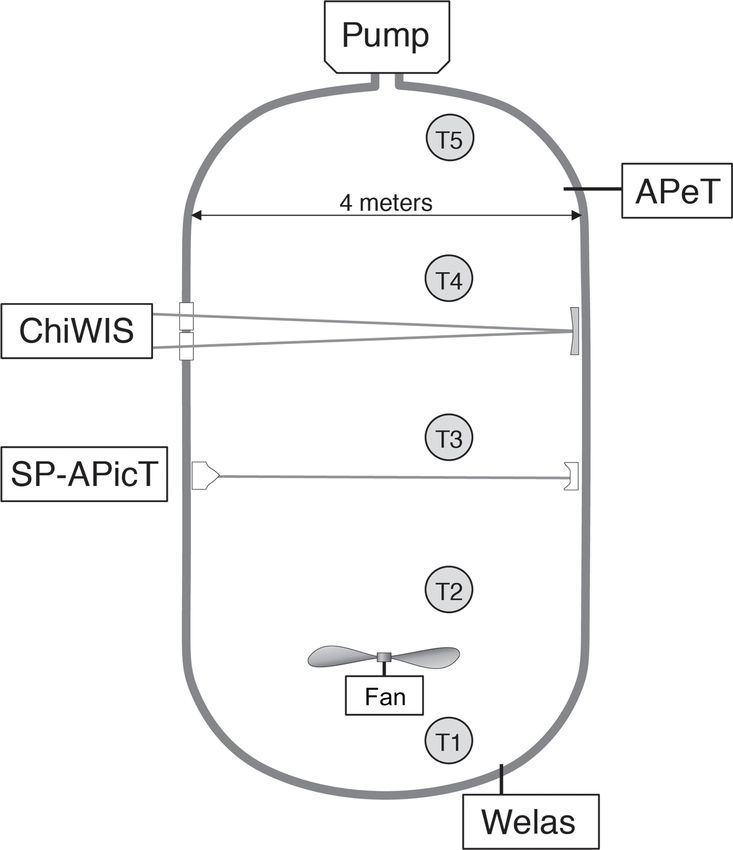
1090                                            B. W. Clouser et al.: No anomalous supersaturation in laboratory cold cirrus

nations for observed supersaturations invoke novel forms of          cirrus (< 100 L−1 ), but not in those with high concentrations
ice that may have intrinsically different radiative properties       (up to 10 000 L−1 ), even at cold temperatures (190 K; Jensen
than those of hexagonal ice (Murray et al., 2015). It is there-      et al., 2013). These measurements demonstrate that satura-
fore important to understand the physics of ice nucleation           tions consistent with MK are at least possible in cold cirrus.
and growth at the cold temperatures found in this region.            Finally, instrumental error could explain all or part of the ob-
   High apparent supersaturations within ice clouds have             served anomalies (Fahey et al., 2014).
been measured in several in situ campaigns in the UT/LS,                Metastable ices with non-hexagonal crystal structure and
most frequently in the coldest ice clouds, with temperatures         elevated saturation vapor pressures could provide an expla-
at or below 205 K (Krämer et al., 2009). From observations           nation that encompasses the diverse body of field measure-
in the 2002 CRYSTAL-FACE campaign, Gao et al. (2004)                 ments. Laboratory measurements have identified metastable
reported supersaturations of 13 % above 202 K and 35 % be-           ices with saturation vapor pressures of as much as 10.5 %
low 202 K in cold cirrus and persistent contrails. Using wa-         higher than hexagonal ice (Ih ) at temperatures below 200 K
ter and particle measurements from the 2006 CR-AVE cam-              (Shilling et al., 2006). The properties of metastable ice are,
paign, Lawson et al. (2008) found supersaturations in excess         however, determined by its crystal structure, which can take
of 50 % in cirrus clouds. Inai et al. (2012) found frequent          different forms that may have different vapor pressures. In
supersaturations above 25 % in cirrus clouds near the cold           the conditions found in Earth’s atmosphere, ice forms lay-
point using CALIOP data (Winker et al., 2007) and balloon-           ers of puckered hexagonal rings referred to as Ice I (Hobbs,
borne chilled-mirror hygrometer measurements taken during            1974), which can be stacked in different ways: as mirror im-
the 2007 and 2008 SOWER campaign (Fujiwara et al., 2010).            ages of each other (hexagonal ice; ice Ih ), shifted by half
Some degree of supersaturation has also been observed in cir-        the ring width (cubic ice; ice Ic ), or in a combination of
rus at warmer temperatures. Petzold et al. (2017) show that          both stacking sequences (stacking-disordered ice; ice Isd ;
hygrometer data (Neis et al., 2015) from IAGOS-CORE, a               Malkin et al., 2012). Note that much of the literature on cu-
campaign using instrumented commercial aircraft reaching             bic ice is now thought to have been measuring ice Isd (Malkin
minimum temperatures of 205 K, exhibit most probable val-            et al., 2015). The vapor pressure over metastable ice is poorly
ues of supersaturation over ice within cirrus of 5 %–10 %.           understood, and some modeling studies suggest that it de-
A laboratory experiment in the AIDA (Aerosol Interaction             pends less on the crystal’s cubicity (fraction of cubic stack-
and Dynamics in the Atmosphere) cloud chamber spanning               ing sequences) than on the number and type of imperfections
a wide temperature range (243–185 K) showed values close             within the crystal (Hudait et al., 2016; Lupi et al., 2017).
to saturation, but with a systematic increase of ∼ 6 % with             Laboratory measurements and computer simulations sug-
decreasing temperatures (Fahey et al., 2014).                        gest that stacking disordered ice could form in the UT/LS,
   Numerous explanations have been proposed for these ob-            which experiences the coldest temperatures found in Earth’s
servations. Many studies interpret them as true “anoma-              atmosphere. Measurements by multiple groups have shown
lous supersaturation”, i.e., resulting from errors in our un-        ice Isd forming in supercooled droplets, by both homoge-
derstanding of saturation vapor pressure and impossible to           neous and heterogeneous nucleation. Homogeneous nucle-
explain with standard microphysics. Explanations involving           ation of ice Isd was seen by Murray et al. (2005), Murray and
anomalous supersaturation include organic coatings on ice            Bertram (2006), Murray (2008b), and Malkin et al. (2012)
crystals (Cziczo et al., 2004a, b), glassy states (Zobrist et al.,   in micrometer-sized water and solution droplets suspended
2008; Kärcher and Haag, 2004; Murray, 2008a), surface up-            in oil at temperatures of 170–240 K, and by Amaya et al.
take interference due to ice binding with HNO3 (Gao et al.,          (2017) in nanodrops frozen during expansion of N2 carrier
2004; Gao et al., 2016), temperature- and supersaturation-           gas. Malkin et al. (2015) observed heterogeneous nucleation
dependent accommodation coefficients (Zhang and Harring-             of ice Isd in water containing solid inclusions, and Kuhs et al.
ton, 2015), multi-component aerosols (Bogdan and Molina,             (2012) reported that pure hexagonal ice formation was never
2010), and metastable forms of ice (Peter et al., 2006). Other       observed below 190 K. The cubicity in laboratory-generated
studies suggest that no anomaly is necessary, and that mea-          ice Isd samples is variable and depends on factors such as
sured supersaturations result only from dynamics, i.e., they         the freezing temperature, droplet size, and aerosol type and
occur when uptake rates on ice crystals are slow enough              content, but can be as high as 75 % in atmospherically rele-
that the timescales of relaxation to saturation are long. Long       vant temperature ranges. Simulations agree that ice frozen at
timescales to achieve saturation may result from low parti-          180 K should form ice Isd , with Moore and Molinero (2011)
cle numbers and small particle sizes found at low tempera-           producing two cubic ice layers for each hexagonal ice layer,
tures (Krämer et al., 2009; Murray et al., 2010; Rollins et al.,     i.e., a cubicity of 67 %.
2016), or strong updrafts that lead to relaxation only to a             No experimental studies to date have measured the result-
dynamical equilibrium value (Petzold et al., 2017). The AT-          ing influence of ice Isd on the saturation vapor pressure ex-
TREX campaigns of 2013–2014 provided examples of ap-                 pected in cirrus clouds. Many of the ice Isd nucleation ex-
parent supersaturations due to low particle numbers: super-          periments provide no means of measuring the vapor pres-
saturations of up to 70 % were observed in low-concentration         sure over ice (i.e., those experiments involving droplets sus-

Atmos. Chem. Phys., 20, 1089–1103, 2020                                               www.atmos-chem-phys.net/20/1089/2020/
B. W. Clouser et al.: No anomalous supersaturation in laboratory cold cirrus                                               1091

pended in oil). Nachbar et al. (2018) show that ice formed by      zona test dust (ATD), with number densities high enough to
crystallization from amorphous solid water shows a signif-         ensure that vapor can reach an equilibrium over the duration
icantly higher vapor pressure than MK at temperatures be-          of each experiment. To reconstruct the saturation vapor pres-
low 190 K, but it is unclear if this is ice Isd . Studies that     sure over ice, we use a box model and the observed properties
report the free energy difference between metastable and           of the ice cloud and chamber gas as cirrus grow and dissipate.
hexagonal ices vary widely in their estimates, likely be-
cause the types of imperfections and defects that affect va-
por pressure are strongly influenced by experimental condi-        2     Methods
tions. No experiments have addressed the ice that is subse-
quently grown through vapor deposition onto ice Isd crys-          The 2012–2013 IsoCloud campaigns at the AIDA (Aerosol
tals. Observations of cirrus clouds are inevitably made after      Interaction and Dynamics in the Atmosphere) cloud cham-
at least some growth has occurred, and no ongoing experi-          ber involve a series of cirrus formation experiments designed
ments address how these crystals behave as new ice layers          to probe anomalous supersaturation. The chamber’s pres-
are added. Recent modeling work on depositional ice growth         sure and temperature can be varied to replicate conditions
at UT/LS temperatures suggests that ice should grow exclu-         throughout the UT/LS, and rapid pumping on the chamber
sively in hexagonal layers, regardless of nucleation method,       simulates updrafts and can initiate nucleation. The chamber
as long as supersaturation levels are moderate and tempera-        can be seeded with a variety of liquid aerosols and ice nu-
tures are above 200 K (Hudait and Molinero, 2016), while be-       cleating particles, and houses a variety of instruments that
low 200 K some stacking disorder can occur. The properties         make useful measurements supporting the study of gas-phase
of metastable ices nucleated and grown in real atmospheric         water vapor, such as ice particle number and total water
conditions remain only poorly understood.                          concentration. An in-depth discussion of the experiments,
   Any metastable ice formed in the cold UT/LS region              methods, and instruments used at AIDA and in the cam-
should persist long enough to be relevant for cirrus micro-        paign can be found in Fahey et al. (2014) and Lamb et al.
physics. Observed transformation times for metastable ice          (2017). In the IsoCloud campaigns, 28 pseudo-adiabatic ex-
into ice Ih depend strongly on the surface area of the sam-        pansion experiments at temperatures between 185 and 235 K
ples (Murray et al., 2005), but for low-surface-area samples       and pressures between 300 and 170 hPa were suitable for
such as frozen droplets, the time can be quite long. Mayer         analysis. In these experiments, the chamber was seeded with
and Hallbrucker (1987), Murray and Bertram (2006), Kuhs            Arizona test dust (ATD), sulfuric acid (SA), and secondary
et al. (2012), and Murphy (2003) report annealing times of         organic aerosols (SOA) which allowed the study of both
tens of minutes to hours over the UT/LS temperature range,         heterogeneous and homogeneous nucleation. We use mea-
and observe that by the termination of their experiments the       surements of water vapor and total water (vapor + ice) and
transformation to ice Ih is often still not complete, especially   an ice growth model to estimate the saturation vapor pres-
at lower temperatures. Observations of secondary indicators        sure over ice (ei ) for clouds from 185 to 235 K, with va-
like crystal habit suggest that metastable forms of ice may        por pressure measurements in the coldest temperature regime
nucleate and persist for some time in the coldest parts of         (< 205 K) provided by the new Chicago Water Isotope Spec-
Earth’s atmosphere. Hallett et al. (2002) observed that cu-        trometer (ChiWIS). The remainder of this section is divided
bic sequences in an otherwise hexagonal structure would            into subsections discussing the characteristics of the instru-
yield crystals with threefold rotational symmetry, and work        ments used in the analysis, the experiments included, the cri-
by Hansen et al. (2008) and Murray et al. (2015) suggest that      teria for their inclusion, and the model used to retrieve the
ice Isd should form crystals with trigonal structure. Field ob-    saturation vapor pressure.
servations suggest that trigonal crystals may be quite com-
mon. In measurements by Heymsfield (1986) in the equato-           2.1    Instruments
rial Pacific at about 16.5 km, about 50 % of the crystals be-
tween 5 and 50 µm exhibit threefold symmetry. Murray et al.        Determining the saturation vapor pressure over ice requires
(2015) review collected images of atmospheric ice crystals         measurements from three water instruments, an optical parti-
with threefold symmetry (including those from Heymsfield,          cle counter, and temperature and pressure sensors (Fig. 1).
1986) and show that all are consistent with trigonal crystal       Each of these measurements is described in the following
structure.                                                         sections, along with the instruments taking them, typical ac-
   The IsoCloud experimental campaign allows us to char-           curacies and precisions, and limitations. Instrumental uncer-
acterize saturation vapor pressure during post-nucleation          tainties are used to generate bounds on the retrieved satura-
growth of ice crystals in conditions characteristic of             tion vapor pressures.
the UT/LS. The campaign consists of a series of cooling ex-           Our primary source of information is ChiWIS, a mid-
periments with sample temperatures from 185 to 235 K, ho-          infrared tunable diode laser instrument operated in open-path
mogeneous nucleation of sulfuric acid (SA) and secondary           mode using one of AIDA’s White cell mirror systems. See
organic (SOA) aerosols, and heterogenous nucleation on Ari-        Lamb et al. (2017) and Sarkozy et al. (2020) for instrument

www.atmos-chem-phys.net/20/1089/2020/                                              Atmos. Chem. Phys., 20, 1089–1103, 2020
1092                                             B. W. Clouser et al.: No anomalous supersaturation in laboratory cold cirrus

                                                                       another ±1.1 %. See Sect. 3.5 for a complete discussion of
                                                                       uncertainty.
                                                                          The SP-APicT (single-pass AIDA PCI in cloud TDL;
                                                                       Skrotzki, 2012) water vapor instrument is used to provide
                                                                       water vapor measurements in the case of thick ice clouds,
                                                                       which form in some IsoCloud experiments above 210 K
                                                                       (13 of 28 experiments). During warmer experiments that
                                                                       form very dense ice clouds, ChiWIS simultaneously expe-
                                                                       riences signal attenuation of up to 95 % and backscattering
                                                                       of light off the cloud into the detector, producing artifacts
                                                                       that affect retrieved concentrations. During these intervals,
                                                                       we rely on the SP-APicT instrument to provide water vapor
                                                                       measurements because that instrument’s single-pass optical
                                                                       arrangement is much less sensitive to backscatter. At temper-
                                                                       atures above 205 K, SP-APicT reports mixing ratios during
                                                                       ice-free periods about 1.5 % lower than ChiWIS. For con-
                                                                       sistency across all experiments, we arbitrarily scale up the
                                                                       substituted SP-APicT measurements by that factor (details
                                                                       can be found in Lamb et al., 2017). The resulting compos-
                                                                       ite water vapor record uses ChiWIS measurements for 15 of
Figure 1. Layout of the instruments used in this analysis during the   28 experiments, and scaled SP-APicT measurements for the
IsoCloud campaigns at the AIDA chamber. ChiWIS and SP-APicT,           remaining 13 experiments.
both open-path tunable diode laser absorption spectroscopy (TD-           Total water measurements are provided by APeT
LAS) instruments, provided water vapor measurements. APeT, an          (AIDA PCI extractive TDL), an extractive, tunable diode
extractive TDLAS instrument with a heated inlet, provided total        laser instrument (Ebert et al., 2008). In previous compar-
water (ice + vapor) measurements, and Welas provided ice particle      isons of AIDA instruments (Skrotzki, 2012), APeT measure-
concentrations. The difference between total water and water vapor     ments were found to be delayed by 17 s with respect to open-
measurements was used to calculate ice mass in the chamber. Gas        path in situ TDLAS ones. As is standard practice, we take
temperature is taken as the average of thermocouples 1 through 4.
                                                                       the chamber ice content to be the difference between to-
Thermocouple 5 is excluded from the analysis due to the presence of
a region of warm air at the top of the chamber. The whole chamber
                                                                       tal water and vapor-phase measurements. To take advantage
is within a thermally controlled housing that sets the base tempera-   of the high precision ChiWIS affords at temperatures below
ture of an experiment. The pumps draw gas out of the chamber in a      205 K, we use the composite water vapor record described
pseudo-adiabatic expansion.                                            above to calculate ice mass. However, APeT total water mea-
                                                                       surements also require harmonization with ChiWIS. APeT
                                                                       and SP-APicT derive their measured concentrations from the
                                                                       same H2 O spectral feature, and both instruments report val-
details. The instrument has a typical precision of 22 ppbv in          ues 1.5% below ChiWIS during ice free periods. We there-
H2 O in analyzed IsoCloud experiments for 1 Hz measure-                fore scale up the APeT measurements by 1.5 % as well. After
ments at 299.2 hPa and 204.2 K, corresponding to relative              applying this time-invariant scaling factor, if there is still an
precisions of 5 % and 0.02 % at 0.45 and 100 ppmv, respec-             offset between the water vapor record and APeT total water
tively. Measured quantities are retrieved by fitting spectra           prior to the expansion (when there should be no ice cloud in
calculated from line parameters in the HITRAN database                 the chamber), that offset is subtracted from the whole exper-
(Gordon et al., 2017) to raw spectra, rather than by empirical         iment. These offsets are most significant below 200 K where
calibration. Fitting is done using ICOSfit, a non-linear, least-       they are typically between +0.05 and +0.25 ppmv. Potential
squares fitting algorithm. Uncertainties in the spectroscopic          causes could include parasitic water absorption inside the in-
parameters for the (413–524) line at 3789.63481 cm−1 in                strument or outgassing from ice in the inlet of APeT (e.g.,
the ν1 band from which H2 O measurements are derived                   Buchholz and Ebert, 2014). See Supplement for details of
contribute an additional ±2.5 %–3 % systematic uncertainty.            instrument comparisons, and Table S3 for instrument offsets
The uncertainty due to pressure broadening values varies               prior to pumping.
slightly with temperature across the experimental range, but              Ice particle concentrations are measured by the Welas 1
for simplicity we apply the maximal value of ± 3 % to all ex-          instrument. Ice particle number concentration is used to es-
periments. Errors in the linearization of the wavelength scale         timate the average radius of particles in the chamber and the
contribute another 0.2 % of systematic uncertainty to all ex-          average, per-particle growth rate. One component of this in-
periments. Day- and experiment-specific systematic uncer-              strument’s uncertainty comes from counting errors,   √ which
tainties due to the fit routine and in the path length contribute      follow Poisson statistics and are proportional to 1/ n. How-

Atmos. Chem. Phys., 20, 1089–1103, 2020                                                 www.atmos-chem-phys.net/20/1089/2020/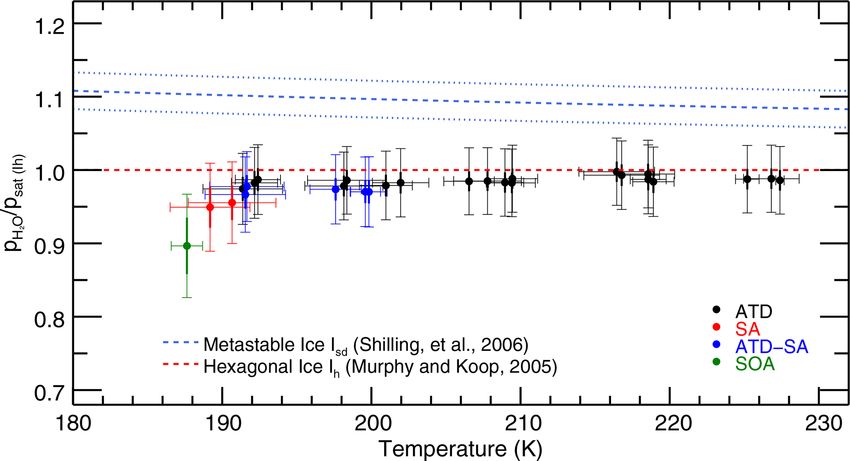
B. W. Clouser et al.: No anomalous supersaturation in laboratory cold cirrus                                                1093

ever, experiments included in this analysis have high ice par-    nucleating particles, the now-supersaturated chamber air will
ticle densities and small counting errors. We therefore ne-       nucleate an ice cloud. Ice growth then draws the chamber va-
glect the counting errors in this analysis. The conversion of     por pressure below the saturation vapor pressure at wall tem-
this instrument’s count rate into a number concentration has      perature, and the walls become an additional source of wa-
a 10 % uncertainty. In experiments where particles are very       ter for the growing cirrus cloud. The transfer of mass from
small, the Welas 1 instrument likely undercounts them since       the walls is often large enough that chamber total water is
its efficiency drops sharply for particles below 0.7 µm in di-    greater at the end of pumping than at the beginning, despite
ameter (Wagner and Möhler, 2013). We address the steps            loss to the pumps. Once the pumps cease, the chamber warms
taken to characterize this undercounting in the following sec-    and the cirrus cloud dissipates and part of its mass is trans-
tions.                                                            ferred through the vapor back to the walls. The total amount
   We assume a single chamber temperature at each point in        of cooling in an experiment varies from 5 to 9 K, depending
time, and construct a value from the average of four ther-        on pump speed, and occurs primarily during the first ∼ 100 s
mocouples suspended at different heights in the chamber.          of pumping when the chamber air behaves nearly adiabati-
The fifth thermocouple is not included in the analysis to         cally. Subsequently, heat flux from the walls becomes large
avoid the introduction of bias from a known warm region at        enough to balance the adiabatic cooling. Cooling rates during
the top of the chamber. These measurements have an appar-         the early stages of pumpdowns are equivalent to effective at-
ent precision of 0.3 K during pumpdowns and 0.15 K during         mospheric updraft speeds of several meters per second, much
static conditions between pumpdowns (Möhler et al., 2003).        faster than those typically associated with cold cirrus in the
A mixing fan at the bottom of the chamber is always oper-         natural atmosphere.
ational and enhances the uniformity of the chamber, with a           Of the 48 IsoCloud experiments in March of 2013, six
mixing time constant of about 1 min. Figure 1 shows the po-       were reference expansions, and four others lacked measure-
sitions of the instruments used during IsoCloud in the AIDA       ments of one of the physical quantities required for analy-
chamber, as well as the locations of the thermocouples.           sis. Of the remaining 38 experiments, this analysis uses 28
                                                                  and excludes 10. We include all experiments conducted with
2.2   Experiments                                                 standard protocol in which the ice cloud can be reasonably
                                                                  expected to approach saturation. Five experiments are ex-
IsoCloud expansion experiments were designed to nucleate,         cluded for overly long relaxation times, and five for non-
grow, and maintain cold cirrus clouds with the goal of testing    standard protocol. See Tables S3 and S4 for characteristics
for the presence of anomalous supersaturation under condi-        of included and excluded experiments, respectively. We es-
tions similar to the coldest parts of the atmosphere. To be       timate vapor relaxation times for each point in each exper-
a suitable test for anomalous supersaturation, an expansion       iment using the expression of Korolev and Mazin (2003),
experiment must satisfy two basic criteria. First, its duration   which takes into account cooling rate (effective updraft
must be significantly longer than the vapor relaxation times      speed), ice particle number, and particle size to estimate the
associated with cirrus growth. Relaxation times depend on         timescale for achieving a dynamical equilibrium value (see
experimental conditions, and are longer in the cases where        Sect. S2.3 for expression). For each experiment, we deter-
particle number densities are small and diffusion limitation      mine τmin , the minimum relaxation time at any point during
is strong. Second, cirrus cloud growth must continue for long     the experiment, and texp , the time interval over which the cal-
enough to allow for the retrieval of the saturation vapor pres-   culated relaxation time is within a factor of two of τmin . We
sure over ice. In practice, this means that the chamber’s ice-    consider that an experiment should reasonably approach dy-
covered walls must serve as a source of vapor from which the      namical equilibrium if texp /τmin > 4.
cirrus cloud can continue to grow throughout the experiment.         The five non-standard experiments excluded are Exper-
The remainder of this section describes a typical expansion       iment 1, which had an abnormally short pumping time,
experiment, addresses the consequences of running experi-         and Experiments 40–43, where the chamber was prepared
ments in the presence of wall ice, and discusses the criteria     with dry walls. Pumping in Experiment 1 lasted only 250 s,
for exclusion from analysis.                                      vs. 400–750 s in all other experiments; we would expect
   In a typical IsoCloud experiment, ice clouds are formed        more inhomogeneities in the resulting ice cloud. Experi-
by pumping on a chamber filled with water vapor near sat-         ments with dry walls pose a problem for our analysis because
uration. Adiabatic expansion causes rapid cooling, which in       the lack of an ice source means that these experiments do not
turn leads to nucleation of ice. Air is kept close to satura-     involve extended periods of ice growth near saturation.
tion before pumping by preparing the walls with a thin coat-         The 28 experiments used in this analysis still show a range
ing of ice. In practice, chamber water vapor pressures are        of characteristics, and can be grouped into two broad cat-
80 %–90 % of MK saturation before the expansions, which           egories. In “cirrus-dominated” experiments (see Fig. 2, left,
suggests that the wall ice is 0.5–2 K colder than the cham-       for example), the wall flux is comparable to ice uptake driven
ber air. Pumping and adiabatic expansion cool the chamber         simply by the change in saturation vapor pressure on cooling.
air below the wall temperature, and given the presence of ice     In these experiments water vapor concentrations draw down

www.atmos-chem-phys.net/20/1089/2020/                                              Atmos. Chem. Phys., 20, 1089–1103, 2020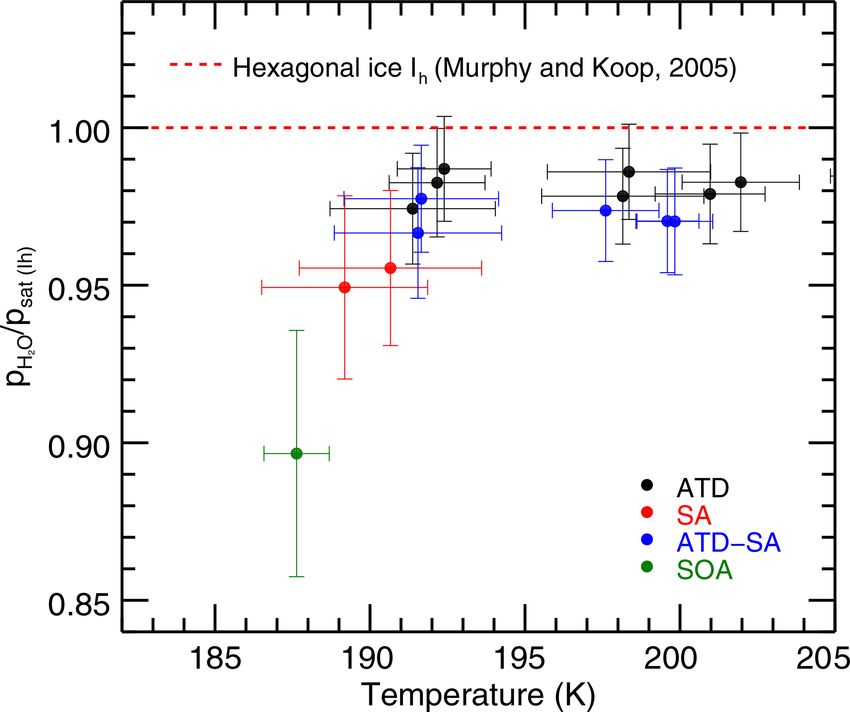
1094 B. W. Clouser et al.: No anomalous supersaturation in laboratory cold cirrus
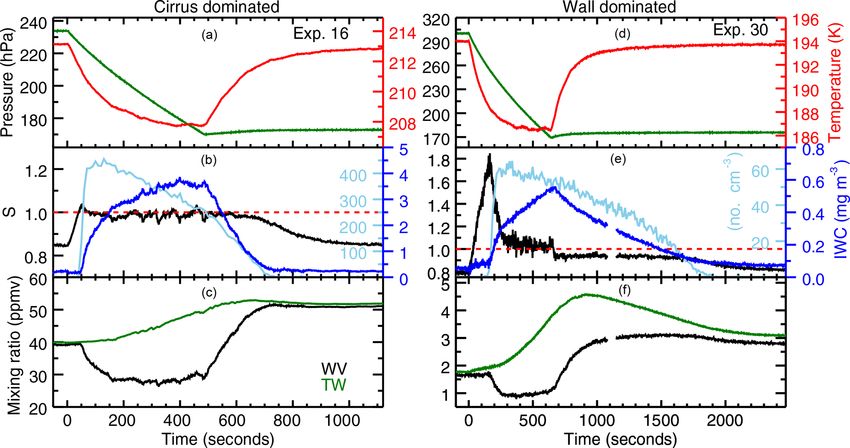
Figure 2. Examples of experiments in which vapor is controlled by cirrus uptake (a–c) and wall flux (d–f). Experiment 16 (a-c) is a
heterogeneous nucleation experiment onto ATD, and Experiment 30 (d–f) is a homogeneous nucleation experiment with SA aerosol. The top
panels of each plot show the pressure (green) and temperature (red) evolution. The action of the chamber pumps results in a pseudo-adiabatic
expansion that cools the chamber gas rapidly at first, then more slowly until the cooling is balanced by heat flux from the chamber walls. The
chamber gas warms as soon as the pumps have stopped. The middle panels show Murphy–Koop (MK) saturation (red dashed line), measured
saturation (black), ice particle number (light blue), and the cloud’s ice water content (dark blue). Ice nucleation starts at the peak in saturation,
and is followed by a sharp increase in particle number and rapid cloud growth. Saturation relaxes back to a constant value, where it stays
until the pumps turn off. In the cirrus-dominated experiment, that value is the saturation vapor pressure over ice. In the wall flux-dominated
experiment, that value of about 6 % supersaturation is what is required to drive enough ice growth to balance the wall outgassing. When
the pumps stop, the vapor pressure returns to the wall-controlled value in the cirrus-controlled experiment, but in the wall flux-controlled
experiment the decay rate is limited by wall uptake. The bottom panels show total water (green) and water vapor (black). The small data gap
in Experiment 30 at around 1100 s is due to realignment of the chamber’s White cell mirrors.
quickly to saturation. In the colder experiments, however, cloud decays over a roughly 200 s period, and the chamber
wall flux is generally far more substantial. In these “wall- vapor pressure returns to the wall-controlled value.
dominated” experiments (Fig. 2, right), peak total water rises In the wall-dominated experiment (Fig. 2, right), signifi-
to many times greater than initial water vapor, water vapor cant supersaturation with respect to MK persists throughout
remains supersaturated during the growth phase of the ex- the experiment. In this particular case, initial supersaturation
periment, and then becomes subsaturated during evaporation. is quite high since the chamber was prepared with only sulfu-
This deviation complicates analysis and requires a growth ric acid droplets to study homogeneous nucleation. The onset
model to determine saturation vapor pressure. For consis- of nucleation again produces a drawdown of supersaturation,
tency, we treat all experiments the same, and extract satu- but only to a value of about 6 %, which remains fairly con-
ration vapor pressure using the same method. stant for the duration of pumping. This is the value required
The two examples shown in Fig. 2 illustrate the key fea- to drive the strong continuing ice growth that balances the
tures of each type of experiment. In the cirrus-dominated wall flux. Once the expansion stops, the chamber air warms,
experiment (Fig. 2, left), the onset of nucleation produces the walls become a water sink rather than a source, and cham-
rapid ice growth and a corresponding drawdown of vapor ber vapor pressure drops to RHice ∼ 95 %, the value required
pressure to a value close to saturation. The ice cloud then to drive enough evaporation to balance wall uptake. After the
grows slowly for the remainder of the expansion experiment, ice cloud has nearly dissipated, the chamber vapor pressure
with water provided by the ice-covered chamber walls. In this again returns to the wall-controlled value.
particular case, a heterogeneous nucleation experiment with These chamber dynamics mean that saturation vapor pres-
abundant ice nucleating particles, ice nucleation occurs at a sure in IsoCloud experiments cannot be determined simply
relatively low supersaturation, and the ice particle number by measuring the water vapor content in the chamber after
reaches ∼ 400 cm−3 before decreasing nearly in proportion an ice cloud has developed. The colder the experiment, the
to the action of the pump. After the pumping stops, the ice more wall dominated it typically becomes, so that experi-
ments show steadily increasing long-term supersaturations
Atmos. Chem. Phys., 20, 1089–1103, 2020 www.atmos-chem-phys.net/20/1089/2020/B. W. Clouser et al.: No anomalous supersaturation in laboratory cold cirrus 1095
perature – with saturation vapor pressure as the single free
parameter. That is, we assume saturation vapor pressure over
ice is esat = xei , where ei is the Murphy–Koop saturation va-
por pressure (Murphy and Koop, 2005) and x is a constant
scale factor separately fit for each experiment. The model
predicts the evolving chamber vapor pressure, and we fit that
prediction to the observed H2 O vapor pressure, minimizing
the difference between observed and calculated values.
3.1 Ice growth model
The model is obtained by rearranging an expression for the
diffusional growth rate over ice (Pruppacher and Klett, 1997)
to calculate the far-field water vapor pressure:
ṁLi Li Mw ṁRT∞
Figure 3. Average measured saturation of the 28 IsoCloud exper- e = xei 1 + −1 + . (1)
4π rka∗ T∞ RT∞ 4π rαDv∗ Mw
iments after relaxation back to a near-constant value. Supersatura-
tions plotted are the average value of the final 200 s of pumping. Ex- Measured and derived quantities here are ṁ, the per-particle
periments are colored by aerosol/IN type: Arizona test dust (ATD, growth rate (change in total ice mass/time/particle number);
black), liquid sulfuric acid droplets (SA, red), secondary organic r, the average particle radius; T∞ , the gas temperature in the
aerosol (SOA, green), and experiments containing both ATD and
chamber; and we identify the far-field vapor pressure e as the
SA (blue). Warm, cirrus-dominated experiments (T ≥ 195 K) typi-
measured vapor pressure. Parameters are Mw , the molar mass
cally show vapor pressures close to MK, with saturations from 0.98
to 1.00. Cold, wall-dominated experiments (below ∼ 195 K) show of water; Li , the latent heat of sublimation; Dv∗ , the diffusiv-
saturations that rise with decreasing temperature. Higher supersatu- ity of water in air with kinetic corrections; α, the accommo-
ration is necessary for the cirrus growth rate to match the mass flux dation coefficient; and ka∗ , the thermal accommodation co-
off the chamber walls. This effect means that an ice growth model efficient, which is taken here to be unity (Fung and Tang,
is necessary to extract the saturation vapor pressure. Water vapor 1988). The average radius of the ice particles, r, is calculated
retrievals during the pumping interval in Experiment 33 are quite from the total ice water mass and particle number counts de-
subsaturated with respect to MK. scribed previously, and a temperature-dependent ice density.
The bulk density of ice varies by about 1 % between −10 and
−100 ◦ C; the values used in this work are from a quadratic fit
with respect to Murphy–Koop saturation (MK) as tempera- to data from Eisenberg et al. (2005), which are based on the
ture decreases, rising by approximately 5 % over the temper- X-ray diffraction measurements of La Placa and Post (1960).
ature range 225–185 K (Fig. 3). This rise should not be in- We assume the particles are spherical, which is a reasonable
terpreted as the result of a temperature-dependent saturation approximation for small, micrometer-sized particles. The dif-
vapor pressure, but instead as a temperature-dependent bal- fusivity of water vapor in air, Dv∗ , is also temperature de-
ance between wall flux and diffusional ice growth. The wall pendent, and is evaluated using the functional form of Prup-
flux contribution is relatively larger for colder experiments pacher and Klett (1997), which includes kinetic corrections
because saturation vapor pressure falls sharply with reduced (Okuyama and Zung, 1967; Fitzgerald, 1972). Note that one
temperature and the diffusional ice growth rate drops with limitation of this method is that it can yield only a bulk value,
vapor concentration. The result is that the colder the temper- and is not sensitive to situations in which a small subset of
ature, the larger the supersaturation over ice required to pro- ice crystals are metastable.
duce steady-state relative humidity. For this reason we use
an ice growth model to retrieve saturation vapor pressure by 3.2 Confounding issues and corrections
modeling vapor pressure evolution during each experiment.
The model, fitting procedure, and uncertainty analysis are de- We apply sensitivity tests or corrections to three issues that
scribed in Sect. 3. might confound analysis: loss of ice crystals by pumping, un-
certainty in the accommodation coefficient, and undercount-
ing of particles. The issues are sufficiently unproblematic
3 Analysis that they are not included in the formal uncertainty analysis
of Sect. 3.5.
We model the vapor pressure evolution during each experi- The pseudo-adiabatic expansion procedure during exper-
ment assuming diffusional growth to a sphere (Eq. 1). Model iments results in a loss of ice mass as air is removed from
inputs are all measured or derived from measured quantities the chamber. This loss must be accounted for in order to ac-
– ice mass, particle number, growth rate, pressure, and tem- curately estimate ice mass change by sublimation/deposition
www.atmos-chem-phys.net/20/1089/2020/ Atmos. Chem. Phys., 20, 1089–1103, 20201096 B. W. Clouser et al.: No anomalous supersaturation in laboratory cold cirrus
to/from the vapor. The pumps remove a constant volume of ments, where particle sizes are smallest, but still remains un-
gas from the chamber in each time interval, and we assume der +2.5 % even in the most extreme case tested.
that they act in the same manner upon the small ice parti-
cles found in our experiments. With this assumption, we cor- 3.3 Ability to diagnose saturation vapor pressure
rect the ice growth rate by subtracting the assumed pumping
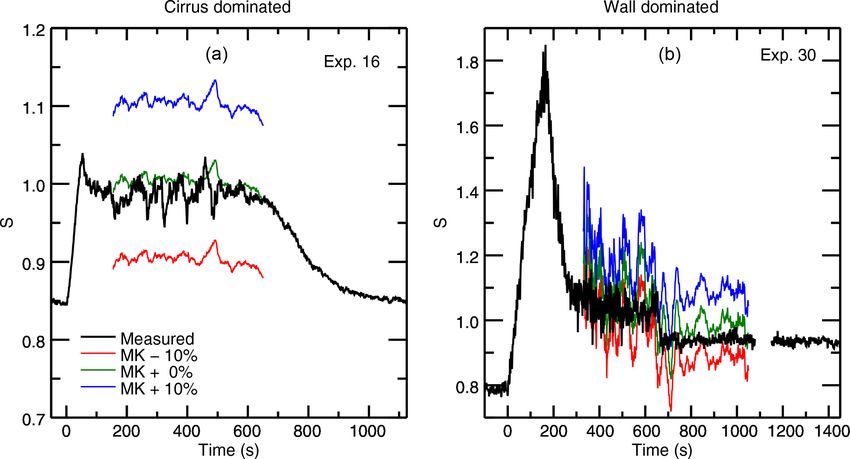
losses from the derivative of the cirrus ice mass. Before fitting our experimental data, we conduct a prelimi-
The accommodation coefficient α in Eq. (1) is not well nary proof-of-concept exercise to evaluate whether the vapor
constrained, with significant variation in the literature. α can pressure model is indeed sensitive to assumptions about satu-
be thought of as the probability that a molecule of water ration vapor pressure. We calculate evolution of the chamber
vapor that strikes the surface of an ice particle is incorpo- vapor pressure during selected representative experiments
rated into the ice matrix, and can be sensitive to experimen- under three different assumptions of saturation vapor pres-
tal conditions. For similar chamber experiments, studies have sure values: MK saturation, and MK multiplied by factors
shown that the accommodation coefficient can be treated as a of 1.1 and 0.9. Comparing these calculations to the observed
constant during an experiment (Lamb et al., 2020) with val- values, we see that even small changes in the assumed satu-
ues close to 1 (Skrotzki et al., 2013; Lamb et al., 2020). We ration vapor pressure result in significant deviations from the
test the sensitivity of our vapor pressure model to uncertainty measured chamber water vapor in both cirrus-dominated and
in the accommodation coefficient by running the model with wall-dominated experiments (Fig. 4). Results suggest that ex-
different values of α, and find that the derived results for satu- periments are sufficiently sensitive to resolve differences in
ration vapor pressure are quite insensitive to the exact values saturation vapor pressure of a few percent. This test estab-
of α in the range of 0.2 to 1 (Fig. S8 in the Supplement). lishes that observations of chamber vapor pressure during ice
We therefore use a value of 1 throughout this work, but note growth can in fact constrain the saturation vapor pressure in
that if the true α value is below 0.2, then this assumption will all the IsoCloud experiments.
result in an overestimate of the saturation vapor pressure.
Undercounting of particles may occur because the Welas 1 3.4 Fitting procedure and region choice
optical particle counter has a size cutoff for small particles of
0.7 µm in diameter. In these experiments, we never see ev- The model is fit to the observed chamber vapor pressure us-
idence of very large particles, but very small particles are ing least-squares optimization. We use MPFIT (Markwardt,
common at the beginnings and ends of experiments, imme- 2009), a Levenberg–Marquardt least-squares minimization
diately after nucleation or towards the end of sublimation, re- routine written in IDL, based on the MINPACK algorithm
spectively. For some experiments at the coldest temperatures, (Moré, 1978). This routine attempts to minimize the differ-
where initial water vapor and final ice mass are small, we ence between the model and observation by varying the scal-
also expect undercounts throughout the experiment. Mean ing factor x in Eq. (1), which multiplies the Murphy–Koop
particle size in these experiments is strongly temperature de- parametrization of the saturation vapor pressure over ice. The
pendent, ranging from ∼ 1 µm at 189 K to ∼ 5 µm at 235 K. fit routine yields a single value of x for each experiment,
Failure to account for undercounting would lead to an overly which is multiplied by MK saturation to best fit the obser-
large average radius, and could produce a low bias in re- vations.
trieved saturation vapor pressures. The fit region for each experiment is selected using three
We deal with the undercounts in two ways: we exclude all criteria. (1) The fit region must start after the maximum ice
time periods in which the calculated average radius is less particle number count has been attained. In most experi-
than 0.85 µm, and we conduct sensitivity tests on the result- ments, the maximum particle count is achieved within about
ing analyses. In several of the colder experiments, however, 50 s of the peak in saturation associated with the onset of
the mean calculated radius remains below 1 µm throughout nucleation. During the preceding brief period of rapid ice
the experiments. In these marginal cases assuming a log- growth, significant particle undercounts are likely. (2) We
normal distribution produces estimated undercounts of up to exclude all time periods when the Welas 1 instrument re-
50 % throughout the experiment (see Supplement for details ports fewer than 12 ice particles per cm3 . This criterion typ-
of this calculation). We therefore conduct sensitivity analy- ically excludes the late portions of experiments when the ice
ses on all experiments of uncertainty due to potential under- cloud has almost completely decayed. (3) We exclude all the
counting by increasing ice particle counts by factors of 1.5, time periods in which the average particle radius is less than
2, and 5 (Fig. S9). Undercounting can result in underestima- 0.85 µm, as described in Sect. 3.2, again because particle un-
tion of saturation vapor pressure, but most IsoCloud exper- dercounts are likely. This criterion becomes relevant for cold
iments show a sensitivity of less than ±0.5 % in retrieved experiments, in which vapor pressures are low and particles
saturation vapor pressure, even in the unrealistic case of un- grow slowly and remain small (in IsoCloud experiments at
dercounting by a factor of 5. Maximum sensitivity to under- temperatures below 195 K, average particle radius remains
counting occurs in the three homogeneous nucleation experi- under 1.5 µm at all times). These criteria result in an average
fit region length of ∼ 700 s. The shortest fit region is 259 s
Atmos. Chem. Phys., 20, 1089–1103, 2020 www.atmos-chem-phys.net/20/1089/2020/B. W. Clouser et al.: No anomalous supersaturation in laboratory cold cirrus 1097
Figure 4. Model output for experiments used in the previous example: the cirrus-dominated Experiment 16 (a) and wall-dominated Experi-
ment 30 (b). Each output is calculated using observed quantities under three different assumptions about the “true” saturation vapor pressure
of cirrus. The red line assumes the true value is 10 % lower than the MK saturation vapor pressure, the blue line assumes it is 10 % higher,
and the green line assumes MK is the true saturation vapor pressure. Calculated saturations are smoothed by 30 points (∼ 30 s). Measured
saturations are unsmoothed. Experiments are very sensitive to the assumed vapor pressure, although wall-controlled experiments are noisier
overall since they are typically at lower temperatures. Experiment 16 shows spikes in measured water which are due to real sampling of
different air masses during the turbulent period when the pumps are on and the cirrus cloud is growing. Experiment 30 shows oscillations
in the model output due to in-mixing of warmer air from the top of the chamber. This type of temperature fluctuation is not captured by the
model.
(Experiment 9) and the longest fit region is 1647 s (Experi- error bar associated with instrumental uncertainty. Sarkozy
ment 21). Colder experiments tend to have longer fit regions, et al. (2020) estimate that mechanical vibrations and cham-
since in these experiments the ice cloud can linger for tens of ber inhomogeneities result in optical path length fluctuations
minutes after pumping has ceased. of about 0.1 %. Due to the rapid timescales of these fluctu-
ations, their associated uncertainty is added directly into the
3.5 Uncertainty analysis instrumental uncertainty budget.
The primary source of systematic offsets is uncertainty
We calculate error bars for each experiment that reflect un- in the spectroscopic parameters used to retrieve water va-
certainties from several sources: intrinsic measurement pre- por concentrations from the observed spectral features. All
cision for water vapor and other key observables, uncer- spectroscopic parameters are taken from the HITRAN 2016
tainty due to experimental artifacts (e.g., chamber inhomo- database (Gordon et al., 2017), which provides uncer-
geneities that affect model fits), and systematic offsets (e.g., tainty estimates for several parameters used in this analysis,
line strength errors that produce multiplicative errors in de- namely line strength (S), air-broadened half-width (γair ), and
rived vapor pressures). We group the first two categories, the temperature-dependence coefficient (nair ) of γair . Line
measurement precision and chamber artifacts, under the term strength errors arise in two ways: through raw uncertainty
“instrumental uncertainty”. of the measured line strength at the reference temperature
Instrumental uncertainty for each experiment is calculated of 296 K, and through uncertainty in the measured experi-
using the Monte Carlo method: for each experiment, we gen- mental gas temperature that propagates to uncertainty in the
erate 2000 parameter sets in which each physical parame- calculated temperature-dependent line strength. The ChiWIS
ter used in the calculation is randomly drawn from its es- instrument uses the H2 O line at 3789.63481 cm−1 , which has
timated distribution, and then we run the fit routine on each a stated 1σ uncertainties in S, γair , and nair of ±1 %, ±1 %,
set. See Table S1 for the list of parameters varied and their as- and ±10 %, respectively, in HITRAN 2016. Uncertainty in S
sumed distributions. AIDA chamber temperature uncertainty propagates directly into a ±1% systematic uncertainty in re-
of 0.3 K is included in this table as a random variable, al- trieved concentrations. The uncertainties in γair and nair cor-
though the temporal correlation of temperature errors is not respond to uncertainties in concentration retrieval of 0.5 %
well known. Resulting error bars may therefore be slightly and 1.5 %, respectively, in the typical temperature and pres-
underestimated. The resulting distribution of saturation va- sure range of the IsoCloud experiments. AIDA chamber tem-
por pressure values is nearly normal in each experiment, and perature uncertainty is assumed to be randomly distributed,
we take its standard deviation to be the component of the
www.atmos-chem-phys.net/20/1089/2020/ Atmos. Chem. Phys., 20, 1089–1103, 20201098 B. W. Clouser et al.: No anomalous supersaturation in laboratory cold cirrus
and contributes an additional line strength uncertainty of (1998), which suggests that the entropies of cubic and hexag-
0.1 % (note that typical temperature declines of 5–9 K dur- onal ices are nearly identical, we assume the same is true of
ing expansion experiments are automatically incorporated in ice Isd and extrapolate the measured values of Shilling et al.
the retrievals). Systematic errors due to uncertainty in spec- (2006) to temperatures higher than their measurement range
troscopic parameters are added directly to the calculated er- of 181–191 K (Fig. 5, blue dashed curve). The properties of
ror bars, and in all but the coldest experiments are the dom- metastable ice I are likely dependent on its method of prepa-
inant source of uncertainty. A final contribution to system- ration, and it is thus possible that ice grown through depo-
atic uncertainty comes from uncertainty in the length of the sition from the vapor may have a different vapor pressure
ChiWIS free space etalon, which propagates directly into the than ice prepared by annealing amorphous ice, as is done by
wavelength scale and contributes an estimated 0.2 % to all Shilling et al. (2006).
experiments. Some differences are apparent between experiments with
Several other factors produce uncertainties on timescales different ice nucleating particles, so we focus first on those
of days or shorter and are treated here as contributing to the with only solid particles (Arizona test dust, black points in
instrumental uncertainty budget. Uncertainty in White cell Fig. 5). These experiments cover a temperature range from
optical path length due to mechanical vibrations and chamber 235 to 193 K and have low 1σ instrumental uncertainty of
inhomogeneities occurs at rapid timescales and is estimated less than +0.5 % (see Fig. S6, which shows model results
at 0.1 % (Sarkozy et al., 2020). Thermal expansion and con- labeled by experiment number and plotted with only instru-
traction of the whole chamber over the experimental temper- mental uncertainties). They show no temperature-dependent
ature range produces uncertainty of 0.1 % in the White cell effects that could explain anomalous supersaturations ob-
path length and is day specific, since the chamber is run at a served in field experiments. Derived saturation mixing ra-
constant base temperature on each experimental day. Finally, tios throughout the experimental temperature range are all
the fit routine itself involves intrinsic uncertainty that is also consistent to within 2σ instrumental uncertainty (i.e., 1 %
likely day specific, since fits for each experimental day are of MK).
typically done as a group and share typical temperature and To test more carefully for any trend in saturation vapor
water vapor concentrations. Sensitivity tests suggest that the pressure with temperature, we also perform a total least-
choice of fit parameters (baseline, fit region, etc.) over a rea- squares two-parameter fit on the ATD model results. Since
sonable set of values may alter retrieved concentrations by we intend here to examine differences between different
about 1 %. types of experiments, we only consider instrumental, day-,
Because the final output of the analysis is the relationship and experiment-specific uncertainties, and leave out the sys-
of saturation vapor pressure to temperature x(T ), we must tematic uncertainties which are uniform across all experi-
consider a final source of uncertainty, that each experiment ments. This line-fitting method takes into account uncertainty
produces a single value for x but spans several degrees of in both variables (in our case, experimental temperatures and
cooling. We therefore construct horizontal error bars to ac- instrumental uncertainties) rather than ascribing uncertainty
knowledge the spread in T , assigning them the standard de- only to a dependent variable. The fit yields an intercept of
viation of chamber temperatures during the experimental fit 98.6 % ± 0.3 % of MK at the mean temperature of 209.3 K,
period. These error bars are typically smaller in warmer ex- and a slope of −0.027 % K−1 ± 0.031 % K−1 . The experi-
periments, since fit regions in that regime lie almost com- ments are consistent with MK to well within their ∼ ±4.5 %
pletely within the time interval when the wall heat flux bal- systematic uncertainty. The fitted trend with temperature is
ances the adiabatic cooling. Horizontal error bars are larger not significant, equivalent to a change over the 40◦ K Iso-
in colder experiments since the ice cloud often persists for Cloud range of 1.1 % ± 1.2 % of MK saturation.
some time after the pumps turn off and the chamber begins The experiments performed at the highest temperatures in
to warm back to its base temperature. IsoCloud also demonstrate that the ice growth model used in
this work does not introduce artifacts into the retrieved satu-
ration vapor pressures. In these experiments (numbers 3–17,
4 Results at T = 205–235 K), ice particle number is high and ice cloud
growth dominates, so the chamber vapor pressure should
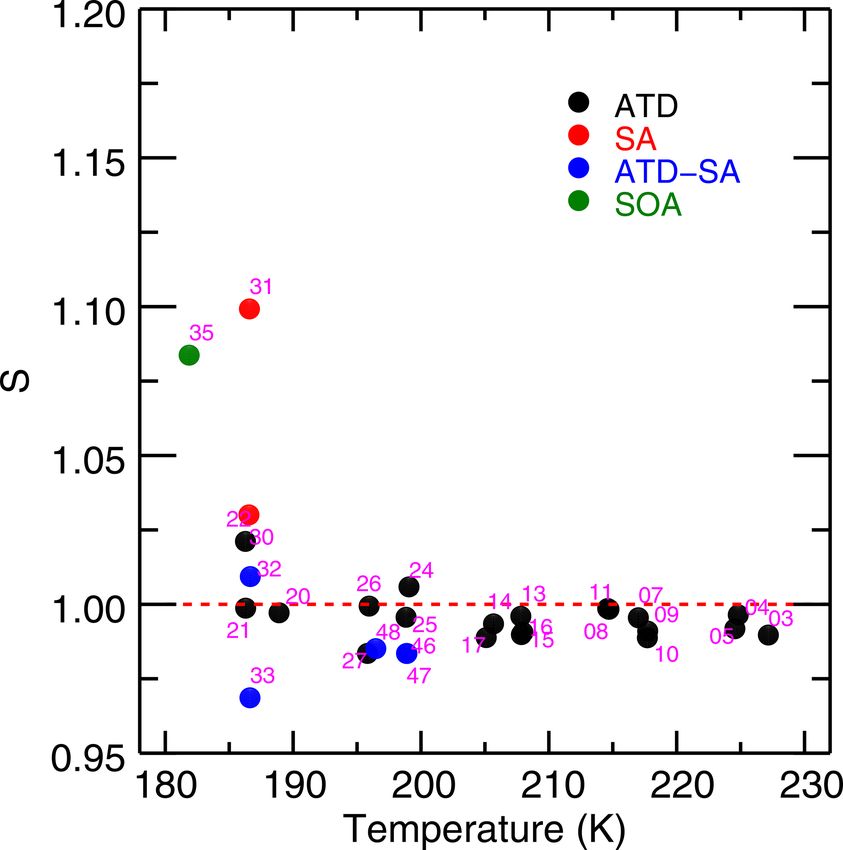
Results of fitting the IsoCloud experiments show a satura- draw down quickly to saturation. The values to which these
tion vapor pressure consistent with MK, with no increase experiments relax (shown in Fig. 3) are effectively identi-
in retrieved saturation vapor pressures at low temperatures cal to those derived in our more complex analysis proce-
(Fig. 5). Murphy and Koop (2005) estimate the vapor pres- dure: 98.0 %–100.0 % in the simple calculation of Fig. 3, and
sure of cubic ice to be 3 %–11 % above that of hexagonal ice, 97.5 %–99.5 % in the fits of Fig. 5. This similarity confirms
and our measurements are consistent with the lowest postu- that the use of an ice growth model does not bias the derived
lated values for its vapor pressure. All experiments are incon- saturation vapor pressure values.
sistent with the range of vapor pressures given for metastable Experiments in which liquid aerosols are present result
ice by Shilling et al. (2006). Following the work of Tanaka in derived saturation vapor pressures on average lower than
Atmos. Chem. Phys., 20, 1089–1103, 2020 www.atmos-chem-phys.net/20/1089/2020/B. W. Clouser et al.: No anomalous supersaturation in laboratory cold cirrus 1099
Figure 5. Retrieved saturation vapor pressures for the 28 IsoCloud experiments fitted, expressed as a fraction of MK saturation, and plotted
against mean experiment temperature. The red dashed line represents MK saturation. The blue dashed line represents the Shilling et al.
(2006) value for the vapor pressure of metastable ice, and the blue dotted lines show the errors of that measurement. Experiments are colored
by aerosol/IN type: Arizona test dust (ATD, black), liquid sulfuric acid droplets (SA, red), secondary organic aerosol (SOA, green), and
experiments containing both ATD and SA (blue). All experiments that include solid dust (black, blue) undergo heterogeneous nucleation;
those with SA or SOA only (red, green) undergo homogeneous nucleation. Horizontal error bars are the standard deviation of the temperatures
over the fit region. Vertical error bars show both the 1σ instrumental uncertainty (thick width), which is greater at colder temperatures, and the
larger systematic linestrength uncertainty (thin width), which is identical for all experiments. Derived saturation vapor pressures in general
are consistent with MK (to within systematic uncertainty), and exhibit no trend with temperature for each aerosol type (to within instrumental
uncertainty). Note that the fitting procedure means that Experiment 33, the outlier in Fig. 3, yields a saturation vapor pressure consistent with
other experiments. Experiments do show lower values in the cases where liquid aerosols are present. Compare to Fig. A2 in Fahey et al.
(2014).
those with only ATD, although only a single experiment is in-
consistent given the instrumental uncertainty (Fig. 6, which
shows experiments below 205 K and instrumental-only er-
ror bars). All experiments with sulfuric acid aerosols present
show slightly lower vapor pressures than experiments with
only solid ice nucleating particles (black). Heterogeneous
nucleation experiments show a slight effect (blue) and ho-
mogeneous nucleation experiments with only liquid aerosols
show a stronger one (red, green). ATD experiments are on
average 1.4 % below MK; ATD-SA points are on average
2.7 % below; and the three homogeneous nucleation exper-
iments are 4 %–10 % below MK (note that these experiments
have large instrumental uncertainty, as they are cold and dry).
Total least-squares fits to the ATD and ATD-SA experiments
show that they are not significantly different from each other.
The intercept at the ATD-SA mean temperature of 196.0 K
is 97.3 % ± 0.8 %, which is lower than but overlaps with the
expected ATD value at that temperature of 98.2 % ± 0.5 %.
ATD-SA experiments show no significant temperature de- Figure 6. Zoomed in view of the experiments below 205 K.
pendence in deviation from MK saturation vapor pressure Linestrength errors result in the same shift for all experiments, so
(fitted slope = −0.03 % K−1 ± 0.2 % K−1 ). they are not included in the error bars here. Experiments containing
One possible explanation is that liquid aerosols may intro- sulfuric acid are ∼ 2.6 % lower on average than those containing
pure ATD experiments. Experiments are colored by aerosol/IN type
duce some additional factor that depresses the implied satu-
and MK saturation line is included for reference.
ration vapor pressure in our analyses. These experiments take
place at cold temperatures and are probably subject to under-
www.atmos-chem-phys.net/20/1089/2020/ Atmos. Chem. Phys., 20, 1089–1103, 2020You can also read