North West Shelf Flatback Turtle Conservation Program Strategic Conservation Plan 2014-21 - Western Australia
←
→
Page content transcription
If your browser does not render page correctly, please read the page content below
North West Shelf Flatback Turtle Conservation Program
                Strategic Conservation Plan 2014–21

                                   Marine Turtles
                                   Western Australia
                                   North West Shelf Flatbacks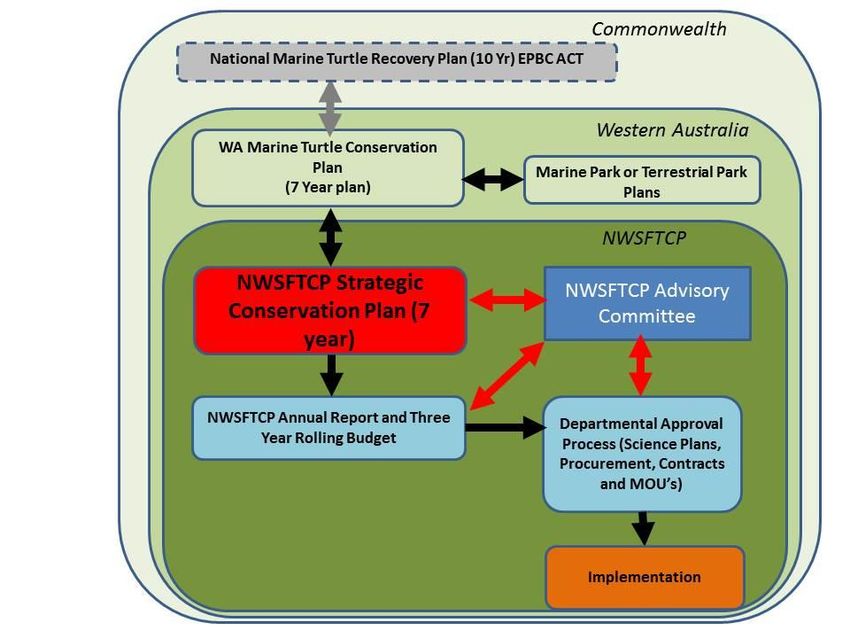
Department of Biodiversity, Conservation and Attractions (DBCA)
Locked Bag 104, Bentley Delivery Centre, WA, 6983

Phone (08) 9219 9000
Fax (08) 9334 0498
dbca.wa.gov.au

© Department of Biodiversity, Conservation and Attractions on behalf of the State
of Western Australia, November 2017

This work is copyright. You may download, display, print and reproduce this
material in unaltered form (retaining this notice) for your personal, non-commercial
use or use within your organisation. Apart from any use as permitted under the
Copyright Act 1968, all other rights are reserved.

This plan was developed with critical input from the North West Shelf Flatback
Turtle Conservation Program Advisory Committee and associated Expert Panel.

This publication was prepared by Scott Whiting, Holly Raudino, Tony Tucker,
Stuart Field, Chris Simpson, Alan Kendrick, Sabrina Fossette, Liz Grant and Hannah
Hampson.

The purpose of this document is to outline conservation actions during the first
seven years of the North West Shelf Flatback Turtle Conservation Program. These
actions were developed using a decision process to objectively identify priorities
for conservation. The details of specific management actions will be defined in
internal planning documents. This document has been in operation since 2014, in
draft format, and was finalised in 2016.

Questions regarding the use of this material should be directed to:
Principal Scientist, Marine Science Program, Science and Conservation Division
Department of Biodiversity, Conservation and Attractions
Locked Bag 104, Bentley Delivery Centre WA 6983
Phone (08) 9219 9752
Email scott.whiting@dbca.wa.gov.au

The recommended reference for this publication is:
Department of Biodiversity, Conservation and Attractions, 2017, North West
Shelf Flatback Turtle Conservation Program Strategic Conservation Plan 2014–21,
Department of Biodiversity, Conservation and Attractions, Perth.

This document is available in alternative formats on request.
North West Shelf Flatback Turtle Conservation Program
             Strategic Conservation Plan 2014–21

                                       Marine Turtles
                                       Western Australia
                                       North West Shelf Flatbacks
Executive summary
The North West Shelf Flatback Turtle Conservation Program (NWSFTCP) is one of
two additional conservation programs delivered from the Gorgon Gas Project via the
Variation Agreement (2009) of the Barrow Island Act (2003). This plan is a road map
for flatback conservation over a seven-year period and describes strategic
management actions to be delivered under two objectives:
   1) to increase the conservation and protection of the North West Shelf flatback
      turtle population; and
   2) to provide sufficient data to allow the Advisory Committee (AC) to assess
      whether the Gorgon project is having a “significant” impact on the North West
      Shelf flatback turtle population. This should include advice to the Director
      General as to whether the State should make any request to begin the North
      West Shelf Flatback Turtle Intervention Program.
The plan was developed using a decision support system to prioritise activities in the
most relevant and important areas. Management actions were focused around
pressures to the North West Shelf flatback turtle management unit (MU) although
many overarching actions including systems development, knowledge gaps,
baseline information and ongoing monitoring were recognised as fundamental.
The management actions within the plan were developed with five implementation
strategies: administrative frameworks, education (including communication and
public participation), intervention, research and monitoring.
Overarching actions include: development of data management frameworks,
operational systems, knowledge transfer, communication and education, designing
comprehensive monitoring programs and filling knowledge gaps. Knowledge gaps
include MU definition, identifying and ranking rookeries, identifying foraging habitats
and understanding the connectivity between life stages and habitats. A major activity
before the next plan will be to undertake a comprehensive vulnerability assessment
including risk/exposure mapping to ensure all new knowledge is incorporated into
future planning resulting in cost efficient conservation outcomes.
Major pressures to the MU include light impacts on adults and hatchlings at
rookeries and predation by introduced animals at rookeries. Moderate pressures
include global temperature increases, sea level rise, beach modification and impacts
from marine debris. To address these pressures, studies will be conducted to
understand and quantify impacts in conjunction with intervention actions to reduce or
mitigate these pressures.

This plan has identified assessment criteria at multiple levels to assist in assessing
the delivery of the NWSFTCP. At the end of this plan period it is expected that the
monitoring program is fully established to help understand both the condition of the
flatback turtle MU and the pressures upon it and that mitigation actions are in place
to reduce current pressures.

                                           1
Contents
   Executive summary ................................................................................................. 1
Glossary ...................................................................................................................... 6
Acronyms .................................................................................................................... 8
   Scope ...................................................................................................................... 9
   Vision ..................................................................................................................... 10
   1      Introduction ..................................................................................................... 11
       1.1     Marine turtles ........................................................................................... 11
       1.2     Flatback turtles......................................................................................... 11
          1.2.1      Conservation status........................................................................... 12
          1.2.2      Management units ............................................................................. 12
          1.2.3      Nesting distribution ............................................................................ 12
          1.2.4      Foraging range .................................................................................. 12
          1.2.5      Major gaps in understanding ............................................................. 13
             1.2.5.1 Identification of management units .............................................. 13
             1.2.5.2 Foraging habitat and diet ............................................................. 14
             1.2.5.3 Post hatchling dispersal and habitat ............................................ 14
             1.2.5.4 Mating locations and inter-nesting habitats .................................. 14
             1.2.5.5 Population demographics ............................................................ 14
             1.2.5.6 Thermal biology ........................................................................... 14
          1.2.6      Key indicators .................................................................................... 15
       1.3     North West Shelf Flatback Turtle Conservation Program offset ............... 15
          1.3.1      Funding ............................................................................................. 15
       WA Environmental Offsets ................................................................................ 16
          1.3.2      Definition ........................................................................................... 16
          1.3.3      Geographic scope ............................................................................. 18
          1.3.4      Establishment of the NWSFTCP ....................................................... 18
          1.3.5      Oversight and governance ................................................................ 19
          1.3.6      Establishment of Advisory Committee and Scientific Panel of Experts
                     19
          1.3.7      Role of the Advisory Committee and Scientific Panel of Experts ...... 19
          1.3.8      North West Shelf Flatback Turtle Intervention Program .................... 20
          1.3.9      Annual reporting ................................................................................ 20

                                                               2
1.3.10 Communication of program ............................................................ 20
1.3.11 Budget............................................................................................ 20
2 NWSFTCP objectives .................................................................................... 21
2.1 Objectives ................................................................................................ 21
3 Planning approach 2014–21 .......................................................................... 23
3.1 Overview .................................................................................................. 23
3.1.1 Conservation priorities – via prioritisation process ............................ 24
3.1.1.1 Decision process ......................................................................... 24
3.1.1.2 Scoring the matrix ........................................................................ 24
4 Results of the prioritisation matrix and decision framework ........................... 24
4.1 Conservation priorities for North West Shelf flatback turtles .................... 24
4.1.1 Light impact on behaviour of nesting adults and hatchlings – onshore
and offshore sources (See Appendix 1 for description of pressure) .............. 25
Specifically, for this MU, this pressure relates to the potential impacts in
relation to industrial light around Barrow Island, Dampier Archipelago and
Cape Lambert Port, industrial and urban light around Port Hedland and
offshore light from anchored ships in the regions of Onslow/Ashburton River
Area and Dampier Archipelago and Port Hedland. ........................................ 25
4.1.2 Introduced animals predating on eggs and hatchlings (See Appendix 1
for description of pressure) ............................................................................ 25
4.1.3 Global temperature increase - climate change (See Appendix 1 for
description of pressure) ................................................................................. 25
4.1.4 Modification of beaches - coastal development (See Appendix 1 for
description of pressure) ................................................................................. 26
Specifically, for this MU, this refers to altered beaches through anthropogenic
actions such as coastal developments and industrial or urban development.
This refers to the loss or alteration of habitat with potential areas including
Barrow Island, Dampier Archipelago and Port Hedland. ............................... 26
4.1.5 Sea level rise and altered storm frequency and severity - climate
change (See Appendix 1 for description of pressure) .................................... 26
4.1.6 Marine debris including entanglement and ingestion (See Appendix 1
for description of pressure) ............................................................................ 26
4.2 Research priorities ................................................................................... 26
5 Conservation priorities, management strategies and management actions .. 29
5.1 Conservation priorities ............................................................................. 29
5.2 Strategies and management actions........................................................ 29
5.2.1 Management objectives and management targets ............................ 30
35.2.2 Management actions ......................................................................... 31
5.3 Implementation of conservation priorities ................................................. 31
5.3.1 Conservation priority – overarching actions (H) ................................ 32
5.3.1.1 Overarching actions– administrative frameworks (OA AF) .......... 32
5.3.1.2 Overarching actions – education, communication and public
participation (OA E) .................................................................................... 34
5.3.1.3 Overarching actions - intervention/mitigation (OA I) .................... 36
5.3.1.4 Overarching actions - Research (OA R) ...................................... 37
5.3.1.5 Overarching actions - monitoring (OA M)..................................... 40
5.3.2 Conservation priority – Pressure 1 - Impacts of onshore and
nearshore light (HIGH) .................................................................................. 41
5.3.3 Conservation priority – Pressure 2- Introduced animals (HIGH)........ 42
5.3.4 Conservation priority – Pressure 3 - Increasing temperatures – climate
change (M) .................................................................................................... 43
5.3.5 Conservation priority – Pressure 4 - Modification to beaches (M) ..... 44
5.3.6 Conservation priority – Pressure 5 - Sea level rise (M) ..................... 45
5.3.7 Conservation priority – Pressure 6 - Marine debris ........................... 46
6 Reporting and evidence based assessment .................................................. 47
6.1 Reporting ................................................................................................. 47
6.2 Assessment ............................................................................................. 47
6.2.1 Efficiency ........................................................................................... 48
6.2.1.1 Administrative processes ............................................................. 48
6.2.1.2 Partnerships and value adding .................................................... 48
6.2.1.3 Student projects and post-doctoral scholarships ......................... 48
6.2.1.4 Third party projects and data ....................................................... 48
7 Plan amendments and review ....................................................................... 49
7.1 Plan amendments .................................................................................... 49
7.2 Structured reviews of plan ....................................................................... 49
7.2.1 2017 Review...................................................................................... 49
7.2.2 2019 Review...................................................................................... 49
7.2.3 6.1.3 Timing of reviews ..................................................................... 49
8 Conclusion ..................................................................................................... 50
9 Acknowledgements ....................................................................................... 50
References ............................................................................................................... 51
4A i. Assets defined ......................................................................................... 57
A ii. Potential pressures listed........................................................................ 58
A iii. Asset – Pressure link described ............................................................. 58
Direct death or injury – dredging - coastal development ............................ 59
Disturbance of turtles on beaches - tourism/people ................................... 59
Global temperature increase - climate change........................................... 59
Fishing bycatch .......................................................................................... 59
Illegal or unregulated take outside Australia .............................................. 59
Indigenous harvest ..................................................................................... 60
Introduced pests/feral animals ................................................................... 60
Light - onshore sources and offshore sources – coastal development ...... 60
Marine debris (ghost nets and other debris)............................................... 60
Marine habitat destruction – coastal development ..................................... 60
Modification of beaches – coastal development......................................... 61
Noise - dredging/piling - port development ................................................ 61
Noise – seismic .......................................................................................... 61
Sea level rise and altered storm frequency - climate change ..................... 61
Vessel strike and disturbance .................................................................... 61
Water pollution (acute) ............................................................................... 61
Water quality (chronic) ............................................................................... 61
Values of the asset (criteria for scoring) ..................................................... 62
Pressures on the asset (criteria for scoring)............................................... 64
9.1.1 Knowledge gaps (criteria for scoring) ................................................ 64
5Glossary
Term Description
General
Nesting The turtles that nest at a rookery (see below). This term is included as it is
population commonly used to refer to turtles that use rookeries such as Barrow
Island or Mundabullangana.
Management Management units are usually defined by genetic stock identity but
unit biological or other factors can also define a management unit. For the
purpose of this plan the management unit (MU) is the flatback turtles of
the summer breeding North West Shelf Management Unit in Western
Australia, as described by the Variation Agreement (2009) until further
redefined by genetic studies (see below).
Flatback turtles Defined in the Variation Agreement 2009 as “the flatback turtles of the
of the summer summer breeding North West Shelf Management Unit that nest along the
breeding North Pilbara and south west Kimberley coasts (including Barrow Island and
West Shelf Mundabullangana) which is distinct from the winter nesting rookeries of
management the Bonaparte Gulf (e.g. Cape Domett). This will remain the description
unit until redefined by genetics.
North West Used in the Variation Agreement (2009) and used interchangeably with
Shelf flatback management unit in this plan. For the terms of this plan, the “North West
turtle population Shelf flatback turtle population” or “management unit” will include all
summer nesters until redefined by genetics or other evidence (See
management unit).
Stock Stock refers to groups of animals with uniquely different genetic diversity
indicating reduced gene flow between groups (Moritz, 1994). These
groups have statistically different allele frequencies and if the group was
lost it would take centuries to millennia to replace.
The Recovery plan for marine turtles in Australia (2003) uses the term
“stocks” for flatbacks in Western Australia, these stocks are currently
being re-defined with additional genetic analysis, making management
unit a more suitable term for this plan (See management unit).
Rookery A colony of breeding turtles. This is commonly a beach, group of beaches
or island.
Plan
Categories
NWSFTCP The objectives for the NWSFTCP are directly derived from the objectives
objectives outlined by the Variation Agreement (2009).
Conservation A conservation priority is developed from the prioritisation framework and
priorities calculated from the multiplication of Value scores and Pressure scores.
High pressures were a primary driver for conservation priorities.
Management These objectives identify the primary aims of management. Management
objectives objectives were developed for each conservation priority obtained from
the prioritisation framework and for each management strategy within the
overarching actions.
Management The specific actions to be completed during the NWSFTCP Plan period,
actions measured by outputs and milestones
Management Five categories of actions: Administrative Frameworks, Education
strategy (includes communication and public participation) Intervention, Research
and Monitoring. Several of these have been used by the department and
the five listed are an extension of the categories stated in the Variation
Agreement (2009).
6Assessment
Terms
Measure of Criteria used to assess the performance of the plan against the
success objectives.
Management The desired end point of management in terms of this plan.
targets
Outcomes The short and medium term management result. These can include
changes in behaviour, attitudes, major results, additional protection or
major gains in understanding.
Outputs The direct products or deliverables of the management actions. Outputs
are tangible products such as data, reports, images, scientific papers,
communication products, databases, systems, media, people trained and
participants that show progress towards a target. Outputs and milestones
will be used to assess if management actions are being achieved.
Milestones Assessment points along the path to the management target to monitor
progress and provide enough time to make corrections to ensure the
program is on track. Milestones and outputs will be used to help assess if
management actions are being achieved.
7Acronyms
Acronym Meaning
AC Advisory Committee
AF Administrative frameworks
C Compliance
DCLM CEO Referenced in the Variation Agreement (2009). It refers to
the CEO of the former Department of Conservation and
Land Management. Currently this refers to the Director
General of the Department of Biodiversity, Conservation
and Attractions.
DPIRD Department of Primary Industries and Regional
Development
E Education
I Intervention/mitigation
M Monitoring
MU Management unit
NdS Natator depressus Summer Management Unit
NWS North West Shelf
NWSFTCP North West Shelf Flatback Turtle Conservation Program
OA Overarching actions
EPA Environmental Protection Authority, Department of Water
and Environmental Regulation
DBCA Department of Biodiversity, Conservation and Attractions
(formerly the Department of Parks and Wildlife)
PP Public participation
R Research
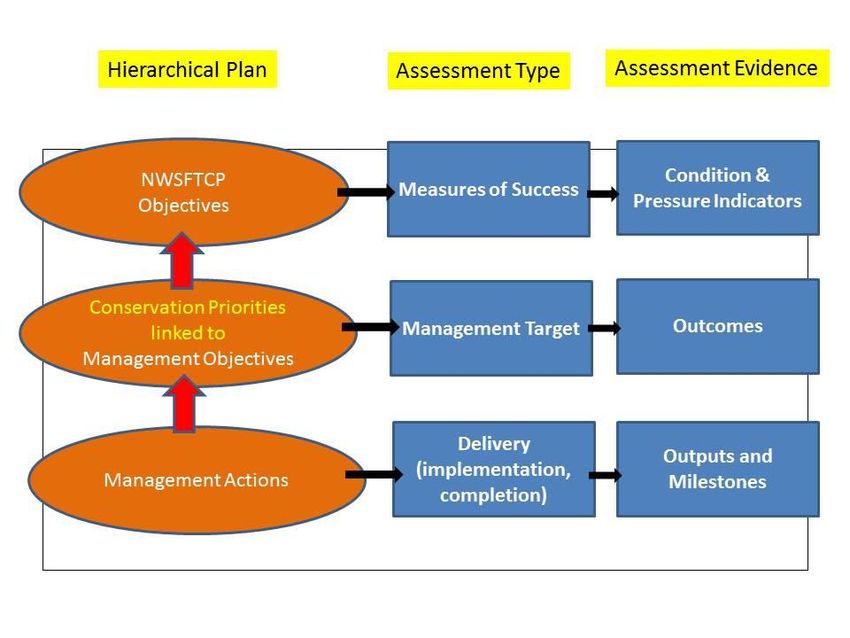
8Scope
The NWSFTCP Strategic Conservation Plan is nested within a planning framework
that underpins the conservation of marine turtles in Western Australia (Figure 1). A
parent plan, the Western Australian marine turtle strategic conservation plan (In
Prep.), will include other species. The NWSFTCP is one of two additional
conservation programs (similar to environmental offsets) delivered from the Gorgon
Gas Project via the Variation Agreement (2009) to the Barrow Island Act (2003). This
strategic plan sets out the direction of the NWSFTCP over seven years. Annual
reports and annual rolling operational plans will provide further detail of projects and
expenditure on an annual basis (Figure 1). Additional detailed documents, including
science project plans, are required within the Department of Biodiversity,
Conservation and Attractions (DBCA) to assist scientific planning.
This plan is intended to increase the conservation and protection of the North West
Shelf flatback turtle population using the actions within the following areas stated in
the Variation Agreement: a) by surveying, monitoring and research, b) reducing
interference to key breeding and feeding locations and c) establishing information
and education programs.
In addition, this program will provide sufficient information to allow the NWSFTCP
AC to advise the Director General of DBCA whether the Gorgon project is having a
“significant impact” on the North West Shelf flatback turtle population. Information
presented to the AC should be sufficient to allow them to advise the Director General
in relation to significant impact and whether the State should make any request to
begin the North West Shelf Flatback Turtle Intervention Program.
The breadth of the NWSFTCP means that all available knowledge will be used to
assess the conservation status of the North West Shelf flatback turtles, including
seeking access to third-party data from existing programs to help understand key
condition and pressure indicators. This includes seeking information and/or data
from the Gorgon Gas Project turtle programs. The NWSFTCP Strategic
Conservation Plan is approved by DBCA after advice is sought from the NWSFTCP
AC and Scientific Panel of Experts.
9Figure 1. The planning framework for marine turtles in WA. Black arrows represent
the process from the NWSFTCP through to implementation with the red arrows
representing the steps where the NWSFTCP AC can comment and provide advice.
The grey arrow indicates the connection with the Recovery Plan for Marine Turtles in
Australia.
Vision
Ensure that the North West Shelf flatback turtle population is resilient, sustainable,
no longer vulnerable and maintains its ecological, cultural and social values through
the implementation of a world class conservation program.
101 Introduction
1.1 Marine turtles
Six of the world’s seven species of sea turtles occur in Western Australian waters
and include green (Chelonia mydas), flatback (Natator depressus), loggerhead
(Caretta caretta), hawksbill (Eretmochelys imbricata), olive ridley (Lepidochelys
olivacea) and the leatherback (Dermochelys coriacea). All species, except the
leatherback turtles nest in WA. All nesting species, except olive ridley turtles, nest in
nationally and internationally significant numbers in WA. Non-breeding phases of the
lifecycle of all species also occur in WA.
1.2 Flatback turtles
Flatback turtles are endemic to Australia. All viable nesting occurs within Australia
despite anecdotal infrequent nesting occurring in Papua New Guinea and eastern
Indonesia and foraging ranges likely to extend into international waters. The flatback
life history is classified as Type 1 by Bolten (2003) (Figure 2) and is characterised by
the developmental period being contained within neritic continental shelf waters. This
pattern may be split further, with some individuals commonly feeding in shallow
waters (< 20m), while others are often found in 50-80 m (Pendoley et al 2014a).
Figure 2. Diagrammatic life history of the flatback turtle life cycle described as Type 1
emphasising no oceanic phase (redrawn from Bolten 2003).
111.2.1 Conservation status
Flatback turtles are listed as Data Deficient under the IUCN Red List, in Appendix 1
under CITES and a Priority for Conservation under the Convention of Migratory
Species. Nationally, flatbacks are listed as Vulnerable under the Environment
Protection and Biodiversity Conservation (EPBC) Act (1999) and under the Western
Australian Wildlife Conservation Act (1950) (set to change to Biodiversity
Conservation Act) they are listed in Schedule 3 (rare or likely to become extinct).
1.2.2 Management units
The flatback turtles of the summer breeding North West Shelf management unit,
defined by the Variation Agreement (2009), includes all summer flatback rookeries:
rookeries south of Onslow through to the central Kimberley and Cape Londonderry
at approximately 127 degrees longitude. Genetic analysis has not been completed
so biologically relevant units are not defined. Preliminary genetic work from an
honours thesis defined seven distinct flatback management units within Australia
with up to three management units in Western Australia, noting incomplete sample
coverage for WA (Pittard 2010). Flatback turtles nesting from Barrow Island and
Mundabullangana Station were within one management unit defined as the Rowley
Shelf (Pittard 2010). For the purposes of this plan the NWS flatback turtle population
will be interchangeable with the term management unit (MU). Genetically, the
northern boundary has not been defined.
1.2.3 Nesting distribution
In WA, flatback nesting ranges between the southern Pilbara to the Northern
Territory border (Pendoley et al. 2014b). Flatback rookeries have been identified by
DBCA through department records and the literature (Table 1). However, inventory
data is sparse and this table will most certainly be expanded in the next plan.
Quantitative surveys will further define the density as well as temporal and spatial
scale of nesting at each rookery.
1.2.4 Foraging range
Foraging sites have been identified through various post-nesting migration satellite
tracking studies over the past 10 years. Post-nesting migrations have shown that
foraging areas can be highly dispersed from the nesting beach with 22% within 500
km, 45% between 500-1000 km, 24% between 1000-1500 km and 9% greater than
1500 km (Pendoley et al. 2014a). Foraging habitat includes nearshore areas and
offshore areas to depths of 100 m (McFarlane and Mueller 2013; Pendoley et al.
2014a, DBCA unpublished data). The post-hatchlings and neonatal distribution is still
largely unknown.
12Table 1. Recognised flatback rookeries in WA as of 2015.
Rookery Region Site Source
Significance
Pilbara Barrow Island Chevron 2014
Very High Mundabullangana Chevron 2014
> 1000 Nests mainland coast
Delambre Island Rio Tinto unpublished data
Cape Domett Lacepede Whiting et al. 2012.
Kimberley Islands
High Pilbara
500-1000
Medium Pilbara Thevenard Island DBCA Island Database
100-500 Cape Lambert Rowcliffe et al2015
Bells Beach Rowcliffe et al 2015
Varanus Island DBCA Island Database
Cemetery Beach Robbins 2015; Waayers and Stubbs 2016
Low 10-100 Pilbara Onslow mainland No report available
Kimberley Eco Beach McFarlane 2015
Cable Beach McFarlane 2013
Unquantified Pilbara South Muiron Island
North Muiron Island
Airlie Island
Bridled Island
Angel Island
Dixon Island
Rosemary Island
Many other islands in
Dampier Archipelago
Serrurier Island
Other Islands in
Montebelllo Islands
Legendre Islands DBCA Island Database
Hauy Island DBCA Island Database
Montebello Islands – Likely to be high from anecdotal evidence
Hermite and Trimouile
Islands between Exmouth Likely to be high from Anecdotal evidence
Gulf and Cape Preston
Kimberley Larmarck Island
Bigge Island
Helpman Island
Lacepede Islands
Maret Islands
Eighty Mile Beach
East Montalivet Island
Many islands across
Kimberley
Beaches along the
Ballanggara coast (north-
east Kimberley)
1.2.5 Major gaps in understanding
There are several major gaps in knowledge for flatback turtles.
1.2.5.1 Identification of management units
Limited genetic sampling in WA has resulted in ill-defined management unit
boundaries. This should be resolved early in the life of the plan but remains a
13knowledge gap required to refine the design of any monitoring program. Until these
boundaries are re-defined, the MU will be described by the Variation Agreement
(2009).
1.2.5.2 Foraging habitat and diet
Spatial data identifying the location of flatback foraging has been gained through a
number of mechanisms including trawling by-catch prior to the introduction of turtle
exclusion devices and satellite tracking of post-nesting females. Although many
foraging locations are known, little is known about the habitat type and almost
nothing is known about diet. Diet is only known through data from stranded animals
from Queensland and includes sea pens and soft corals (Limpus 2009). Deep and
often turbid water has limited the ability to collect in-water information on flatback
turtles.
1.2.5.3 Post hatchling dispersal and habitat
Little is known about the dispersal behaviour of flatback hatchlings and their neonate
ecology. There is a recognition that neonates and juveniles remain predominantly on
the continental shelf but quantitative evidence is limited. Understanding this phase of
the life cycle will help to identify key habitats and associated pressures.
1.2.5.4 Mating locations and inter-nesting habitats
No mating or courtship areas have been identified in Western Australian waters.
Unlike other species where mating is often observed close to the nesting beach, no
records of regular flatback mating locations exist. Recent studies on the inter-nesting
habitats show displacement distances up to 62 km from the nesting beach (Whittock
et al. 2014).
1.2.5.5 Population demographics
Growth rates, age to maturity and survivorship parameters for non-nesting life stages
are not available for flatback turtles. A difficulty with sampling flatback turtle’s in-
water has meant that the non-nesting life-stages have remained unstudied.
1.2.5.6 Thermal biology
Thermal biology of flatback turtles is not well known in WA. Previous studies on
pivotal temperature in the Pilbara (Box 2010) and just recently through the
NWSFTCP (Stubbs et al. 2014) has progressed this in WA. Further studies using
climate change models (Stubbs et al. 2014) and resilience to increasing
temperatures (Tedeschi unpublished data; Tedeschi et al 2015) are assisting in
understanding the potential impact of climate change.
141.2.6 Key indicators
Key indicators are needed from strategic locations within the MU and at key life
stages. At a minimum, the status of some key parameters will be required from
Barrow Island and its reference site at Mundabullangana. An additional reference
site is likely to be required for the NWSFTCP, in case the first is compromised, but
also to add long term stability and representation. A selection process will be
conducted to select the most biologically and logistically suitable location. Key
demographic parameters will be essential to understand the functioning of the
stock/MU (Chaloupka & Limpus 2001; National Research Council 2010; Pfaller et al.
2013). At a minimum, key indicators required at the nesting beaches will be: annual
nesting abundance, survivorship, recruitment, nesting success, total annual clutches,
hatching and emergence success (this would include measures of total clutch
damage). In some cases, (years and locations) surrogates may need to be used.
Pressure indicators will include those related to beach pressures and may include
indices of: introduced animals, vehicles, light, shipping, sand temperature, sea level
rise and habitat modification.
Other key condition and pressure indicators will be required as the program
progresses. These may include habitat indices, diet, sex ratios, and pressures on
non-breeding life stages.
1.3 North West Shelf Flatback Turtle Conservation Program
offset
The NWSFTCP is one of two additional conservation programs delivered from the
Gorgon Gas Project at Barrow Island. These are described in the Variation
Agreement (2009) to the Barrow Island Act (2003). A summary of the key
components of the NWSFTCP are detailed below.
1.3.1 Funding
The NWSFTCP additional undertaking is funded at $1.5M pa for five years, $1M pa
for 25 years and $1M pa for a further 30 years subject to paragraph (C) (Variation
Agreement 2009) stating that “The further amounts referred to in paragraph (a)(iv)
shall only be payable if at the end of 30 years after the Relevant Date, the CALM Act
Minister, after reviewing the objectives of the Northwest Shelf Flatback Turtle
Conservation Program, its effectiveness to that date and planned ongoing program
of activities, notifies the Joint Venturers that in the CALM Act Minister’s reasonable
opinion there is a need for it to continue.”
All amounts are indexed to 2007 values using the Consumer Price Index All Groups
Perth published by the Australian Bureau of Statistics 3 months prior to 1 January
each year (formal for index adjustment – Variation Agreement 2009).
151.3.2 Definition WA Environmental
The NWSFTCP is defined and described by the Offsets
Variation Agreement (2009); The NWSFTCP is technically
“means an ongoing program of activities not an environmental offset
(excluding any activities to be undertaken by but mostly operates in a
the Joint Venturers in compliance with similar manner. In WA,
conditions of approval of the Project (including environmental offsets are
the Domgas Project) under this Agreement or outlined in a position
State or Commonwealth legislation including statement (Environmental
the EP Act or the Environment Protection and Protection Authority 2006),
Biodiversity Conservation Act 1999 (C’wlth)) to guidance document
be developed by the DCLM CEO and (Environmental Protection
implemented by the DCLM to increase the Authority 2008) and policy
conservation and protection of the Northwest
(Anon. 2011). Similarly, in
Shelf Flatback Turtle Population including:
other jurisdictions,
(a) surveying, monitoring and research; documentation related to the
(b) reducing interference to key breeding and implementation of offsets has
feeding locations; and become available (for
examples see, SEWPaC
(c) establishing information and education
2011).
programs”
The North West Shelf flatback turtle population as defined by the Variation
Agreement means:
“flatback turtles of the summer breeding Northwest Shelf Management Unit that nest
along the Pilbara and south west Kimberley coasts (including Barrow Island and
Mundabullangana) which is distinct from the winter nesting rookeries of the
Bonaparte Gulf (eg Cape Domett). It is unknown where the northern boundary of the
Northwest Shelf Management Unit is located. Turtles of the Northwest Shelf
Management Unit also use feeding grounds from at least Exmouth Gulf in the
southern Pilbara to Melville Island in the Northern Territory” (Variation Agreement
2009).
In addition to the above definition the NWSFTCP is required to ensure that data is
available to enable the AC and Scientific Panel of Experts (described below) to have
enough information to determine if:
Clause 11A “the Project [Gorgon Project] is having a significant impact on the
Northwest Shelf Flatback Turtle Population”; and if so, provide evidence that the
State may demand payment under the North West Shelf Flatback Turtle Intervention
Program (described below):
16Clause (3) (b) “... if the Advisory Committee determines that monitoring clearly
demonstrates that the Project is having a significant impact on the Northwest Shelf
Flatback Turtle Population.”
In summary, the NWSFTCP is designed to:
1) increase the conservation and protection of the North West Shelf flatback
turtle population using the actions within the following areas:
a) surveying, monitoring and research;
b) reducing interference to key breeding and feeding locations; and
c) establishing information and education programs;
2) determine in the Gorgon Gas project is having a significant impact of the
North West Shelf flatback turtle populations; and
3) provide through this project and other projects, evidence to allow the AC to
advise the State regarding the implementation of the North West Shelf
Flatback Turtle Intervention Program
4) after 30 years, enough information is available to allow the Minister to
decide whether further funding is required for the NWSFTCP.
171.3.3 Geographic scope
Under the Variation Agreement (2009) the scope of this program includes all
summer nesting flatback turtles and their distribution through their lifecycle. Currently
this includes rookeries between south of Onslow through to and Cape Londonderry
in the Kimberley (127 degrees longitude) and foraging distribution from Perth to
Cape York including the coastal waters of WA, Northern Territory and Queensland
and Commonwealth waters to the Exclusive Economic Zone. There is anecdotal
evidence that flatbacks may venture beyond the Exclusive Economic Zone but this
would represent a small proportion of the population.
Figure 3. The potential scope of conservation actions within the NWSFTCP as
determined by the range of the NWS summer breeding MU depicted by its nesting
range (yellow) and foraging range (pink).
1.3.4 Establishment of the NWSFTCP
The Director General of DBCA (DCLM CEO- Variation Agreement 2009) is tasked
with the establishment of the NWSFTCP –
“11A. (1) The State shall cause the DCLM CEO, in consultation with the Joint
Venturers, to establish:
(a) the Northwest Shelf Flatback Turtle Conservation Program” (Variation Agreement
2009).
181.3.5 Oversight and governance
The NWSFTCP is administered by the DBCA through the Director General
(previously referenced as DCLM CEO (Variation Agreement 2009). The program is
coordinated by the Marine Science Program, within the Science and Conservation
service. The Director General receives advice from the NWSFTCP AC.
1.3.6 Establishment of Advisory Committee and Scientific Panel of
Experts
The process of establishing the AC and Scientific Panel of experts was defined by
the Variation Agreement (2009).
“For the purposes of the Northwest Shelf Flatback Turtle Conservation Program the
State shall also cause the DCLM CEO, in consultation with the Joint Venturers, to
establish to the Minister’s satisfaction:
(i) an advisory committee:
(A) to which each of the CALM Act Minister, the Joint Venturers and the
Commonwealth Minister shall be entitled to appoint one representative (and to
remove and replace their respective representative as seen fit);
(B) and in addition to which the CALM Act Minister and the Joint Venturers shall
jointly appoint an independent chairperson (and to remove and replace that
chairperson as seen fit); and
(ii) a scientific panel of experts”
1.3.7 Role of the Advisory Committee and Scientific Panel of Experts
The role of the AC and Scientific Panel of Experts is primarily to advise the Director
General of DBCA, as defined in the Variation Agreement (2009):
“(c) The role of the Advisory Committee is to:
(i) provide advice and make recommendations to the DCLM CEO on the
general objectives and timeframes for delivery of the ongoing activities to be
undertaken as part of the Northwest Shelf Flatback Turtle Conservation
Program and otherwise as to the establishment, development and
implementation of that program as requested by the DCLM CEO;
(ii) to receive and consider on an annual basis a report from the DCLM CEO on
the implementation of the Northwest Shelf Flatback Turtle Conservation
Program and activities proposed to be undertaken as part of it during the
following 3 years; and
(iii) at the request from time to time of the State, consider and advise the State
whether or not in the Advisory Committee’s view (having regard to the advice
of the scientific panel) the Project is having a significant impact on the
Northwest Shelf Flatback Turtle Population
(d) The role of scientific panel is to provide expert scientific advice to the Advisory
Committee to assist it in undertaking its abovementioned role.”
191.3.8 North West Shelf Flatback Turtle Intervention Program
The North West Shelf Flatback Turtle Intervention Program is defined in the Variation
Agreement (2009):
(8) "Northwest Shelf Flatback Turtle Intervention Program" means a program of
activities (in addition to the Northwest Shelf Flatback Turtle Conservation Program)
to be developed by the DCLM CEO and implemented by the DCLM (except to the
extent required to be undertaken by the Joint Venturers in compliance with
conditions of approval of the Project (including the Domgas Project) under this
Agreement or State or Commonwealth legislation including the EP Act or the
Environment Protection and Biodiversity Conservation Act 1999 (C’wlth)) to improve
recruitment to the Northwest Shelf Flatback Turtle Population.
“(3) (a)The State may only commence making demand under paragraph (a) if the
Advisory Committee determines that monitoring clearly demonstrates that the Project
is having a significant impact on the Northwest Shelf Flatback Turtle Population”
1.3.9 Annual reporting
A NWSFTCP annual report and three year rolling operational plan will be produced
to outline key results, track progress of NWSFTCP and modify expenditure
throughout the life of the plan through an adaptive management approach. A draft of
the report will be available for comment by the NWSFTCP AC by September each
year while a draft of the three year rolling plan will be available for viewing and
comment by the NWSFTCP AC for finalisation by May each year.
1.3.10 Communication of program
The program will be communicated through the NWSFTCP annual report and three
year rolling operational plan, the DBCA Science and Conservation service’s annual
report, and the department’s annual report and year book. In addition, results will be
available through media, internet, conference presentations and peer-reviewed
journal articles.
1.3.11 Budget
The rolling operational plan for the NWSFTCP will be prepared by DBCA staff and
submitted the NWSFTCP AC to enable advice to be given to the Director General on
whether expenditure is appropriate. A summarised budget and detailed proposed
annual expenditure will be included in this plan.
202 NWSFTCP objectives
The NWSFTCP objectives are directly derived from the Variation Agreement (2009).
Measures of success were developed for this plan to assess performance against
the objectives.
2.1 Objectives
The NWSFTCP objectives with this plan are to:
1) increase the conservation and protection of the North West Shelf flatback turtle
population using the actions within the following areas:
a) surveying, monitoring and research;
b) reducing interference to key breeding and feeding locations; and
c) establishing information and education programs.
Measures of success
A. There are no significant negative changes to adult nesting abundance,
hatching and emergence success and other key demographic
parameters at key rookeries within the MU (excluding Barrow Island)
(short-term 0-7 years);
B. There are no significant increases in impacts from pressures upon the
MU (Short-term 0-7 years);
C. There is a comprehensive understanding of the functioning of the MU in
terms of biology, ecology and impacts to ensure that the best indicators
are being monitored and there is capability of predictive modelling (0-14
years);
D. There are no significant negative changes in key parameters of the MU
or associated habitat (nesting, foraging, migration) indices from
quantified or estimated 2009 levels (long-term 0-50 years).
E. Based on assessment criteria, the NWSFTCP has made effective and
efficient use of funds during the implementation this plan (0-30 years).
2) provide sufficient data to allow the AC to assess whether the Gorgon project is
having a “significant” impact on the NWS flatback population. This should include
advice to the Director General as to whether the State should make any request
to begin the North West Shelf Flatback Turtle Intervention Program.
21Measures of success
A. The following has been completed: clarification of how significant impact
will be assessed, including decision rules and processes of evaluation
and communication (0-7 years).
B. The monitoring program has been designed and is appropriate, given
current understanding. It includes the following: biologically relevant unit
defined, required data identified, the completeness and accuracy of the
data is understood and data collection has commenced (0-7 years).
C. A robust monitoring program is established, decision rules tested, and all
relevant data required to make a decision on significance with high
confidence is available (0-14 years).
223 Planning approach 2014–21
3.1 Overview
This plan emphasises a hierarchical approach to the delivery of the NWSFTCP and
associated performance measures (Figure 4). The three NWSFTCP objectives from
the Variation Agreement (see Section 2.1) were expanded and will be delivered
through a framework of five management strategies (see Table 5, Section 5.2).
Conservation priorities were determined through a prioritisation process (see section
3.1.1 below and Chapter 4). Management objectives were then developed for each
conservation priority and were further broken down into groups of management
actions, outlining the activities required to achieve these objectives.
Figure 4. Simplified diagrammatic of planning, implementation and reporting.
Evidence will include both quantitative and qualitative.
233.1.1 Conservation priorities – via prioritisation process
3.1.1.1 Decision process
To determine the conservation priorities for the plan we used a prioritisation process
described below (details in Appendix 1) and modified from a framework used by
DBCA (Simpson et al. 2015). The concept behind the framework is the assessment
of each asset (in this case the MU) in terms of its value (V), the pressures (P) on this
asset and the knowledge gaps (K) for this asset. The process used for the MU is
nested within a plan for all turtle species within WA (Draft Marine Turtle Strategic
Conservation Plan - in prep.) enabling conservation priorities to be compared across
species.
The following equation was used to determine the conservation priorities:
Value (V) * Pressure (P)
In terms of marine turtles in WA, those MUs (assets) of high value with the most
pressure will take priority for conservation or management actions. A full list of
pressures defined by stakeholders is listed in Appendix 1 with the main pressures
listed in section 4.
3.1.1.2 Scoring the matrix
Scores in the matrix were combined from individual and group stakeholder sessions.
Importantly, the final pressures produced from the matrix were reviewed by
stakeholders and the NWSFTCP AC. The additional equation of V*P*K guided the
development of applied research priorities, identifying areas of high pressure with
significant knowledge gaps.
4 Results of the prioritisation matrix and decision
framework
4.1 Conservation priorities for North West Shelf flatback
turtles
The results from the prioritisation framework (Table 3) produced two pressures listed
as high priority and four listed as moderate priority (Table 2). Those pressures with a
low score were not included in the list of Conservation Priorities but are included in
Table 3. All scores were calculated using the same methods as all other Western
Australian marine turtle management units (Draft Marine Turtle Strategic
Conservation Plan – in prep).
In addition to the priorities developed it was recognised that there were many
overarching actions that were related to multiple pressures, multiple species, or were
knowledge gaps or foundation actions that were essential for a comprehensive
NWSFTCP. This formed an additional conservation priority “overarching actions”.
24Table 2. A list of the conservation priorities as determined by the prioritisation matrix.
OA=overarching actions, P1=pressure 1 etc. H=high priority, M=moderate priority
and L=low priority.
Conservation Priorities Priority
OA Overarching actions H
P1 Light impact on behaviour of nesting adults and H
hatchlings – onshore and offshore sources
P2 Introduced animals predating on eggs and H
hatchlings
Pressure
P3 Global temperature increase - climate change M
P4 Modification of beaches - coastal development M
P5 Sea level rise - climate change M
P6 Marine debris – including entanglement and M
ingestion
4.1.1 Light impact on behaviour of nesting adults and hatchlings –
onshore and offshore sources (See Appendix 1 for description of pressure)
Specifically, for this MU, this pressure relates to the potential impacts in relation to
industrial light around Barrow Island, Dampier Archipelago and Cape Lambert Port,
industrial and urban light around Port Hedland and offshore light from anchored ships
in the regions of Onslow/Ashburton River Area and Dampier Archipelago and Port
Hedland.
4.1.2 Introduced animals predating on eggs and hatchlings (See
Appendix 1 for description of pressure)
Specifically, for this MU, this pressure refers to the predation on eggs and hatchlings
at sites such as Mundabullangana Station, Cape Lambert and the Karratha, Port
Hedland and Eighty Mile Beach regions. This pressure remains unquantified for all of
these regions. In cases where impacts remain unquantified, expert opinion was used
to estimate scores.
4.1.3 Global temperature increase - climate change (See Appendix 1 for
description of pressure)
Specifically, for this MU, this refers to understanding the impacts of a warming planet
on the population dynamics, how spatial and temporal distributions may change and
how sex ratios may be altered. The pressure is likely to lead to reduced hatchling
success, altered sex ratios and changes in spatial and temporal distribution of
nesting and changes to foraging habitat.
254.1.4 Modification of beaches - coastal development (See Appendix 1 for
description of pressure)
Specifically, for this MU, this refers to altered beaches through anthropogenic actions
such as coastal developments and industrial or urban development. This refers to
the loss or alteration of habitat with potential areas including Barrow Island, Dampier
Archipelago and Port Hedland.
4.1.5 Sea level rise and altered storm frequency and severity - climate
change (See Appendix 1 for description of pressure)
Specifically, for this MU, this refers to understanding the impacts of sea level rise on
short and long-term habitat loss, the impacts of more intense and frequent storms. It
refers to loss and change of nesting habitat and the impacts on hatching success,
and to the loss or change in foraging habitat and its impact on population dynamics
such as growth and fecundity. Spatial and temporal changes in nesting distribution
are likely.
4.1.6 Marine debris including entanglement and ingestion (See
Appendix 1 for description of pressure)
Specifically, for this MU, this pressure relates to the high level of marine debris in the
northern waters of Australia between Broome and Cape York that entangle large
numbers of marine turtles. There is uncertainty around the proportion of the NWS
flatback turtles that are entangled, but preliminary data suggests up to 15 % of the
captures are flatback turtles. In addition, ingestion of marine debris adds another
level of uncertainty to the mortality or reduced level of health. Migration data indicate
that this MU commonly uses these northern waters. Anecdotal information suggests
that the level of marine debris for the waters south of Broome is less of a concern.
4.2 Research priorities
Research actions appear in each of the priority pressures and also in overarching
actions. Priority Applied Research as determined by the matrix is shown in Table 4.
26Table 3. Scores of the prioritisation matrix sorted by conservation priority V*P
Value Pressure Metrics
Pressure
E1 E2 E3 E4 B1 B2 B3 B4 C1 C2 C3 C4 P1 P2 P3 P4 P5
Consequence
(Soc./Political
Spatial scale
Recreational
Vulnerability
V*P
Areal extent
Func.Import
Population
Probability
nesters
Economic
Life stage
Recovery
Temporal
Scientific
Regional
Sub Total
Sub Total
potential
National
Cultural
Global
Scale
Local
of
)
Light - onshore and offshore sources 2 3 1 2 3 3 3 3 1 1 3 1 26 1 3 3 3 3 30 780 H
Introduced pests/feral animals 26 1 2 3 2 3 24 624 H
Sea Level Rise - climate change 26 3 3 3 2 2 22 572 M
Global temperature increase - climate change 26 3 3 3 2 2 22 572 M
Modification of beaches - coastal development 26 1 1 3 2 3 21 546 M
Marine debris 26 2 2 3 3 2 20 520 M
Water pollution (chronic) 26 3 1 3 2 2 18 416 L
Direct death - dredging- port development 26 3 1 1 3 2 16 416 L
Disturbance of turtles on beaches - tourism/people 26 1 2 3 2 2 16 416 L
Vessel strike and disturbance Same scores as first row 26 3 1 2 2 2 16 416 L
Marine habitat destruction - dredging - port
26 3 1 2 1 2 14 364 L
development
Noise seismic 26 2 2 1 3 3 14 364 L?
Noise - dredging/piling - port development 26 3 2 1 1 2 14 364 L
Water pollution (acute) 26 2 1 1 3 2 14 364 L
Fishing bycatch 26 3 1 2 2 1 8 208 L
Illegal or unregulated take outside Australia 26 1 1 3 2 1 7 182 L
Indigenous harvest 26 1 1 3 1 1 6 156 L
27You can also read