A New Direction for Salinity Management in Western Australia: A Consultative Review - A report for the Department of Primary Industries and ...
←
→
Page content transcription
If your browser does not render page correctly, please read the page content below
A New Direction for Salinity Management in
  Western Australia: A Consultative Review

    A report for the Department of Primary Industries and
                                   Regional Development

                                                  March 2019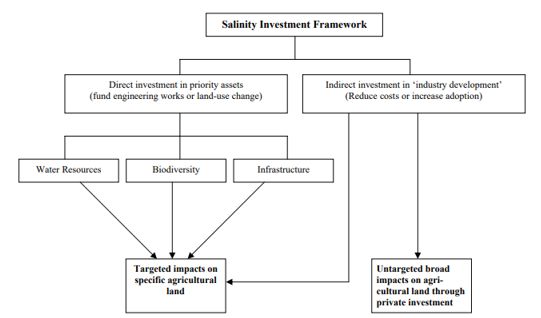
Executive summary
In May 2018, the Office of the Auditor General (OAG) published an audit into the Management
of Salinity and recommended that the Department of Primary Industries and Regional
Development (DPIRD), in consultation with the Department of Biodiversity, Conservation and
Attractions (DBCA) and the Department of Water and Environmental Regulation (DWER), set a
strategic direction for salinity management for WA and improve monitoring, cooperation,
coordination, promotion of soil conservation, and compliance of salinity impacts and its
management.
The OAG’s audit focused on two key questions,
1. Do agencies know the extent and impact of dryland salinity in the South West agricultural
regions?
2. Are efforts to reduce the impacts of dryland salinity in the South West regions working?
To respond to these questions, DPIRD commissioned an independent review of state and
federal government salinity policies and programmes and their effectiveness in addressing
salinity. This review included consultation with key agencies on the effectiveness of a range of
government programmes that had investment in salinity management and research and a
workshop that involved more than 35 stakeholder groups, each representing ranging
perspectives on salinity extent and management.
The overall conclusion of this review is that salinisation of land and water remains a significant
problem. The review found that since 2006, there has been limited investment into the
economic and environmental impacts of salinity and that studies of feasible and cost effective
management options have not been updated in recent times.
To answer the two questions posed by the OAG, this review finds that:
Agencies do not know, accurately, the changes in extent and impacts of secondary dryland
salinity since the last quantitative measure in 2000.
There has been successful reduction of the impacts of secondary dryland salinity in
discrete areas, but at the gross level, reduction of impacts has been very limited.
In response to these findings, two key actions are recommended:
1. Update data on the extent and impacts of dryland salinity
2. Target investment of public and private funds in four key areas: Information, Governance,
Innovation and Investment (described below)
These key areas are presented as the ‘Pillars’ for the New Direction in Salinity.
Information
The Information Pillar focusses on effective monitoring and evaluation on the extent and trend
in salinity and improving knowledge on tools to manage salinity. These tools include land
management practices, for example the productive use of saline land, native vegetation
management and engineering options. This information provides both the quantitative and
qualitative data required to inform investment decisions by Government and the private
sector in salinity research, management and communication.
Governance
GHD | Report for Department of Primary Industries and Regional Development | Salinity Review | 6137688The Governance Pillar supports the coordination of Government action and engagement with
industry and communities. Renewed emphasis on coordination of actions by government
departments with regional NRM groups, industry groups and landcare network will provide a
more effective response to the environmental, economic and social impacts of salinity. This
Pillar considers the opportunity for a new Soil and Land Conservation Council (SLCC) whose
role would include providing strategic advice to Government as well maintaining a
commitment to genuine community involvement at State and regional levels.
Innovation
The Innovation Pillar invests in new ways of thinking and approaches in not only managing the
impact of salinity but developing profitable solutions for saline land, for example, grazing
systems, drainage and innovative water use. This Pillar maintains the important role
Government has in setting research priorities in dryland salinity where this is undertaken in
consultation with research leaders from both the public and private sector. Research priorities
in this new direction for salinity includes innovative approaches to integrated valley floor
farming, carbon farming, conservation plantings and sustainable agriculture systems that
improve salinity management. Enabling information flow and mechanisms for private industry
to develop opportunities for investment in these areas is an important change.
Investment
The Investment Pillar acknowledges three primary sources of investment in salinity
management: state government investment for the protection of public assets, federal
government investment priorities as identified in various natural resource management
programmes and private investment in salinity research and management. Each of these
sources of investment has an important role in salinity’s new direction. While an important
action for government is to identify and invest in important public assets, government has an
equally important role in influencing the national agenda in NRM investment as well as
stimulating and supporting private investment.
A summary of the key actions and intended outcomes for each Pillar is shown in Table 1.
Limitations
This report has been prepared by GHD for the Department of Primary Industries and Regional
Development. GHD otherwise disclaims responsibility to any person other than the
Department of Primary Industries and Regional Development arising in connection with this
report.
GHD has prepared this report on the basis of information provided by the Department of
Primary Industries and Regional Development and others who provided information to GHD,
which GHD has not independently verified or checked beyond the agreed scope of work. GHD
does not accept liability in connection with such unverified information, including errors and
omissions in the report which were caused by errors or omissions in that information.
The opinions, conclusions and any recommendations in this report are based on information
reviewed at the date of preparation of the report and from stakeholder consultation. GHD has
no responsibility or obligation to update this report to account for events or changes occurring
subsequent to the date that the report was prepared.
GHD | Report for Department of Primary Industries and Regional Development | Salinity Review | 6137688Table 1 Summary objectives and actions for the four Pillars for salinity management
Pillar Objective Actions
Information To provide up-to-date and relevant information on the status of salinity and tools to - DPIRD to undertake an assessment of the current area of salt-affected land and salinity hazard areas as a
manage salinity to inform decision-making by government and other stakeholders. priority and determine an appropriate review period or ongoing assessment, e.g. five years, ten years.
- DWER to prepare a status of stream salinity report by 2020.
- DPIRD, with DBCA and DWER to prepare a Salinity Situation Statement 2020, in consultation with government,
industry and community, on status and response to dryland salinity in Western Australia.
- Information on salinity management options to be revised in consultation with key knowledge providers with
effective knowledge transfer to land managers and decision-makers.
Governance To provide strategic advice and coordination to government, industry and community - WA Government to establish the Soil and Land Conservation Council (SLCC) to provide strategic advice on
salinity and other land degradation as a priority.
- DPIRD to facilitate improved integration of government actions across salinity management and broader land
degradation issues.
- DPIRD to facilitate increased engagement, coordination and collaboration with regional NRM, catchment,
grower, and Landcare groups.
- The SLCC, with the Soil and Land Commissioner, to assess options to streamline compliance and mitigate
disputes and offsite impacts by 2019.
Innovation To enable and facilitate the development and delivery of innovation to enhance the - DPIRD to coordinate the development of a plan for salinity management and mitigation research with key RDCs,
management of salinity and adaptation to its impacts. research providers, government and grower groups by 2020.
- DPIRD to assess land tenure options such as leases and covenants to enable viable and marketable areas for
grazing, carbon and conservation in salt-affected and other low productivity areas that impact salinity by 2019.
- DPIRD to develop and provide up-to-date information on opportunities and issues with carbon farming and
sustainable agriculture in salt-affected areas from 2019 to enable private public partnerships.
Investment To provide effective investment by government and private to recover or manage - DBCA to review biodiversity priorities in the context of a revised salt-affected land assessment by 2020.
salinity assets at risk
- DWER to review Water Resource Recovery Catchment approach and catchments in the context of a revised
salt-affected land assessment and stream salinity analysis by 2019.
- DPIRD, in consultation with MRWA and local government, to review critical infrastructure at risk from revised
assessment of salinity risk by 2019.
- DPIRD, in consultation with DBCA and key stakeholders, to assess role for government in creating opportunities
for private investment from perspectives of carbon, biodiversity and sustainable agriculture by 2019.
- DPIRD and DBCA to engage with Commonwealth government departments on priorities for salinity management
for NRM programs.
- Prepare a Salinity Investment Framework Phase III
GHD | Report for Department of Primary Industries and Regional Development | Salinity Review | 6137688Acronyms
ABS Australian Bureau of Statistics
CALM Act 1984 Conservation and Land Management Act 1984
CAR Comprehensive, Adequate and Representative
CAWS Act 1947 Country Areas Water Supply Act 1947
CDI Catchment Demonstration Initiative
CRC Cooperative Research Centre
CRID Collie River Irrigation District
DAFWA Department of Agriculture and Food Western Australia
DAWR Department of Agriculture and Water Resources
DBCA Department of Biodiversity, Conservation and Attractions
DEC Department of Environment and Conservation
DoEE Department of the Environment and Energy
DPIRD Department of Primary Industries and Regional Development
DWER Department of Water and Environmental Regulation
EEI Engineering Evaluation Initiative
EPBC Act 1999 Environment Protection and Biodiversity Conservation Act 1999
FPC Forest Products Commission
GRDC Grains Research and Development Corporation
ha Hectares
mgL-1 Milligrams per litre
Mha Million hectares
MIDAS Model of Integrated Dryland Agriculture System
MLA Meat and Livestock Australia
MRWA Main Roads Western Australia
NAP National Action Plan for Salinity and Water Quality
NDSP National Dryland Salinity Program
NHTA Act 1997 National Heritage Trust of Australia Act 1997 (Cth)
NRM Act 1992 Natural Resources Management (Financial Assistance) Act 1992 (Cth)
NRM Natural Resource Management
OAG Office of the Auditor General
RCA Rapid Catchment Appraisal
RDC Rural Research and Development Corporations
RD&E Research Development and Extension
GHD | Report for Department of Primary Industries and Regional Development | Salinity Review | 6137688RT-LA Rural Towns – Liquid Assets
R&D Research and Development
SGSL Sustainable Grazing on Saline Land
SIF Salinity Investment Framework
SLC Act 1945 Soil and Land Conservation Act 1945
SLCC Soil and Land Conservation Council
STF Strategic Tree Farms
TDS Total Dissolved Solids
UWA University of Western Australia
WA Western Australia
WA SAP West Australian Salinity Action Plan
WDE Wheatbelt Drainage Evaluation
WRRC Water Resource Recovery Catchments (Controlled Catchments)
GHD | Report for Department of Primary Industries and Regional Development | Salinity Review | 6137688Table of contents
1. Introduction ................................................................................................................................... 1
1.1 Extent of salinity .................................................................................................................. 1
1.2 History of salinity ................................................................................................................. 2
2. Status of Salinity in Western Australia........................................................................................... 7
2.1 Causes and processes .......................................................................................................... 7
2.2 Extent and trends ................................................................................................................ 7
3. Salinity reviews ............................................................................................................................ 10
4. Past Strategic State Government Salinity Programs .................................................................... 13
5. Status of Salinity Programs .......................................................................................................... 17
5.1 Agriculture ......................................................................................................................... 19
5.2 Water ................................................................................................................................. 20
5.3 Biodiversity ........................................................................................................................ 21
5.4 Summary of salinity programs ........................................................................................... 22
5.5 Compliance and targets ..................................................................................................... 26
6. A new direction for salinity management in Western Australia.................................................. 27
6.1 Information ........................................................................................................................ 27
6.2 Governance........................................................................................................................ 29
6.3 Innovation .......................................................................................................................... 30
6.4 Investment ......................................................................................................................... 31
7. Conclusion .................................................................................................................................... 34
8. References ................................................................................................................................... 36
Table index
Table 1 Summary objectives and actions for the four Pillars for salinity management ........................... i
Table 2 Summary of state level plans for salinity .................................................................................... 6
Table 3 Reviews of salinity since 1983 ................................................................................................... 10
Table 4 Review of Natural Resource Management programs and governance .................................... 11
Table 5 Summary of past strategic State Government salinity programs ............................................. 14
Table 6 Salinity management roles and responsibilities (adapted from OAG 2018) ............................. 17
Table 7 Summary of legislation related to salinity management .......................................................... 19
Table 8 Status of Water Resource Recovery Catchments ...................................................................... 21
Table 9 Summary of six Natural Diversity Catchments .......................................................................... 21
GHD | Report for Department of Primary Industries and Regional Development | Salinity Review | 6137688Table 10 Summary of current salinity programmes............................................................................... 23
Figure index
Figure 1 ABS survey results of estimated area affected by dryland salinity from 1955 to
2001. .................................................................................................................................... 4
Figure 2 Resource risk summary for risk of expansion of dryland salinity within hydrozones
(Simons et al. 2013). ............................................................................................................ 8
Figure 3 Indicative chart of species suitability for salinity and waterlogging ........................................ 20
Figure 4 Salinity Investment Framework (Sparks et al. 2006)................................................................ 32
Appendices
Appendix A - Summary of Salinity Programs – Historical and Current
Appendix B - Summary of Review Recommendations Based on OAG Report
Appendix C – Workshop attendees
GHD | Report for Department of Primary Industries and Regional Development | Salinity Review | 61376881. Introduction
1.1 Extent of salinity
The WA Wheatbelt is approximately 18 million hectares (ha) with grains, wool and livestock
the dominant industries. Agricultural production from these broadacre industries generates an
average annual income of $6 billion increasing to $13.2 billion as an overall contribution to the
WA economy based on a multiplier of 2.2. The most recent calculation of salt-affected land
estimates that 1 million ha of land is affected, of which 821,000 ha is agricultural land (George
et al 2005) with an annual average opportunity cost of $519 million (OAG 2018). Historical
estimates indicate that another 1.8 to 3.5 million ha is within salinity hazard areas.
Agricultural production is not the only asset impacted by salinity. Biodiversity on public and
private land, rural towns, water quality (and therefore supply), road and rail infrastructure are
the public assets at risk of loss or damage due to rising groundwater and salinity. In 1998, an
estimated 450 plant species were identified as only occurring in salinity hazard areas and
therefore at risk of extinction (State Salinity Council 2000; Keighery 2000). In 2010, the
Department of Environment and Conservation (DEC) estimated that 850 endemic flora and
fauna species were at threat of extinction as a result of dryland salinity.
In 1999, salinity was found to be rising in most rivers, including those used for potable water
supplies (Hatton and Salama 1999). Stream salinity remains a major issue in many rivers of the
south-west of WA (Mayer et al 2005). Estimates from 2006 and based on large-scale data,
found that approximately 252 km of highways and main roads and 3850 km of local and
unclassified roads are within salt affected areas, with a further 1194 km of highways and main
roads and 22 960 km of local and unclassified roads potentially a high salinity hazard. The
estimated present value of costs associated with increased repair and maintenance of roads if
areas with a high salinity hazard become impacted was over $1900 million (Sparks et al 2006).
While previous studies estimate increases in the area impacted by salinity, the impact that the
drying climate may have on salinity is less certain. With the extent of dryland salinity driven by
excess water in the landscape, the decrease in winter rainfall has been thought to cause a
slowing in the process of salinisation in many areas. Groundwater levels in parts of the
Wheatbelt however have continued to rise, as shown in Figure 2. Stream salinities have also
continued to increase, a trend largely attributable to the reduced volumes of fresh runoff
diluting high salt concentrations in rivers flowing through saline landscapes. Conversely, in
forested catchments where groundwater no longer intersects the valley, the salinity of the
streamflow may have freshened.
Improving and protecting the condition of natural resources and infrastructure from dryland
salinity is a slow process and requires long-term focus and investment. While significant
investments were made in salinity research and management between 1980 and 2006, this
investment has significantly reduced in recent years from both the Commonwealth and State
governments with the exception being in 2017/18 with funding for the Myalup-Wellington
project.
Given this context of reduced investment into salinity management and that salinity remains a
significant NRM issue, the Office of the Auditor General (OAG) undertook an audit into the
management of salinity in agricultural regions of the South West of Western Australia. In May
2018, the OAG recommended that:
To improve the effectiveness and efficiency of the management of dryland salinity DPIRD (in
consultation with DBCA and DWER) should by December 2018:
GHD | Report for Department of Primary Industries and Regional Development –New Direction for Salinity 6137688 | 1a. set the strategic direction for the management of salinity
b. establish regular monitoring and reporting of the spread, impact and cost of dryland
salinity
c. make better use of established mechanisms to ensure there is better cooperation and
coordination at the government and local level
d. consider whether there should be targets to reduce water tables and re-plant deep rooted
trees on a catchment wide or localised level
e. continue to promote soil conservation, and educate landholders and the public
f. where necessary, make greater use of compliance and enforcement mechanisms under
the Soil and Land Conservation Act 1945 (SLC Act 1945) to ensure that landholders prevent
and/or mitigate land degradation.
To meet this recommendation, DPIRD commissioned an independent review of the history of
government policies and programmes in salinity investment and management in Western
Australia. This Report presents the findings of this Review. This Report assesses the OAG
recommendations and findings of an independent review of current and past salinity programs
and provides a new direction for salinity management in WA.
1.2 History of salinity
Salinity is not a new problem in WA and not entirely as a result of European settlement
(Schofield et al. 1988). Before large-scale colonisation, the south-west region, especially in the
inland areas had many brackish streams, saline lakes and abandoned landforms reflecting
periods of high watertables (George et al. 2008a; Schofield et al. 1988). For example, Mr E.H.
Hargraves (1863a, b) noted high stream salinities when he travelled from Jerramungup to the
Murchison in search of gold. He reported that WA rivers were ‘beds of salt, pools of brine and
brackish water’ with the exception of the rivers flowing west from the Darling Range.
European settlement did however result in rising stream salinities. Salinity in the Mundaring
Reservoir rose over the period 1904–08 (Reynoldson 1909). Reynoldson concluded that this
was caused by ring-barking trees and cultivation in the catchment. Ring-barking stopped and
stream salinity dropped. In 1912, Wood (1924) found that the Blackwood River near
Bridgetown had become too salty for use in steam engines. Since then, salinity in the
Blackwood River at Bridgetown has risen from 300 mg/L and increased by more than 300%.
Bleazby (1917) noted the rising stream salinity with salinisation of railway reservoirs. When
investigating the problem, he found that nearly all the reservoir catchments where ring-barked
trees had been cleared, produced unsuitably highly saline water (430 mg/L), whereas in
vegetated catchments, salinity remained very low (86–143 mg/L). Wood (1924) put forward
the conceptual model as to how stream salinity develops, a model that still applies today. He
proposed that the high concentration of salt in the soil and groundwater was due to oceanic
salt continuously brought inland and deposited via rain and dry fallout, and that the removal of
trees allowed much more water to percolate to the salty groundwater, which then rose
bringing salts to the surface.
Through the 1960s, there was a growing awareness that control of alienation of Crown Land
would not be sufficient to maintain satisfactory salinity levels in a number of major water
resources. Action would be required to halt clearing on land already alienated. In 1976,
amendments to the Country Areas Water Supply Act 1947 (CAWS Act) were passed by both
Houses of Parliament.
The legislation made it an offence to clear or destroy native vegetation without a licence. The
legislation was applied initially to the catchment of Wellington Dam. In 1978, the legislation
GHD | Report for Department of Primary Industries and Regional Development –New Direction for Salinity 6137688 | 2was extended to four other critically important water resource catchments: the Mundaring
reservoir catchment and the Denmark, Warren and Kent River catchments. The catchments
were carefully selected to represent those most sensitive to further agricultural expansion.
Catchments which had brackish or saline streams that could not be easily returned to potable
levels were not included under this legislation. Also not included were catchments that
drained predominantly through State Forest with freshwater streams and unlikely to become
saline if small areas of private land in their catchments were cleared.
1.2.1 Agricultural development
Wheat farming in the south-west of the State commenced in the 500-600 mm rainfall region
and subsequently moved eastwards into lower rainfall regions. In 1900, there were 30 000 ha
sown to wheat in the whole of the State. In 2018/19, Western Australia harvested
approximately 8 million ha of dryland agricultural crops, predominately comprising wheat,
barley, canola and lupins. The most rapid periods of development were 1900-1930 and 1955-
1985. Land salinisation emerged as a problem to agriculture during the early period of
expansion. The first record appeared in 1907 as a reply printed in the Journal of Agriculture
under the heading `Does clearing increase salt in ground?' The reply indicated that a farmer's
query had been referred to the Government Analyst for attention. The response suggested
that it had been 'pretty conclusively proved' that the removal of trees affected water supplies
and that to prevent salting it would be necessary to replant a very high proportion of the trees
that had been removed.
In 1917, the Royal Commission on the Mallee Belt and Esperance Lands made reference to soil
salt concentrations in the Esperance region. J. W. Paterson (1917), Foundation Professor of
Agriculture at the University of Western Australia (UWA), outlined in considerable detail the
manner in which salts accumulated in the soil and the factors influencing salt concentrations
significant to crop establishment and production. He concluded on the basis of soil analyses,
that about half of the Salmon Gums area had too much salt to be of profitable use. However,
the Royal Commission criticised his report and advocated land release. Soil surveys conducted
in the 1930s and 1940s showed salt problems developing in the Salmon Gums area.
As more and more land was released for agriculture, salinity concerns continued to be raised.
However, the demand for new land was so great that concern for the adverse effects were
overridden, resulting in the release of large contiguous blocks of land on which native
vegetation was totally cleared over extensive areas.
Following its rapid expansion in the 1920s, agriculture went through a period of decline to the
late 1940s and salinity was considered to be essentially an agricultural problem. Little concern
for water supplies was apparent as adequate sources of boiler water could always be found for
railway locomotives and the problem of increasing salinity in Mundaring Weir was thought to
be solved. In the 1930s and 1940s, extensive soil surveys were carried out (Burvill 1947; 1950;
Teakle and Burvill 1938; 1945). These surveys quantified and described the extent and nature
of the salt problem in WA soils. The second major period of agricultural expansion occurred
from the mid-1950s to the 1980s. The consequent increase in land salinisation continued to
affect agriculture and further studies were carried out. Notable contributions to the
understanding of the salt problem were made by Pennefather (1950) and Smith (1962).
Further soil and landform analyses were carried out in the late 1950s and early 1960s drawing
attention to the role of these landscape features in land salinisation (for example Bettenay et
al., 1962).
Australian Bureau of Statistics (ABS) agricultural census surveys to gauge the extent of
agricultural land affected by salinity were carried out in 1955, 1962, 1974, 1979, 1984, 1989,
GHD | Report for Department of Primary Industries and Regional Development –New Direction for Salinity 6137688 | 31993, 1994, 1998, 2000 and 2002, Figure 1. By the late 1990s to early 2000s, the estimates of
salt affected land ranged between 932,000 ha to 1,047,000 ha.
The area mapped as severely affected by dryland salinity, using Landsat TM was about 1
million ha in 1998 and the annual rate of increase between 1988 and 1998 was about 14 000
ha (Furby et al. 2010).
1,200,000
Estimated area affected by dryland salinity
1,000,000
800,000
(hectares)
600,000
400,000
200,000
0
1950 1960 1970 1980 1990 2000 2010 2020
Figure 1 ABS survey results of estimated area affected by dryland
salinity from 1955 to 2001.
To date, climate change has neither allowed farmers to significantly reclaim salt-affected land
nor prevented the spread of salinity. The rapid rise in the estimated area affected by salinity
between 1975 and 2000 relates to the timing of clearing across the Wheatbelt. There is
uncertainty in the response of salt affected area to the drying climate recorded in many parts
of the Wheatbelt and how that relates to the delayed impact of land clearing. However
further increases in salt-affected land is considered highly likely in years and decades to come.
1.2.2 Policy response to salinity
Although there was a Salinity Strategy published jointly by the WA Water Resources Council
and the Soil and Land Conservation Council (SLCC) in 1995, the first comprehensive whole of
government approach to salinity management is considered to be the WA Salinity Action Plan
(WA SAP), published in late 1996. The WA SAP brought together actions for four state
agencies: Agriculture WA; Conservation and Land Management; Environmental Protection and
Water and Rivers Commission. Some of the key actions in the WA SAP were a focus on Water
Resource Recovery (five catchments), Natural Diversity Recovery (six catchments), Focus
Catchments (all catchments in the SW and 12 catchment support teams), and a Rural Towns
Program. The WA SAP also recommended the establishment of a State Salinity Council to
report to a Cabinet Committee who had overall accountability for the Action Plan
achievements.
Although the WA SAP outlined the roles of various agencies, coordination of agencies, and the
scale of intervention required it was not seen as a being sufficiently consultative. An update of
the WA SAP was prepared in 1998. The Plan, whilst maintaining its strategic focus, addressed
concerns that it was not inclusive of responses to salinity by industry and catchment groups.
The updated document was not formally released.
GHD | Report for Department of Primary Industries and Regional Development –New Direction for Salinity 6137688 | 4The 2000 State Salinity Strategy incorporated some up-to-date science on the scale of
intervention needed to address salinity and was much more sympathetic to concerns
regarding a lack of engagement with and acknowledgement of the role the farming community
can and do play in salinity management. This Strategy was however considered to be less
targeted.
A Salinity Taskforce was established in 2001 to provide a more targeted and cohesive approach
to salinity. A Report from the taskforce, “Salinity: A New Balance” was released in September
2001. A Government response to the report was prepared and although it is 17 years old, the
majority of recommendations remain relevant to this day. The taskforce identified three main
actions that Government should be leading:
The protection of public assets at risk from the consequences of salinity.
Investment in and support for major actions on private land through innovation and new
approaches.
Support and incentives for planning, coordination and implementation of smaller on-
ground works on private land.
A summary of the state level plans for salinity is presented in Table 2.
As the Commonwealth programs changed into Caring for our Country with a broader focus on
NRM, so too did the arrangements in WA. A NRM Council was established in 2003 and
reconstituted in 2007 to include representation from indigenous, conservation, state and local
government, regional groups, industry and grower groups and the peak NRM regional bodies.
Since 2009 when the NRM Council was terminated, the seven state regional NRM groups
together with agencies and some issue-specific groups have been the primary means of
providing community views to the Government.
GHD | Report for Department of Primary Industries and Regional Development –New Direction for Salinity 6137688 | 5Table 2 Summary of state level plans for salinity
Plan Aims and Objectives
A report jointly published by WA Water Resources Council and Soil
Salinity – A
and Land Conservation Council. The Strategy involved:
Recommended Strategy - developing catchment plans
for WA - 1995 - community and Government agreeing who does what and where
and who pays how much;
- achieving long term commitment by stakeholders,
ensuring that all stakeholders in catchments “do their bit”
The Action Plan aimed to:
Salinity Action Plan - 1996
- Reduce further deterioration of agricultural land and where
possible recover or rehabilitate existing salt-affected land
- Protect and restore key water resources to ensure salinity levels
are kept at a level that permits safe, potable water supplies in
perpetuity
- Protect and restore high value wetlands and maintain natural
(biological and physical) diversity within the agricultural areas of
WA; and
- Protect designated infrastructure affected by salinity
This Strategy aimed to reduce the impact of salinity in the south-west
State Salinity Strategy -
agricultural region of WA. It had as its goals:
2000 - To reduce the rate of degradation of agricultural and public land,
and where practical recover, rehabilitate or manage salt-affected
land;
- To protect and restore key water resources to ensure salinity
levels are kept to a level that permits safe, potable water supplies
in perpetuity;
- To protect and restore high value wetlands and natural vegetation,
and maintain natural (biological and physical) diversity with the
south-west region of WA
- To provide communities with the capacity to address salinity
issues and manage the changes brought about by salinity
- To protect infrastructure affected by salinity
The response committed the Government to lead action in three key
Government Response to
areas which build on the 1996 Salinity Action Plan and the 2000
Salinity Taskforce - 2002 Salinity Strategy:
direct support to protect assets of high public value (e.g.
biodiversity, water resources, infrastructure),
indirect support through investing in new industries and
technologies (e.g. new perennial plants, commercial farm forestry,
engineering solutions) and;
providing support and incentives for planning, coordination and
implementation of smaller on ground works on private land,
especially where these will lead to public benefits.
GHD | Report for Department of Primary Industries and Regional Development –New Direction for Salinity 6137688 | 62. Status of Salinity in Western Australia
2.1 Causes and processes
Secondary - dryland salinity refers to all soils in non-irrigated areas that have become saline
since being cleared for agriculture. There are three basic requirements for dryland salinity to
develop: a store of salt; a supply of water; and a mechanism to bring both of these into contact
with the ground surface (Williamson 1998). Clearing for agriculture over the last one hundred
years and the replacement of perennial, deep-rooted native vegetation with the shallower
rooted annual crops and pastures has increased groundwater recharge. This recharge results
in rising watertables, bringing naturally stored salts from depth to the surface. George et al.
1997; Hatton et al. 2003; Peck and Williamson 1987; Ruprecht and Schofield 1991; and
Schofield and Ruprecht 1989 have documented the fundamental process, impacts and
relationships between current and pre-clearing hydrology, in relation to salinisation.
Dryland salinity occurs when the concentration of soluble salts near the soil surface is
sufficient to reduce plant establishment and growth. In WA, dryland salinity is caused by an
altered water balance, which, at some time after clearing (decades to centuries) will reach a
new equilibrium and the area of land affected by salinity will cease to expand. Although the
extent of salinity changes naturally over geological scales (George et al. 2008a), the process
has been accelerated and enlarged by widespread clearing and land use change. Dryland
salinity is a form of land degradation currently affecting both agricultural and public land in the
south-west of WA. It also affects water resources, natural biodiversity and damage to
buildings, roads and other infrastructure.
In addition to the dryland salinity due to saline groundwater, transient salinity has become
more widely acknowledged as an emerging NRM issue. Transient salinity is the seasonal and
spatial variation of salt accumulation in the root zone not influenced by groundwater
processes and rising water table (Rengasamy 2002). Transient salinity fluctuates in depth, due
mainly to seasonal rainfall patterns and is extensive in many landscapes dominated by subsoil
sodicity. Preliminary estimates are that probably two thirds of the agricultural area of Australia
has the potential for transient salinity not associated with groundwater (Rengasamy 2002).
Preliminary estimates at a regional scale have estimated that approximately 11% of croppable
land in south-WA could potentially be affected by transient salinity (two million ha) based on
scaling up broad landform analysis. Yield penalties can range significantly from negligible up to
65% depending on the severity of susceptibility and crop type, with an average currently
estimated yield penalty of approximately 15%.
2.2 Extent and trends
The area of land considered salt-affected, based on ABS surveys has increased from 73,500ha
in 1955 to 932,500 ha in 2002. The assessment from Land Monitor, 1998 ranged from 937,500
ha to 1,047,000 ha (Caccetta et al. 2010; George et al. 2005,). Given the last calculated
assessment of extent was nearly 20 years ago, estimates of the current extent of salt-affected
land are uncertain.
Up until 2000, the rates for groundwater rise were high with almost no falling trends across
the Wheatbelt despite below long-term average rainfall for 1975 to 2000 being recorded for
most areas. The 2000 – 07 dry period (approximately 30% reduction in long-term average
winter rainfall) resulted in a reduction in the rate of groundwater level rise and a small
downward trend in the depth to watertables beneath some valley floors. Although there have
been regional variations since 2008, this trend has largely been reversed. In areas with
groundwater systems still actively filling (not near equilibrium), reduced rainfall recharge
GHD | Report for Department of Primary Industries and Regional Development –New Direction for Salinity 6137688 | 7appears to have had little discernible impact on rising trends. Later, as these areas approach a
‘new’ hydrological equilibrium, climate impacts will become the dominant controller of
groundwater level trends and the extent of dryland salinity.
Recent trends in groundwater levels have been attributed to the interaction of three factors:
clearing of native vegetation, below long-term average rainfall, and the onset of a hydrological
equilibrium (George et al. 2008b). Dryland salinity is considered to remain a potential hazard
to an additional 1.8 to 3.5 million ha of productive agricultural land (George et al. 2005) and
depending on future climate, the area actually affected will increase from the 1 million (Mha)
currently considered salt-affected. The long-term extent of salinity may take decades to
centuries to develop, especially in areas where clearing was staggered, the area cleared is
small (< 50%), or where watertables are deep (George et al. 2008b). However, there remain
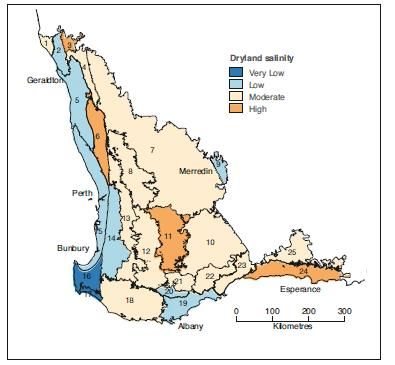
critical areas in the Wheatbelt where the risk of expansion is high, Figure 2. The areas with the
highest dryland salinity risk occur mostly in the highly productive, medium to high rainfall,
dryland agricultural areas.
Figure 2 Resource risk summary for risk of expansion of dryland
salinity within hydrozones (Simons et al. 2013).
The annual cost of lost production of currently saline agricultural land is estimated at $519
million (Anne Bennett pers. comm, 2017). While the total state level benefit of successfully
managing salinity is estimated at $667 million (George et al. 2005), the estimated average
annual value of lost production to transient salinity is $92 million.
Dryland salinity does not affect all farmers equally and in the late 1990s, one-third (35%) of the
salt-affected land mapped was managed by less than 10% (280) of farmers, including:
12 landholders with more than 2000 ha of salt affected land
267 landholders with 500 to 2000 ha of salt affected land
1377 landholders with 100 to 500 ha of salt affected land.
GHD | Report for Department of Primary Industries and Regional Development –New Direction for Salinity 6137688 | 82.2.1 Estimated state level annual off-site costs
The total off-site costs of salinity are estimated to exceed on-farm costs (Simons et al, 2013).
Salinity affects rural infrastructure relied upon by the agricultural industry. About 250 km of
main roads and 3850 km of local roads were estimated to be affected by dryland salinity
(Sparks et al. 2006) with the total cost of maintenance of salt-damaged rail and roads alone
estimated at $175 million annually.
Rising watertables that accompany dryland salinity also increase discharge into waterways.
Such watertables often have a low pH resulting in the acidification of some waterways. This
process has a high off-farm environmental cost, especially when combined with discharge
from engineering management options if water from drains is disposed of inappropriately.
There are other high environmental costs of dryland salinity that have not been quantified but
are significant. The impacts of salinity in Western Australia are not confined to economics and
the environment, there are also social impacts. These can include impacts on human values
such as ‘sense of community’ and ‘sense of place’ as well as quantifiable impacts on
population, prosperity, land prices, tourism potential, and recreational resources.
GHD | Report for Department of Primary Industries and Regional Development –New Direction for Salinity 6137688 | 93. Salinity reviews
There have been a number of reviews of salinity extent and impact for both Western Australia
and Australia. These reviews include the:
1917 Royal Commission into land expansion into the Mallee belt and Esperance Area
review by Pennefather into the salinity problem in WA in 1950
Parliamentary Committee established in 1964 that proposed clearing controls in response
to rising stream salinity in water supply and irrigation reservoirs.
A list of the more recent reviews is presented in Table 3 and the terms of reference and
findings for each of these reviews are summarised in Appendix 2.
Some of the common recommendations and findings were:
monitoring of the extent of salinity
targeted investment of public funds
integration of government actions
clear roles and responsibilities
structured research and development.
It is reasonable to consider that these recommendations remain relevant in 2018.
Table 3 Reviews of salinity since 1983
Review Author Year
GENERAL
Wheatbelt salinity : a review of the salt land Department of Agriculture 1983
problem in South WA
Select Committee on Salinity WA Government 1988
Salinity : A New Balance Salinity Taskforce 2001
Inquiry into the extent and economic impact of Australian Senate Committee 2006
salinity –
Australia’s National Action Plan For Salinity And David Pannell and Anna Roberts 2010
Water Quality: A Retrospective Assessment
WA Salinity Review Roy Green and Colin Creighton 2010
Management of Salinity OAG 2018
SPECIFIC ASPECT
Review of Strategic Tree Farm project URS 2008
Review Of The State NAP And NHT2 Monitoring Department of Agriculture and Food 2010
And Evaluation Plan Western Australia (DAFWA)
SAP - Evaluation Of The Catchment Demonstration URS 2010
Initiative
GHD | Report for Department of Primary Industries and Regional Development –New Direction for Salinity 6137688 | 10Review Author Year
SAP - Review of Rural Towns Program URS 2001
Natural Diversity Recovery Catchment Program: Department of Environment and 2010
Review Conservation
Salinity And Land Use Impacts Program Review Department of Water 2012
Salinity Management In The South West Of WA Conservation Commission 2013
Review of Inland Drainage Research GHD 2017
As the focus expanded from salinity to broader NRM, the focus of reviews similarly expanded,
Table 4. From 2006 to 2009 there were at least six reviews into NRM governance and
programs.
Table 4 Review of Natural Resource Management programs and
governance
Review Scope and Recommendations
Keogh Identified the significant investments in human, time and financial resources needed to
Review establish the regional delivery model nationally. It also identified the importance of
(2006) communication and gaps in engagement
Hicks Focused on WA governance frameworks and structures.
Review
(2006)
Reviewed the capabilities of government agencies and community in the delivery of
Read
NAP/NHT.
(2007)
Read concluded that the deficiencies related primarily to engagement, project planning
and management; administration and outcomes-based reporting
Griffith et Identified key attributes and standards that could be applied for future quality assured
al (2007) regional NRM.
URS Undertook an evaluation of the effectiveness of the regional investment planning,
(2008) approval and review process.
The evaluation focused on areas for improvement and recommendations for a future
NRM program including:
more clarity around roles and responsibilities;
allowing more time to develop the whole process and subsequent documentation;
consistency in agency assessment and feedback;
improved communications on the steps of the process; and valuing of people’s
efforts within the process.
English et There is strong support for the continuation of a State NRM Program. However,
al (2009) the State NRM effort needs to better reflect the community’s values and priorities.
Extensive activity has occurred during the last five years and some excellent
outcomes achieved by State agency and Regional NRM Group programs.
However improvements in program implementation (i.e. planning; service delivery;
and monitoring, evaluation and reporting) are needed so that the State’s
investment better targets the outcomes sought by the community.
GHD | Report for Department of Primary Industries and Regional Development –New Direction for Salinity 6137688 | 11Review Scope and Recommendations
The panel concluded that for the government to successfully implement a State NRM
Program that reflects these values and priorities, a strong community engagement
component must be an integral part.
With respect to research into dryland salinity, the first national program was the National
Dryland Salinity Programme (NDSP). Between 1993 and 2004, the NDSP provided a national
forum for exchange of knowledge, building links and providing government, communities and
individuals with the information and technology required to manage dryland salinity in
Australia.
The key messages to emerge from the NDSP, which are still relevant today, were:
Salinity costs are significant and rising, hence responses must be strategic.
Profitable options for reversing the trend are lacking, but under development.
There is no one salinity problem: It challenges us to look beyond traditional policy
instruments.
Integrated catchment management must be seen as only one approach to deal with
dryland salinity.
Vegetation management remains the key to managing water resources, although the
benefit:cost ratio of re-vegetating catchments requires careful analysis.
Lack of capacity is an important, but secondary constraint to managing salinity.
From 2001 – 2007, the CRC for Plant-based Management of Dryland Salinity aimed to develop
plant-based methods of reducing environmental, economic and social impacts of dryland
salinity. While the CRC for Future Farm Industries operated from 2007-2014 with the objective
to contribute substantially to Australia’s growth through the transformation of agricultural
production across southern Australia using perennial plant based farming systems.
Since 2014, dryland salinity research has been funded through research development
corporations such as Grains Research and Development Corporation (GRDC), Meat and
Livestock Australia (MLA) and AgriFutures, but at a much lower level and with little
coordination across programs.
GHD | Report for Department of Primary Industries and Regional Development –New Direction for Salinity 6137688 | 124. Past Strategic State Government
Salinity Programs
The state level plans for salinity management in the 1990s and 2000s implemented a number
of WA Government programs, particularly as part of the National Action Plan for Salinity and
Water Quality. These strategic salinity programs included:
Engineering Evaluation Initiative (EEI)
Wheatbelt Drainage Evaluation (WDE)
Catchment Demonstration Initiative (CDI)
Rapid Catchment Appraisal (RCA)
Strategic Tree Farms (STF)
Rural Towns – Liquid Assets (RT-LA)
Sustainable Grazing on Saline Land (SGSL)
Salinity Investment Framework (SIF)
Each of these programs was time-bound with specific objectives in contrast to the longer term
programs of Water Resource Recovery Catchments (WRRC) or Natural Diversity Catchments.
Whilst this can be an advantage, it can also mean that the programs may not leave a legacy
and the outputs and outcomes possibly forgotten. A summary of the objective, status and a
short assessment is provided in Table 5.
There would be benefit in reviewing these programs in detail some years after the programs
have ceased. This could include:
sites which were well monitored and documented,
sites where trees were planted as part of the STF,
the four CDI catchments, and
the sites implemented as part of the EEI.
This list does not include State Government programs related to oil mallee and bluegum
investments nor does it include the programs funded by the Commonwealth government or
industry given that the focus of this review is on the initiatives and programs of the WA
government. As such, there are many valuable programs that were implemented by Regional
NRM groups, catchment groups and landcare networks that were not, nor are being assessed.
.
GHD | Report for Department of Primary Industries and Regional Development –New Direction for Salinity 6137688 | 13Table 5 Summary of past strategic State Government salinity programs
Programme Objective Status Assessment
Engineering Evaluation Initiative / Wheatbelt Drainage To review the current knowledge on engineering The Review of Engineering and Safe Disposal Options There is informal advice that ad hoc deep drainage is
Evaluation options to mitigate dryland salinity and to clarify ‘best (Dogramaci and Degens 2003) identified gaps to guide occurring for salinity mitigation.
$4m / $2.4m practice’ by establishing demonstration sites for a investment under the EEI.
range of engineering options. There is a continuing need to monitor and evaluate the
Test and evaluate current engineering approaches to In reviewing the achievements against the gaps identified impacts and benefits of engineering options for salinity
salinity remediation. in Dogramaci and Degens (2003) GHD identified that five mitigation. This should build on rather than replicate the
Understand impacts at local and regional scales. out of the eight high priority recommendations were significant investigations that have occurred to date.
Develop and test improved engineering for salinity achieved. The three not achieved related to monitoring
management. criteria, transmission losses and sodicity. The financial There needs to be renewed strategic engagement on this
recommendations were achieved and 8 out of the 9 lower issue. Drainage governance should be a priority area for a
priority recommendations were achieved. reformed SLCC, rather than re-establishing the Wheatbelt
Drainage Council.
Regional drainage evaluation of Avon River, Yarra Yarra
catchment, and Blackwood Basin completed and
development of governance including Wheatbelt Drainage
Committee, defining roles and responsibilities for inland
drainage and a policy framework for inland drainage.
The Review of Inland Drainage Research (GHD, 2017)
assessed 18 key reports delivered under the the EEI and
Wheatbelt Drainage Evaluation and provided a summary
of key findings and recommendations.
Catchment Demonstration Initiative The initiative aimed to demonstrate viable salinity URS in the review of the program considered that the CDI The CDI delivered on the objectives of the program and
$6m management systems in the agricultural area of WA. The Program had delivered on its objectives and served its commitments made.
CDI sought to deliver its outcomes in partnership with purpose to demonstrate this catchment-level intervention
NRM Regions by co-investment in targeted, large-scaled, approach, and that accelerated adoption of desired However the benefits of a CDI program outside of the
catchment-based demonstrations of integrated salinity practices has occurred catchments selected are not considered significant. With
management practices respect to the objective of achieving integrated salinity
URS also state that it was clear that there were difficulties management across the Wheatbelt approaches such as
The four CDI projects were: and frustrations in implementation at all levels, and developing economic drivers for change and targeted
concerns about the universality of the approach. Given investment in priority areas are more attractive.
Gillingarra-West Koojan (‘Gillingarra’) Catchment these difficulties, and the impracticality of implementing
Demonstration; this approach over the wider dryland agricultural areas,
Wallatin-O’Brien (‘Wallatin Creek’) Catchment the approach need not be repeated, nor implemented
Demonstration; more widely in addressing land and water management
Upper Coblinine (‘Upper Coblinine’) Catchment issues in the agricultural areas.
Demonstration.
Fitzgerald River (‘Fitzgerald’) Catchment
Demonstration.
Rapid Catchment Appraisal To ensure that all farmers receive technical The RCA program assessments were competed in There is a role for catchment planning and action
information to ensure informed decisions are made 2007 (DAFWA Annual report 2007) with the last when one landholder’s management of water affects
in managing salinity. RCA report being published in 2009. others such as in dryland salinity.
The RCA approach is to provide landholders in
agricultural areas with: However the need for sustained effort to maintain
An assessment of current salinity the focus means that a targeted approach is clearly
Risk of further spread required. Identifying catchments for targeted
Options for managing those risks and their likely response with scarce resources needs to be based
impacts; on SIF principles.
Help in accessing further assistance
Strategic Tree Farms The aim was to produce two main outcomes: URS Conclusions - Performance Story Report for
$64m environmental benefits, such as improved land and the contribution of Strategic Tree Farming to
Regional NRM outcomes – 2008 included:
GHD | Report for Department of Primary Industries and Regional Development –New Direction for Salinity 6137688 | 14You can also read


