Transportation Activity Management Plan - Investing in Community Outcomes 2021-24 - Opotiki District ...
←
→
Page content transcription
If your browser does not render page correctly, please read the page content below
Transportation Activity
Management Plan
Investing in Community Outcomes
2021-24
TRANSPORTATION ACTIVITY MANAGEMENT PLAN   φτφυ

Record of Amendments

 Ref   Description                                                  Date           By

  1    Draft Document – 26th September 2020                      21/09/2020   R Humpherson

  2    Draft submission – 11th December 2020                     11/12/2020   R Humpherson
TRANSPORTATION ACTIVITY MANAGEMENT PLAN           φτφυ

Executive Summary
Strategic Context
This Transport Activity Management Plan (AMP) 2021-24 defines the transportation activity for the
Ōpōtiki District. It sets out rationale for investment in Councils transportation assets and how the
investment programme will deliver key benefits and outcomes for the community. This is aligned to
the Government Policy Statement on transport (GPS) and the Ministry of Transports outcomes
framework (TOF), which define the four strategic priorities, and key outcomes for land transport
investment.

    1. Safety – Healthy and safe people where the transport system provides inclusive access,
       economic prosperity, resilience, and security.
    2. Better Travel Options – Inclusive access that provides healthy and safe people,
       environmental sustainability, economic prosperity, resilience and security
    3. Improving freight connections – Economic prosperity that supports resilience and security,
       environmental sustainability, and healthy and safe people
    4. Climate Change – an environmentally sustainable system that provides for inclusive access,
       healthy and safe people, resilience and security.

These priorities and outcomes are closely aligned with the Councils Long term plan community
outcomes.

Strategic Focus
The district has started on a journey of growth and development and it is important that how we
maintain, operate, renew and improve the transport network supports the community on this
journey. However, the district faces a number of problems that need to be addressed.

With growth comes a number of problems. Economic development has led to an increase in traffic,
including more heavy vehicles, that are resulting in increased deterioration and maintenance
requirements on the network.

The impacts of climate change are starting to be experienced with increased annual rainfall and
higher intensity storms that have an impact on network resilience.

Road safety continues to be an issue with the district being within the 10 highest road controlling
authorities in regards personal risk rating, and a death and injury social cost of $62.62 million to the
district for 2010 to 2019.

As the town expands there is also more demand for connectivity and facilities that provide safe
travel choices for pedestrians and cyclists.

The focus of the planned investment in the district is to address these problems and deliver on three
key benefits for the community.

                                                                                                           i
TRANSPORTATION ACTIVITY MANAGEMENT PLAN        φτφυ

Benefit 1: Healthy and Safe people: a reduction in personal risk on our network roads; and
improvement in the perception of safety and ease of walking and cycling in the district
Benefit 2: Resilience and Security: network risks are managed to maintain access for the community.
Benefit 3: Economic Prosperity: improved High Productivity Motor Vehicle (HPMV) access; and
improved walking and cycling access to social and economic opportunities.

Programme of Investment
The proposed programme of investment for the 21-24 period is $12.08M, which is a 19% increase on
the 2018-21 programme of $10.17M. This programme qualifies for subsidy from the National Land
Transport Programme (NLTP) at 75% of the programme cost.

 $6,000,000

 $5,000,000

 $4,000,000

 $3,000,000

 $2,000,000

 $1,000,000

        $0

                     Operations and maintenance   Road renewals    Improvements

There is a 19% increase in maintenance and operations due to forecast increases from the new road
maintenance contract to be tendered in 2021, and the increasing maintenance requirements on the
network. Renewals increase by 18% to cover the costs of renewing rural roads affected by the
increase in heavy traffic due to economic development, and a need to address the risks of ageing
seals on the network. The improvements programme has an increase of 56% which is required to
complete the upgrade of town lighting.

Investment Risks
The current overall network condition is considered fair to good, as measured against other
provincial centres. We have been able to achieve this by delivering more, for less cost, due to
favourable local pricing of contract works. The supply of local aggregates and increasing costs for
contractors are a risk to the affordability of the programme going forward. The consequences of
potential cost increases will be deferred maintenance and network improvements, with increased
risks of asset deterioration and a reduced ability to deliver the desired community outcomes.

                                                                                                      ii
TRANSPORTATION ACTIVITY MANAGEMENT PLAN                                φτφυ

Contents
Executive Summary ............................................................................................................................ i
    Strategic Context ............................................................................................................................ i
    Strategic Focus ............................................................................................................................... i
    Programme of Investment ............................................................................................................. ii
    Investment Risks............................................................................................................................ ii
Part 1: Strategic Case for Investment ................................................................................................. 5
1      Introduction .............................................................................................................................. 5
    1.1       Purpose.............................................................................................................................. 5
2      Background ............................................................................................................................... 5
    2.2       Looking back at 2018 to 2021 AMP..................................................................................... 6
3      Partners and Key Stakeholders................................................................................................... 8
4      Strategic context ........................................................................................................................ 8
    4.1       National Context ................................................................................................................ 9
    4.2       Regional Context .............................................................................................................. 10
    4.3       Local Context – Community Outcomes ............................................................................. 12
5      Assessment of current performance ........................................................................................ 14
6      Key Challenges......................................................................................................................... 17
    6.1       Economic Development and Network impact ................................................................... 17
    6.2       Network Resilience and Climate Change........................................................................... 21
    6.3       Providing for Community and Growth .............................................................................. 24
    6.4       Road Safety ...................................................................................................................... 26
    6.5       Status of the Evidence Base.............................................................................................. 29
7      Strategic Case assessment ....................................................................................................... 29
8      Strategic Response .................................................................................................................. 29
    8.1       Hierarchy of Intervention ................................................................................................. 29
    8.2       Benefits analysis............................................................................................................... 30
    8.3       The preferred investment strategy ................................................................................... 31
    8.4       Delivery of the Strategy .................................................................................................... 32
    8.5       Programme Risks ............................................................................................................. 33
Part 2: Programme Business Case .................................................................................................... 34
9      Framework and Alignment to Strategic Case ............................................................................ 34
10         Asset Management .............................................................................................................. 34
    10.1      Network and Asset Management ..................................................................................... 34

                                                                                                                                                  iii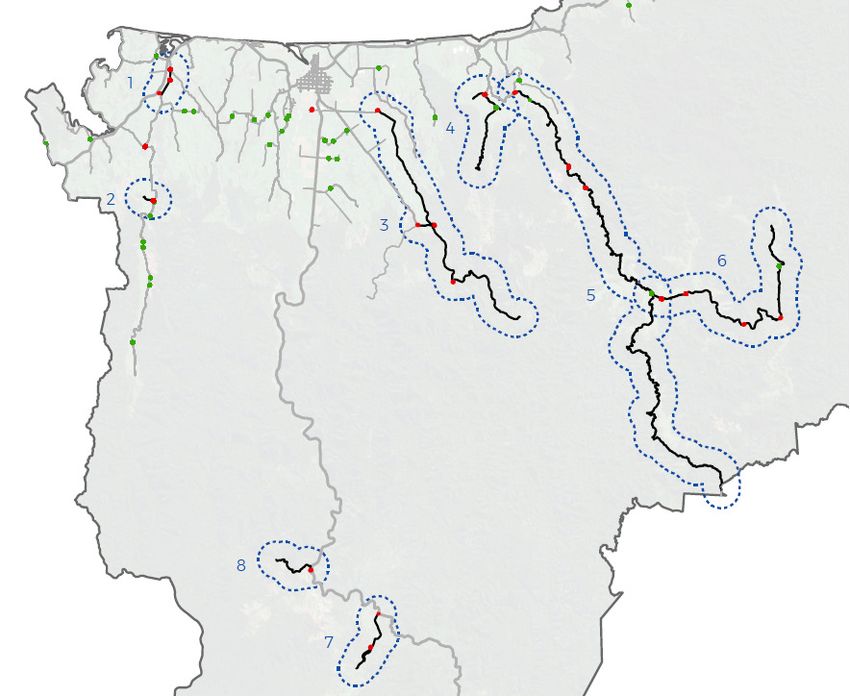
TRANSPORTATION ACTIVITY MANAGEMENT PLAN                                φτφυ

   10.2      Asset Data ........................................................................................................................ 36
   10.3      Asset description.............................................................................................................. 37
   10.4      Asset Valuation ................................................................................................................ 42
11        Lifecycle Management ......................................................................................................... 43
   11.1      Overview of Lifecycle process........................................................................................... 43
   11.2      Sealed Pavements and Surfacing ...................................................................................... 44
   11.3      Unsealed Pavements ........................................................................................................ 50
   11.4      Drainage Assets................................................................................................................ 52
   11.5      Bridges and Structures ..................................................................................................... 55
   11.6      Walking and Cycling ......................................................................................................... 57
   11.7      Street Lighting .................................................................................................................. 59
   11.8      Traffic Services and Roadside Maintenance ...................................................................... 61
12        Preferred Programme .......................................................................................................... 63
   12.1      Programme delivery ......................................................................................................... 63
   12.2      Consideration of options and Preferred Programme ........................................................ 63
13        Risk Management ................................................................................................................ 65
14        Improvement Programme.................................................................................................... 67
   14.1      Review of Asset Management Processes .......................................................................... 67
   14.2      Improvement Plan............................................................................................................ 68
Appendix A – Maintenance, Operations and Renewals Request ....................................................... 72
Appendix B – Low Cost Low Risk Programme ................................................................................... 75

                                                                                                                                                iv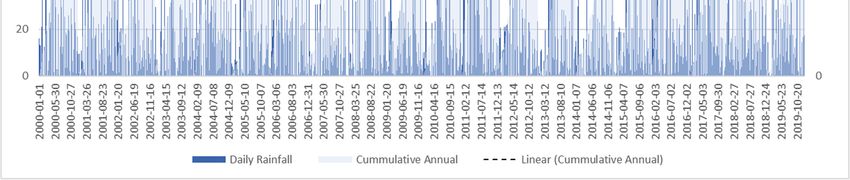
TRANSPORTATION ACTIVITY MANAGEMENT PLAN          φτφυ

    Part 1: Strategic Case for Investment

1 Introduction
The transport network is a significant and essential physical resource in the District contributing to the
social and economic well-being of residents, visitors and businesses. The transport network is essential
to the continued growth and economic success of the Ōpōtiki District and must be managed, safely,
efficiently and effectively, now and in the future.

Transport planning, policy and networks are all provided through the transportation activity. This
includes transport infrastructure including roads, footpaths, cycleways, parking facilities and bridges;
and traffic control mechanisms (such as signage, lighting and road markings). This activity ensures a
safe, efficient and affordable transport network that helps with the movement of people, goods and
services.

1.1 Purpose
The purpose of this plan is to assess the community transport requirements and propose an evidenced
based case for investment. The Transport Activity Management Plan (AMP), a ten year plan that
prioritises and addresses key transportation issues and illustrates how assets are intended to be
managed to provide agreed service levels for the community. This plan seeks to build on the investment
case from 2018 to 2021 AMP, reviewing the problems, the key challenges and progress to date.

2 Background
2.1.1 The Ōpōtiki District Road Network
The Ōpōtiki transport network is currently classified by the One Network Road Classification (ONRC).
ONRC classifications were initially assessed in 2015 based on the traffic estimates in RAMM. A review of
classifications was completed in 2020 to account for changes in management requirements for the
network and functional changes in network use. There is currently a review of the ONRC to incorporate
the different “place” functions of roads. This is referred to as the One Network Framework (ONF) which
is to be implemented during the next three years. The change to ONF will mostly affect larger urban
networks and will not have a major effect on the majority of Ōpōtiki classifications. 12% of the Ōpōtiki
Network length is classified as Urban.

The ONF will change the classification of a number of roads in and around the town centre. The Town
centre is currently in the process of an options assessment for revitalisation which may affect the
function of a number of roads.

The current classification of the Ōpōtiki District road network is provided in Table 2 below. As a small
District, Access and Low Volume roads make up the largest proportion of roads within the District at
78% of the length. The Arterials, Wainui Road and Church St make up just over 1% but carry 24% of the
traffic.

                                                                                                           5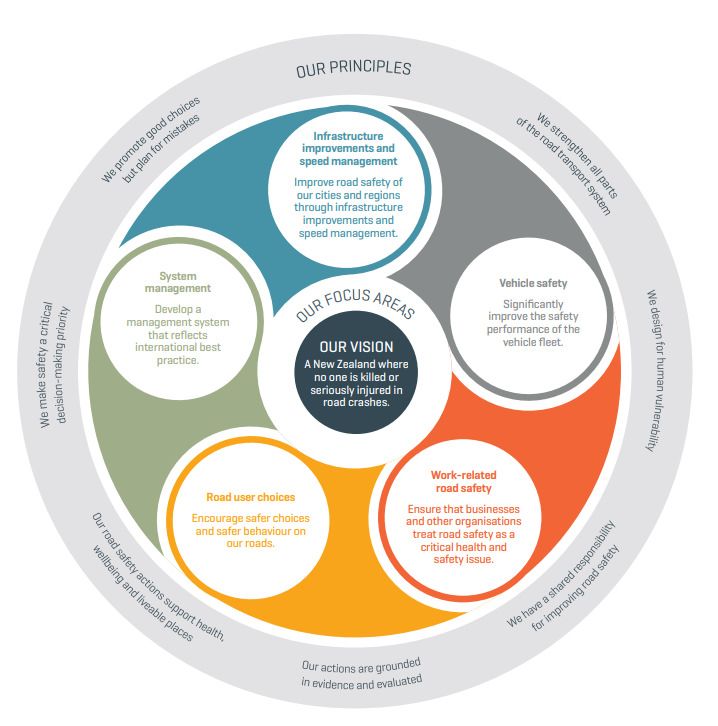
TRANSPORTATION ACTIVITY MANAGEMENT PLAN           φτφυ

 ONRC road                            Description                             Proportion of         Vehicle
 categories                                                                    roads in the       Kilometres
                                                                              Ōpōtiki District     Travelled
                                                                               (and length)        per year

 Arterial       These roads make a significant contribution to social
                and economic wellbeing, linking regionally significant
                places. In urban areas they may have significant                   1.1%             2.27M
                passenger transport movements and numbers of                     3.525 km           (24%)
                cyclists and pedestrians using the road.

 Primary        These are locally important roads that provide a
 Collector      primary distributor/collector function, linking
                significant local economic areas or areas of                       0.3%             0.26M
                population. In urban areas they may have moderate                0.978 km           (3%)
                passenger transport movements and numbers of
                cyclists and pedestrians using the road.

 Secondary      These are roads that provide a secondary
 Collector      distributor/collector function, linking local areas of
                                                                                   20.3%            3.90M
                population and economic sites and may be the only
                route available to some places within this local area.          65.342 km           (41%)

 Access         These are all other roads. Low volume roads within                 46.1%
                this category will fall into the low volume subset.
                38% of these roads in the district are unsealed.               148.539 km           2.46M

                                                                             (92.5km sealed,        (26%)
                                                                            56.0km unsealed)

 Access         These are subset of the Access Category where the                  32.2%
                average traffic on rural roads is less than 50 vehicles
 Low            per day for rural roads and 200 vehicles per day for           103.764 km           0.58M
 Volume         urban roads. 88% of these roads in the district are          (11.9km sealed,        (6%)
                unsealed.                                                   91.8km unsealed)

 TOTAL                                                                         322.148 km         9.46 M vkt

Table 1 : Proportion and length of roads in each ONRC road category within the Ōpōtiki District

2.2 Looking back at 2018 to 2021 AMP
Council is required to produce an AMP every three years. When considering the future, it is helpful to
look back and see where we have come from. Reviewing past plans and understanding what has
actually occurred provides continuity for understanding Council’s intentions for the future, both in a
financial and non-financial sense. The 2018 to 2021 AMP outlined a number of key issues and problems
that faced the district. Many of these issues remain and will do for the foreseeable future.

                                                                                                               6
TRANSPORTATION ACTIVITY MANAGEMENT PLAN        φτφυ

   •   Ageing assets from a maturing network resulting in higher maintenance requirements and
       programmed renewals.
   •   Economic development requiring investment and planning for support of horticulture growth
       and industry associated with harbour development.
   •   Global warming (Resilience issues, storm damage from intensity and frequency of storms,
       coastal erosion, sea level rise, and storm water management)
   •   Changing demographic - ageing population requiring different infrastructure needs for modal
       travel choices.
   •   Population and rateable dwelling growth resulting from economic development in the district
       will start to put pressure on transport links.
   •   Road safety, Ōpōtiki District ranks highly against other provincial centres.

The following table outlines the key activities proposed by the 2018-21 AMP that were aligned to the
issues identified and provides an understanding of progress made.

  2018 to 21 Activities                Description                    Achievement/Progress
 Road Surface Renewals     The length of reseals (% of          Achieved 10.3 km average over last
                           network resurfaced) was              three years. Building backlog of
                           proposed to increase from 9.4km      expired surface lives on network
                           per year to 12km per year.
 Pavement Renewals         Continue urban street renewals       2 of the 3 years programme
                           and rural rehabs programme.          achieved. Increase in costs and
                                                                COVID impacts resulted in reduced
                                                                achievement in 2019.
 Bridge Component          Replacement of degraded bridge       Major renewals undertaken and
 Replacement               components to maintain Access        backlog addressed
 Road Network Asset        Improve data capture and             Improvement in data quality score
 Management                accuracy of Asset inventory          and asset inventory validation
                                                                completed
 Motu Trails cycleway      Extension of Motu trails west to     Not funded in NLTP, some progress
 Extension                 Ōhiwa harbour                        made through government
                                                                stimulus packages
 Harbour Access Roads      New road construction to provide     Harbour development funded
                           access to harbour development        through PGF, Snell Road
                                                                constructed, and retrospective
                                                                business case submitted for
                                                                funding.
 Town Lighting             Installation of infill lighting in   60% of programme completed.
 Improvements              town to bring urban streets up to    Funding to be applied for to
                           appropriate lighting standards       complete remaining works in 2021-
                                                                2024
 Walking and Cycling       Improvements to walking              Minor works completed. Additional
 improvements              infrastructure through urban         assets developed through
                           street renewals programme            government stimulus packages
 Road Markings and         Delineation review to assess         Review completed and programme
 Signage Review            status of network signs and          of proposed improvements
                           markings                             delivered.
Table 2 : 2018 to 2021 Programme Achievements
The major achievement from the 2018 to 21 period was the funding of the Ōpōtiki Harbour. This
unlocks a huge potential for the district, providing employment opportunities and growth.

                                                                                                       7
TRANSPORTATION ACTIVITY MANAGEMENT PLAN         φτφυ

Other transport programmes were either fully delivered or have made good progress over the term of
the AMP.

3 Partners and Key Stakeholders
Delivering transportation outcomes have far reaching results in terms of social, economic and
environmental factors. To effectively deliver this the transportation activity overlaps with other Council
activities, for example, district planning, economic development and community services.

Engagement with external partners is achieved through joint planning and programmes at the national,
regional, sub-regional and local level. Key groups include the Bay of Plenty Regional Council (BoPRC),
Waka Kotahi New Zealand Transport Agency (Waka Kotahi), the Road Efficiency Group (REG), Bay of
Plenty Regional Road Advisory Group (RAG), Road Controlling Authority Forum (RCAF), and Eastern Bay
Road Safety Committee. Engagement with these groups will be important during the process of
engaging on the Transportation AMP.

In terms of setting the strategic context and direction for the AMP our key partners and stakeholders
are those that we work with on a regional and sub-regional level and are outlined in the following table.

             Stakeholders                                 Knowledge/involvement
                                           Controlling Authority for Ōpōtiki District Transportation
                                          network and activities. Manages and provides the services
                                               that develop and maintain the network for the
                                                                  community.

                                           Sets out the activities that can receive funding from the
                                           National Land Transport Fund under the Land Transport
                                                 Management Act. Key investment partner.
                                           Sets the direction for the region’s land transport system
                                          for the next 30 years through the Regional Land Transport
                                                                    Strategy.
                                           Neighbouring RCA with whom we have a strong strategic
                                                                   alignment.

Table 3 : Key stakeholders involved in the development of the strategic case

4 Strategic context
This section provides the strategic context for transportation. It outlines the relevant legislative and
strategic objectives for the transportation activity.

The strategic context starts with the relevant legislative framework for transport, how the Local
Government Act 2002 and Land Transport Act 2003 align with the relevant strategic documents at the
following levels:

    1. National – The Government Policy Statement on transport (GPS)
    2. Regional – Regional Land transport Plan (RLTP)
    3. Local – Council Community Long term Plan (LTP).

                                                                                                           8
TRANSPORTATION ACTIVITY MANAGEMENT PLAN φτφυ
Each of these documents influence the development of the AMP, levels of service (LOS) and the delivery
of the transport activity. These key driving documents are described in the following subsections.
4.1 National Context
Within the national policy context, the strategic direction in the Government Policy Statement on Land
Transport (GPS), and Arataki play a key role in the development of AMPs.
4.1.1 Government Policy Statement on Land Transport (GPS)
The Land Transport Management Act 2003 requires the Minister of Transport to issue a Government
Policy Statement. The GPS sets out how central and local government will invest in the land transport
system to help our towns and cities to function smoothly and grow well. It does this by contributing to
five key outcomes, identified in the Ministry of Transport’s Transport Outcomes Framework (TOF).
Figure 1 : Ministry of Transport - Transport Outcomes Framework
The GPS sets four strategic priorities for land transport investment to best contribute to improving our
communities’ wellbeing and liveability:
• preventing deaths and serious injuries,
• decarbonisation,
• better transport choices for New Zealanders as we move about our cities and regions, and
• improving freight connections.
9TRANSPORTATION ACTIVITY MANAGEMENT PLAN φτφυ
Figure 2 : Government Policy Statement Strategic Priorites
The primary outcomes and Co-benefits of each strategic priority support each other and are:
5. Safety – Healthy and safe people where the transport system provides inclusive access,
economic prosperity, resilience, and security.
6. Better Travel Options – Inclusive access that provides healthy and safe people, environmental
sustainability, economic prosperity, resilience and security
7. Improving freight connections – Economic prosperity that supports resilience and security,
environmental sustainability, and healthy and safe people
8. Climate Change – an environmentally sustainable system that provides for inclusive access,
healthy and safe people, resilience and security.
Investment in the transport system is through the National Land Transport programme.
4.1.2 National Land Transport Programme
The National Land Transport Programme, developed by Waka Kotahi, sets out the activities that can
receive funding from the National Land Transport Fund under the Land Transport Management Act. The
National Land Transport Programme must give effect to the GPS and regional land transport
programmes must be aligned with the GPS.
4.2 Regional Context
The Bay of Plenty road network forms part of the wider Upper North Island and national land transport
network. Important inter-regional connections are to the Waikato and Auckland (SH29 and SH2),
Gisborne (SH2) and Taupo (SH5). State Highways also provide intra-regional connections between the
main urban centres and to the Port of Tauranga.
10TRANSPORTATION ACTIVITY MANAGEMENT PLAN φτφυ
4.2.1 Bay of Plenty Regional Land Transport Plan 2018
The Bay of Plenty Regional Land Transport Plan 2018 (Regional Strategy) sets out the priorities and
activities the region will work towards in the next six years with a long term view of what might happen
in the next 30 years. The region’s vision for transport is the “best transport systems for a growing
economy and a safe, healthy and vibrant Bay lifestyle for all”.
The RLTP sets out 4 main challenges and opportunities for the region. Each of these influences and
shapes the strategic transport issues for the region:
Figure 3 : Regional Strategic Drivers
From the assessment of these strategic drivers the region has identified the following priority land
transport problems and benefits
Figure 4 : RLTP Problems and Benefits
11TRANSPORTATION ACTIVITY MANAGEMENT PLAN φτφυ
Other sub-regional and regional strategies and plans that also have an influence on this AMP. These
include:
• Eastern Bay Beyond Today (2016)
• Eastern Bay Road Safety action plan (2018)
• Eastern Bay of Plenty Regional development Project (2018)
• Bay of Plenty Regional Economic Development Strategy.
4.3 Local Context – Community Outcomes
The Land Transport Network in the Ōpōtiki District enables the safe and efficient movement of people
and goods and services. It provides access to economic development and jobs, the “first mile” of freight
connections, and contributes to the social and environmental outcomes of the District.
An efficient, safe and reliable Land Transport Network is essential for the economic wellbeing of our
District. Roads provide access to properties, unlock opportunities for development, and provide for the
passage of traffic and the transportation of goods and services.
4.3.1 Long term plan (LTP)
The LTP 2018-2028 sets out the Council’s vision and strategy for the district and is a high-level key driver
for all its activities. The Council’s vision for the district is:
Strong Community – Strong Future
The Community Outcomes were created by the community in conjunction with Council. They help guide
and inform planning and the setting of priorities. Land transport is directly linked with the following
community outcomes and associated goals as outlined in the Council’s LTP:
12TRANSPORTATION ACTIVITY MANAGEMENT PLAN φτφυ
The district strategy which is defined by the Ōpōtiki District Council aligns very closely with the social,
cultural, economic and environmental well-being of the community, and also the community outcomes.
It identifies the most important projects and those projects that will take this district forward and give
the best return for the ratepayer’s dollar. The specific projects, including specific projects relating to
transportation are balanced through the four distinctive focus areas for the LTP. These focus areas and
the priorities for Council action are provided in Table 4.
Description of key priority Priorities for Council action
Economic growth that creates sustainable • Ōpōtiki Harbour development
employment and respects environmental • Provide visitor and business investment
qualities is the district’s highest priority. information and support and infrastructure that
Economic growth will be secured through supports investment
diversification. At present the district • Support the aspirations of Māori to develop their
Economic Growth
economy is mainly driven by the primary land
industries of agriculture and horticulture. • Support local and regional business growth and
This primary sector will steadily grow workforce development
through increased kiwifruit, honey and • Promote facilities and activities to increase
Manuka oil production throughout the visitors, including historic precinct development
Ōpōtiki District. and Mōtū Trails cycleway.
The quality of life for Ōpōtiki residents will • Provide infrastructure e.g. roads, water,
be underpinned by Council’s core services stormwater, sewerage, waste management,
such as water, stormwater, sewerage, renewal of Ōpōtiki Township wastewater
roads and solid waste management. These reticulation network
services will be complemented by facilities • Advocate with and on behalf of Ōpōtiki
that promote community well-being, communities to central government
including park and recreation facilities and • Develop the Technology and Research Centre
libraries. • Provide recreation facilities including
development of walkways and cycleway
• Support initiatives for development in the Coast
ward
Quality of Life
• Proactive provision for infrastructure
• Provision of a District Plan that meets our needs
going forward
• Community where people feel safe
• Life enrichment.
The creation of facilities and infrastructure • Complete the District Plan review and
to optimise the use and enjoyment of implementation
natural resources while protecting the • Maintain and enhance parks and reserves
Environmental
natural environment. • Partner with community groups, iwi and hapū,
BOPRC and DOC to undertake environmental
Quality
restoration projects
• Continue to work with partners to maintain,
enhance and grow the Mōtū Trails cycleway.
Council will continue its role in fostering • Promote and support community events
Strong Community Spirit
strong communities by sponsoring • Provide sports fields and facilities for community
community initiatives, organising the use e.g. pavilions
awards for achievers and volunteers every • Play our prescribed role in Treaty Settlements,
3 years, and enhancing the quality of life including any legislated joint governance
of residents. With economic growth there arrangements, and any orders made under the
will be an increased number of community Marine and Coastal Areas Act
events and activities to foster community • Support programmes to deliver good jobs for local
spirit. people.
Table 4 : Council’s key priorities in the LTP (2018-28)
In addition, there are a number of District Council strategies, policies and plans that also have an
influence on this AMP. These are summarised in Table 5.
13TRANSPORTATION ACTIVITY MANAGEMENT PLAN φτφυ
ODC strategy, Linkages to transportation
policy, plan
Infrastructure Upgrading Council’s infrastructure to cater for growth and demographic changes
Strategy in particular areas.
2021-2051 Ensuring the health and safety of the community by developing and maintaining
safe walking and cycling infrastructure to support safe alternative transport
solutions.
Addressing the earthquake risk posed by natural hazards by identifying,
assessing and prioritising the Council’s earthquake prone assets, including
bridges.
Addressing the effects of Climate change and the impact on coastal
infrastructure
To address the Council’s issue of ageing infrastructure. Significant expenditure
required for renewals to the roading network, including a number of bridges
that will reach the end of their useful life.
Walking and Aims to develop a District where walking and cycling are convenient, attractive
Cycling Strategy and popular forms of everyday transportation and recreation. A District that
promotes sustainable transportation and provides for the growing cycle tourism
market.
Opotiki District The relationship between land-use and the transport network is a significant
Plan one that relates to the importance of access to individual properties and
businesses at the local level and to the safe and efficient movement of goods
and people along main roads. The key areas within the transport section are
safety, efficiency, connectivity and a well-designed transport network that
responds to its environment.
Eastern Bay of Working together to ensure a safe Eastern Bay of Plenty road system that is
Plenty Road increasingly free of death and serious injury. Risk areas include speed, rural
Safety Strategy roads, alcohol & drug impairment, young drivers, restraints, older road users
and distraction.
Economic Key Focus Areas aim to increase the size of the local population and economy in
Development the District. It recognises that driving change requires a collaborative approach.
Strategy Focus is on providing a platform to promote sustainable economic growth
Seal Extension Resurrecting the Seal extension policy of the Council for support of Coast
Policy communities that are prepared to meet local share commitments for seal
extensions on the network.
Table 5 : Transportation Link to Council’s Strategies, policy’s and plans
5 Assessment of current performance
The One Network Road Classification outcome measures provide a measure of how the network is
performing in terms of delivering fit for purpose outcomes. The following comparative measures
provide a snapshot of the district as compared with the provincial centres peer group.
14TRANSPORTATION ACTIVITY MANAGEMENT PLAN φτφυ
Customer Outcome Arterial Primary Secondary Access Low Comments
Collector Collector Volume
1: Number of • The DSI crash trend on the network is increasing for Low volume
serious injuries
access roads.
Safety – Customer outcome
and fatalities • Total DSI’s for the entire network have remained steady over the
(DSI) last 4 years.
2: Collective risk • Collective risk (reported crashes per km) ratings for access and Low
measures
3: Personal risk
Volume roads is slightly higher than the peer group average.
• Arterials have collective risk ratings that are high compared to other
provincial centres.
• Personal risk (Reported crashes per 100M vkt) ratings for the district in
4: Loss of Control
terms of high risk rural roads are either high or medium-high.
• The highest risk roads are Access and Low Volume Roads which have
relatively high personal risks for the provincial centres peer group.
• Total numbers of crashes involving loss of control on wet roads are low
on Wet Roads
with 3 crashes recorded between 2014 and 2019. Two of these were in
2018.
Safety – Technical output measures
5: Loss of Driver • Low numbers of LOC at night crashes with 5 recoded between 2014 and
Control at Night
6: Intersection
2019
• Worsening trend for Low Volume roads
• No intersection crashes on Collector Roads
crashes
9: Vulnerable Users
• Worsening trend for Access and Low Volume
• Although only 7 crashes the trend is worse than peer group average
• Reported serious injuries recoded for vulnerable users remains constant
1 - Smooth Travel
for ODC.
• Trend is outperforming the average for Provincial centres peer group
• Although there is a deteriorating trend the Ōpōtiki district sealed network
Amenity
Exposure (STE) performs well when compared to the Provincial peer group for smooth
travel exposure with less than 4% of trips on rough roads for Secondary
collector and access roads.
15TRANSPORTATION ACTIVITY MANAGEMENT PLAN φτφυ
Customer Outcome Arterial Primary Secondary Access Low Comments
Collector Collector Volume
• Just under 6% of journeys on the districts arterials is above the threshold
of 130 NAASRA
2 - Peak • 85th percentile peak roughness for the network is below the peer group
Roughness
(85th percentile)
Percentage of
Surface Pavement
average for all but primary collectors.
• Rates of surface renewal at 10.4km (6% of sealed network) over the last 5 years are
network renewed currently below an optimum long-term level for a mature network. The rate of renewal is
annually
proposed to grow to around 7.9%, or 13.5km per year over the next three years.
• Historic rates of pavement renewal are low but have stepped up to an average of
0.8km/yr. The proposal is that this is to increase to an average 1km (0.5%) per year as the
network matures.
Sealed road Maintenance Resurfacing Rehabilitation • Routine Pavement and Drainage maintenance costs have increased in line with traffic
maintenance: 4- growth. Shoulder maintenance costs are increasing with higher traffic volumes related to
year annual costs
horticultural development across the district
Cost Efficiency
• Sealed roads resurfacing costs per km are below the average for the peer group,
reflective of the higher proportion of void fill seals undertaken in the last couple of years.
• Pavement renewal costs per km are at the low end for the peer group.
Unsealed road Maintenance Metalling • The unsealed roads pavement maintenance costs per km are at the higher end for the
maintenance: 3- peer group.
year average
annual costs per
kilometre
Overall Network
• The Total metalling costs for unsealed pavements remains steady.
• Overall network costs are increasing proportionally with the growth in traffic on the
Cost (Excluding
Emergency
Works)
network.
• Expenditure per km is greater for higher Classification roads but the cost per vkt show
proportionally more maintenance requirements for lower standard Access and Low
Volume roads.
Note: Safety trends for arterial and low volume roads is based off low crash numbers. Further commentary on Road safety is provided in the review of key
Challenges.
16TRANSPORTATION ACTIVITY MANAGEMENT PLAN φτφυ
6 Key Challenges
6.1 Economic Development and Network impact
There are a number of developments within the Eastern bay of Plenty district that are in development.
These developments will have a positive effect on growing wealth and jobs for the district. The Eastern
Bay of Plenty Regional development report summary from 2018 provides a summary of the new
developments, shown in the following figure, many of which have received funding and are in various
stages of development.
Figure 5 : Economic developments from Bay of Plenty Regional development project report
With the funding of the Ōpōtiki Harbour Development Project and works underway there will be
additional pressure on the ODC transport network, not only from over 600,000 tonnes of locally sourced
rock to be delivered to the construction site, but the additional workforce and service requirements.
PGF funding has also been obtained for development of the Harbour industrial zone on the western approach
to town. Further funding has enabled the start of construction of the mussel processing factory on the
southern side of town. PGF funding has also been obtained for an upgrade of the town centre and
improvements to walking and cycling infrastructure.
The exotic forests South of Ōpōtiki and on the coast are currently being harvested with harvesting forecast
showing a slight decline over the coming years. HPMV access to these parts of the network is still restricted
either due to Bridge restrictions or the geometry of the road. The main areas restricted to HPMVs are shown
on the Figure 6.
17TRANSPORTATION ACTIVITY MANAGEMENT PLAN φτφυ
Figure 6 : HPMV access restrictions
The reduction in Forest harvest is being replaced with growth in the Horticulture sector, mainly kiwi fruit
development. Kiwi fruit developments are underway in Waihou bay, Raukokorere, Te Kaha, Omaio, and
the surrounding area of the Ōpōtiki Township. This is expected to add an additional 8000 tonne per
annum being processed through the Ōpōtiki Cool stores. In addition to Ōpōtiki Developments is a
forecast increase of 12,000 additional tonnes from Gisborne also to be processed in Ōpōtiki. Recent
investment and expansion has occurred at both Kiwi fruit packing houses in Ōpōtiki, and further
development is in the planning to cope with the forecast increases from orchard development.
The planning and development of new transportation assets to fill the current infrastructure gaps will be
required to meet the requirements of the community. Investment to bring existing infrastructure up to
standard to provide safe access will also be required. This includes improved drainage and installation of
footpaths to provide safe access for pedestrians and mobility vehicles within the Ōpōtiki township. Anticipated
growth from town developments is also expected to result in new internal subdivision provided by private
fund sources. This will include the new transportation assets that will have to be created within these
developments.
Tourism in the Ōpōtiki district has steadily increased over the last five years where the Motu Trails cycle ride
has been a major contributor. The Ōpōtiki District council was unsuccessful with getting funding under the
NLTP for the extension of the cycle trail through to Ohiwa harbour in 2018. However, funding through the
Provincial Development Unit and Government stimulus packages has allowed some minor development of the
town section of the trail extension. The full development of the cycle trail and harbour development projects
are forecast to further increase tourism opportunities within the Ōpōtiki district.
These developments happening in the district are forecast to unlock an additional 1,100 jobs over the next ten
years. This increase in activity flows through to the growth of industry support (quarry and machinery service
support) and the service sectors within Ōpōtiki. Such developments and growth in industry and support
18TRANSPORTATION ACTIVITY MANAGEMENT PLAN φτφυ
services will result in greater vehicle movements within the town, and place pressure on existing transport
infrastructure.
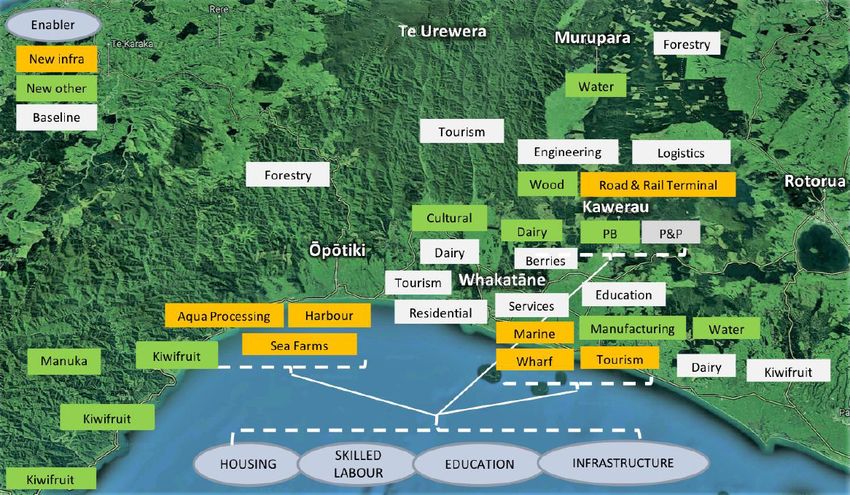
On top of these growing pressures and increased demand the Council is faced with the issue of ageing
infrastructure. Although the average age profile for high value network assets does not indicate an asset
renewal deficit, the maintenance requirements from increased demand on the network is increasing at
12% per year.
Figure 7 : Annual Maintenance Costs as recorded in RAMM
Note: reduction in pavement maintenance for 2019/20 due to COVID 19 shut down in April.
This increase in maintenance costs may be due to a number of factors but most likely related to
increasing loading on the network. The growth in traffic for the network can be demonstrated by the
increase in traffic on SH35 on the entrance to Ōpōtiki. Total traffic volumes at this location have
increased at an average of 4% per year. There was a decrease between 2011 and 2014 but the volumes
have rapidly increased back over the longer-term trend.
The growth in HCV traffic between 2015 and 2018 was nearly twice the growth rate of total traffic but
growth in loading, measured by equivalent standard axles (ESA), follows the rate of total volume. This is
a result of the drop off in Forestry volumes and increase in Horticultural traffic associated with Kiwifruit
developments (refer to section 4.5)
19TRANSPORTATION ACTIVITY MANAGEMENT PLAN φτφυ
Figure 8 : Traffic counts and loading on SH35 at Ōpōtiki threshold
As the network ages this increased loading will continue to have an incremental effect on the pavement
maintenance and renewal requirements for the network.
Resurfacing quantities for the network over the last five years have been averaging 10.46km per year.
This represents 6.1% of the network annually resurfaced. 60% of the network is sealed with a single coat
grade 3 or grade 4 seal with an average age of 10.5 years. A further 20% of the network is surfaced with
a grade 5 void fill seal with an average age of just under 11 years. 21% of the network has expired seal
lives. This represents a large proportion of the network with an increasing surface age and increased risk
of rising maintenance requirements.
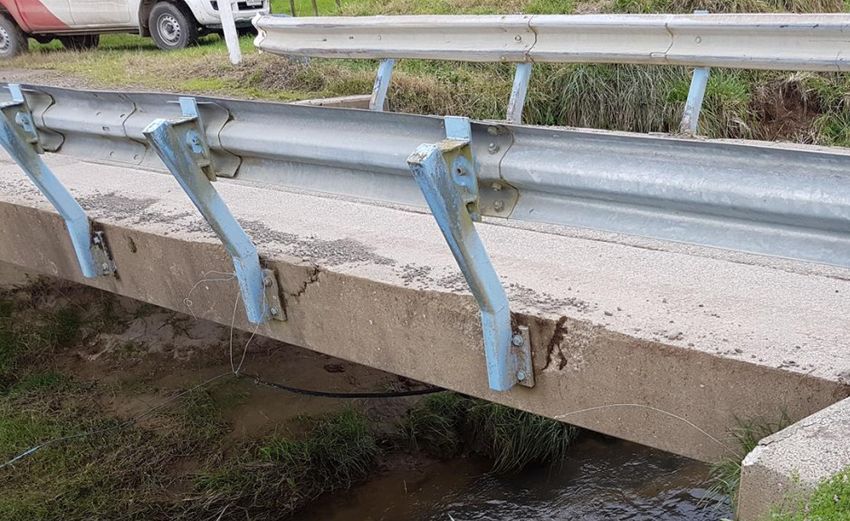
Some high value assets (bridges) are approaching the end of their economic life and have undergone
component replacements during the 2020/21 year to extend their useful lives. Although replacement of
these assets will no longer be required within the next ten-year period, based on current condition
assessments, there will still be a need to maintain structural component renewals within the next three
years to manage risk and maintain levels of service access.
Problem Statement 1: The form and condition of the network will not meet
the required levels of service from increased demand, resulting in restricted
access, loss of productivity, and increased reactive maintenance
20TRANSPORTATION ACTIVITY MANAGEMENT PLAN φτφυ
6.2 Network Resilience and Climate Change
The Ōpōtiki District is located in an area where the threat of natural hazard events is reasonably high,
particularly from severe weather events that frequently and severely compromises access and cause
unplanned disruptions to the transport system. A resilient transport network is an important
economic, social, and safety component, particularly as there are areas within the District where
roading network routes are few or there are no alternatives.
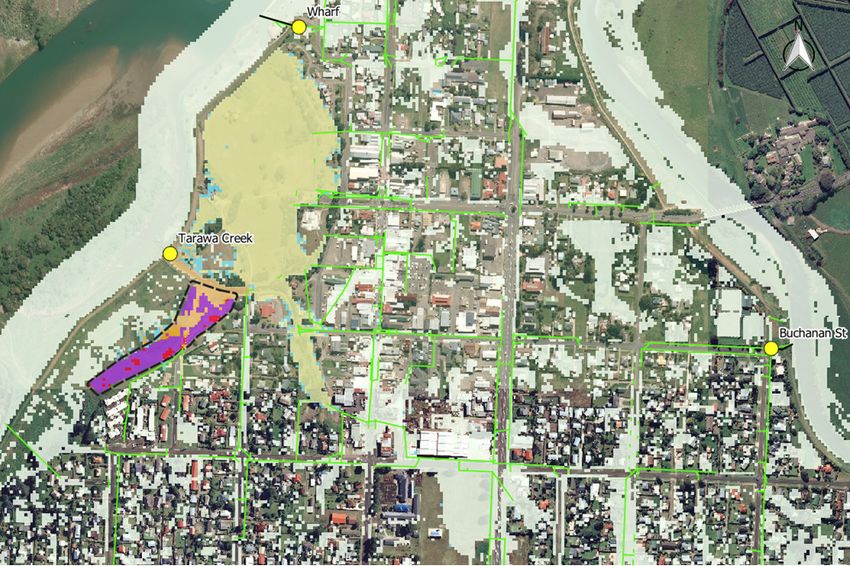
Flooding of road network as a result of high rainfall events; and potential flooding as a result of sea-level
rise due to the effects of climate change. Prime examples include sections around both sides of the
Ohiwa Harbour, Waiotahi River estuary, Gabriels Gully, Waiotahi Valley and Browns Roads, Otara East
and Pakihi Roads, lower Motu Road. Sections of the state highway network are also affected such as
coastal sections of SH2 and at Matekerepu. Lower lying parts of SH 35 such as Raukokere and Hawai are
also affected.
Ongoing assessment will be necessary to plan interventions should climate change effects exacerbate
circumstances. This will require working with Waka Kotahi to prioritise maintenance and Emergency
response operations for SH35 as a lifeline route. Specific works will require undertaking drainage
maintenance, renewals and upgrades of infrastructure to ensure the drainage system performs as
required.
The ongoing assessment of infrastructure resilience will be necessary to plan interventions should
climate change effects exacerbate circumstances.
Waka Kotahi has undertaken route security assessments on the state highway and have developed
options which include raising sections and detour routes onto local roads. This includes the detour for
Waiotahi beach onto Old Creamery Road, which is not suitable for Heavy traffic.
Currently the local road flooding issues are of relatively short duration and of low economic impact.
However, over the past decade the Ōpōtiki District has been subjected to heavy rain events resulting in
widespread surface and river flooding, together with major slips and river scour adjacent to roads, that
disrupt transportation connectivity within the district and regionaly. These events have resulted in the
additional costs to the Council in the form of emergency works, as shown in the graph below. The
figures from 2009 to 2015 are from historical claims. In the period from 2016 to 2019 the district did not
experience any major events and the figures are taken from Emergency works records in RAMM. The 10
year average for emergency works is $275,000 per year.
21TRANSPORTATION ACTIVITY MANAGEMENT PLAN φτφυ
Figure 9 : Emergency works expenditure 2010 to 2020
The areas of the network susceptible to emergency call outs for surface flooding and resilience issues
are shown on Error! Reference source not found.
6.2.1 Climate Change
A changing climate is expected to create both opportunities and risks for the Bay of Plenty. These
predicted changes may be beneficial to some sectors of the agricultural and horticultural industries with
less frost and increased mean temperatures leading to longer growing seasons and continued growth in
horticultural development.
Figure 10 : Climate Change Impacts for the Bay of Plenty
22TRANSPORTATION ACTIVITY MANAGEMENT PLAN φτφυ
Rainfall readings from January 2000 from the regional council site at Browns Bridge on the Otara river
are shown in the figure below. This shows an increase in the number of high intensity events and also
the increasing trend in cumulative annual rainfall per year through to the end of 2019.
Figure 11 : Ōpōtiki Rainfall 2000 to 2019
This shows the predicted effects of climate change on rainfall intensities and total rainfall over time.
Climate Change can affect Councils transportation activity functions in a number of ways. As global sea
temperatures rise with resulting increase in storm intensity the resilience of Ōpōtiki’s transport
infrastructure is likely to be tested. The steep terrain over much of the district results in short run off
concentration times that can overwhelm existing storm water assets.
In designing its assets council will continue to use the latest guidance for the various design parameters.
Climate change effects are built into the design of new assets and on replacement of existing assets.
Some assets may need additional capacity as climate change effects become apparent, however climate
change scenarios indicate there is sufficient time to plan ahead.
Higher ground water from sea water levels not only poses a threat to coastal infrastructure in Ōhiwa
harbour and Orete point, it effects the ability to manage storm water through soakage. This may have
an effect on the load capacity of road pavements with saturated base layers. Ōpōtiki District is already
investing heavily in storm water upgrades to alleviate flooding issues within the township. Many of the
storm water management projects will require reshaping of existing roads to alleviate surface ponding
and flooding issues.
Climate change predictions are for an increase in the size of extreme events over time. It is assumed
that there will be a gradual increase in size of events causing increased erosion and damage. Apart from
Council potentially finding itself facing increased costs of flood and erosion events the related impacts
must be factored in when determining route security.
23TRANSPORTATION ACTIVITY MANAGEMENT PLAN φτφυ
Problem Statement 2: The challenging topography, climate change effects
and network demand will result in reduced network resilience and higher
costs to maintain and restore services
6.3 Providing for Community and Growth
6.3.1 Population Increase
Population change is a key driver of demand for transport. Either as demographic changes demand
different use of the transport system or as growth puts pressure on existing capacity or safety in the
system.
As a smaller community, Statistics NZ predicted in 2013 that Ōpōtiki District would be likely to
experience a static or declining population. However, the report “ ŌPŌTIKI TOWN CENTRE: The role of
the town centre in supporting sustainable growth” ( Martin Jenkins, September 2016) looked at what
effect the current growth industries in Ōpōtiki will have on Population. The report stated:
“Many small and rural populations in New Zealand are not declining. Several are, in fact, growing, and
are likely to continue to do so for some time. Those districts that have grown share some characteristics
with Ōpōtiki, including role, geography, location, climate and purpose, which suggests that Ōpōtiki has
the ingredients for sustainable growth.”
The main points in the report supporting growth in the district have been shown to be correct to date
with growth primarily from internal migration of 1.9% per year. In June 2019, Ōpōtiki district had an
estimated population of 9,720.
Martin Jenkins have produced an update of projections for the 2021 to 2031 LTP. the report “ŌPŌTIKI
DISTRICT POPULATION AND RATEABLE ASSESSMENT PROJECTIONS 2021-2031 (June 2020)” states that
the forecast for the Ōpōtiki district population is an increase to 11,614 residents in June 2031, up from
9,720 in 2019, an average of 1.5% each year.
This growth rate is slightly less than the 2018 projections as it is expected that a greater degree of the
jobs being created from current developments will be filled by local residents.
The district has achieved solid employment growth, with filled jobs increasing by 2.2% each year over
the last five years. This is the fastest employment growth across the three districts in the Eastern Bay of
Plenty.
There are also a number of key projects underway to encourage further employment growth in the
Ōpōtiki district. These are in the aquaculture and horticulture sectors. The harbour development will
also support and enable tourism activity.
Figure 12 below shows the aspirational growth achieved and projections for the district.
24TRANSPORTATION ACTIVITY MANAGEMENT PLAN φτφυ
Figure 12 : Ōpōtiki District Population Projection 2013 to 2043 (Martin Jenkins, 2020)
This growth in population is forecast to result in an additional 570 households over the ten years to
2031. A small proportion of this development will be with infill development within the Ōpōtiki
township. The majority of the remaining areas of development are West of the Waioeka river in the
Hukataia and woodlands area, or development at Waiotahi Drifts, which use SH2 to access the town and
main areas of employment.
Woodlands has access to town with a connected footpath network. The Waiotahi drifts remains
disconnected to active mode alternatives for transport at present.
6.3.2 An Ageing Population
In 1996, when the total population was similar to what it was in 2018, 11% of the community where
over 65. Between 1996 and 2013 as people under 40 left the district for work the proportion of the
district aged 64 years or greater grew to 17%. This compares to 14.3 percent of the total New Zealand
population over 65. The graph below tracks past changes to the Ōpōtiki Districts population age and
shows that the even with younger families moving back into the district the percentage of the
population over 65 has continued to grow to 18%.
25TRANSPORTATION ACTIVITY MANAGEMENT PLAN φτφυ
Figure 13 : Opotiki Population by Age (Statistics NZ subnational estimates 1996 to 2019)
The overall trends point toward a growing population across all demographic, particularly as those in
the 15 to 40 year age group are finding they do not have to leave the district for employment.
However, there is a need to encourage active transport services, not just for older residents but also to
provide safe active transport infrastructure for the growing population of under 15 year olds to access
education and town amenities.
Problem Statement 3: Infrastructure is not meeting the changing needs of
the community for active modes of transport which is disconnecting people
from services and amenities
6.4 Road Safety
The Ministry of Transport’s Road to Zero: A New Road Safety Strategy for NZ 2020-2030 vision for road
safety in New Zealand is “a New Zealand where no one is killed or seriously injured in road crashes”,
with the ONRC Safety customer outcome aim being “the road and roadside are becoming safer for road
users’.
Road crash deaths and serious injuries in the Opotiki District are a significant issue making up 17 % of
crashes for the district, minor injury crashes account for 29% of crashes. This resulted in a combined
death and injury social cost of $62.62 million to the district for 2010 to 2019.
26You can also read