Crystal River/Kings Bay Basin Management Action Plan
←
→
Page content transcription
If your browser does not render page correctly, please read the page content below
Crystal River/Kings Bay
Basin Management Action Plan

Division of Environmental Assessment and Restoration
          Water Quality Restoration Program
  Florida Department of Environmental Protection

             with participation from the
       Crystal River/Kings Bay Stakeholders

                     June 2018

                             2600 Blair Stone Rd.
                            Tallahassee, FL 32399
                                   floridadep.gov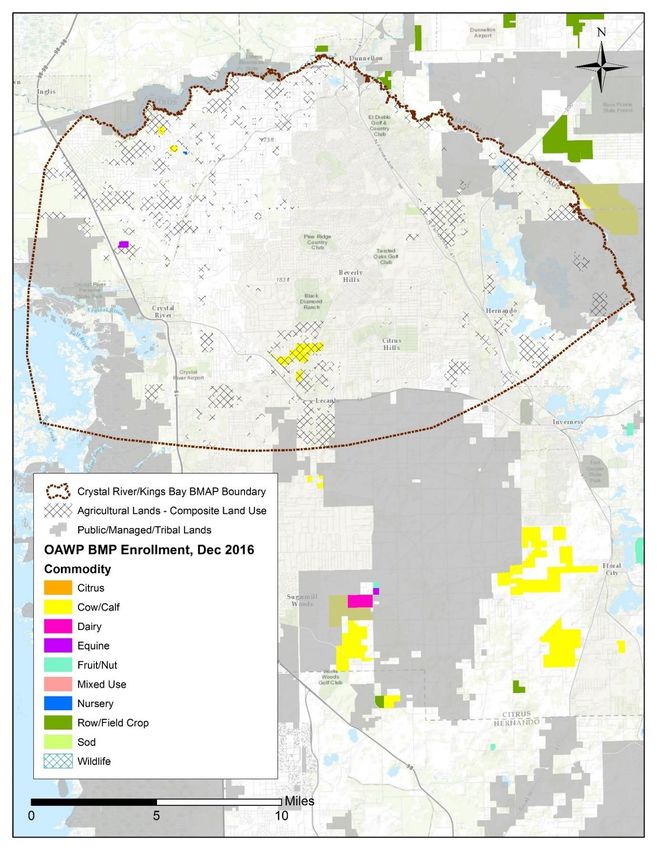
Crystal River/Kings Bay Basin Management Action Plan, June 2018

                                      Acknowledgments
The Florida Department of Environmental Protection adopted the Crystal River/Kings Bay Basin
Management Action Plan by Secretarial Order as part of its statewide watershed management
approach to restore and protect Florida's water quality. The plan was developed in coordination
with stakeholders, identified below, with participation from affected local, regional, and state
governmental interests; elected officials and citizens; and private interests.

Florida Department of Environmental Protection
Noah Valenstein, Secretary

                       Table A-1. Crystal River/Kings Bay stakeholders
             Type of Entity                                                Name
                                                                      Citrus County
                                                                  City of Crystal River
        Responsible Stakeholders
                                                                 Agricultural producers
                                                                       Golf courses
                                              Florida Department of Agriculture and Consumer Services
                                                    Florida Department of Environmental Protection
          Responsible Agencies
                                                              Florida Department of Health
                                                     Southwest Florida Water Management District
                                                                         Citizens
                                                                       Duke Energy
                                                            Florida Farm Bureau Federation
                                                         Florida Onsite Wastewater Association
                                                           Gulf Archeology Research Institute
                                                                  Homeowners/Citizens
                                                                    Kings Bay Rotary
      Other Interested Stakeholders
                                                               Kings Bay Springs Alliance
                                                                   Save Crystal River
                                                                 Save the Manatee Club
                                                          St. Martins Marsh Aquatic Preserve
                                           University of Florida Institute of Food and Agricultural Sciences –
                                                            Citrus County Extension Service
                                                             U.S. Fish and Wildlife Service

See Appendix A for links to important sources referenced in this document. For additional
information on total maximum daily loads and nutrient management strategies in the Crystal
River/Kings Bay Basin, contact:

Terry Hansen, P.G., Basin Coordinator
Florida Department of Environmental Protection
Water Quality Restoration Program, Watershed Planning and Coordination Section
2600 Blair Stone Road, Mail Station 3565
Tallahassee, FL 32399-2400
Email: terry.hansen@dep.state.fl.us
Phone: (850) 245–8561

                                              Page 2 of 86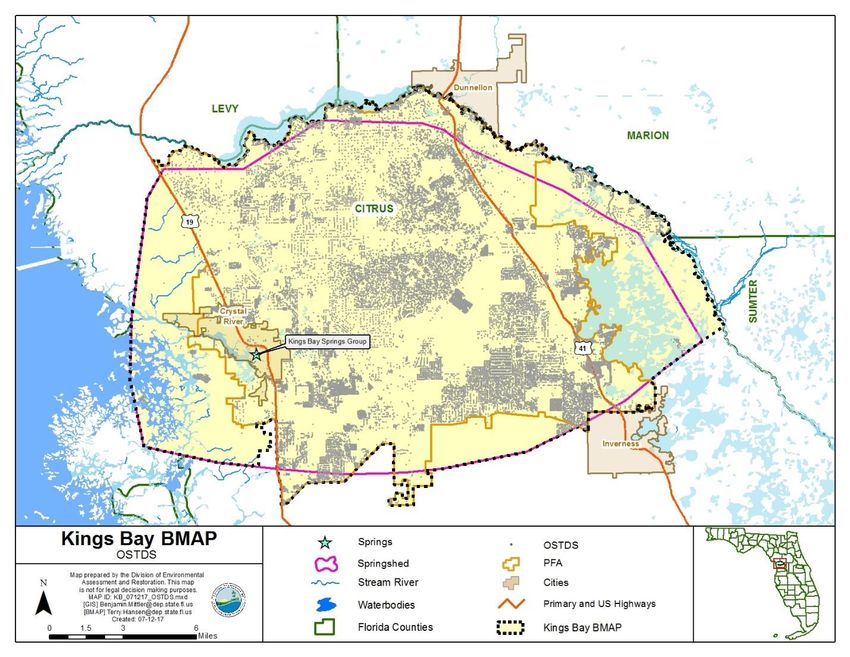
Crystal River/Kings Bay Basin Management Action Plan, June 2018

                                                      Table of Contents
Acknowledgments ..........................................................................................................................2
Table of Contents ...........................................................................................................................3
List of Figures .................................................................................................................................5
List of Tables ..................................................................................................................................6
List of Acronyms and Abbreviations ...........................................................................................7
Executive Summary .....................................................................................................................10
Section 1 : Background................................................................................................................14
      1.1 Legislation .................................................................................................................14
      1.2 Water Quality Standards and Total Maximum Daily Loads (TMDLs)..............14
      1.3 BMAP Requirements ...............................................................................................15
      1.4 BMAP Area ...............................................................................................................15
      1.5 Priority Focus Area (PFA).......................................................................................15
      1.6 Other Scientific and Historical Information ..........................................................18
      1.7 Stakeholder Involvement .........................................................................................18
      1.8 Description of BMPs Adopted by Rule...................................................................19
Section 2 : Implementation to Achieve TMDLs ........................................................................20
      2.1 Allocation of Pollutant Loads ..................................................................................20
      2.2 Prioritization of Management Strategies ...............................................................25
      2.3 Load Reduction Strategy .........................................................................................26
      2.4 OSTDS Management Strategies..............................................................................27
      2.5 UTF Management Strategies ...................................................................................29
      2.6 STF Management Strategies ...................................................................................30
      2.7 Agricultural Sources Management Strategies and Additional Reduction
            Options ......................................................................................................................31
      2.8 WWTF Management Strategies..............................................................................34
      2.9 Atmospheric Deposition Management Strategies .................................................36
      2.10 Future Growth Management Strategies.................................................................36
      2.11 Protection of Surface Water and Groundwater Resources through Land
            Conservation .............................................................................................................37
      2.12 Commitment to Implementation .............................................................................37
Section 3 : Monitoring and Reporting .......................................................................................38
      3.1 Methods for Evaluating Progress ...........................................................................38
      3.2 Adaptive Management Measures............................................................................38
      3.3 Water Quality and Biological Monitoring .............................................................39

                                                                 Page 3 of 86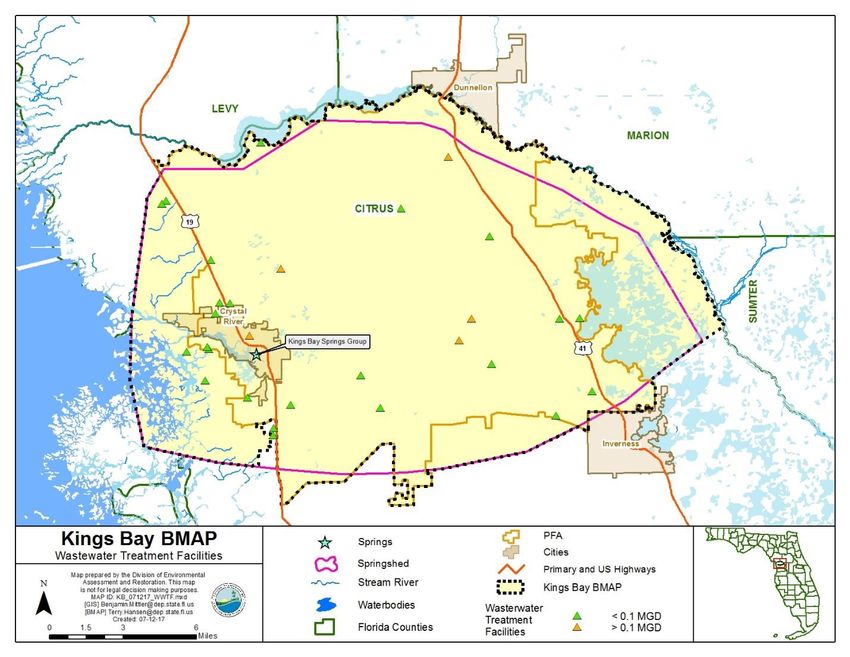
Crystal River/Kings Bay Basin Management Action Plan, June 2018

Appendices ....................................................................................................................................44
        Appendix A. Important Links ...........................................................................................44
        Appendix B. Projects to Reduce Nitrogen Sources ..........................................................46
        Appendix C. Crystal River/Kings Bay PFA Report ........................................................57
        Appendix D. OSTDS Remediation Plan ...........................................................................58
        Appendix E. Technical Support Information...................................................................67
        Appendix F. Educational Activities to Implement the UTF Management Strategies ..72
        Appendix G. FDACS Information on BMPs ....................................................................76
        Appendix H. Future Growth Strategies of Local Jurisdictions ......................................85

                                                                Page 4 of 86
Crystal River/Kings Bay Basin Management Action Plan, June 2018
List of Figures
Figure ES-1. Crystal River/Kings Bay BMAP area and PFA boundaries .....................................10
Figure 1. Crystal River/Kings Bay BMAP area and PFA boundaries ...........................................16
Figure 2. Loading to groundwater by source in the Crystal River/Kings Bay BMAP area ..........24
Figure 3. OSTDS locations in the Crystal River/Kings Bay BMAP area and PFA ......................28
Figure 4. Locations of domestic WWTFs in the Crystal River/Kings Bay BMAP area ...............34
Figure 5. Groundwater and surface water stations sampled in the Crystal River/Kings Bay
BMAP area......................................................................................................................41
Figure D-1. OSTDS locations in Crystal River/Kings Bay BMAP area and PFA ........................63
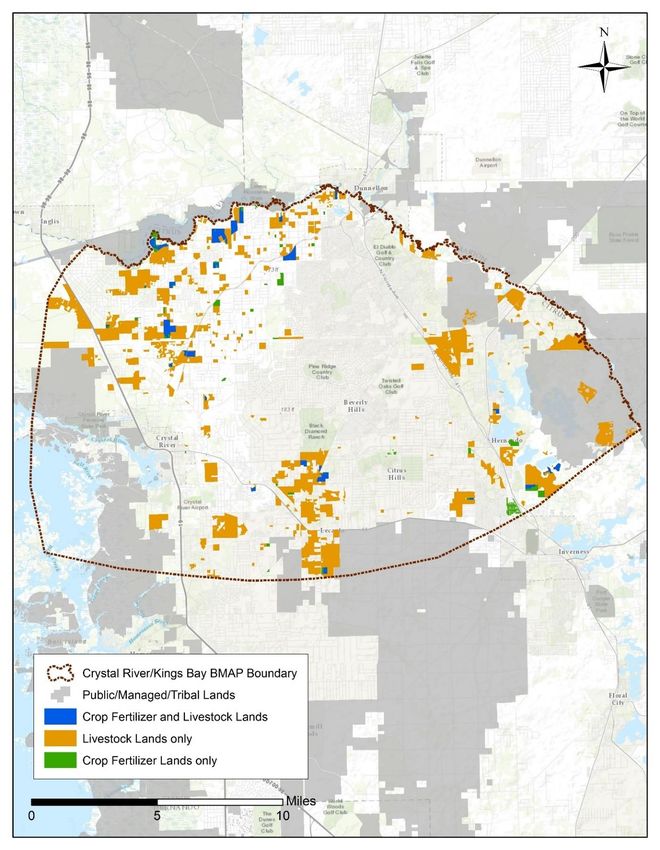
Figure G-1. Composite of agricultural lands in the Crystal River/Kings Bay BMAP area ...........78
Figure G-2. BMP enrollment in the Crystal River/Kings Bay BMAP area as of December 31,
2016 .........................................................................................................................81
Page 5 of 86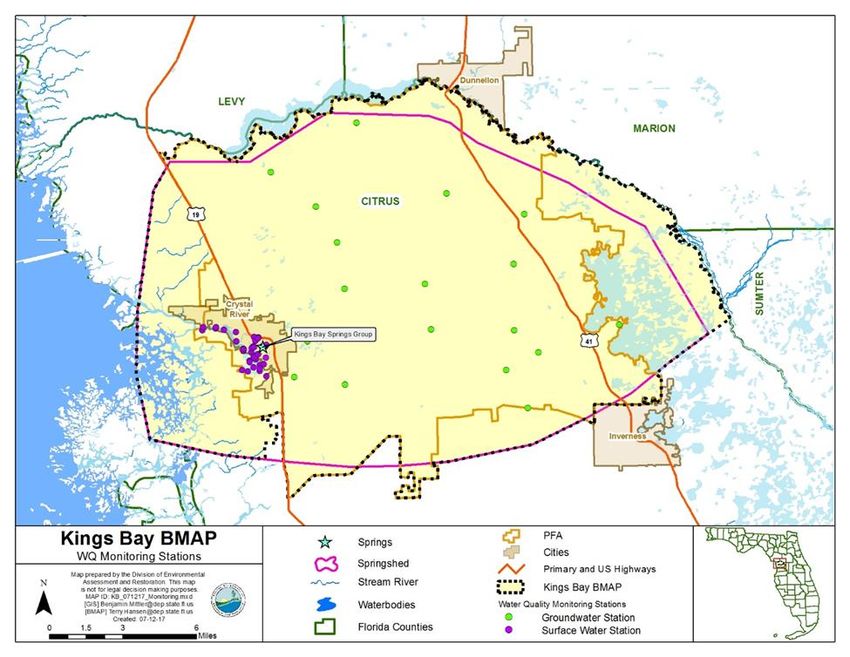
Crystal River/Kings Bay Basin Management Action Plan, June 2018

                                                       List of Tables
Table A-1. Crystal River/Kings Bay stakeholders ...........................................................................2
Table ES-1. WWTF effluent standards ..........................................................................................13
Table 1. Restoration targets for the Kings Bay Spring group ........................................................15
Table 2. BMPs and BMP manuals adopted by rule as of June 2017 .............................................19
Table 3. Estimated nitrogen load to groundwater by source in the BMAP area ...........................21
Table 4. Total reduction required to meet the TMDLs ..................................................................25
Table 5. Nitrogen reduction schedule (lb-N/yr) .............................................................................25
Table 6. Summary of potential credits for the Crystal River/Kings Bay BMAP to meet the
              TMDLs ....................................................................................................................26
Table 7. Estimated individual OSTDS improvements to groundwater .........................................29
Table 8. Current project credits to reduce UTF loading to groundwater .......................................30
Table 9. Maximum UTF load reductions based on existing public education credit policies .......30
Table 10. Maximum load reductions from STF improvements based on existing credit policies 31
Table 11. Estimated acreages for additional agricultural projects and practices ...........................33
Table 12. Potential for additional load reductions to groundwater ................................................33
Table 13. Wastewater effluent standards for the BMAP area .......................................................35
Table 14. Stakeholder conservation land purchase ........................................................................37
Table 15. Core water quality indicators .........................................................................................40
Table 16. Supplemental water quality indicators and field parameters .........................................41
Table 17. Biological response measures for spring runs ...............................................................42
Table B-1. Stakeholder projects to reduce nitrogen sources ..........................................................47
Table D-1. Estimated reduction credits for OSTDS enhancement or sewer* ...............................62
Table D-2. Stakeholder educational activities to implement the OSTDS remediation plan .........66
Table E-1. Range of environmental attenuation of nitrogen from a detailed literature review .....70
Table F-1. Stakeholder education activities to implement UTF management strategies ..............73
Table G-1. Composite agricultural land use in the Crystal River/Kings Bay BMAP area ............77
Table G-2. Fertilized crop lands in the Crystal River/Kings Bay BMAP area ..............................77
Table G-3. Livestock lands in the Crystal River/Kings Bay BMAP area .....................................77
Table G-4. Agricultural acreage and BMP enrollment in the Crystal River/Kings Bay Springshed
              as of December 31, 2016 .........................................................................................82
Table G-5. Beyond BMP implementation .....................................................................................84
Table H-1. Future growth strategies of local jurisdictions ............................................................85

                                                             Page 6 of 86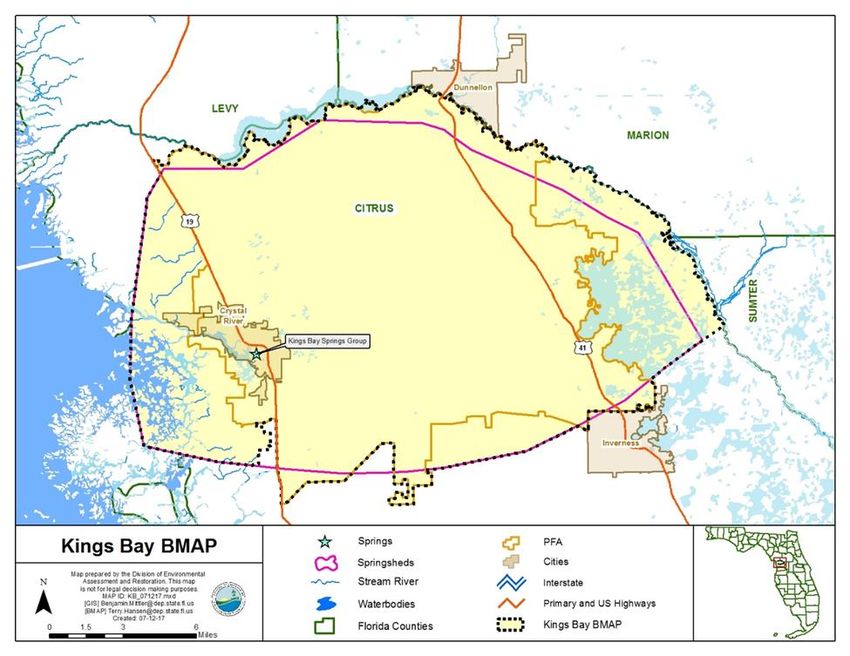
Crystal River/Kings Bay Basin Management Action Plan, June 2018

                 List of Acronyms and Abbreviations
ac        Acre
AWT       Advanced Wastewater Treatment
ATU       Aerobic Treatment Unit
BAF       Biochemical Attenuation Factor
BMAP      Basin Management Action Plan
BMP       Best Management Practice
CASTNET   Clean Air Status and Trends Network
cfs       Cubic Feet Per Second
CMAQ      Community Multiscale Air Quality
C.R.      County Road
CRF       Controlled-Release Fertilizer
DEP       Florida Department of Environmental Protection
DMR       Discharge Monthly Report
DO        Dissolved Oxygen
ERP       Environmental Resource Permit
F.A.C.    Florida Administrative Code
F.A.R.    Florida Administrative Register
FARMS     Facilitating Agricultural Resource Management Systems
FDACS     Florida Department of Agriculture and Consumer Services
FDOH      Florida Department of Health
FF        Farm Fertilizer
FGS       Florida Geological Survey
FLUCCS    Florida Land Use Cover and Forms Classification System
FOWA      Florida Onsite Wastewater Association
F.S.      Florida Statutes
FSAID     Florida Statewide Agriculture Irrigation Database
FY        Fiscal Year
FYN       Florida Yards and Neighborhoods
GIS       Geographic Information System
gpd       Gallons Per Day
HA        Habitat Assessment
IA        Implementation Assurance
IV        Implementation Verification
in/yr     Inch Per Year
lb        Pound
lb-N/yr   Pounds of Nitrogen Per Year
LF        Linear Feet
LID       Low-Impact Development
LVS       Linear Vegetation Survey
LW        Livestock Waste
MFL       Minimum Flow and Level

                                       Page 7 of 86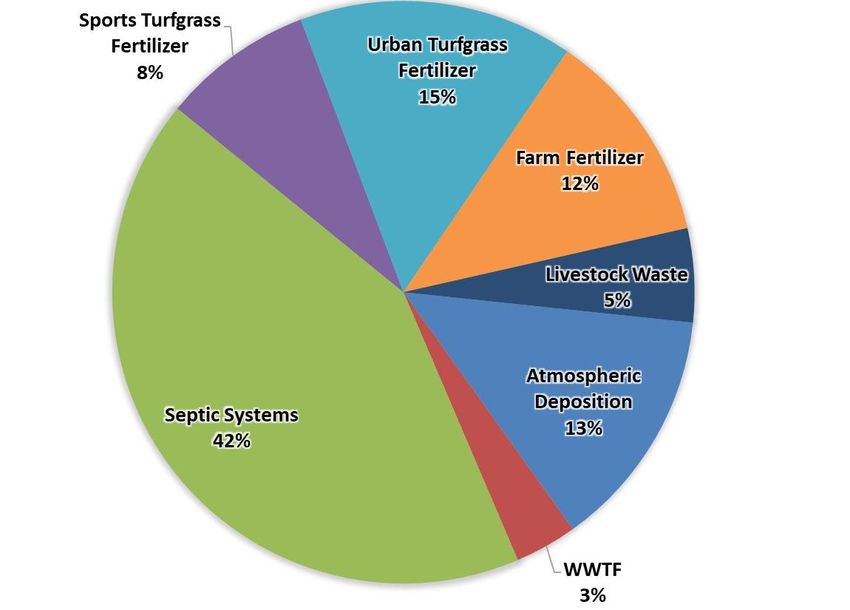
Crystal River/Kings Bay Basin Management Action Plan, June 2018

mgd       Million Gallons Per Day
mg/L      Milligrams Per Liter
MIL       Mobile Irrigation Lab
N         Nitrogen
NA        Not Applicable
NADP      National Atmospheric Deposition Program
NELAC     National Environmental Accreditation Conference
NELAP     National Environmental Accreditation Program
NNC       Numeric Nutrient Criteria
NOI       Notice of Intent
NPDES     National Pollutant Discharge and Elimination System
NSF       National Sanitation Foundation
NSILT     Nitrogen Source Inventory Loading Tool
NTN       National Trends Network
OAWP      Office of Agricultural Water Policy
OFS       Outstanding Florida Spring
OFW       Outstanding Florida Water
OSTDS     Onsite Sewage Treatment and Disposal System
PBTS      Performance-based Treatment System
PFA       Priority Focus Area
PSA       Public Service Announcement or Planned Service Area
QA/QC     Quality Assurance/Quality Control
RIB       Rapid Infiltration Basin
RPS       Rapid Periphyton Survey
SBIO      DEP Statewide Biological Database
SCI       Stream Condition Index
SOP       Standard Operating Procedure
STF       Sports Turf Fertilizer
STORET    Florida Storage and Retrieval Database
SWFWMD    Southwest Florida Water Management District
SWIM      Surface Water Improvement and Management
TDEP      Total Atmospheric Deposition Model
TMDL      Total Maximum Daily Load
TN        Total Nitrogen
TP        Total Phosphorus
TSS       Total Suspended Solids
UFA       Upper Floridan Aquifer
UF–IFAS   University of Florida- Institute of Food and Agricultural Sciences
USDA      U.S. Department of Agriculture
USGS      U.S. Geological Survey
UTF       Urban Turfgrass Fertilizer
WAFR      Wastewater Facility Regulation (Database)
WBID      Waterbody Identification (Number)

                                        Page 8 of 86
Crystal River/Kings Bay Basin Management Action Plan, June 2018

WIN    Florida Watershed Information Network Database
WMD    Water Management District
WWTF   Wastewater Treatment Facility
WWTP   Wastewater Treatment Plant
yr     Year

                                    Page 9 of 86
Crystal River/Kings Bay Basin Management Action Plan, June 2018
Executive Summary
Crystal River/Kings Bay Basin
The Florida Springs and Aquifer Protection Act (Chapter 373, Part VIII, Florida Statutes [F.S.]),
provides for the protection and restoration of Outstanding Florida Springs (OFS), which
comprise 24 first magnitude springs, 6 additional named springs, and their associated spring
runs. The Florida Department of Environmental Protection (DEP) has assessed water quality in
each OFS and has determined that 24 of the 30 OFS are impaired for the nitrate form of nitrogen.
The Kings Bay Spring Group is one of the impaired first magnitude OFS.
The Crystal River/Kings Bay Basin Management Action Plan (BMAP) area (Figure ES-1)
consists of 178,753 acres located in Citrus County, Florida, adjacent to the City of Crystal River.
The BMAP area contains the Crystal River/Kings Bay spring complex, which has more than 70
springs that account for 99 % of the fresh water entering the 600-acre Kings Bay.
Crystal River/Kings Bay Priority Focus Area (PFA)
The PFA (see Appendix C) includes the majority of the BMAP area, with the exception of the
water discharge area along the Gulf Coast and portions of the southern and eastern springshed
that have lower recharge characteristics as well as fewer nitrogen sources The PFA represents the
area in the basin where the aquifer is most vulnerable to inputs and where there are the most
connections between groundwater and the springs.
Figure ES-1. Crystal River/Kings Bay BMAP area and PFA boundaries
Page 10 of 86Crystal River/Kings Bay Basin Management Action Plan, June 2018
Nitrogen Source Identification, Required Reductions, and Options to Achieve
Reductions
DEP set nitrate and orthophosphate water quality restoration targets for 5 springs in the Kings
Bay Spring Group and total nitrogen (TN) and total phosphorus (TP) targets for Kings Bay. In
2014, DEP adopted total maximum daily loads (TMDLs) of 0.23 milligrams per liter (mg/L) of
nitrate and 0.028 mg/L of orthophosphate at the 5 spring vents, and TMDLs of 0.28 mg/L of TN
and 0.032 mg/L of TP for Kings Bay.
Onsite sewage treatment and disposal systems (OSTDS or septic systems; the terms are used
interchangeably throughout this document) represent 42 % of the estimated nitrogen loading to
groundwater, agriculture (including farm fertilizer [FF] and livestock waste [LW]) 17 %, and
urban turfgrass fertilizer (UTF) 15 % of the total loading to groundwater based on DEP's analysis
conducted using the Nitrogen Source Inventory Loading Tool (NSILT).
The total load reduction required to meet the TMDLs at the spring vents is 274,000 pounds of
nitrogen per year (lb-N/yr). To measure progress towards achieving the necessary load reduction,
DEP is establishing the following milestones:
Initial reduction of 82,200 lb-N/yr (30 %) within 5 years.
An additional 137,000 lb-N/yr (50 %) within 10 years.
The remaining 54,800 lb-N/yr (20 %) within 15 years.
For a total of 274,000 lb-N/yr within 20 years.
The policies and submitted projects included within this BMAP are estimated to achieve a
reduction of 197,268 to 291,484 lb-N/yr to groundwater. While reductions to groundwater will
benefit the springs, it is uncertain to know with precision how those reductions will impact the
necessary reductions at the springs. DEP will continue to monitor the springs to evaluate those
reductions as projects are implemented against the required load reductions above. The BMAP is
designed to achieve 80 % of the load reductions needed for the spring vents within 10 years of
adoption and 100 % within 15 years. Projects and strategies are designed to achieve nitrogen
reductions throughout the Kings Bay Spring Group. Projects are designed for nitrogen removal
but are expected to achieve phosphorus reductions as well. DEP will evaluate progress towards
these milestones and will report to the Governor and Florida Legislature. DEP will adjust
management strategies to ensure the target concentrations are achieved. This may include
expanding the area to which the OSTDS remediation policies apply; any such change, however,
would be incorporated into an updated BMAP through a formal adoption process.
For the list of projects to improve water quality, see Appendix B. Included are owner-
implemented best management practices (BMPs) for FF, LW, STF; WWTF upgrades; projects to
reduce UTF application; and OSTDS conversions to sewer. Successful BMAP implementation
Page 11 of 86Crystal River/Kings Bay Basin Management Action Plan, June 2018
requires commitment, dedicated state funding, and follow-up. Stakeholders have expressed their
intention to carry out the plan, monitor its effects, and continue to coordinate within and across
jurisdictions to achieve nutrient reduction goals. As the TMDLs must be achieved within 20
years, DEP, water management districts (WMDs), Florida Department of Health (FDOH), and
Florida Department of Agriculture and Consumer Services (FDACS) will implement
management strategies using the annual Legacy Florida appropriation from the legislature of at
least $50 million to reduce nitrogen in impaired OFS. DEP, working with the coordinating
agencies, will continue to invest existing funds and explore other opportunities and potential
funding sources for springs restoration efforts.
Restoration Approaches
Load reduction to the aquifer is needed to achieve the load reductions requirements at the spring
vents. To ensure that load reductions are achieved at the spring vents, the following restorations
actions are being established. These actions are designed to reduce the amount of nutrients to the
aquifer, which will reduce the load at the vents and ultimately achieve the necessary reductions.
Monitoring of the vents during implementation will be implemented to monitor progress.
New OSTDS – Upon BMAP adoption, the OSTDS remediation plan prohibits
new systems on lots of less than 1 acre within the PFAs, unless the system
includes enhanced treatment of nitrogen as defined by the OSTDS
remediation plan, or unless the OSTDS permit applicant demonstrates that
sewer connections will be available within 5 years. Local governments and
utilities are expected to develop master wastewater treatment feasibility
analyses within 5 years to identify specific areas to be sewered or to have
enhanced nitrogen reducing OSTDS within 20 years of BMAP adoption. The
OSTDS remediation plan is incorporated as Appendix D.
Existing OSTDS – Upon completion of the master wastewater treatment
feasibility analyses, FDOH rulemaking, and funding program for homeowners
included in the OSTDS remediation plan, but no later than five years after
BMAP adoption, modification or repair permits issued by FDOH for all
OSTDS within the PFA on all lot sizes will require enhanced treatment of
nitrogen, unless sewer connections will be available based on a BMAP-listed
project. All OSTDS subject to the policy must include enhanced treatment of
nitrogen no later than 20 years after BMAP adoption.
WWTFs − The effluent standards listed in Table ES-1 will apply to all new
and existing WWTFs in the BMAP area (inside and outside the PFA).
Page 12 of 86Crystal River/Kings Bay Basin Management Action Plan, June 2018
Table ES-1. WWTF effluent standards
gpd = Gallons per day
Nitrogen Concentration Nitrogen Concentration
Limits for Rapid Limits for All Other
95% of the Permitted Infiltration Basins (RIBs) Land Disposal Methods,
Capacity and Absorption Fields Including Reuse
(gpd) (mg/L) (mg/L)
Greater than 100,000 3 3
20,000 to 100,000 3 6
Less than 20,000 6 6
UTF – UTF sources can receive up to 6 % credit for DEP's approved suite of
public education and source control ordinances. Entities have the option to
collect and provide monitoring data to quantify reduction credits for additional
measures.
STF – STF sources include golf courses and other sporting facilities. Golf
courses can receive up to 10 % credit for implementing the Golf Course BMP
Manual. Other sports fields can receive up to 6 % credit for managing their
fertilizer applications to minimize transport to groundwater.
FF – All FF sources are required to implement BMPs or perform monitoring
to demonstrate compliance with the TMDL. A 15 % reduction to groundwater
is estimated for owner-implemented BMPs. Additional credits could be
achieved through better documentation of reductions achieved through BMP
implementation or implementation of additional agricultural projects or
practices, such as precision irrigation, soil moisture probes, controlled-release
fertilizer, and cover crops.
LW – All LW sources are required to implement BMPs or perform
monitoring. A 10 % reduction to groundwater is estimated for owner-
implemented BMPs. Additional credits could be achieved through better
documentation of reductions achieved through BMP implementation.
Page 13 of 86Crystal River/Kings Bay Basin Management Action Plan, June 2018
Section 1: Background
1.1 Legislation
Chapter 373, Part VIII, Florida Statutes (F.S.), created the Florida Springs and Aquifer
Protection Act to provide for the protection and restoration of Outstanding Florida Springs
(OFS), which comprise 24 first magnitude springs, 6 additional named springs, and their
associated spring runs. The Florida Department of Environmental Protection (DEP) has assessed
water quality in each OFS and has determined that 24 of the 30 OFS are impaired for the nitrate
form of nitrogen. The Kings Bay Spring Group is one of the impaired first magnitude OFS.
Development of the basin management action plan (BMAP) to meet the new requirements of the
Florida Springs and Aquifer Protection Act for the Crystal River/Kings Bay Basin was initiated
in 2016.
1.2 Water Quality Standards and Total Maximum Daily Loads (TMDLs)
A TMDL represents the maximum amount of a given pollutant that a waterbody can assimilate
and still meet water quality criteria. Kings Bay and the impaired springs in the Kings Bay Spring
Group addressed in this BMAP are Class III waterbodies with a designated use of recreation,
propagation, and the maintenance of a healthy, well-balanced population of fish and wildlife.
These waters are impaired by nutrients, which in excess has been demonstrated to adversely
affect flora or fauna through the excessive growth of algae. Excessive algal growth results in
ecological imbalances in the springs and can produce human health problems, foul beaches,
inhibit navigation, and reduce the aesthetic value of the resources.
DEP adopted nutrient TMDLs for the Kings Bay Spring Group in 2014, including Kings Bay,
Hunter Spring (also locally known as Hunters Spring), House Spring, Idiot's Delight Spring,
Tarpon Spring (also known as Tarpon Hole Spring), and Black Spring (see Table 1). The
TMDLs established an annual average nitrate target of 0.23 milligrams per liter (mg/L) and an
annual average orthophosphate target of 0.028 mg/L at the 5 spring vents, and TMDLs of 0.28
mg/L of total nitrogen (TN) and 0.032 mg/L of total phosphorus (TP) for Kings Bay. The period
of record for water quality data for the TMDLs was January 1, 2004 through June 30, 2011.
Page 14 of 86Crystal River/Kings Bay Basin Management Action Plan, June 2018
Table 1. Restoration targets for the Kings Bay Spring group
Waterbody
Identification
Waterbody or (WBID) TMDL
Spring Name Number Parameter (mg/L)
Kings Bay 1341 TN, annual average 0.28
Kings Bay 1341 TP, annual average 0.032
Hunter Spring 1341C Nitrate, annual average 0.23
Hunter Spring 1341C Orthophosphate, annual average 0.028
House Spring 1341D Nitrate, annual average 0.23
House Spring 1341D Orthophosphate, annual average 0.028
Idiot's Delight Spring 1341F Nitrate, annual average 0.23
Idiot's Delight Spring 1341F Orthophosphate, annual average 0.028
Tarpon Spring 1341G Nitrate, annual average 0.23
Tarpon Spring 1341G Orthophosphate, annual average 0.028
Black Spring 1341H Nitrate, annual average 0.23
Black Spring 1341H Orthophosphate, annual average 0.028
1.3 BMAP Requirements
Section 403.067(7), F.S., provides DEP with the statutory authority for the BMAP Program. A
BMAP is a comprehensive set of strategies to achieve the required pollutant load reductions. In
addition to this authority, the Florida Springs and Aquifer Protection Act (Part VIII of Chapter
373, F.S.) describes additional requirements for 30 OFS.
1.4 BMAP Area
The BMAP area (Figure 1) comprises 178,753 acres located in Citrus County, Florida, adjacent
to the City of Crystal River. The BMAP area contains the Crystal River/Kings Bay spring
complex, which has more than 70 springs that account for 99 % of the fresh water entering the
600-acre Kings Bay. The BMAP area includes the surface water basin as well as the groundwater
contributing areas for the springs (or springsheds). Springsheds for the OFS were delineated or
reviewed by Southwest Florida Water Management District (SWFWMD) with input from the
Florida Geological Survey (FGS). A springshed is the area of land that contributes water to a
spring or group of springs, mainly via groundwater flow.
1.5 Priority Focus Area (PFA)
In compliance with the Florida Springs and Aquifer Protection Act, this BMAP delineates a
PFA, defined as the area(s) of a basin where the Floridan aquifer is generally most vulnerable to
pollutant inputs and where there is a known connectivity between groundwater pathways and an
OFS. The PFA provides a guide for focusing restoration strategies where science suggests these
efforts will most benefit the springs. The link to the PFA document is included in Appendix C.
Page 15 of 86Crystal River/Kings Bay Basin Management Action Plan, June 2018
1.5.1 Description
Nitrogen sources are more likely to influence groundwater quality under certain conditions. For
example, where soils are sandy and well drained, less nitrogen is converted to gas and released
into the atmosphere or taken up by plants, compared with other soil types. Therefore, local soil
types play a role in how much nitrogen travels from the land surface to groundwater in a specific
springshed. Also, the underlying geologic material influences the vulnerability of the underlying
aquifers and the rate of lateral movement within the Floridan aquifer toward the springs. These
conditions, and others, were considered in the delineation of the PFA (see Appendix C).
Following BMAP adoption, DEP will ensure that the geographic information system (GIS) files
associated with the PFA boundary are available to the public on the DEP Map Direct webpage.
Figure 1. Crystal River/Kings Bay BMAP area and PFA boundaries
Page 16 of 86Crystal River/Kings Bay Basin Management Action Plan, June 2018
1.5.2 Additional Requirements
In accordance with Section 373.811, F.S., the following activities are prohibited in the PFA:
New domestic wastewater disposal facilities, including rapid infiltration
basins (RIBs), with permitted capacities of 100,000 gallons per day (gpd) or
more, except for those facilities that meet an advanced wastewater treatment
(AWT) standard of no more than 3 mg/L TN, on an annual permitted basis.
New onsite sewage treatment and disposal systems (OSTDS) on lots of less
than once acre inside the PFA, unless additional nitrogen treatment is
provided, as specified in the OSTDS remediation plan (see Appendix D for
details).
New facilities for the disposal of hazardous waste.
The land application of Class A or Class B domestic wastewater biosolids not
in accordance with a DEP-approved nutrient management plan establishing
the rate at which all biosolids, soil amendments, and sources of nutrients at the
land application site can be applied to the land for crop production, while
minimizing the amount of pollutants and nutrients discharged to groundwater
or waters of the state.
New agricultural operations that do not implement BMPs, measures necessary
to achieve pollution reduction levels established by DEP, or groundwater
monitoring plans approved by a water management district (WMD) or DEP.
1.5.2.1 Additional Requirements for Biosolids and Septage Application Sites
In the PFA, the aquifer contributing to the springs is highly vulnerable to contamination by
nitrogen sources and soils have a high to moderate tendency to leach applied nitrogen. DEP
previously documented elevated nitrate concentrations in groundwater beneath septage
application zones in spring areas. To assure that nitrogen losses to groundwater are minimized
from permitted application of biosolids and septage in the PFA, the following requirements apply
to newly-permitted application sites and existing application sites upon permit renewal.
All permitted biosolids application sites that are agricultural operations must be enrolled in the
FDACS BMP Program or be within an agricultural operation enrolled in the FDACS BMP
Program for the applicable crop type. Implementation of applicable BMPs will be verified by
FDACS in accordance with Chapter 5M-1, Florida Administrative Code (F.A.C.). Permitted
biosolids application sites that are new agricultural operations must also comply with Subsection
373.811(5), F.S. Biosolids application sites must be certified as viable agricultural operations by
an acknowledged agricultural professional such as an agricultural consultant or agricultural
extension agent. Effective nutrient management practices must be ongoing at the application
zones in the permit. Plant uptake and harvesting are vital components of the nutrient
Page 17 of 86Crystal River/Kings Bay Basin Management Action Plan, June 2018
management plan to remove nitrogen and prevent it from leaching to groundwater. If DEP
determines that the site is not a viable agricultural site implementing a nutrient management
plan, corrective action will be required.
Groundwater monitoring for nitrate is required for all biosolids and septage land application sites
in the PFA to assure compliance with nutrient management objectives in this BMAP. However,
groundwater monitoring is not required if the site nutrient management plan limits biosolids
application rates of TN with no adjustment for available nitrogen normally allowed by
subsections 62-640.500(5) and (6), F.A.C. (e.g. for a recommended fertilizer rate of 160 pounds
of nitrogen per acre, only 160 pounds of TN per acre shall be applied). For septage application,
groundwater monitoring is not required if the site nutrient management plan limits application
rates to 30,000 gallons per acre for sites accepting mixtures of septage and grease (food
establishment sludge) or to 40,000 gallons per acre for sites accepting septage without grease.
The permit renewal application will include a trend analysis for nitrate in groundwater
monitoring wells during the previous permit cycle, and an evaluation of the potential for the
facility to cause or contribute to exceedance of the TMDL.
1.6 Other Scientific and Historical Information
In preparing this BMAP, DEP collected and evaluated credible scientific information on the
effect of nutrients, particularly forms of nitrogen, on springs and springs systems. Some of the
information collected is specific to the Crystal River/Kings Bay Basin, while other references
provide information on spring restoration topics, such as nitrogen-reducing technologies, the
treatment performance of OSTDS, and runoff following fertilizer applications.
1.7 Stakeholder Involvement
Stakeholder involvement is critical to develop, gain support for, and secure commitments in a
BMAP. The BMAP process engages stakeholders and promotes coordination and collaboration
to address the pollutant load reductions necessary to achieve the TMDLs. DEP invites
stakeholders to participate in the BMAP development process and encourages public
participation and consensus to the greatest practicable extent. Table A-1 identifies the
stakeholders participating in the development of this BMAP.
During the development of the Crystal River/Kings Bay BMAP, DEP held a series of meetings
involving stakeholders and the general public. The purpose of these meetings was to consult with
stakeholders to gather information, evaluate the best available science, develop an OSTDS
remediation plan (including a public education plan), define management strategies and
milestones, and establish monitoring requirements. All of the meetings were open to the public
and noticed in the Florida Administrative Register (F.A.R.). Additionally, a public meeting on
the BMAP was held on September 25, 2017 and was noticed in the F.A.R. and in local
newspapers.
Upon BMAP adoption, DEP intends to facilitate annual meetings with stakeholders to review
progress towards achieving the TMDLs.
Page 18 of 86Crystal River/Kings Bay Basin Management Action Plan, June 2018
1.8 Description of BMPs Adopted by Rule
Table 2 identifies the adopted BMPs and BMP manuals relevant to this BMAP.
Table 2. BMPs and BMP manuals adopted by rule as of June 2017
F.A.C.
Agency Chapter Chapter Title
FDACS Office of Agricultural Water
5M-6 Florida Container Nursery BMP Guide
Policy (OAWP)
FDACS OAWP 5M-8 BMPs for Florida Vegetable and Agronomic Crops
FDACS OAWP 5M-9 BMPs for Florida Sod
FDACS OAWP 5M-11 BMPs for Florida Cow/Calf Operations
Conservation Plans for Specified Agricultural
FDACS OAWP 5M-12
Operations
BMPs for Florida Specialty Fruit and Nut Crop
FDACS OAWP 5M-13
Operations
FDACS OAWP 5M-14 BMPs for Florida Equine Operations
FDACS OAWP 5M-16 BMPs for Florida Citrus
FDACS OAWP 5M-17 BMPs for Florida Dairies
FDACS OAWP 5M-18 Florida Agriculture Wildlife BMPs
FDACS OAWP 5M-19 BMPs for Florida Poultry
FDACS Division of Agricultural
5E-1 Fertilizer
Environmental Services
FDACS Division of Aquaculture 5L-3 Aquaculture BMPs
FDACS Florida Forest Service 5I-6 BMPs for Silviculture
Florida Forestry Wildlife BMPs for State Imperiled
FDACS Florida Forest Service 5I-8
Species
Facilitating Agricultural Resource Management
SWFWMD 40D-26
Systems (FARMS) Program
DEP 62-330 Environmental Resource Permitting
Page 19 of 86Crystal River/Kings Bay Basin Management Action Plan, June 2018
Section 2: Implementation to Achieve TMDLs
2.1 Allocation of Pollutant Loads
DEP collected and evaluated credible scientific information on the effect of nutrients,
particularly forms of nitrogen, on the Kings Bay Spring Group, described below.
2.1.1 Nutrients in the Springs and Spring Systems
DEP developed the Nitrogen Source Inventory Loading Tool (NSILT) to provide information on
the major sources of nitrogen in the groundwater contributing area and spring contributing area
for the OFS. In addition, this tool is used to estimate nitrogen loads to groundwater from these
sources in the spring contributing area. The NSILT is a GIS and spreadsheet-based tool that
provides spatial estimates of the relative contribution of nitrogen from major nitrogen sources
and accounts for the transport pathways and processes affecting the various forms of nitrogen as
they move from the land surface through the soil and geologic strata.
The first major factor to consider in estimating the loading to groundwater in the NSILT is the
attenuation of nitrogen as it moves from its source through the environment, before it reaches the
Upper Floridan aquifer (UFA). The movement of nitrogen from the land surface to groundwater
is controlled by biological and chemical processes that occur as part of the nitrogen cycle, as
well as hydrogeological processes. Many of these processes attenuate (impede or remove) the
amount of nitrogen transported to groundwater. An understanding of how water moves through
the subsurface and the processes that transform the different forms of nitrogen is essential for
estimating nitrogen loading to groundwater from various sources.
A second major factor to consider in estimating the loading to groundwater are the geological
features in the springshed and the related "recharge rate". Water movement between the shallow
groundwater (surficial aquifer, where present) and the deeper aquifer (UFA) is slowed by a low-
permeability layer of clay, silt, and fine sand that retards the vertical movement of infiltrating
water from the surface. The UFA occurs in limestone that can be prone to dissolving and, over
geologic time, the development of numerous karst features (sinkholes, caves, and conduits).
These features allow water from the land surface to move directly and relatively rapidly into the
aquifer and in some areas for groundwater in the aquifer to move rapidly to the springs.
Potential recharge rates from the surface to the UFA are affected by variations in the geologic
materials and the presence of karst features. DEP estimated the recharge rate ranges and grouped
them into three rate categories, which were applied to the NSILT:
Low recharge (Less than 5 inches per year [in/yr]).
Medium recharge (5 to 15 in/yr).
High recharge (15 in/yr or greater).
Page 20 of 86Crystal River/Kings Bay Basin Management Action Plan, June 2018
In the NSILT, DEP applied different attenuation factors to different types of sources, so that
various biological, chemical, and hydrogeological effects could be estimated. The attenuation
that was applied means that the amount of nitrogen leaving a source (such as a livestock
operation or a newly fertilized yard) reduces the amount of nitrogen predicted to reach the
aquifer. In the NSILT estimates, the attenuation rates range from 90 % (for atmospheric
deposition) to 25 % (for wastewater disposal in a RIB). Using these examples, only 10 % of
nitrogen from atmospheric deposition is expected to reach the aquifer, while 75 % of nitrogen
from a RIB is expected to reach groundwater, because the remainder is attenuated by various
chemical and biological processes.
Phosphorus is naturally abundant in the geological material underlying much of Florida and is
often present in high concentrations in surface water and groundwater. Measured orthophosphate
concentrations in the Kings Bay Spring Group do not show an increasing trend over time.
However, TP increases have been measured in the bay, suggesting that there are local sources
such as stormwater runoff. Monitoring and evaluation of TP and orthophosphate and influences
on the springs continue as the TMDLs are implemented.
2.1.2 Estimated Nitrogen Loads
Table 3 lists the nitrogen loads to groundwater by source. Note that urban stormwater loads are
included in urban turfgrass fertilizer (UTF) estimates, while agricultural stormwater loads are
included in farm fertilizer (FF) and livestock waste (LW) loading estimates. Nitrogen loading to
surface water will be reduced through the activities and strategies for the sources identified in
this chapter for groundwater loading.
Table 3. Estimated nitrogen load to groundwater by source in the BMAP area
lb-N/yr = pounds of nitrogen per year
Total Nitrogen Load to
Groundwater
Nitrogen Source (lb-N/yr) % Contribution
OSTDS 250,174 42
UTF 90,148 15
Atmospheric Deposition 79,541 13
FF 70,694 12
Sports Turfgrass Fertilizer (STF) 49,727 8
LW 30,793 5
Wastewater Treatment Facility (WWTF) 21,364 3
Total 591,530 100
Page 21 of 86Crystal River/Kings Bay Basin Management Action Plan, June 2018
2.1.3 Assumptions and Considerations
The NSILT calculations are based on the following assumptions and considerations:
NSILT Nitrogen Inputs – The methods used to calculate nitrogen inputs for each
pollutant source were based on a detailed synthesis of information, including direct
water quality measurements, census data, surveys, WWTF permits, published
scientific studies and reports, and information obtained in meetings with agricultural
producers. For some pollutant source categories, nitrogen inputs were obtained using
assumptions and extrapolations, and as a result, these inputs could be subject to
further refinement if more detailed information becomes available.
OSTDS Load Contribution – A per capita contribution to an OSTDS of
9.012 lb-N/year was used to calculate loading from OSTDS. The average
household contribution was estimated based on 2010 U.S. Census Bureau data
on the average number of people per household (2.23 in Citrus County) and
additional information on the amount of time spent away from home by the
school-age population and labor force (adjusted to 1.95 effective persons per
household).
Nitrogen Attenuation Factors – Biological and chemical processes that
occur as part of the nitrogen cycle, as well as hydrogeological processes,
control the movement of nitrogen from the land surface to groundwater. To
estimate the amount of nitrogen loading to the aquifer, DEP applied two
nitrogen attenuation factors: (1) biochemical attenuation, to account for
biochemical processes that convert or transform the different forms of
nitrogen; and (2) hydrogeological attenuation, to account for spatial variations
that affect the rate of water infiltrating through geological media to recharge
the UFA. Given the relatively large range of literature-reported values of
nitrogen attenuation for each source category, DEP used an average
attenuation factor for each source based on land use practices and
hydrogeological conditions in the contributing areas.
Other assumptions and considerations for BMAP implementation include the following:
Unquantified Project Benefits – Nitrogen reductions for some of the projects and
activities listed in this BMAP cannot currently be quantified. However, because of
their positive impact, it is assumed that these actions will help reduce pollutant loads,
and estimated loading reductions may be determined at a later date and assigned to
these activities.
Atmospheric Deposition – Atmospheric sources of nitrogen are local, national, and
international. Atmospheric sources are generally of low nitrogen concentration
compared with other sources and are further diminished through additional biological
Page 22 of 86Crystal River/Kings Bay Basin Management Action Plan, June 2018
and chemical processes before they reach groundwater. Atmospheric deposition
sources and trends will be reevaluated periodically.
OSTDS Inventory and Loading Calculations – The total number of OSTDS in the
basin is estimated based on local information and FDOH data. Future BMAPs and the
associated OSTDS loading calculations may be adjusted based on improved data on
the number, location, and type (conventional and enhanced nitrogen reducing) of
existing septic systems and may include additional OSTDS installed since BMAP
adoption.
PFA – The PFA provides a guide for focusing strategies where science suggests
efforts will best benefit the springs. The PFA boundary may be adjusted in the future
if additional relevant information becomes available.
Project Collection Period – The BMAP project collection period is limited to
projects after a certain date, based on the data used to calculate the reductions needed.
Reductions from older projects are already accounted for in the baseline loading.
Projects completed in the springshed after July 1, 2011, were considered for inclusion
in this BMAP.
Legacy Sources – Land uses or management practices not currently ongoing
in the basin may still be affecting the nitrate concentration of the springs. The
movement of water from the land surface through the soil column to the UFA
and through the UFA to the spring system varies both spatially and temporally
and is influenced by local soil and aquifer conditions. As a result, there may
be a lag between when nitrogen input to the UFA occurs and ultimately when
that load arrives at the Kings Bay Spring Group. The impact of this delay is
not fully known.
Implementation Schedule – BMAP implementation is intended to be a 20-year
process. This plan defines nitrogen reduction milestones for 5-year (30 %), 10-year
(50 %), and 15-year (20 %) implementation, so that the TMDLs will be met no later
than the 20-year goal (see Section 2.1.6 for further details). Further, the total
reductions and the project credits may be adjusted under the adaptive management
approach used for the BMAP. This approach requires regular follow-up to ensure that
management strategies are carried out and that their incremental effects are assessed.
The process acknowledges that there is some uncertainty associated with the
outcomes of proposed management strategies and the estimated response in nitrogen
concentration at the springs. As more information is gathered and progress towards
each 5-year milestone is reviewed, additional management strategies to achieve the
TMDLs will be developed or existing strategies refined to better address the sources
of nitrogen loading.
Page 23 of 86Crystal River/Kings Bay Basin Management Action Plan, June 2018
Changes in Spring Flows – The role of this BMAP is specifically to promote
the implementation of projects that reduce the nitrogen load to groundwater
while the minimum flows and levels (MFLs) established for specific springs
address water flows and levels. To maximize efforts between the two
programs, spring protection projects should provide both water quality and
quantity benefits.
2.1.4 Loading by Source
Based on the NSILT results, the pie chart in Figure 2 depicts the estimated percentage of
nitrogen loading to groundwater by source in the springshed. Septic systems represent 42 % of
the total nitrogen loading to groundwater, agriculture (including FF and LW) 17 %, and UTF 15
%. Stormwater loading to groundwater is incorporated into the other source categories.
Figure 2. Loading to groundwater by source in the Crystal River/Kings Bay BMAP area
2.1.5 Loading Allocation
The nitrogen source reductions are based on the measured nitrate concentrations and flows at the
vents, along with the TMDL target nitrate concentration. Table 4 lists the total nitrate (as
nitrogen) loads at the spring vents compared with the TMDL loading based on a target nitrate
concentration of 0.23 mg/L. The difference between the spring vents loading and the TMDL
loading estimate is the required reduction to meet the TMDLs. The total load that is required to
be reduced in the basin is being allocated to the entire basin and actions defined by the BMAP to
reduce loading to the aquifer are needed to implement this allocated load.
Page 24 of 86Crystal River/Kings Bay Basin Management Action Plan, June 2018
Table 4. Total reduction required to meet the TMDLs
Nitrogen Loads
Description (lb-N/yr) Notes Regarding Data Used
Upper 95 % confidence interval – nitrate data and
Total Load at Spring Vents 487,000 flow data from 2010 to 2016 (470 cubic feet per
second [cfs] and 0.526 mg/L)
TMDL target is 0.23 mg/L and using the same flow
TMDL Load 213,000
data from 2010 to 2016
Required Reduction 274,000
2.1.6 Description of 5-, 10-, and 15-year Milestones/Reduction Schedule
The overall load reduction targets are 30 % of the total within 5 years, 80 % of the total within
10 years, and 100 % of the total within 15 years. DEP will evaluate progress towards these
milestones and will report to the Governor and Florida Legislature. DEP will adjust management
strategies that reduce loading to the aquifer to ensure the target concentrations are achieved. This
may include expanding the area to which the OSTDS remediation policies apply; any such
change, however, would be incorporated into an updated BMAP through a formal adoption
process.
Table 5 identifies the nitrogen reductions needed, by milestone. Progress will be tracked yearly,
and adjustments made as needed. At the five-year milestone, progress will be assessed, and load
reductions adjusted as necessary. Entities have flexibility in the types and locations of projects as
long as they achieve the overall required load reductions. The monitoring of existing
groundwater and springs sampling locations is essential. Section 2.3 describes detailed source
reduction strategies.
Table 5. Nitrogen reduction schedule (lb-N/yr)
Total Nitrogen
5-Year Milestone 10-Year Milestone 15-Year Milestone Reduction
(30 % of Total) (50 % of Total) (20 % of Total) (100 %)
82,200 137,000 54,800 274,000
2.2 Prioritization of Management Strategies
The management strategies listed in Appendix B, Appendix D, and Appendix F are ranked
with a priority of high, medium, or low. In 2016, the Florida Legislature amended the Watershed
Restoration Act (Section 403.067, F.S.), creating additional requirements for all new or revised
BMAPs. BMAPs must now include planning-level details for each listed project, along with their
priority ranking.
Project status was selected as the most appropriate indicator of a project’s priority ranking based
primarily on need for funding. Projects with a "completed" status were assigned a low priority.
Projects classified as "underway" were assigned a medium priority because some resources have
been allocated to these projects, but additional assistance may be needed for the project to be
Page 25 of 86Crystal River/Kings Bay Basin Management Action Plan, June 2018
completed. High priority was assigned to projects listed with the project status "planned" as well
as certain "completed" projects that are ongoing each year (any project with one of these project
types: "street sweeping," "catch basin inserts/inlet filter cleanout," "public education efforts,"
"fertilizer cessation," "fertilizer reduction," or "aquatic vegetation harvesting"), and select
projects that are elevated because substantial, subsequent project(s) are reliant on their
completion.
2.3 Load Reduction Strategy
A precise total load reduction to groundwater needed to meet the TMDL is unknown and
dependent on a number of complex factors. Ultimately there must be a reduction at the spring
vents of at least 274,000 lb-N/yr. Based on the totals of all the credits from BMAP actions and
policies, the range of total reductions to groundwater is between 197,268 and 291,484 lb-N/yr
(see Table 6). However, due to the proximity of these reductions to the spring and the
uncertainties of fate and transport in the karst geology, additional actions may be necessary to
ensure that the loading at the vent is achieved within the timeline of the BMAP.
To achieve reductions outside the scope of the policies listed, additional project options are
available to local entities but have not been planned. Other efforts could be pursued to further
reduce the nitrogen load to groundwater in the Crystal River/Kings Bay BMAP area.
Table 6. Summary of potential credits for the Crystal River/Kings Bay BMAP to meet the
TMDLs
Note: No reductions are estimated for atmospheric deposition sources.
Credits to Load to
Groundwater
Based on Project
Nitrogen Source Tables (lb-N/yr) Description
Credits are based on lots inside the PFA being remediated by
either enhancing an OSTDS or connecting to sewer. An estimated
218,447 lb-N/yr have been provided as OSTDS remediation
OSTDS 142,168 – 207,784 projects which may be on these lots or in the larger BMAP area.
Any projects outside the PFA would add additional reductions to
the estimates listed.
DEP-approved credits (6 %) for public education activities as well
UTF 5,438
as credits identified for stakeholder stormwater projects
6 % BMP credit for sports fields and 10 % BMP credit for golf
STF 4,886 courses on STF load to groundwater, assuming 100 % BMP
implementation on golf courses and sports fields
15 % BMP credit on FF load to groundwater, assuming 100 %
FF 10,604
owner-implemented and verified BMPs on all fertilized lands
10 % BMP credit on load to groundwater, assuming 100 %
LW 3,079
owner-implemented and verified BMPs at all livestock facilities
Achieved by BMAP WWTF policy (achieving 3 or 6 mg/L) and
WWTF 23,942
verified WWTF projects
Page 26 of 86Crystal River/Kings Bay Basin Management Action Plan, June 2018
Credits to Load to
Groundwater
Based on Project
Nitrogen Source Tables (lb-N/yr) Description
Total Credits from
BMAP Policies and 190,118 – 255,734
Submitted Projects
Advanced
Agricultural Includes 10 % to 50 % reduction from 100 % of fertilized acres
7,150 – 35,750
Practices and with a change in practice
Procedures
Load reduction to meet the TMDL at the spring vent is
Total Credits 197,268 – 291,484
274,000 lb-N/yr
2.4 OSTDS Management Strategies
Overall, there are currently nearly 28,000 OSTDS in the PFA, based on FDOH estimates. This
BMAP lists six specific projects (Appendix B) that reduce OSTDS loading by 218,447 lb-N/yr.
Figure 3 shows the locations of OSTDS in the BMAP area and PFA.
In addition to the six listed projects, DEP assessed the overall OSTDS loading compared with
other nitrogen sources in the PFA, as well as the relative loading in the wider BMAP area. Based
on these assessments, OSTDS contribute more than 20 % of the nonpoint source nitrogen
pollution to the OFS. Per the Crystal River/ Kings Bay NSILT, septic systems contribute 42 % of
the pollutant loading in the springshed area and 39 % of the pollutant loading in the PFA.
Cumulatively, nitrogen loading from OSTDS within this springshed result in the significant
degradation of groundwater that impacts the Crystal River/Kings Bay BMAP area. Therefore, the
comprehensive remediation of OSTDS, consistent with the requirements of this BMAP, is
necessary to prevent associated groundwater and surface water contamination so that the TMDL
can ultimately be achieved and so that increases in nitrogen loads from future growth are limited.
The OSTDS remediation plan is incorporated as Appendix D.
Page 27 of 86You can also read