Physical Assessment of the Brahmaputra River - Ecosystems for Life: A Bangladesh-India Initiative - IUCN Portal
←
→
Page content transcription
If your browser does not render page correctly, please read the page content below
Physical Assessment
of the Brahmaputra River
Ecosystems for Life: A Bangladesh-India Initiative

DIALOGUE FOR SUSTAINABLE MANAGEMENT OF TRANS-BOUNDARY WATER REGIMES IN SOUTH ASIA
Physical Assessment of the Brahmaputra River
Physical Assessment of the Brahmaputra River

                     Prof. Chandan Mahanta
                        Dr. Asif M. Zaman
                      Sardar M. Shah Newaz
                     S.M. Mahbubur Rahman
                     Tarun Kanti Mazumdar
                        Runti Choudhury
                        Pronob Jyoti Borah
                            Lalit Saikia

       Ecosystems for Life: A Bangladesh-India Initiative
     IUCN, International Union for Conservation of Nature
                       December 2014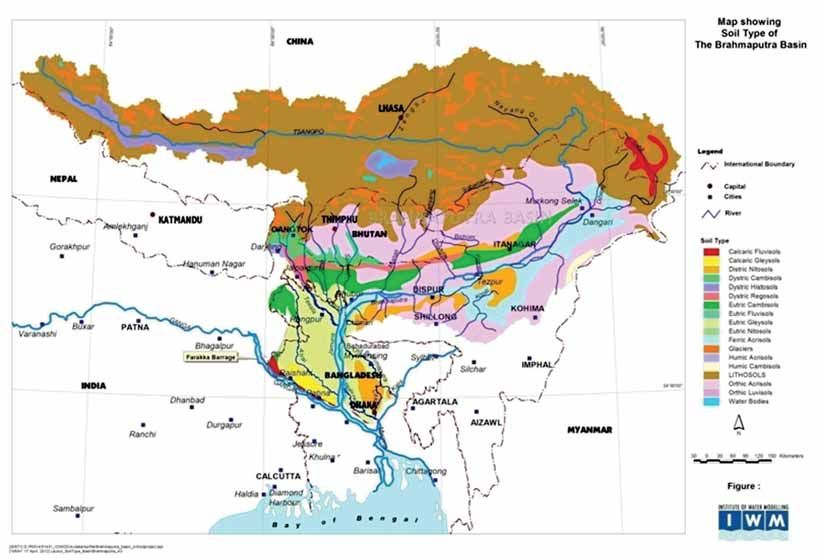
First published in 2014
by

JAGRITI PROKASHONY
33 Aziz Super Market
(ground floor), Shahbag, Dhaka-1000
e-mail : jagritibooks@gmail.com
web : www.jagritibooks.com
facebook : Jagriti Prokashony

in association with
IUCN

Disclaimer:
The findings/views/opinions expressed in this book are solely those of the authors and do not
necessarily reflect the views of the publisher or the organisations they represent.

© 2014
Copyright: IUCN, International Union for Conservation of Nature and Natural Resources

ALL RIGHTS RESERVED.
No part of this book shall be reproduced, stored in a retrieval system,
or transmitted by any means, electronic, mechanical, photocopying,
recording, or otherwise, without the prior written permission of the
copyright holder(s) and/or the publishers.

Physical Assessment of the Brahmaputra River

Mahanta, C., et al. 2014. Physical Assessment of the Brahmaputra River. IUCN, International Union
for Conservation of Nature, Dhaka, Bangladesh, Pp xii + 74

ISBN 978-984-91041-8-6

Cover: A mesmerizing view of the Brahmaputra. Photo by IUCN

Typeset by Jagriti Prokashony, Dhaka, Bangladesh.

Printed and bound by Jagriti Prokashony, Dhaka, Bangladesh.
www.jagritibooks.com
PHYSICAL ASSESSMENT OF THE BRAHMAPUTRA RIVER        5
                                                                                                                     Executive Summary    Chapter 10

Contents
Preface ........................................................................................................................... vii
List of Figures and Tables ................................................................................................. ix
Executive Summary ......................................................................................................... xi

1     Introduction ....................................................................................................... 1
      1.1 Background
      1.2 Study Objectives
      1.3 Scope of Study
      1.4 Study Approach and Methodology
      1.5 Report Structure

2     Basin Setting...................................................................................................... 5
      2.1 Overview
      2.2 Topography
      2.3 Climate
      2.4 Hydrology
      2.5 Land Cover
      2.6 Population
      2.7 Water Use and Requirements

3     Literature Review ............................................................................................ 25
      3.1 Conceptual Prediction of Global Climate Change
      3.2 Literature on Climate Change Impacts in the Brahmaputra Basin
      3.3 Development Projects

4     Data Collection and Analyses......................................................................... 33
      4.1 Climate
      4.2 Hydrology
      4.3 Water Demand

5     Climate Change Impact Analysis ................................................................... 39
      5.1 Global Climate Change Models
      5.2 Observations of IPCC
      5.3 Analysis Methodology
      5.4 Temperature
      5.5 Evapotranspiration
      5.6 Rainfall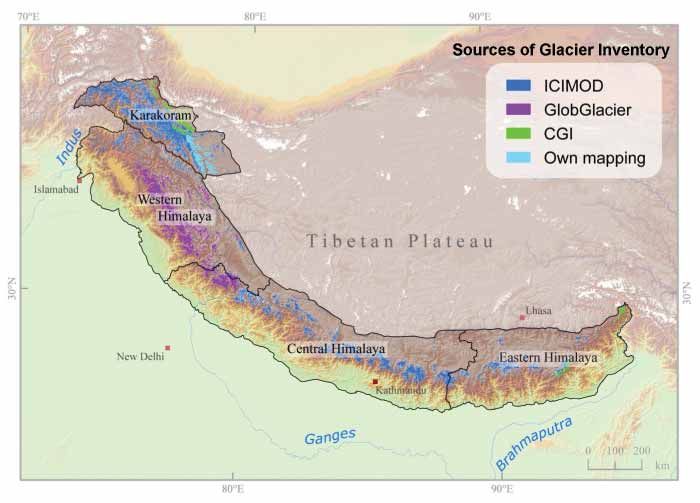
6    PHYSICAL ASSESSMENT OF THE BRAHMAPUTRA RIVER
Chapter 10   Executive Summary

                       6     Model Update and Development .................................................................... 47
                             6.1 Model Objective and Selection
                             6.2 Input Data
                                  6.2.1       Rainfall Data
                                  6.2.2       Evapotranspiration Data
                                  6.2.3       Temperature Data
                                  6.2.4       River discharge Data
                                  6.2.5       Land Terrain Data
                             6.3 Model Setup
                             6.4 Model Calibration and Validation
                             6.5 Model Scenarios

                       7     Results and Discussion ................................................................................... 55
                             7.1 Average Monthly Flows
                             7.2 Dependable Flows
                             7.3 Study Limitations

                       8     Stakeholder Consultations ............................................................................. 59
                             8.1 Initial Discussions and Project Formulation
                             8.2 Workshop on Approach and Methodologies
                             8.3 Dhaka Workshop
                             8.4 Project Team Meetings

                       9     Conclusions and Recommendations .............................................................. 63
                             9.1 Concluding Remarks
                             9.2 Recommendations
                                  9.2.1       Further Collaboration
                                  9.2.2       Sharing Data and Analyses
                                  9.2.3       Joint Modelling Studies

                       References ................................................................................................................ 67
                       Bios of Brahmaputra Modelling Authors..................................................................... 71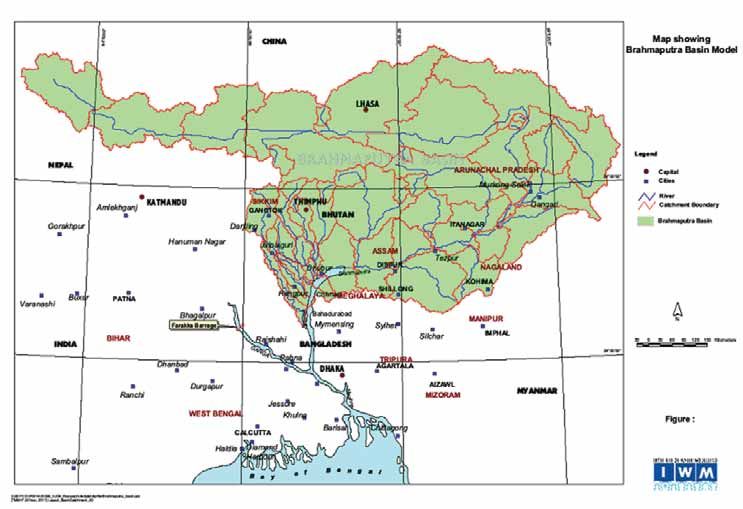
PHYSICAL ASSESSMENT OF THE BRAHMAPUTRA RIVER   vii
                                                                                                               Preface

Preface

Ecosystems for Life: a Bangladesh-India Initiative is   To date, Ecosystems for Life has focused
a civil society led multi-stakeholder dialogue          on five main themes: the links between
process to promote better understanding and             food security and water productivity for
improved management of natural resources in             poverty alleviation; the impacts of climate
Bangladesh and India.                                   change, adaptation methods and mitigation
                                                        strategies; convergence of inland navigation
Bangladesh and India share some of the
                                                        and integrated water resource management;
world’s most intricate and complex river
                                                        the links between economic development
systems. The Ganges, Brahmaputra and
                                                        and environmental security; and improving
Meghna Rivers, along with their tributaries,
                                                        understanding of ecosystems and habitats,
drain an area of about 1.75 million square
                                                        leading to the improved conservation of
kilometres and directly impact about
                                                        flagship species.
620 million people. These great rivers are
inseparable from the history and legends of             The first phase of the project concentrated
the region, and from the people who depend              on creating ‘situation analyses’ for each
upon them for their well-being. At the same             thematic area to identify core issues and their
time, the rivers face significant issues related        significance within the India-Bangladesh
to pollution, biodiversity loss, navigability           geographic focus, research gaps and,
and flooding, and these are exacerbated by              ultimately, priority areas for joint research.
the challenges inherent in managing trans-              The process included authors discussing and
boundary resources.                                     sharing their research, with the resulting
                                                        material further circulated among multiple
Ecosystems for Life was designed to help
                                                        stakeholders in both countries. This analysis
deal with these issues by encouraging
                                                        and consultation provided a clear agenda for
Track III multi-stakeholder dialogues
                                                        meaningful joint research to be conducted
among civil society actors. This has allowed
                                                        by Joint Research Teams (JRT) consisting of
representatives of civil society, academia,
                                                        Bangladeshi and Indian researchers.
the private sector and other organizations
from both countries to engage in extensive              The JRT process was an important
dialogue and information sharing and to                 contribution to building dialogue between the
produce a number of recommendations                     two countries, allowing researchers to present
which will ultimately be fed into advocacy              their respective points of view and build
and policy approaches.                                  consensus and shared understanding about
                                                        issues in the thematic areas. Researchers
Specifically, the project works to develop a
                                                        were carefully selected through an extensive
shared vision and understanding of food,
                                                        and transparent process, and their diverse
livelihood and water security issues through
                                                        backgrounds led to important sharing and
collaborative research, the creation of a
                                                        reflective learning. They worked with a
knowledge hub, developing research-based
                                                        common approach and mutually agreed
policy options, and enhancing the capacity of
                                                        methodology, communicating through the
civil society stakeholders to participate in the
                                                        internet and face to face in workshops
management of natural resources.
                                                        facilitated by the project.
Ecosystems for Life has been guided by a
                                                        This joint research study analyses available
Project Advisory Committee which includes
                                                        climatic and hydrological data to carry out
prominent professionals, legislators,
                                                        a physical assessment of the Brahmaputra
diplomats, researchers and academics from
                                                        River Basin. The Brahmaputra is one of the
Bangladesh and India who act as a bridge for
                                                        world’s largest trans-boundary river systems
the dialogue process between government
                                                        and provides a rich diversity of resources.
and civil society at the regional level.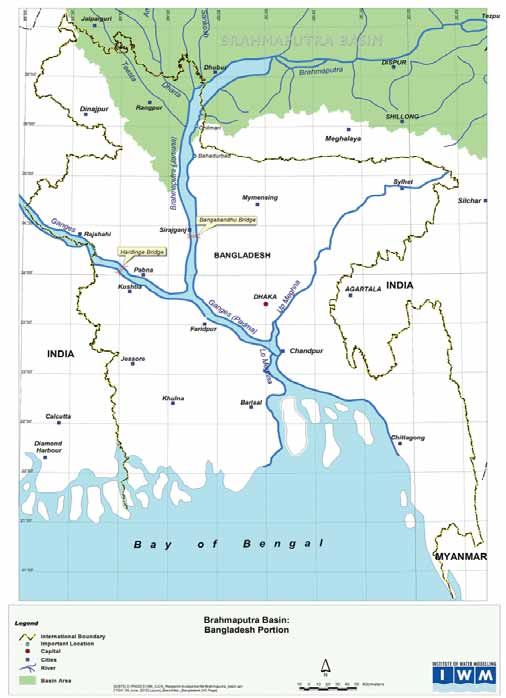
viii   PHYSICAL ASSESSMENT OF THE BRAHMAPUTRA RIVER
       Preface

                 Despite its size and importance in the region,      reduction in glacier contributions over the
                 it is one of the most under-investigated and        long term would decrease river flows.
                 underdeveloped basins.
                                                                     While these outputs are projections, they
                 The main objective of this assessment was to        provide likely indications of the direction
                 determine the water regime and the potential        and magnitude of change in flows of the
                 climate change impacts on water availability        Brahmaputra. Unlike previous assessments
                 in selected sites of the Basin. The analysis        which used only a single GCM, the fact that
                 also looks at possible climate change impacts       the study was based on 22 GCMs rather than
                 on temperature, evapotranspiration, rainfall        a single model provides policy makers with a
                 and river flows.                                    broad picture of potential impacts.

                 Key findings from the analysis of 22 General        Ecosystems for Life has successfully
                 Circulation Models (GCMs) suggest that              demonstrated fruitful research collaboration
                 climate change will lead to a gradual increase      between India and Bangladesh in the field of
                 in temperature and evapotranspiration rates         water resources. For international river basins
                 throughout the Basin. In terms of rainfall, it is   such as the Brahmaputra, joint research
                 projected that there will be a decrease during      projects like this one can lead to a better
                 the winter, but an increase in the monsoon          understanding of water resource systems and
                 season.                                             of the way they can change under climate
                                                                     change scenarios.
                 The outputs from this climate modelling
                 study were also used to simulate changes            This report also opens the ways ahead for
                 in river flows of the Brahmaputra under             further study of the Brahmaputra River
                 different emission scenarios. Preliminary           Basin, particularly in the areas of snowmelt
                 results suggest that there will be a net            research, additional joint modelling studies,
                 increase in river flows over the next 50 to         and including water demand projections
                 100 years. This concurs with the common             in the basin model. There is clear scope for
                 understanding of climate change impacts             future collaborative research in these areas,
                 on the Brahmaputra Basin. However, the              which can benefit the unique ecosystems and
                 continued increase in flows by 2100 goes            dependent livelihoods in the region.
                 against the common understanding that a
PHYSICAL ASSESSMENT OF THE BRAHMAPUTRA RIVER ix
List of Figures and Tables
Figures Figure 5.4: Rainfall Changes by 2050 and 2100
Due to Climate Change ........................................ 45
Figure 1.1: Overall Study Approach and Methodology .......... 4
Figure 6.1: Extent of the Brahmaputra River
Figure 2.1: The Brahmaputra River Basin area ...................... 7
Basin Model ........................................................... 51
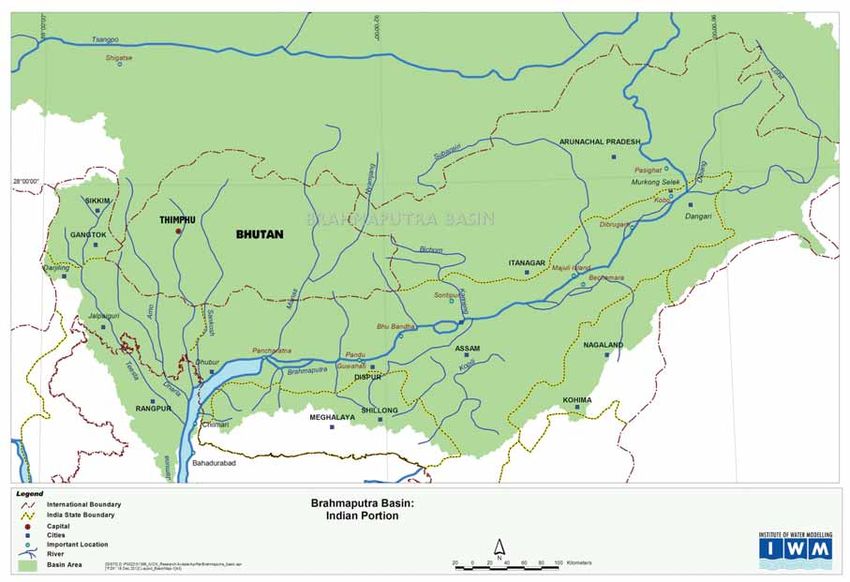
Figure 2.2: The Brahmaputra River Basin – Indian Part ........ 8
Figure 6.2: Comparison of Simulated and Measured
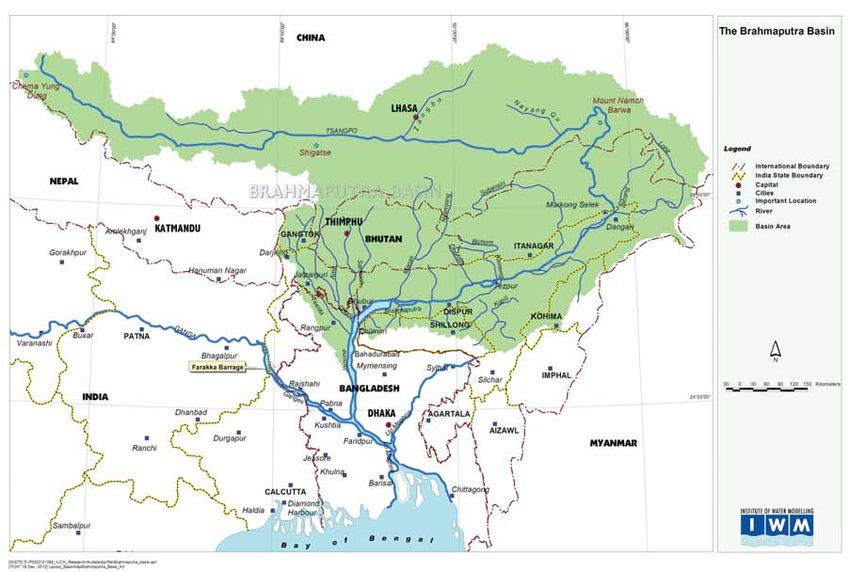
Figure 2.3: The Brahmaputra River Basin – Discharge at Bahadurabad .................................. 54
Bangladesh Part ...................................................... 9
Figure 7.1: Effect of Increased Temperature on Runoff
Figure 2.4: Long Profile of the Brahmaputra River ............... 10 Generating Area in Mountain Regions ............... 57
Figure 2.5: Schematic of the Brahmaputra River ................. 11 Figure 8.1: Photo of Participants at Stakeholder
Workshop in Nepal ............................................... 60
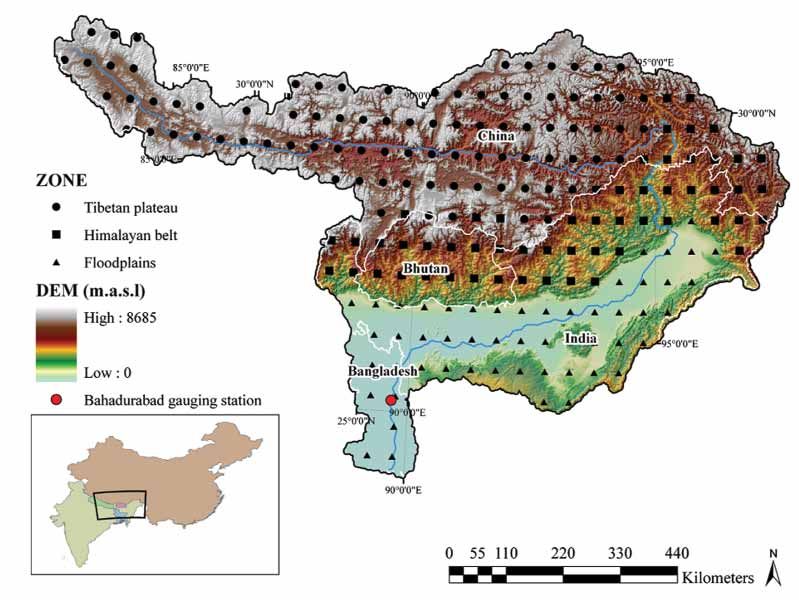
Figure 2.6: Physiographic Zones of the
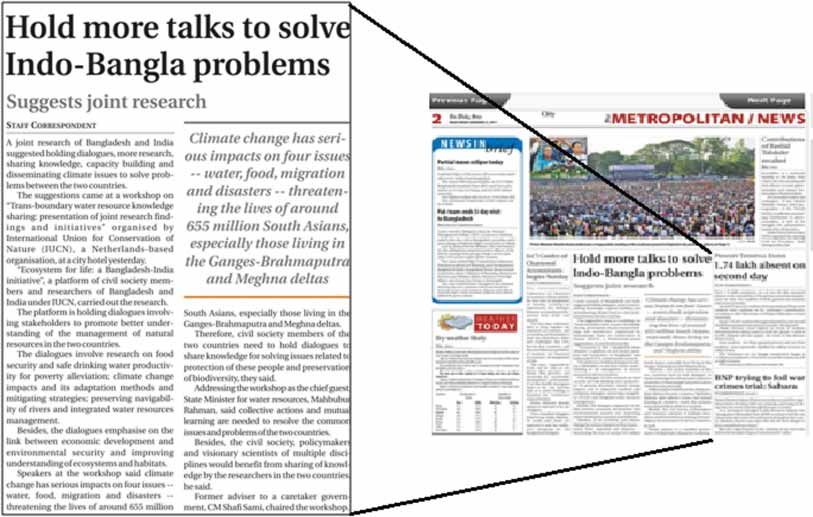
Brahmaputra Basin .............................................. 13 Figure 8.2: Press Clipping of Dhaka Workshop from
Bangladesh’s Daily Star Newspaper ................... 61
Figure 2.7: Discharge Hydrographs of the Brahmaputra
River at Different Locations ............................... 15
Figure 2.8: Soil Types of Brahmaputra Basin ........................ 18
Figure 2.9: Basin Population Distributed by Tables
Administrative Areas ........................................... 19
Table 2.1: Flood damage in Assam ....................................... 12
Figure 2.10: Population Density in Assam .............................. 20
Table 2.2: Topographic Regions of the Brahmaputra River
Figure 2.11: Population Density (2011) of Selected Basin ...................................................................... 14
Regions in Bangladesh ......................................... 20
Table 2.3: Tributary Flow Contributions at Pandu ............. 16
Figure 3.1: Changes in Temperature, Sea Level and
Table 2.4: Decadal growth of population and percentage
Northern Hemisphere Snow Cover ..................... 26
contribution to total growth of India 1991-2001
Figure 3.2: Scenarios for GHG Emissions from and 2001-2011 ...................................................... 21
2000 to 2100 .......................................................... 27
Table 2.5: Distribution of Population, Decadal Growth Rate,
Figure 3.3: Location of Glaciers in the Hindu-Kush- Sex-Ratio and Population Density ...................... 22
Himalayan Region ................................................ 29
Table 3.1: Potential Storage Sites for Development ........... 30
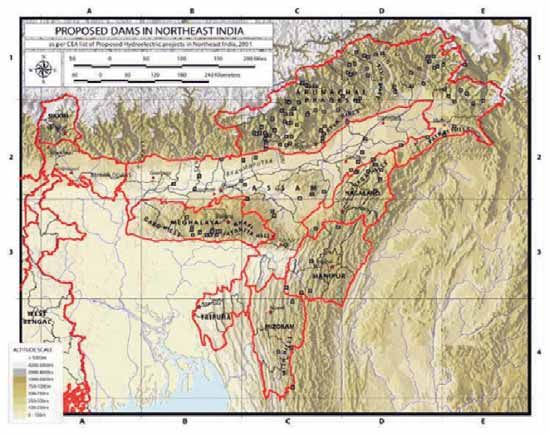
Figure 3.4: Central Electricity Authority projections (2001)
Table 4.1: Mean Annual Flows at Various Locations
identify 168 hydropower projects for a total
of the Brahmaputra River .................................... 35
capacity of 63,328 MW in the Northeast India .. 31
Table 4.2: Monthly Break-up of Annual Flows (% of
Figure 4.1: Seasonal Climate Normals (1961–1990)
Annual Mean flow) ............................................... 35
for Different Physiographic Zones ...................... 34
Table 4.3: Annual Flows at Various Exceedance
Figure 5.1: Climate Change Impact Analyses
Probabilities........................................................... 35
Methodology ......................................................... 41
Table 4.4: Important Tributaries of the
Figure 5.2: Temperature Changes by 2050 and
Brahmaputra River ............................................... 36
2100 Due to Climate Change ............................... 43
Table 4.5: Gross and Net Water Demands for 2050 ............ 37
Figure 5.3: Evapotranspiration Changes by 2050
and 2100 Due to Climate Change ....................... 44 Table 4.6: Water Demands in Bangladeshx PHYSICAL ASSESSMENT OF THE BRAHMAPUTRA RIVER
List of Figures and Tables
Portion for 2025..................................................... 37 Table 6.2: Typical NAM Model Parameters .......................... 52
Table 5.1: IPCC 4th Assessment Report of Global Expected Table 6.3: Performance of Brahmaputra Basin Model ....... 54
Range of Changes to Climate Parameters ......... 40
Table 7.1: Change in Monthly Basin Rainfall and Simulated
Table 5.2: Results of GCMs available in Climate Average Flow at Chilmari from 2009 .................. 56
Change Tool of MIKE ZERO .................................. 42
Table 7.2: Monthly Average River Flow Changes at
Table 5.3: Monthly Average Temperature Changes Chilmari Due to Climate Change........................ 57
due to Climate Change ........................................ 43
Table 7.3: Change in Dependable Flows at Chilmari Due to
Table 5.4: Monthly Average Evapotranspiration Changes Climate Change .................................................... 58
due to Climate Change ........................................ 44
Table 5.5: Monthly Average Rainfall Changes due to
Climate Change .................................................... 45
Table 6.1: Sub-catchments of the Brahmaputra River Basin
Model ..................................................................... 52Executive Summary
xii PHYSICAL ASSESSMENT OF THE BRAHMAPUTRA RIVER
Executive
Summary
The Brahmaputra River is one of the largest revealing more surface areas). During
river systems in the world. Yet it is also one of monsoon, the average increase in monthly
the most under-investigated, underdeveloped flows may vary from 3% to 9% by 2050 across
basins. This study analyzed available climatic the three emission scenarios, and by 7% to
, and hydrologic data to carry out a physical 16% by 2100. In the dry season, the average
assessment of the basin. The analysis also increase in monthly flows varies by similar
looked at possible climate change impacts on amounts (2% to 11% by 2050, and 8% to
temperature, evapotranspiration, rainfall, and 15% by 2100). The increase in flows by 2050
river flows in the basin. concurs with common understanding of
By analyzing the outputs from twenty two climate change impacts in the Brahmaputra
General Circulation Models (GCMs), it was Basin. However, the continued increase in
found that: flows indicated by 2100 does not support
Temperatures are expected to the common understanding that reduction
increase from 1.3oC to 2.4oC by 2050, in glacier contributions over the long term
and from 2.0oC to 4.5oC by 2100 in would have a decreasing impact on flows.
the basin; This highlights the large uncertainties
Monthly evapotranspiration is associated with long term climate change
likely to increase by 5% to 18% by impact estimates. It is also important
2050, and from 7% to 36% by 2100, to note that apart from greenhouse gas
especially in the months of winter; emissions, there are other first-order drivers
Average change in monthly rainfall of climate change such as land use, and land
are likely to vary from 14% decrease cover changes that play significant roles.
to 15 % increase by 2050, and 28 % The numerous interactions between land,
decrease to 22 % increase by 2100; atmosphere, and human activities often
Average monthly flow at a make long-term projections undependable.
downstream station at Chilmari in However, our results are based on the
Bangladesh is expected to change collective projections of 22 GCMs, which give
by -1% to 15% by 2050, and by 5% to an indication of the possible direction, and
20% by 2100; and magnitude of change in river flows.
Generally, A1B1 and A2 impact When undertaking physical assessments of
predictions are similar, which tend river systems, it is important to keep in mind
to be more severe than impacts in contextual issues such as population growth,
the B1 emission scenario. land use changes, dams, and diversions,
The predicted climatic changes derived from etc. For international river basins such
the GCMs were then used as inputs to a basin as theBrahmaputra Basin, joint research
model, which was based on the MIKE Basin projects, and collaboration between scientists
software package. The mathematical model from riparian countries can lead to a better
was used to simulate the changes in river understanding of the water resources
flows for the three emission scenarios. The systems, and how it can change in the future.
overall increase in flows throughout the year This project has successfully demonstrated
is driven by significant increase in monsoon that fruitful collaboration is possible between
flows arising from increased rainfall, higher researchers of India, and Bangladesh in the
snow melt rates, and increased run off field of water resources. It is recommended
generating areas (as snow melt zone shifts that further joint data collection, and
to higher latitudes due to climate change, analyses studies be undertaken.
1
A1B scenario assumes very rapid economic growth, a global population that peaks in mid-century and rapid introduction of new
and more efficient technologies with balance across all energy sources – this scenario is considered as the most likely. A2 describes a
very heterogeneous world with high population growth, slow economic development and slow technological change – this scenario is
normally seen as worst case. B1 describes a convergent world, with the same global population as A1 but with more rapid changes in
economic structures toward a service and information economy – the scenario is normally seen as best case.1 Introduction
2 PHYSICAL ASSESSMENT OF THE BRAHMAPUTRA RIVER
Chapter 1 Introduction
1.1 Background is the premier institute of engineering,
science, and technology in the north-
The project aims to improve integrated eastern region of India, with a growing
management of riverine ecosystems in list of accolades earned nationally, and
South Asia through dialogue, research and internationally. The Institute has eleven
advocacy efforts. The joint Project Advisory departments, and three inter-disciplinary
Committee (PAC) oversees implementation academic centres, covering all the major
of the E4L initiative, and acts as a bridge for engineering, science and humanities
the dialogue process between government, disciplines, offering BTech, BDes, MA, MDes,
and civil society at the regional level. The MTech, MSc and PhD programmes. IIT
Ecosystems for Life: A Bangladesh-India Guwahati has world class infrastructure
Initiative is a project led by the IUCN to for carrying out advanced research and
promote insights into transboundary issues has been equipped with state-of-the-art
across the three major river systems: the scientific and engineering instruments and
Ganges, the Brahmaputra, and the Meghna. laboratories. Water resources and hydraulics
IWM is a Trust established by the engineering are specialized research fields in
Government of Bangladesh in December the Department of Civil Engineering. Some
1996, to function as a Centre of Excellence, of the particular research areas under this
and Learning in the field of Computational specialization include meso-scale distributed
Hydraulics, Water Modelling, and Allied hydrological modelling, satellite remote
Sciences. IWM has more than 20 years of sensing and GIS based water resources
experience in mathematical modelling in modelling and management, computational
the field of water resources, and in carrying river hydraulics and its applications,
out National Macro Level Planning Studies watershed and irrigation management, flow
using Mathematical Modelling tools. through porous media, stochastic sub-surface
IWM has successfully provided Support hydrology, rainfall modelling, modelling &
Services to National Flood Action Plan (FAP), simulation in free surface flow, heuristic
Development of Flood Forecasting & Warning method in reservoir optimization, and dam
System of Bangladesh, and in the preparation break analysis.
of the National Water Management Plan
(NWMP). IWM has developed a suite of 1.2 Study Objectives
mathematical models at the national, and
at the level of Ganges-Brahmaputra-Meghna The main objective of this Physical
(GBM) region. These models are routinely Assessment is to determine the water regime
used for planning, and management of and the potential climate change impacts
water resources in Bangladesh. The model on water availability, in selected sites of the
of the GBM region has been used for water Brahmaputra River Basin. Specific objectives
resources assessment of the GBM basins, include the following:
climate change impact studies, study of the Using existing data, identify current
impacts of different development scenarios potential annual flow regime
in the basin on water availability, salinity (amount and variability), identify
intrusion, flooding, and river morphology. types of water users, their annual
IWM is the single source of modelling water use and identify knowledge
technology, and expertise in Bangladesh. gaps where information are missing;
The government of Bangladesh has issued a
circular to this effect. Assess the water availability for a
number of potential climate change
Indian Institute of Technology (IIT) Guwahati projection2 scenarios for both wet
2
“A climate projection is usually a statement about the likelihood that something will happen several decades to
centuries in the future if certain influential conditions develop. In contrast to a prediction, a projection specifically
allows for significant changes in the set of boundary conditions, such as an increase in greenhouse gases, which
might influence the future climate. As a result, what emerge are conditional expectations (if this happens, then that
is what is expected). For projections extending well out into the future, scenarios are developed of what could happen
given various assumptions and judgments.” http://www.wmo.int/pages/themes/climate/climate_projections.phpPHYSICAL ASSESSMENT OF THE BRAHMAPUTRA RIVER 3
Introduction Chapter 1
and dry seasons; Customization and updating of
Brahmaputra River Basin model –
Identify the main potential
which is a GIS-based hydrological
climate change impacts on water
water balance model;
availability;
Formulation of climate change
Technical assessment with
scenarios and model simulations;
model results, on climate change
and
implications for various scenarios,
to other groups responsible for Multi-stakeholder dialogue and
assessment of food security, water reporting.
productivity, poverty assessment
and adaptation measures to mitigate
1.4 Study Approach and
the adverse impacts.
Methodology
So far, existing GCM-centric studies have
The overall study approach and methodology
focused on one type of outputs but this study
is shown in Figure 1.1. The study is mainly
provides a composite appraisal. Policy-makers
based on basin level modelling, which
can have a broader picture compared to
is based on collection and analyses of
impacts of individual GCMs. Beneficiaries of
secondary data. After setting up the model,
this joint research study are mainly policy
several simulations were carried out for the
makers, researchers, etc.
base period (no climate change) and the
scenarios with climate change. The physical
1.3 Scope of Study assessment of the basin was then based on
the change in average monthly flows and
The scope of the study was:
also variations in dependable flows. The
Define the extent of the study area; key findings from this study were discussed
at a workshop in Dhaka with stakeholders
Review of available data and
and researchers from other parts of the
literature relevant to physical
Ecosystems for Life project.
assessment of the Brahmaputra
Basin;4 PHYSICAL ASSESSMENT OF THE BRAHMAPUTRA RIVER
Chapter 1 Introduction
Figure 1.1
Overall Study Approach and Methodology
• Review past studies
• Secondary data /map • Update basin model
Collate and
collection from India • Calibrate model
analyze data
and Bangladesh • Validate model
• Analyze change in average
• Simulation of base
monthly flows
period
• Analyze change in
• Simulation of climate
dependable flows
change scenarios
Discuss results with
stakeholders at Dhaka
Workshop
1.5 Report Structure model predictions for temperature, rainfall
and evapotranspiration in the Brahmaputra
In the next section, the basin setting is Basin. Section 7 describes the modelling work
described, with emphasis on its physical undertaken in this study. The model results
features. In Section 3, a review of the are provided in Section 8, with relevant
available literature is provided, with a focus discussions. The final section provides
on climate change related studies. The data conclusions and recommendations from this
collected and analyses undertaken are study.
summarized in Section 4. Sections 5 and
6 provide a summary of climate change2 Basin Setting
6    PHYSICAL ASSESSMENT OF THE BRAHMAPUTRA RIVER
Chapter 2   Basin Setting

                       2.1     Overview                                width varies from 64 km to 90 km (Datta and
                                                                       Singh 2004). The valley is bounded in the north
                       The old Sanskrit name of the river              by high Himalayan mountain ranges, in the
                       Brahmaputra is Lauhitya; however the local      east by the Patkai hill ranges, in the south by
                       name in Assam is Luit. The native inhabitants   the lower (Assam) hill ranges and in the west,
                       like the Bodos called the river Bhullam-        it is contiguous with the plains of Bangladesh.
                       buthur that means ‘making a gurgling            Figure 2.1 shows the Brahmaputra basin area.
                       sound’. This name was later Sanskritized        The Indian and Bangladesh portions of the
                       into Brahmaputra (www.srimanta.net).            basin are shown in more detail in Figure 2.2
                       The Brahmaputra river of South Asia is the      and Figure 2.3, respectively.
                       fourth largest river in the world in terms of
                       annual discharge. Average discharge of the      The Brahmaputra River drains an area of
                       Brahmaputra is approximately 20,000m3/s         around 580,000km2, covering four countries
                       (Immerzeel, 2008). The river has an average     (% of total catchment area in brackets):
                       annual sediment load of about 735 million       China (50.5%), India (33.6%), Bangladesh
                       metric tonnes, and a specific flood discharge   (8.1%) and Bhutan (7.8%). Its basin in
                       of 0.149 m3/s/km2 (Datta and Singh 2004).       India is shared by Arunachal Pradesh
                                                                       (41.88%), Assam (36.33%), Nagaland (5.57%),
                       The Brahmaputra valley in Assam (India) is      Meghalaya (6.10%), Sikkim (3.75%) and West
                       long and narrow; it is 640 km long and the      Bengal (6.47%) (Singh et al 2004).
PHYSICAL ASSESSMENT OF THE BRAHMAPUTRA RIVER 7
Basin Setting Chapter 2
The Brahmaputra River Basin area
Figure 2.18 PHYSICAL ASSESSMENT OF THE BRAHMAPUTRA RIVER
Chapter 2 Basin Setting
The Brahmaputra River Basin – Indian Part
Figure 2.2PHYSICAL ASSESSMENT OF THE BRAHMAPUTRA RIVER 9
Basin Setting Chapter 2
The Brahmaputra River Basin – Bangladesh Part
Figure 2-3
The main river channel traverses three with the Ganga (Ganges River). The long
different countries: China, India and profile for the entire river course is shown in
Bangladesh. Originating from the great Figure 2.4. In China, the river is known as the
glacier mass of Chema-Yung-Dung in Yarlung Tsangpo and flows east at an average
the Kailas range of southern Tibet at an height of 4,000m a.s.l. At its easternmost
elevation of 5,300m above sea level (a.s.l), the point, it bends around Mt. Namcha Barwa
Brahmaputra river travels a total distance of and forms the Yarlung Tsangpo Canyon,
2,880km (1,625km in China, 918km in India which is considered the deepest in the world.
and 337km in Bangladesh) before emptying
into the Bay of Bengal through a joint channel10 PHYSICAL ASSESSMENT OF THE BRAHMAPUTRA RIVER
Chapter 2 Basin Setting
Figure 2.4
Long Profile of the Brahmaputra River
CHINA
SHIGATSE
TSELA D’ZONG
5000
1.6
Elevation in metres
4000 3m
0.094 m/km
0.079 m/km
/km
0.62 m/km
0.27 m/km
0.71 m/km
0.15 m/km
0.14 m/km
0.11 m/km
PE
ENTERS BANGLADESH
3000
ENTERS INDIA
BAY OF BENGAL
2000
BESSAMORA
PASIGHAT
4.3
PANDU
KOBO
-16
1000
.8
m/
km
0
0 2 4 6 8 10 12 14 16 18 20 22 24 26 28
Distance in hundred km
As the river enters Arunachal Pradesh (India), Raidak, Jaldhaka/Dharla, Teesta, and Atrai
it makes a very rapid descend from its Rivers on the right bank. In Assam, the river
original height in Tibet, and finally appears is sometimes as wide as 10 km or more.
in the plains, where it is called Dihang. It Between Dibrugarh, and Lakhimpur districts,
flows for about 35km and is joined by two the river divides into two channels-the
other major rivers: Dibang and Lohit (see northern Kherkutia channel and the southern
Figure 2.5, next page). From this confluence, Brahmaputra channel. The two channels join
the river becomes very wide and is called again about 100 km downstream, forming the
Brahmaputra. A few more tributaries join Majuli island. At Guwahati, near the ancient
the main course of the river later on namely, pilgrimage centre of Hajo, the Brahmaputra
BurhiDihing, Dikhou, Dhansiri and Kopili cuts through the rocks of the Shillong
Rivers on the left bank and Subansiri, Plateau, and is at its narrowest and is 1km
Kameng, Manas, Sankosh, Dudhkumar/ wide. (Singh et al 2004).PHYSICAL ASSESSMENT OF THE BRAHMAPUTRA RIVER 11
Basin Setting Chapter 2
Figure 2.5
Schematic Profile of the Brahmaputra River
In Bangladesh, the Brahmaputra splits major reasons of economic backwardness of
into two branches: the much larger branch the state. The agricultural sector faces the
continues due south as the Jamuna (Jomuna) greatest threat due to the flooding events
and flows into the Lower Ganges, locally (Table 2.1). As a consequence of flood, there is
called Padma (Pôdda), while the older branch large scale erosion of riverbank soil and high
curves southeast as the old Brahmaputra flood season is synonymous with breach of
(Bromhoputro) and flows into the Upper embankment which are not sturdy enough to
Meghna. Both paths eventually reconverge withstand heavy pressure of high flood water.
near Chandpur in Bangladesh and flow out Surge of water that inundates the cropfileds
into the Bay of Bengal. Apart from the old also brings silt and sandy soil, rendering the
Brahmaputra, the other main distributary cultivatable lands unsuitable for immediate
(spill channel) is the Dhaleshwari River in cultivation. Normally, flood occurs during
Bangladesh. the monsoon months of June to September.
However, recent years have seen several spate
The Brahmaputra basin represents an acutely
of floods devastating the state, that offer
flood-prone region, which act as a bottleneck
continues for 6 to 7 months.
to agricultural development and is one of the12 PHYSICAL ASSESSMENT OF THE BRAHMAPUTRA RIVER
Chapter 2 Basin Setting
Table 2.1
Flood damage in Assam (1 lakh= 100,000)
Area affected Cropped area Value of crops Population
Year
(lakh ha) damaged (lakh ha) damaged (lakh Rs.) affected (in lakh)
1 2 3 4 5
1954 29 3.05 1175.14 13.00
1955 13.5 0.73 238.43 1.77
1956 5.13 0.69 254.55 2.71
1957 3.95 0.25 100.71 3.16
1958 12.29 0.59 144.33 4.04
1959 7.58 1.44 486.59 11.72
1960 4.68 2.21 762.92 13.22
1961 1.89 0.13 29.9 2.21
1962 15.95 6.61 1848.57 39.08
1963 5.67 0.74 197.4 8.80
1964 6.02 1.23 238.07 7.65
1965 3.22 0.24 88.56 2.58
1966 15.11 3.69 2149.04 36.24
1967 2.45 0.88 133.44 4.50
1968 3.76 1.25 801.4 8.35
1969 10.63 0.69 335.73 8.90
1970 7.58 2.26 1042.52 18.91
1971 4.48 1.12 469.88 6.59
1972 9.97 3.59 2221.41 29.52
1973 24.09 1.64 1440.04 18.47
1974 NA NA 1366.11 NA
1975 1.24 0.17 124.55 2.32
1976 2.52 NA 865.13 4.40
1977 10.24 NA 2654 45.49
1978 3.06 NA 393 9.17
1979 6.73 NA 2614 24.51
1980 10.6 NA 3237 33.59
1981 4.57 NA 701 13.58
1982 68.85 NA 469 14.24
1983 6.95 1.25 1032 21.21
1984 9.36 3.57 4899 38.79
1985 6.46 0.82 8290 24.66
1986 4.26 3.22 33,867 24.45
1987 25.73 10.7 36,859 94.60
1988 46.5 13.35 33,410 126.77
1989 8.8 1.00 na 28.00
1990 6.2 0.6 63.7 28.00
1991 12.7 0.9 115.6 108
1992 2.9 0.1 17.8 12
1993 17.2 6.6 na na
1994 6.8 6.8 na na
1995 9.2 10.6 na na
1996 12.8 6.5 na na
1997 9.6 2.7 19.5 na
1998 12.4 7.7 463.3 na
Modified after: Goswami et al. 2004; Goyari, 2005PHYSICAL ASSESSMENT OF THE BRAHMAPUTRA RIVER 13
Basin Setting Chapter 2
2.2 Topography Brahmaputra basin into three different
physiographic zones: Tibetan Plateau (TP),
The basin is of irregular shape: the maximum Himalayan Belt (HB), and the floodplain
east-west length is 1,540km and the (FP) (see Figure 2.6). These zones respond
maximum north-south width is 682 km. The differently to the anticipated climate change.
basin lies between 23°N to 32°N latitude and TP covers 44.4% of the basin, with elevations
82°E to 97°50’E longitude. The part of the of 3,500m a.s.l and above, whereas HB
Tibetan plateau falling under the basin has covers 28.6% of the basin with elevations
an elevation varying from 3,000 to 5,000m ranging from 100m to 3,500m a.s.l. The area
a.s.l and is dotted with numerous glaciers with an elevation of less than 100m a.s.l. is
(Singh et al 2004). considered as FP and comprises about 27% of
Immerzeel (2008) categorized the the entire basin.
Figure 2.6
Physiographic Zones of the Brahmaputra Basin
The Brahmaputra River drains diverse deltaic lowlands of Bangladesh. The basin
environments such as the cold dry plateau of covers 5 topographic regions falling in 4
Tibet, the rain-drenched Himalayan slopes, countries as given in Table 2.2.
the alluvial plains of Assam and the vast14 PHYSICAL ASSESSMENT OF THE BRAHMAPUTRA RIVER
Chapter 2 Basin Setting
Table 2.2
Topographic Regions of the Brahmaputra River Basin
Area
Topographic Region Geographical Location
(km2)
High Tibetan Plateau 293,000 Southern Part of the Tibet province of China.
High Himalayan 137,050 Part of Himalayan kingdom of Bhutan and 3 states of
mountains India: Arunachal Pradesh, West Bengal and Sikkim.
Brahmaputra Valley 56,200 Part of Assam State of India.
Lower (Assam) 37,200 Part of 3 states of India: Nagaland, Assam and Meghalaya.
Mountainous Region
Plains 56,550 Part of West Bengal (India) and part of Bangladesh.
Source:www.nih.ernet.in/rbis/basin%20maps/brahmaputra_about.htm
2.3 Climate northward shift of the local jet stream,
which itself results from rising summer
In the basin area, the year can be divided temperatures over Tibet and the Indian
into four seasons: the relatively dry, cool subcontinent. The void left by the jet stream,
winter from December through February; which switches from a route just south
the dry, hot summer from March through of the Himalayas to one tracking north of
May; the southwest monsoon from June Tibet, attracts warm, humid air. The main
through September when the predominating factor behind this shift is the high summer
southwest maritime winds bring rains; and temperature difference between Central Asia
the retreating monsoon of October and and the Indian Ocean. The hottest month for
November. most of the basin is May. In cooler regions
Frigid winds from the Himalayas can depress of North India, immense pre-monsoon
temperatures near the Brahmaputra River. squall-line thunderstorms, known locally
The two Himalayan states in the east, Sikkim as “Nor’westers”, commonly drop large
and Arunachal Pradesh, receive substantial hailstones. Most summer rainfall occurs
snowfall. The extreme north of West Bengal, during powerful thunderstorms associated
centred around Darjeeling, also experiences with the southwest summer monsoon;
snowfall, but only rarely. Winter rainfall—and occasional tropical cyclones also contribute
occasionally snowfall—is associated with to this.
large storm systems such as “Nor’westers” The Bay of Bengal monsoon, moves
and “Western disturbances”; the latter are northward in the Bay of Bengal and spreads
steered by westerlies towards the Himalayas. over most of Assam (Brahmaputra and
Summer in the basin lasts from March to Meghna Basin) by the first week of June.
May. The southwest summer monsoon, On encountering the barrier of the Great
when massive convective thunderstorms Himalayan Range, it is deflected westward
dominate the weather in the basin, originates along the Indo-Gangetic Plain (i.e. over the
from a high-pressure mass, centered over Ganges basin) toward New Delhi (North-west
the southern Indian Ocean; attracted by a of Ganges basin).
low-pressure region centered over South Further climatic details as per the three
Asia, it gives rise to surface winds that ferry regions defined by Immerzeel (2008) are
humid air into basin from the southwest. provided in the analyses section (4.1).
These inflows ultimately result from aPHYSICAL ASSESSMENT OF THE BRAHMAPUTRA RIVER 15
Basin Setting Chapter 2
2.4 Hydrology The highest recorded daily discharge in the
Brahmaputra at Pandu was 72,726 m3/s
The hydrological regime of the Brahmaputra August 1962 while the lowest was 1,757
River is distinguished by extremely large m3/s in February 1968. At Bahadurabad, the
and variable flows (Figure 2.7), significant highest recorded peak flow was 102,534 m3/s
rates of sediment discharge, rapid channel in 1998 (Mirza 2003) and the minimum was
aggradations, accelerated rates of basin 3,280 m3/s in 1960 (Barua 2010). The discharge
denudation and unique patterns of river in the river between summer high flows and
morphology. The annual regime of river winter low flows fluctuates, on an average,
flow in Brahmaputra basin is controlled by 12 times, although in certain years it has
by climatic conditions. Rivers flowing from been as high as 20 times (Goswami and Das
the Himalayas experience two high-water 2003). At Pandu, the mean annual flood of
seasons, one in early summer caused by the river, 48,200m3/s, has a return period of
snow melt in the mountains, and one in late 2.2 years, while the maximum recorded flood
summer caused by runoff from monsoon of 72,726 m3/s likely to be repeated once in
rains. about every 133 years (Goswami and Das
With an average annual discharge of 19,830 2003). At Bahadurabad, the return period of a
m3/s at its mouth, the Brahmaputra ranks flood flow of 81,313 m3/s has been decreasing
fourth among the large rivers of the world (becoming more frequent) from 25 years to 5
(Goswami, 1998). The large variation in the years, based on analysis of flows from 1956-
river’s daily discharge over different seasons 1981 and 1981-2007, respectively (IWM and
is a unique feature of the river’s flow regime. CCC 2008).
Figure 2.7
Discharge Hydrographs of the Brahmaputra River at Different Locations
70 70
60 60
50 50
DISCHARGE IN THOUSAND CUMEC
40 40
30 30
20 GUWAHATI
20
PASIGHAT
TSELA DZONG
CHUSHUL DZONG
10 SHIGATSE 10
0 0
JAN FEB MAR APR MAY JUNE JULY AUG SEP OCT NOV DEC
Source: (Datta and Singh 2004)16 PHYSICAL ASSESSMENT OF THE BRAHMAPUTRA RIVER
Chapter 2 Basin Setting
The different time lags and peaking due to floods have increased. The 1988
characteristics of flows in different tributaries and 1998 floods were the worst in recent
generate large and variable perturbations history. Floods in the basin are caused by
on the Brahmaputra’s discharge hydrograph a combination of natural and man-made
(see Figure 2.7). As shown in Table 2.3, the factors: the eastern Himalayas setting, highly
key tributaries are Dihang and Subansiri. potent monsoon regime, weak geological
However, contributions from other tributaries formation, active seismicity, accelerated
can combine to give major flood peaks. The erosion, rapid channel aggradation, massive
Brahmaputra basin has a long history of deforestation, intense land-use pressure and
major floods. For example in Assam, major high population growth, especially in the
floods have occurred in 1954, 1962, 1966, floodplain belt and ad hoc temporary flood
1972, 1977, 1984, 1986, 1988, 1998 and 2002. control measures (Goswami and Das 2003).
After the major 8.7 Richter scale earthquake
in 1950, the intensity, frequency and damage
Table 2.3
Tributary Flow Contributions at Pandu
Tributary Average Flow in MCM/yr Percent contribution
Dihang (main stream) 185,102 37.5%
Subansiri 52,705 10.7%
Lohit 46,964 9.5%
Dibang 37,818 7.7%
JiaBharali 28,844 5.8%
BurhiDihing 11,906 2.4%
Kapili-Kalang 9,023 1.8%
Other tributaries above 121,938 24.7
Pandu
Brahmaputra at Pandu 494,300 100.0
Source: Brahmaputra Board (1995)
2.5 Land Cover more conducive to tree growth with a
relatively higher tree line (average 4,570m
The Brahmaputra basin, as a whole, has a.s.l) compared to the western and central
a forest cover of about 14.5%, grasslands Himalayas (Goswami and Das 2003).
occupy about 44%, agricultural lands about
14%, cropland/natural vegetation mosaic The different soil types across the Basin are
12.8%, barren/sparsely vegetated land 2.5%, shown in Figure 2.8. In the Tibetan Plateau
water bodies 1.8%, snow and ice 11%, urban region, the soils are mainly Lithosols, (initial
land 0.02% and permanent wetlands 0.05%. rocky soils), which are shallow soils developed
The total forest cover of the Brahmaputra in situ from various non carbonate hard
basin in India is 1,14,894 km2, i.e. 54% of the rocks. These soils lack horizon development
total area. The distribution of forest cover due to either steep slopes or parent materials
in the different Indian states within the that contain no permanent weatherable
Brahmaputra basin is as follows: Arunachal minerals. The steep slopes where these soils
Pradesh (82.8%), Nagaland (68.9%), Meghalaya are normally found cause the flora on them
(63.5%), Sikkim (38.1%), West Bengal (21.4 to be sparse shrubs or grassland. In the
%) and Assam (20.6 %). As a whole, the Himalayan Belt region, the soils are mainly
eastern Himalaya is more humid, its climate orthicacrisols, which are soils with a layer ofPHYSICAL ASSESSMENT OF THE BRAHMAPUTRA RIVER 17
Basin Setting Chapter 2
clay accumulation. Under forest cover, these development due to moderate weathering
soils are porous surface soils but if the forest of parent material. Eutriccambisols of
is cleared, the A-horizon degrades to form the Temperate Zone are among the most
a hard surface crust. This crusting leads to productive soils on earth (Driessen and
surface erosion during rain showers. Deckers 2001). Gleysols are typically
wetland soils that tend to be saturated with
In the Floodplain region of the Basin,
groundwater for long periods, leading to lack
the soils are mainly eutriccambisols and
of aeration, poor conditions crop roots and
eutricgleysols. Cambisols have slight profile
for soil fauna (Driessen and Deckers 2001).18 PHYSICAL ASSESSMENT OF THE BRAHMAPUTRA RIVER
Chapter 2 Basin Setting
Soil Types of Brahmaputra Basin
Figure 2.8PHYSICAL ASSESSMENT OF THE BRAHMAPUTRA RIVER 19
Basin Setting Chapter 2
2.6 Population regions). Another 34% resides in Assam and
a further 16% in the West Bengal part of
The Brahmaputra basin, with a total the basin. The remaining 9% of the basin
population of about 83 million (across all population can be found in Tibet, Bhutan
four countries), is extremely rich in cultural and other northeastern states of India
diversity, with many ethnic, socio-cultural (Sikkim, Arunachal Pradesh, Meghalaya and
and linguistic groups. The distribution Nagaland).
of the basin population across different
administrative areas is shown in Figure 2.9. It is important to note that the above
This has been calculated based on population population distribution is up to the
data and areas obtained from www. confluence point between the Ganges
citypopulation.de. About 41% of the basin’s and Brahmaputra Rivers at Goalanda
population resides in Bangladesh (north in Bangladesh. A much larger area and
central and north western hydrological population depends on the combined flow,
which flows to the bay via the Meghna River.
Figure 2.9
Basin Population Distributed by Administrative Areas
2%
Arunachal Pradesh
52%
Asam
34%
Meghalaya
Nagaland
Sikkim
West Bengal
Xizang [Tibat]
Bhutan
16% 2% Bangladesh-NC
Bangladesh-NW
2%
1% 1%
1% 16%
Estimated 2011 basin population: 82.67 million
Population data source: www.citypopulation.de, all estimates are for 2011, except Bhutan data is for 201020 PHYSICAL ASSESSMENT OF THE BRAHMAPUTRA RIVER
Chapter 2 Basin Setting
Figure 2.10
Population Density in Assam
Source: http://online.assam.gov.in/
Figure 2.11
Population Density (2011) of Selected Regions in BangladeshPHYSICAL ASSESSMENT OF THE BRAHMAPUTRA RIVER 21
Basin Setting Chapter 2
The spatial distribution and density of Census data. In Arunachal Pradesh it is 2.3%/
population is quite uneven in the basin, with yr but the overall population is much lower
the highest density of about 828 persons/km2 (Table 2.4). Decadal growth of population
in the Bangladesh portion, followed by India and percentage contribution to total growth
(143 persons/km2), Bhutan (26 persons/km2) of India 1991-2001 and 2001-2011 has been
and Tibet (6 persons/km2) (Goswami and Das highlighted in Table (2.5). In Bangladesh, the
2003). As an example, the varying population annual population growth rates for North
density in Assam and Bangladesh are shown Central and Northwest regions in the same
in Figure 2.10 and Figure 2.11, respectively. In period were 2.6%/yr and 1.2%/yr respectively.
Assam, agricultural expansion and migration For the Xizang (Tibet) region, the annual
has been identified as one of the drivers of its growth rate was 1.4% for the period from
varying population density (Shrivastava and 2001 to 2011. The annual population growth
Heinen 2005). rate of Bhutan for the period 2005 to 2010
was 1.8%/yr.
The population growth rate of Assam is about
1.6%/yr based on the 2011 and 2001 Indian
Table 2.4
Decadal growth of population and percentage contribution to total growth of India 1991-2001 and
2001-2011 (For the seven Northeastern states)
Percentage contribution to total
Decadal Growth of Population
population growth of India
State 1991-2001 2001-2011 1991-2001 2001-2011
Assam 4241206 4513744 2.33 2.49
Arunachal Pradesh 233410 284643 0.13 0.16
Manipur 456747 427860 0.25 0.24
Mizoram 198817 202441 0.11 0.11
Nagaland 780490 -9434 0.43 -0.01
Tripura 441998 471829 0.24 0.26
Meghalaya 544044 645185 0.3 0.36
Sikkim 134394 66837 0.07 0.04
Source: http://www.imaginmor.com/census-of-india-201122 PHYSICAL ASSESSMENT OF THE BRAHMAPUTRA RIVER
Chapter 2 Basin Setting
Table 2.5
Distribution of Population, Decadal Growth Rate, Sex-Ratio and Population Density
Percentage Sex-Ratio (Number Population
State/ District Population 2011 decadal growth of females per density
rate of population 1000 males) per sq. km
Persons Male Female 1991-01 2001-11 2001 2011 2001
Arunachal
1382611 720232 662379 27 25.92 893 920 13
Pradesh
Tawang 49950 29361 20589 37.6 28.33 782 701 18
West Kameng 87013 49568 37445 32.22 16.64 754 755 10
East Kameng 78413 38974 39439 13.46 37.14 985 1012 14
Papumpare 176385 90447 85938 67.56 44.57 901 950 35
Upper
83205 41974 41231 10.5 50.34 960 982 8
Subansiri
West Siang 112272 58589 53683 15.55 8.04 912 916 12
East Siang 99019 50467 48552 21.61 13.3 931 962 24
Upper Siang 35289 18657 16632 20.1 5.77 848 891 5
Changlang 147951 77289 70662 31.29 17.96 906 914 27
Tirap 111997 57992 54005 17.33 11.63 910 931 42
Lower
82839 41935 40904 29.15 48.65 960 975 16
Subansiri
Kurung Kumey 89717 44226 45491 6.24 111.01 1013 1029 7
Dibang Valley 7948 4396 3552 17.65 9.3 697 808 1
Lower Dibang
53986 28127 25859 36.76 7.01 858 919 13
Valley
Lohit 145538 76544 68994 35.1 16.44 863 901 24
Anjaw 21089 11686 9403 7.84 13.77 816 805 3
Source: http://www.indiagrowing.com/Arunachal_Pradesh
2.7 Water Use and Requirements In Bangladesh, total areas irrigated by
surface water in 2009-2010 in Dhaka and
The potential utilizable water resources of Rajshahi Divisions were 2,500km2 and 500km2,
the basin are estimated at 50 km3/yr, of which respectively (BADC 2010).
about 90% remains undeveloped (Mahanta
2006), which is about 0.6 m3/person/yr (based In Bangladesh, some major irrigation
on estimated 2011 population of 82.7 million projects dependent on Brahmaputra River
people). Approximately 9.9 km3/yr is used (and tributary) flows include Teesta Project,
throughout the basin (Mahanta 2006). The Kurigram Project, Tangail Project, Pabna
main water use in the basin is for agriculture Project, Meghna-Dhonagoda Irrigation Project.
(81%), followed by domestic uses (10%) and Even irrigation projects in southern part of
industries (9%) (Amarasinghe et al 2004). It the country are dependent on flows from the
has been estimated that irrigated area in the Brahmaputra River, e.g. projects in Chandpur,
Indian part is about 8,500km2 and the potential Bhola and Barisal. 1989 estimates of surface
irrigable area is about 42,600km2 (Goswami water irrigation requirements in the Northwest
and Das 2003). and North Central regions of BangladeshPHYSICAL ASSESSMENT OF THE BRAHMAPUTRA RIVER 23
Basin Setting Chapter 2
varied from 51 to 91 m3/s for April (WARPO Anputhas 2006).
2001).
River navigation in the 890km long reach of the
Groundwater availability at shallow depth Brahmaputra from Sadiya to the Bangladesh
(within 20m) is very high in the basin, border has been designated as the ‘National
especially in the valley areas. However, Waterway No. 2’ of India (Goswami and Das
only 4.3% of the existing potential has been 2003).
developed so far in the Indian part of the basin
The flow in the Brahmaputra River has an
(Goswami and Das 2003). In Bangladesh, total
important bearing on salinity intrusion in
areas irrigated by shallow tube wells in 2009-10
coastal regions of Bangladesh. Based on a
were 9,400km2 (Dhaka Division) and 15,500km2
modelling study, Chowdhury and Haque
(Rajshahi Division) (BADC 2010).
(1990) estimated that the salinity levels in the
Environmental water uses in the basin has not Lower Meghna River will exceed acceptable
been given due importance and the wetlands levels if the total water withdrawal from the
are already in danger of losing their ecological Brahmaputra and Ganges Rivers exceeds
character, mainly due to eutrophication 2,200 m3/s, based upon the 80% dependable
(Mahanta 2006). Smakhtin and Anputhas flow. If salinity intrusion is not checked,
(2006) have provided estimates for a range many irrigation projects in Bangladesh will
of environmental flow requirements for the be adversely affected. Therefore, further
Brahmaputra River based on an estimated development in the Ganges-Brahmaputra-
natural mean annual runoff of 585 BCM/yr at Meghna basin needs to take into account the
Pandu. The least acceptable environmental whole basin water requirements.
flow (that could lead to “largely modified”
Based on the study objectives, the literature
ecosystems) was estimated to be about
review focused on studies related to climate
200 BCM/yr. This corresponds to about a 3
change and water resources development
percentage points lateral shift (to the left) of
projects in the Brahmaputra Basin.
the natural flow duration curve (Smakhtin and24 PHYSICAL ASSESSMENT OF THE BRAHMAPUTRA RIVER Chapter 10 Executive Summary
3   Literature
    Review
26 PHYSICAL ASSESSMENT OF THE BRAHMAPUTRA RIVER
Chapter 3 Literature Review
3.1 Conceptual Prediction of Global Natural causes include changes in
Climate Change the Earth’s orbit, the sun’s intensity,
the circulation of the ocean and the
The Earth’s climate has changed many times atmosphere, and volcanic activity.
during the planet’s history, with events ranging
from ice ages to long periods of warmth. Although the Earth’s climate has changed
Historically, natural factors such as volcanic many times throughout its history, the rapid
eruptions, changes in the Earth’s orbit, and the warming seen today cannot be explained by
amount of energy released from the Sun have natural processes alone. Human activities are
affected the Earth’s climate. Beginning late in increasing the amount of greenhouse gases in
the 18th century, human activities associated the atmosphere. Some amount of greenhouse
with the Industrial Revolution have also gases is necessary for life to exist on Earth—
changed the composition of the atmosphere they trap heat in the atmosphere, keeping the
and may very likely influenced the Earth’s planet warm and in a state of equilibrium.
climate. The term ‘Climate change’ refers But this natural greenhouse effect is being
to major changes in temperature, rainfall, strengthened as human activities (such as the
snow, or wind patterns, lasting for decades or combustion of fossil fuels) add more of these
longer. Both human-made and natural factors gases to the atmosphere, resulting in a shift in
contribute to climate change: the Earth’s equilibrium (www.epa.gov). Rising
trend of global temperature analyzed by IPCC
Human causes include burning is shown in Figure 3.1.
fossil fuels, cutting down of forests,
and developing land for farms,
cities, and roads. These activities all
release greenhouse gases into the
atmosphere.
Figure 3.1
Changes in Temperature, Sea Level and Northern Hemisphere Snow Cover
Observed changes in (a) global
average surface temperature;
(b) global average sea level from
tide gauge (blue) and satellite
(red) data; and (c) Northern
Hemisphere snow cover for
March-April. All differences
are relative to corresponding
averages for the period 1961-
1990. Smoothed curves represent
decadal averaged values while
circles show yearly values. The
shaded areas are the uncertainty
intervals estimated from a
comprehensive analysis of known
uncertainties (a and b) and from
the time series (c) (IPCC AR4)You can also read