The China Student Boom and the Risks It Poses to Australian Universities - Salvatore Babones
←
→
Page content transcription
If your browser does not render page correctly, please read the page content below

Analysis Paper 5
August 2019

The China Student Boom
and the Risks It Poses to
 Australian Universities
         Salvatore Babones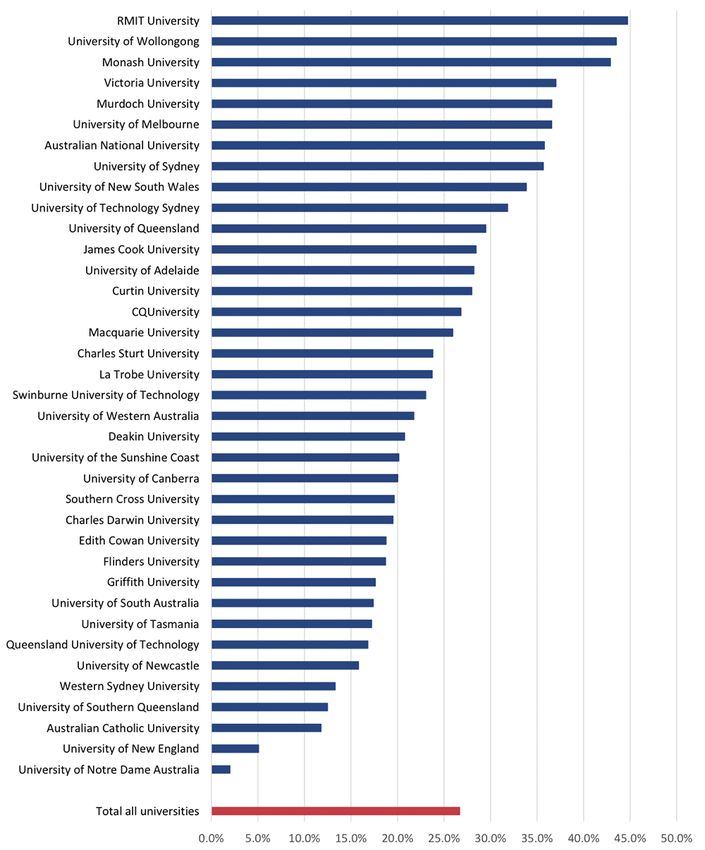
The China Student Boom
and the Risks It Poses to
 Australian Universities

     Salvatore Babones

       Analysis Paper 5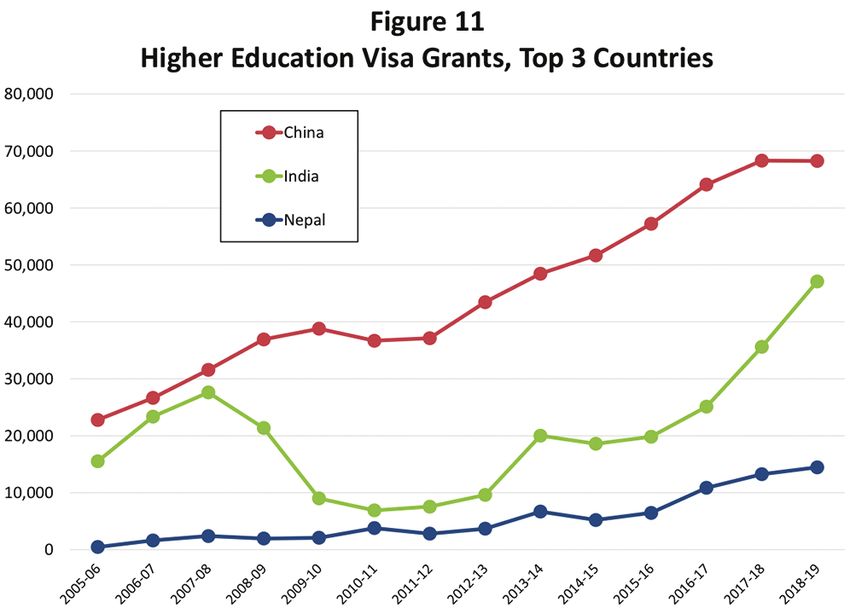
Related Works
Rowan Callick, The China Challenge, CIS Occasional Paper 171, Sydney, Centre for Independent
Studies, July 2019
Contents

Executive summary................................................................................................1

Introduction: How international students
became the ‘cash cows’ of Australian universities........................................................3

Seven leading Australian universities enrol
extraordinary numbers of Chinese students................................................................6

International comparisons reveal the excessiveness
of Australian universities’ China exposure..................................................................9

Australian universities routinely compromise
standards to accommodate international students..................................................... 10

Political factors, competitive factors and macroeconomic
factors could adversely affect Chinese enrolments at Australian universities................. 12

       Political factors — high likelihood / moderate impact.......................................... 12

       Competitive factors — low likelihood / low impact............................................. 13

       Macroeconomic factors — moderate likelihood / high impact............................... 14

The financial risks of over-reliance on China are very large and
cannot be mitigated by diversification..................................................................... 15

Four steps to restore sanity in international student enrolments.................................. 18

Conclusions: Universities reap the rewards, but taxpayers underwrite the risks............. 19

Glossary ............................................................................................................. 21

Appendix: Tables 1-11.......................................................................................... 21

Endnotes............................................................................................................. 30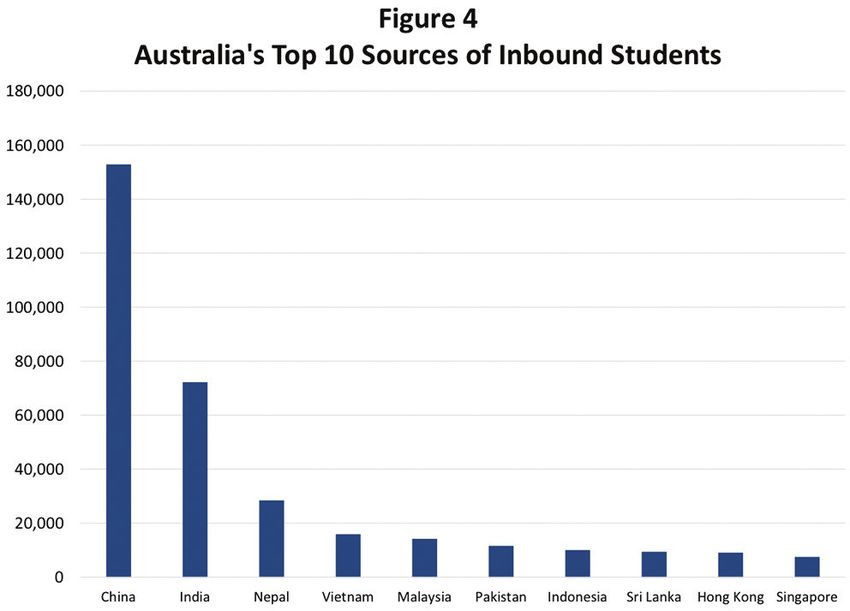
List of figures
Figure 1. International students in Australia...............................................................4
Figure 2. International students per 100,000 population..............................................4
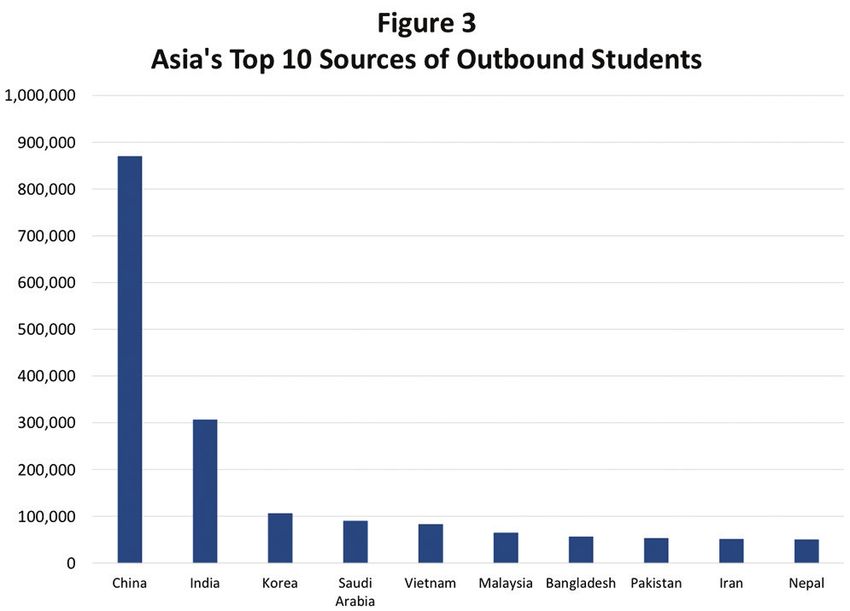
Figure 3. Asia’s top 10 sources of outbound students...................................................5
Figure 4. Australia’s top 10 sources of inbound students..............................................5
Figure 5. Breakdown of Australia’s export earnings......................................................5
Figure 6. International students as a % of total..........................................................7
Figure 7. Chinese students as % of all students..........................................................9
Figure 8. Cumulative int’l enrolment growth, 2001-2017..............................................9
Figure 9. Business school dependence on int’l students ............................................. 10
Figure 10. Estimated % of revenue from Chinese students......................................... 16
Figure 11. Higher education visa grants, top 3 countries............................................ 17
List of tables
Table 1. I nternational student enrolments in Australia,
by sector, as reported for December of each year 2002-2018.......................... 21
Table 2. T
op 25 destinations for international tertiary students in 2016-2017................ 22
Table 3. T
op 10 sources of outbound tertiary students in Asia, 1998-2017.................... 23
Table 4. I nternational student enrolments in Australia,
by country of origin, December 2018........................................................... 24
Table 5. A
ustralia’s education and other exports by major category,
expressed as a percentage of total Australian exports, 2002-2018................... 25
Table 6. P
ercentage of enrolled students who are international students,
by level of study, 37 Australian comprehensive universities, 2017 data............ 26
Table 7. I nternational and Chinese students as a percentage of
all students, selected countries................................................................... 27
Table 8. I ncrease in international student enrolments at seven
focus universities, 2001-2017..................................................................... 27
Table 9. I nternational student enrolments at the business schools of five focus
universities and five American comparison universities, by level of study.......... 28
Table 10. Estimated Chinese student fee revenue for seven focus universities .............. 29
Table 11. N
umber of new higher education sector student visas granted,
by country of citizenship.......................................................................... 30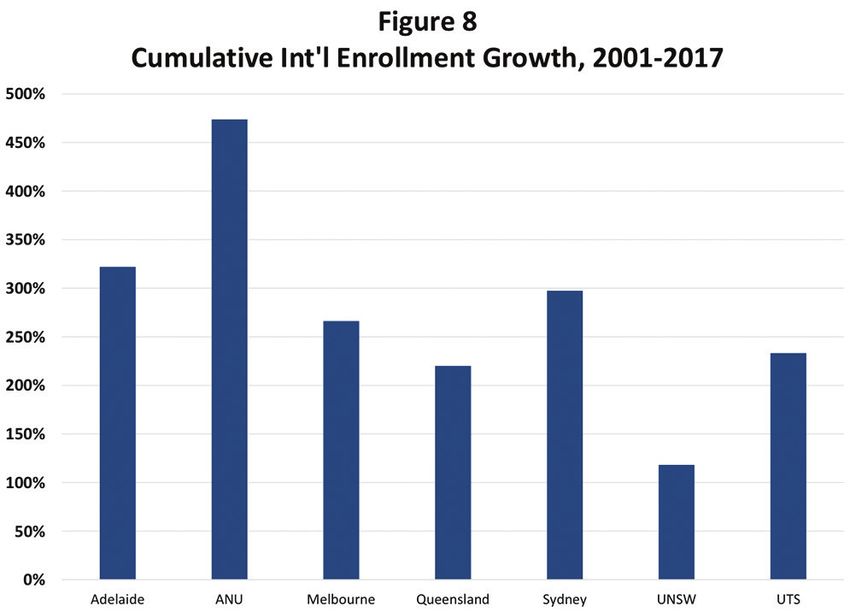
Executive Summary
Australia’s universities are taking a multi-billion dollar   International comparisons reveal the excessiveness
gamble with taxpayer money to pursue a high-risk,            of this China exposure. All seven have higher
high-reward international growth strategy that may           proportions of international and Chinese students than
ultimately prove incompatible with their public service      any university in the entire United States. Indeed,
mission. Their revenues have boomed as they enrol            all seven appear to be more dependent on fee-
record numbers of international students, particularly       paying Chinese students than just about any other
from China. As long as their bets on the international       universities in the English-speaking world.
student market pay off, the universities’ gamble will
                                                             Australia’s universities do not seem to understand the
look like a success. If their bets go sour, taxpayers
                                                             high levels of financial risk inherent in their over-
may be called on to help pick up the tab.
                                                             reliance on the Chinese market, and they certainly
China has consistently been the world’s largest source       do not make sufficient data available to the public
of international students for the last twenty years,         to inform a public debate on these risks. Instead of
with numbers increasing six-fold over this period. It        withholding data, they should follow US and UK best
thus comes as no surprise that the largest source of         practice in transparently reporting detailed student
inbound international student numbers in Australia           numbers by country of origin, level of study, and field
has been from China. However, global outbound                of study. This should be a first step toward publishing
Chinese student numbers have flatlined since 2016,           plans for reducing their reliance on international
with the rapid growth in Chinese enrolments in               students (and Chinese students in particular) to more
Australia slowing dramatically in 2018 and now               manageable levels, with targets set both for the
levelling off. It therefore seems safe to say that           university as a whole and for individual programs.
Australian universities may have reached ‘China max’,        Key facts uncovered in this report include:
but is the current ‘China max’ actually safe?
                                                             •	International students account for roughly 25% of
This report establishes the scale of Australian
                                                                all students on Australian university campuses.
universities’ China risk, assesses the difficulty of
addressing it, and proposes steps to take toward             •	No public university in the United States has as
reducing it in a fiscally and educationally responsible         high a proportion of international students as the
way.                                                            average public university in Australia.

The report identifies and focuses on seven Australian        •	Much of the growth in international student
universities that seem to have extraordinary levels of          numbers at the seven focus universities has been
exposure to the Chinese market:                                 directed into business education. The five for which
                                                                data are available draw more than 40% of their
• University of Melbourne
                                                                entire business student bodies from overseas; for
• Australian National University (ANU)                          Melbourne and Sydney universities, the figure is
                                                                66.9%. American universities do not come close to
• University of Sydney
                                                                these levels.
• University of New South Wales (UNSW)
                                                             •	Approximately 10% of all students now attending
• University of Technology Sydney (UTS)                         an Australian university hail from China.

• University of Adelaide                                     •	More than 40% of all onshore international students
                                                                (and almost certainly the majority of international
• University of Queensland (UQ)
                                                                student fee revenue) come from China.
All seven of these universities rely heavily on
                                                             •	The University of Sydney led the country in 2017 in
international students for revenue and revenue
                                                                generating more than half a billion dollars in annual
growth; and at all seven, Chinese students seem
                                                                revenue from Chinese student course fees.
to account for more than 50% of all international
students. In 2017, they relied on Chinese student            Chinese enrolments are particularly unstable because
course fees for anywhere from 13% (Adelaide and              of macroeconomic risk factors such as the slowing
ANU) to 22-23% (UNSW and Sydney) of their total              of China’s economy, the lack of full convertibility of
revenues. Even these figures likely understate their         the Chinese yuan, and fluctuations in the value of
true China exposure, since they generate substantial         the yuan versus the Australian dollar. Of the nine
non-course revenue from Chinese students as well.            potential risk factors identified in this report that

                                                                                                                        1
could adversely affect Chinese student numbers,              focus universities run into the hundreds of millions
    macroeconomic risks are by far the most serious              of dollars annually, and cannot be mitigated or
    (from a financial perspective) because they could lead       diversified by greater recruitment in India.
    to a sudden and severe fall in Chinese enrolments.
                                                                 Australian universities’ current prosperity is based
    Australian universities routinely compromise                 on a flood of international student money — Chinese
    admissions standards to accommodate international            money in particular. The seven leading universities
    students. Preparatory programs for students with             spotlighted in this report are taking massive financial
    lower English language test scores function as a paid        risks in pursuit of this pot of gold. And just like the
    work-around for international students who do not            world’s leading banks in 2008, they must be aware
    meet admissions standards. By prominently marketing          that they are ‘too big to fail’. As public and publicly-
    such alternative pathways, Australian universities are       accountable institutions, they enjoy an implicit
    in effect taking actions that reduce their financial risks   guarantee that if things go wrong, the government
    by increasing their standards risks.                         will come to the rescue. They should act now to
                                                                 mitigate the risk of a sudden revenue collapse
    Australian universities are now seeking to diversify
                                                                 by raising admissions standards and reducing
    by expanding into the Indian market, but India is too
                                                                 international student enrolments.
    poor to serve as a realistic alternative to China. The
    financial risks of over-reliance on China at the seven

2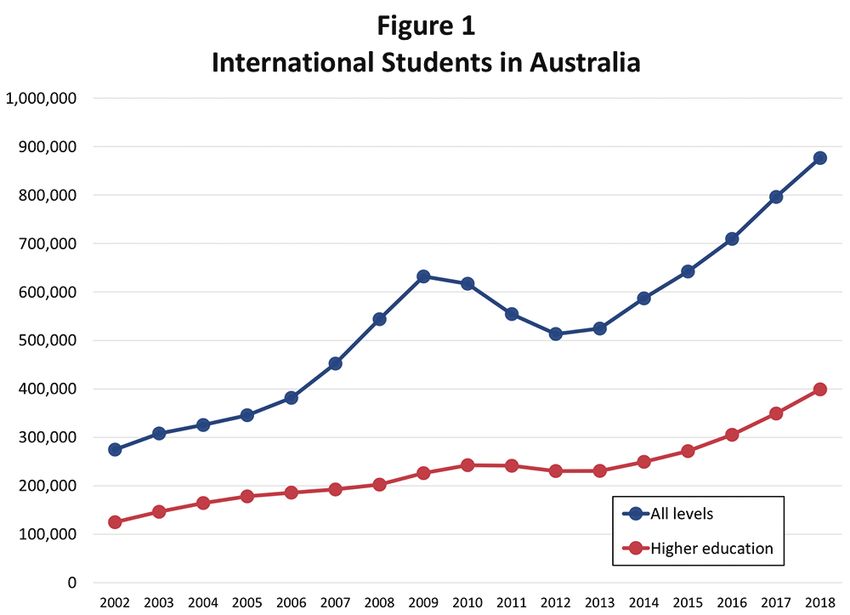
Introduction: How international students became
the ‘cash cows’ of Australian universities
Australia’s higher education sector is booming.              education sector’s per-student revenues rose from
Australia has six universities in the global ‘top 100’,      approximately $25,000 in 2008 to nearly $30,000 in
according to the China-based Academic Ranking                2017, when total revenues are divided by equivalent
of World Universities, up from just three when the           full-time student load (EFTSL).5 This represents a 2%
ranking was first conducted in 2008.1 It also has six        compound annual growth rate, which has only just
‘top 100’ universities in the Times Higher Education         kept pace with inflation. That per-student revenues
rankings and seven in the Quacquarelli Symonds               matched inflation at all is entirely due to the growth in
rankings.2 Their rankings have risen in lockstep with        the number of international students, who generally
their revenues. In 2017, Australia’s higher education        pay much higher fees than domestic students, often
providers generated $32 billion in revenue.3 This            more than three times the total amount (student
is up from just $19 billion in 2008, representing            plus commonwealth contribution) for undergraduate
an impressive 6% compound annual growth, well                places. Australian higher education providers’
                                                             international student EFTSL rose 51% between 2008
in advance of inflation or GDP growth.4 In both
                                                             and 2017, while domestic student EFTSL rose just
reputational and commercial terms, Australia’s
                                                             38%.6 Real revenues per domestic student have
universities are succeeding as never before.
                                                             actually declined, when adjusted for inflation. See Box
However, on a per student basis, their revenue               1 for additional information on trends in Australian
growth has been much less impressive. The higher             government funding for higher education.

  Box 1: Did government cutbacks force Australian universities to expand
  international enrolments?
  International student numbers at Australian universities have been rising for as long as statistics are available,
  more than doubling in the first decade of the 2000s and on track to rise another 50% in the 2010s. The only
  period of relatively slow growth was 2011-2012 when a combination of stricter visa policies and a historically
  high Australian dollar made Australian university degrees simultaneously less attractive and more expensive.
  China has driven much of the historical growth in Australia’s international student population but as the
  number of Chinese recruits levels off, Australian universities are recruiting aggressively in India in an attempt
  to keep international student numbers growing.
  Why are Australian universities so keen to increase their international student enrolments, despite the fact that
  they are already among the most internationalised universities in the world? They are strongly incentivised
  to recruit international students by the fact that international student course fees are not regulated by the
  government, whereas Australian domestic undergraduate course fees are highly regulated (although domestic
  postgraduate course fees are not).
  Historically, the Australian government limited the number of Commonwealth Supported Places (CSP) or
  equivalent at each university and in broad fields of study. These caps were removed in 2010 (except for
  medicine) and replaced with a ‘Demand-Driven Model’ that allowed universities to enrol unlimited numbers of
  undergraduate students in CSPs.
  Due to the rapid growth in student numbers under the Demand Driven Model (and the associated rapid growth
  in government expenditures), the government froze its funding for CSPs at 2017 levels for the two years 2018
  and 2019, with modest increases in line with population growth planned for 2020.7 In inflation-adjusted terms,
  this represents a slight annual decline in real funding levels of approximately 2% per year. The government has
  also announced modest cuts to university research block grants of around 4% per year, to take effect in 2019.
  Taken together, these cuts give the impression that the Commonwealth government is forcing universities to
  look elsewhere for funding, with international students forming the most readily available source.
  This argument, however, misrepresents several clear trends in the data. First and foremost, the greatest
  proportional growth in international student enrolments occurred in the first decade of the 2000s (a decade in
  which government funding for universities roughly doubled) and in 2014-2017, the final four years of uncapped
  CSPs. Second, the universities that took the greatest advantage of uncapped CSPs to dramatically expand
  their domestic undergraduate enrolments by accepting students, on average, with weaker school achievement
  — leading to reports of downward pressure on standards — are not the same universities that are now (2018-
  2019) aggressively recruiting additional international students. Third, even during the period of uncapped CSPs
  (2012-2017), Australian universities’ revenues from international students grew roughly five times as fast as
  their revenues from government sources.
  Thus, although Australian universities may use international student fee revenue to offset slight declines in
  Commonwealth funding, the extraordinary expansion in international student enrolments over the last two
  decades cannot realistically be attributed to cuts in government funding.

                                                                                                                         3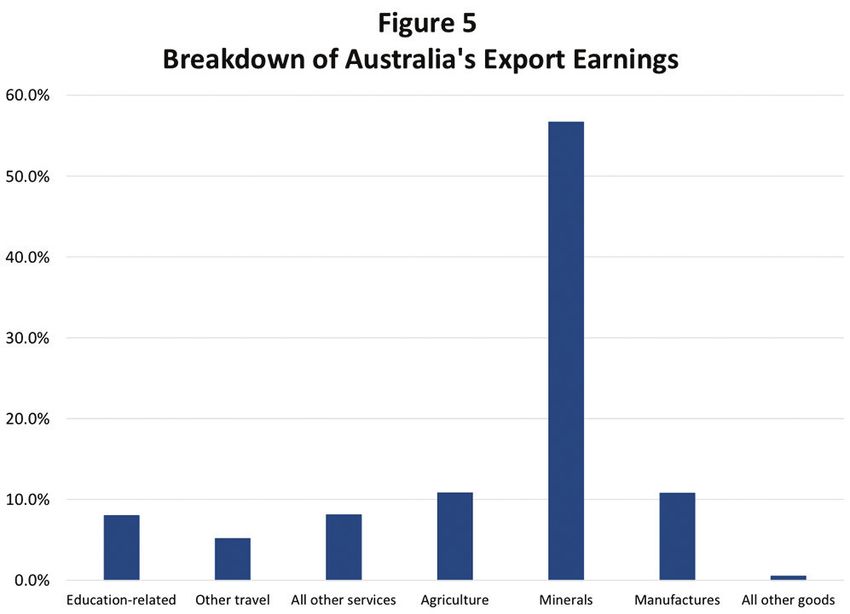
As a recent ABC TV Four Corners program put it, The total number of international higher education
international students have become the ‘cash cows’ of students at Australian institutions has nearly doubled
Australian universities.8 In recent years, international since 2008 and more than tripled since 2002, with
student enrolments at Australian universities have most of that growth occurring onshore.16 International
grown at more than twice the rate of domestic student students in other education sectors (outside higher
enrolments. As a result, between 2012 and 2017, education) have kept pace as well, bringing the
roughly two-thirds of Australian universities’ increase total number of international student enrolments
in total revenue was “driven by increased international at Australian educational institutions to 876,000 in
student fees,” according to the Australian Department December 2018, or about 3.6% of Australia’s total
of Higher Education and Training (DET), with the population.17 International student numbers have
remaining growth due to increases in Commonwealth reached such high levels that a recent national
financial assistance.9 In 2017, international student survey found the majority of Australians now oppose
fee revenue accounted for 23.3% of the higher any further increases, with younger Australians
education sector’s total revenue, up from just 16.3% recording the highest levels of opposition.18
in 2013 when international students were already a Australia’s international students are overwhelmingly
prominent presence on Australian campuses.10 Within concentrated in institutions in New South Wales (38%)
the higher education sector, Australia’s universities and Victoria (32%), which together account for more
account for most of this figure: nearly 90% of the than 70% of all international students.19
total international student fee revenue generated by
Australia ranks third in the world in the number of
Australian higher education institutions goes to the
international tertiary education students, trailing
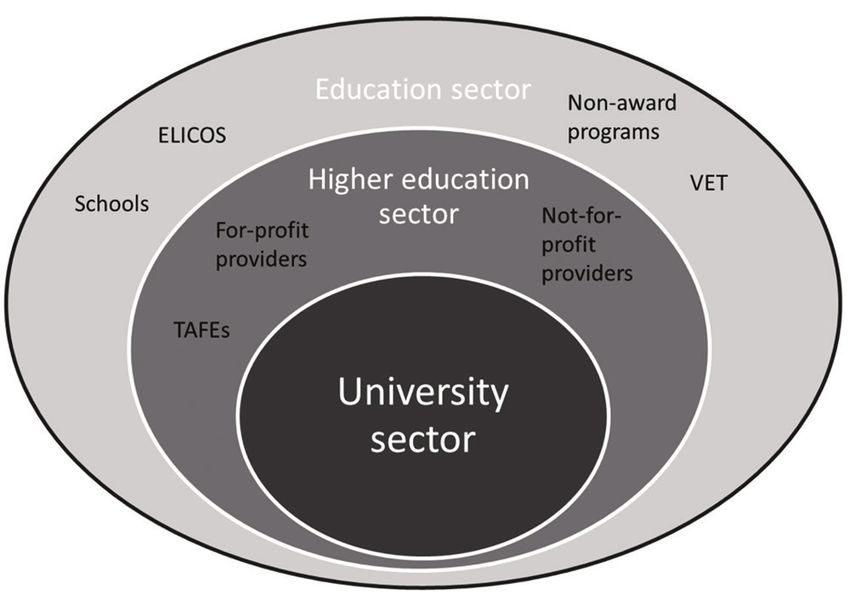
university sector.11 (A schematic illustration of the
only the United States and the United Kingdom, as
structure of Australia’s education industry is provided
reported in Table 2 in the appendix, which is based
in the Glossary at the back of this report.)
on data compiled by the United Nations Educational,
As of December 2018, Australia hosted nearly Scientific and Cultural Organisation (UNESCO).20 21
400,000 international higher education students, Australia has more than twice as many international
according to DET data reported in Table 1 in the tertiary education students as eighth-ranking Canada,
appendix.12 The growth since 2002 in international which has a population 50% larger than Australia’s.
students, both overall and specifically in the higher Measured on a per capita basis, Australia now hosts
education sector, is depicted in Figure 1. International more international students than any other major
students account for 28.5% of all higher education country in the world, as depicted in Figure 2. Australia
students at Australian institutions, and 26.7% of all leads the world by taking in 26 international students
university students, according to DET data for 2017.13 for every one it sends abroad, a ratio more than
These statistics include both onshore and offshore twice that of its nearest competitor, the United States
students of Australian higher education institutions.14 (which has 14 inbound students for every outbound
Calculations based on DET data suggest that onshore one).22
international higher education students made up
approximately 25% of total onshore enrolments in
2018.15
4China is by far the largest source of outbound
international higher education students in the world,
as depicted in Figure 3, based on data compiled by
UNESCO.23 It has consistently been the world’s largest
source of international students for the last twenty
years, as reflected in Table 3 in the Appendix, which
reports outbound student numbers for the 10 largest
sources of international higher education students in
Asia for the past 20 years. China’s outbound numbers
have increased six-fold over the past two decades,
from 134,000 to 869,000. In terms of absolute
numbers, only India comes close, with a five-fold
increase from 59,000 to 306,000. The only other
countries to exhibit similar growth are Vietnam and
Nepal, where outbound student numbers have grown
more than 10-fold, though from much lower initial
bases.
It thus comes as no surprise that the largest source
International students are clearly important for
of inbound international student numbers and
Australia’s universities, but their importance to the
growth in Australia has been China, as depicted in
economy as a whole is frequently overstated. One
Figure 4. Table 4 in the Appendix further breaks
oft-quoted statistic is that educational exports have
down Australia’s international student numbers by
risen to become Australia’s third-largest export after
country of origin, using data from the Department
iron and coal.26 That doesn’t really capture the full
of Education and Training.24 As of December 2018,
story, since exports in different sectors are reported
students from China accounted for 38.3% of
at different levels of granularity. Figure 5 compares
Australian international higher education students,
the size of Australia’s educational exports to that
and 21.6% of students at all other levels (Vocational
of other major sectors from across the economy,
Education and Training (VET), schools, English
using data from the Australian Bureau of Statistics
Language Intensive Courses for Overseas Students
(ABS).27 Additional historical data going back to 2002
(ELICOS), and non-award programs). Chinese
are reported in Table 5 in the Appendix. Educational
students are even more concentrated in the schools
exports overtook receipts from all other travel
sector, where they account for slightly more than
(tourism, family, and business combined) in 2008, but
half (51%) of all international enrolments. Chinese
are still smaller than Australia’s exports of agricultural
students also account for 39% of non-award
or manufactured goods. Moreover, more than half of
enrolment, which consists mainly of university
Australia’s reported educational exports (53.7% in
preparatory programs. They account for 31% of the
higher education and 57.2% for the education sector
ELICOS category, but are notably absent in VET (9%).
as a whole) consists not of student fees, but of goods
These statistics include both onshore and offshore
and services bought by students while in Australia.28
enrolments of Australian higher education institutions.
Since this spending is at least partly generated by
Chinese students tend to be concentrated onshore
income that students earn from working in Australia
(in Australia itself) more than other students. Thus
while studying, the true net value of education exports
Chinese students accounted for 43% of new onshore
to the Australian economy is likely lower than the
university commencements in 2016, more than three
headline figures reported by the ABS and DET.
times as many as the next largest country of origin
(India).25
5Thus although the extraordinarily large number of peers and particularly risky for their ultimate
international students in Australia can be said to sponsors, the country’s taxpayers. In Australia:
benefit the Australian economy, these benefits are not
1) I nternational student numbers have risen
as large as they are often portrayed. But even if the
dramatically from an already-high base
Australian economy as a whole does not rely heavily
on international students, Australia’s higher education 2) I nternational students are concentrated in
sector does. Other education sectors also enrol government-funded public universities
international students, but international education in
3) M
ore than 40% of all international students, and
these other sectors is dominated by private sector
perhaps the majority of international student fee
companies, not public institutions. Risk-taking is part
revenue, come from just one country: China
and parcel of doing business in the private sector.
State-supported higher education institutions like This report analyses the financial risk arising from
universities may be less well-prepared to understand, Australian universities’ financial dependence on fee-
evaluate, and plan for financial risks than are for- paying Chinese students. Since international students
profit companies. Moreover, universities are risking are overwhelmingly concentrated in Australia’s public
not their own money, but public money — and the universities, this financial dependence constitutes
a risk to Australian governments, and ultimately
public trust.
to taxpayers. This report establishes the scale
Australian universities’ reliance on international and character of the risk, assesses the difficulty of
students stands out in several ways that make their addressing it, and proposes steps toward reducing the
situation unique in comparison to their international risk in a fiscally and educationally responsible way.
even leading Australian universities enrol
S
extraordinary numbers of Chinese students
As Australian universities have become ever more students generally pay much higher fees as well — in
dependent on international students, they have also the case of undergraduate students, often more than
become ever more dependent on China. But not all three times higher.
universities are equally dependent on international
At the top of the league of Australian universities
students, or on China. In fact, some are much more
enrolling international students are RMIT University,
dependent on international students in general (and
the University of Wollongong, Monash University,
Chinese students in particular) than are others.
and Victoria University. The figures for these four
International student enrolments, expressed as a
universities are inflated by their large offshore
percentage of all students, are reported for Australia’s
programs. The offshore proportions for RMIT (50.6%),
37 comprehensive public universities in Figure 6,
Wollongong (51.1%), Monash (39.0%), and Victoria
which has been constructed using DET data for
University (55.2%) are all among the highest in
2017.29 A detailed breakdown for undergraduate,
Australia, according to 2017 data from the DET.31
postgraduate, and non-degree students is provided in
Rounding out the top five for international students
Table 6 in the Appendix. Most Australian universities
is Murdoch University. Until as recently as 2017,
rely on international students for more than 20%
Murdoch’s international student cohort consisted
of total enrolments, and all but two (the University
almost entirely of offshore students (81.1% of all
of New England and Notre Dame) are above 10%.
international students).32 More recently, however,
In terms of actual EFTSL student hours generated,
Murdoch has been criticised in the press for engaging
Australian universities are even more dependent on
in a rapid expansion in onshore international student
international students than the numbers reported in
recruitment from India.33
Figure 6 indicate, since 86.5% of international higher
education students are enrolled full-time, compared Though offshore campuses may be important
to only 65.2% of domestic students.30 Across the sources of revenue for some Australian universities,
entire Australian higher education sector (including statistically speaking they are somewhat opaque. It
both universities and other providers), international seems clear that for the five Australian universities
students accounted for 28.5% of all students in 2017, at the top of the international student league
but 30.4% of EFTSL. And, of course, international table, most offshore student fee revenue is drawn
6from countries other than China. Thus, although universities all exceed 30% of the total student body,
offshore campuses persistently raise questions of and all five universities host most of their international
financial and reputational risk, on balance they students onshore (although UNSW reported hosting
tend to diversify rather than concentrate Australian 30.6% of its international students offshore in
universities’ exposure to the China market.34 As of 2017 despite no longer having any international
2017, the DET reported that Australian universities’ campuses).36
offshore campuses were limited to “Curtin University
All five universities are clearly prime destinations
(Malaysia, Singapore & UAE), James Cook University
for Chinese students, though none of them routinely
(Singapore), Monash University (India, Italy, Malaysia
reports its international student enrolments by country
& South Africa), Murdoch University (Singapore &
of origin. The University of Melbourne only notes in
UAE), University of Newcastle (Singapore), University
its 2018 annual report that China is its top source of
of Wollongong (UAE), RMIT University (Vietnam x 2),
international students, without providing any detailed
and Swinburne University (Malaysia).”35
numbers (surprisingly, India ranks only fourth).37 In
The Australian universities with the greatest exposure 2018, international students accounted for 42.1% of
specifically to the Chinese international student all EFTSL at Melbourne, a figure that the university
market are probably the next five in the international highlights as an accomplishment.38 The ANU does not
enrolment league table: Melbourne, ANU, Sydney, even mention Chinese students in its 2017 annual
UNSW, and UTS. International enrolments at these report (the latest one available at time of writing),
7although it does mention the need for “international that China and India combined contribute “over 50 per
student diversification” and plans to open “liaison cent” of international students in the state, and that
offices” in India and Singapore to achieve this.39 It two (unnamed) universities rely on one (unnamed)
has been reported in the press that Chinese students country “to provide more than 50 per cent of their
accounted for 59.1% of all international students at international students.”50 The Victorian and Western
ANU in 2016, though it is not clear whether this refers Australian audit office reports merely repackage
to enrolments or commencements.40 international student EFTSL data published by the
DET, without further elaboration.51 Other state and
The University of Sydney talks in similarly euphemistic
territory audit offices have even less to say about the
terms about “its ambitions to diversify its international
financial risks posed by their universities’ forays into
student cohort” in its 2018 annual report.41 It does
international education.
not mention China by name or provide any figures
to illustrate the need for diversification, but it does It has been reported in the press that Chinese
mention that a “strategy to recruit high-calibre students account for 60% of combined international
students from India was endorsed and an in-country enrolments at Australia’s G8 group of research-
team was appointed in early 2019”.42 The UNSW 2018 intensive universities, which includes the ANU,
annual report highlights the fact that it “attracted Melbourne, Sydney, and UNSW (but not UTS).52 In
23,148 international students from 137 countries” addition to these four universities, Monash, Adelaide,
while making no mention of the home countries of Western Australia, and Queensland round out the G8.
the university’s international students.43 This data was The situation at Monash has been covered above. The
omitted despite the fact that UNSW lists “an increase University of Adelaide reports that Chinese students
in course fees from international students” as the account for 53.8% of all international students and
only positive factor offsetting an otherwise worsening 15.8% of all students.53 The university’s revenue
financial position in 2018.44 According its 2018 annual from international student fees accounts for nearly
report, UTS “reached our target of 30 per cent of our one-quarter of its entire revenue from continuing
student load to be international students”, of whom operations.54 These figures seem to put it in the same
“more than fifty per cent come from China”.45 The league as the NSW universities identified above.
university’s “next goal is to diversify our international The final G8 university is the University of Western
student body”.46 India, Nepal, and Vietnam are Australia, which falls in the middle of Table 6 (see
mentioned, but the university says “we need to Appendix). The university’s 2018 annual report makes
diversify further.”47 no mention of international student numbers, despite
Although these three New South Wales universities the fact that the university draws 16% of its total
are generally uncommunicative about the details revenues from onshore international student fees.55
of their international student cohorts, they did Although press reports suggest that “about half” of
supply Chinese student percentages to the Sydney its international students hail from China, its total
Morning Herald for a widely-cited infographic, which international student enrolments place it well behind
reports that in 2017, Chinese students accounted for other G8 universities.56
66.7% of international enrolments at the University
That leaves the University of Queensland. Falling just
of Sydney, 68.8% at UNSW, and 52.3% at UTS.48
outside the top 10 in Table 6, UQ speaks vaguely in
Meanwhile, indicative financial charts published by
its 2018 annual report of widening “source country
the Audit Office of New South Wales suggest that
diversity” and lists (but does not rank) its top three
Chinese students accounted for approximately 71%
sources of international students as China, Malaysia,
of international student revenue at Sydney, 74% at
and Singapore.57 The University of Queensland’s
UNSW, and 59% at UTS in 2017.49
chancellor Peter Varghese, however, has stated
The New South Wales audit office report is vague that “Chinese students will account for close to
about many of its international student statistics, half of all international students in 2018”.58 He has
but it does provide some details that are not been forthright in warning about the financial risk,
available in other published sources. Some other suggesting that Australian universities redirect
state audit offices have also expressed concerns excess China earnings into long-term future funds or
about their universities’ over-reliance on revenue endowments.59 This suggests that UQ, like Melbourne,
from international students (and Chinese students in ANU, Sydney, UNSW, UTS, and Adelaide, may have
particular), but they are even less forthcoming with a ‘China problem’ lurking in fiscal over-reliance on
hard data. The Queensland audit office states only Chinese international students.
8International comparisons reveal the excessiveness
of Australian universities’ China exposure
As the difficulty of establishing the facts about Figure 7 draws together indicative statistics from a
international student cohorts demonstrates, Australian variety of sources to give a rough idea of the scale of
universities are remarkably vague about their Australia’s international and China exposure. Further
China exposure. By contrast, most large American details are reported in Table 7 in the Appendix.
universities provide exact breakdowns for numbers of Different definitions and reference years are used
international students by country, while international in each country, so these numbers are not strictly
student numbers by country and field of study are comparable, but they are roughly indicative. In
available online for UK universities from the Complete Canada, international students accounted for 12.0%
University Guide. The US university with the largest of post-secondary students in 2016-2017.65 India is
number of Chinese students is the University of Illinois the largest source country, with 30.2% of enrolments,
at Urbana-Champaign, where 5725 Chinese students followed by China with 25.0%.66 In New Zealand,
accounted for 54.1% of international students and international students accounted for 16% of 2017
11.6% of all students in 2018.60 The University of enrolments at the country’s eight universities.67
Illinois publishes these figures in a detailed 52-page Chinese students accounted for 50.9% of this total.68
annual international student report that provides In the United Kingdom, international students
international student counts by country and region, accounted for 25.1% of higher education students in
gender, and field of study for every country and region 2016-2017.69 Chinese students accounted for 23.2%
of the world. of international students.70
Only two major American universities have more As these statistics make clear, Australian universities’
than 30% international students: the Florida Institute China dependence is an extreme outlier among peer
of Technology and New York’s New School, tied at countries like the United States, the United Kingdom,
32%.61 Aside from these two somewhat atypical and Canada, and is high even when compared to
private universities, no other major American New Zealand. Dependence on Chinese students in
university comes in at more than 24%.62 No public particular seems extraordinarily large at Melbourne
university in the United States enrols more than 20% (though exact figures are not available), ANU, Sydney,
international students, and only one (the University UNSW, UTS, Adelaide, and perhaps UQ. These seven
of California at San Diego) has more than 17%.63 universities appear to be more dependent on fee-
paying Chinese students than just about any other
If Australian public universities were included in an
universities in the English-speaking world. It is
international student league table alongside US public
presumably no coincidence that these are the very
universities, the Australians would fill all 20 slots at
universities that have led Australia’s march up the
the top of the table and 31 of the top 33. Not only
global university rankings. It thus makes sense
do nearly all American universities have far lower
to focus in detail on these seven universities as
international student enrolment ratios than those that
emblematic of Australian universities’ China exposure.
prevail in Australia, but American universities’ China
concentration is slightly lower as well, with Chinese All seven of these focus universities have had rapidly
students accounting for 30% of international student increasing international enrolments since 2001, as
commencements in the US in 2016, compared to 43% reported in Figure 8 using DET data.71 Detailed annual
in Australia.64 data are provided in Table 8 (Appendix). Expanding
9international enrolment was part of a broader growth
strategy at ANU, where international enrolment
increased by 473% from a low base, while domestic
enrolments increased by 80%. The ANU has now
declared an end to its enrolment growth, leaving open
the question of whether future international enrolment
gains might come at the expense of domestic
spaces.72 At the other six focus universities highlighted
in Table 8 (Appendix), domestic student growth
has been relatively modest in the 16 years since
2001, with domestic student growth ranging from
a low of 22% at UQ to a high of 34% at Melbourne.
International student numbers, however, have
skyrocketed, more than doubling at UNSW and nearly
quadrupling at Sydney.
Much of the growth in international student numbers
at the seven focus universities has been directed into
business education. At least four (and probably six)
currently have more international students in their
business schools than they had total international
students in 2001.73 As a result of this phenomenal When more than half of the students in a particular
growth in international business student numbers, program are drawn from overseas (or, in the case of
international students outnumber domestic ones at Sydney’s master’s programs in business, 87.2%), the
all of the master’s programs in business for which whole idea of international education as an immersive
data are available at those universities, as depicted cultural experience breaks down. Although none
in Figure 9, which has been compiled using data of the Australian programs publishes data about
from the international accrediting body AACSB.74 the percentage of their international students who
Comparative data are provided for the business hail from China, a recent report claims it is large.76
schools of the five US universities with the largest There have even been press reports about Chinese
number of Chinese students.75 Additional details are students conducting their tutorial and team meetings
provided in Table 9 in the Appendix. All five Australian in Chinese rather than English.77 It has also been
focus universities for which data are available draw reported in the press that some Chinese students
more than 40% of their entire business student bodies even complete entire Australian degrees without ever
from overseas; for Melbourne and Sydney, the figure mastering spoken English.78 The international student
is 66.9%. The American universities do not come statistics reported in Figure 9 are, by any standard,
close to these levels. extreme.
Australian universities routinely compromise
standards to accommodate international students
The extraordinarily high levels of international Queensland, Southern Cross and Murdoch, but similar
students at Australian universities raise many issues exist even at Australia’s most highly-respected
questions, including questions about how well institutions.
universities are performing their core academic
For example, the University of Sydney offers
missions. The fact that international students pay
‘preparatory programs’ that allow international
much higher fees than domestic ones for the same students to circumvent the usual admissions criteria.80
courses strongly incentivises universities to reduce These programs are run by Taylor College, which
admissions and academic standards to accommodate is a 50-50 joint venture between the university
international students. Alternative admissions routes and the for-profit education provider Study Group.
that allow international students to circumvent English The standard program costs $34,300 plus fees for
language requirements and the widespread use of a 40-week course.81 The University of Sydney has
commission-based brokers invite willful negligence a university-wide minimum score of 6.5 on the
and outright abuse, as reported in the ABC Four International English Language Testing System
Corners program ‘Cash Cows’.79 This program reported (IELTS) test for direct admission, but its most popular
on issues at less-prestigious universities like Central degree programs require a minimum of 7.0 (“good
10user” with “operational command of the language”).82 The University of Queensland offers international
However, students can gain admittance through a students with low IELTS scores ‘package offers’
Taylor College preparatory program with a much lower that “include English language studies at UQ-
minimum IELTS score of 5.0 (“modest user” with ICTE and a conditional offer of admission to a UQ
“partial command of the language”).83 Taylor College program.”90 The University of Melbourne website
advertises that “95% of USFP [University of Sydney reassures international students that “If you don’t
Foundation Program] students received offers to the meet requirements there are other pathways for
University of Sydney”, which suggests that nearly all entry to Melbourne undergraduate degrees.”91 At
students who request an offer, receive one.84 UTS, international students can make up for low
IELTS results by completing courses at UTS Insearch
The University of Sydney clearly telegraphs that
(a 100% controlled external company) or even at
the Taylor College programs are intended as a paid
partner institutions in six countries overseas (China,
workaround for international students who do not Indonesia, South Korea, Vietnam, Myanmar, and
meet the university’s admissions standards when it Nepal).92 Many other Australian universities also offer
states in large-font text on its website:85 special pathway programs for international students
If you’re unable to meet the minimum academic with a poor command of English.
requirements for undergraduate study, the On its face, it may seem like there is nothing
University of Sydney Preparation Programs could inappropriate about Australian universities offering
be your ticket to study with us. supplemental preparatory programs to international
students, or in making money by doing so. After
The ANU offers a similar alternative pathway for
all, many of the same universities offer preparatory
international students that allows them to gain
programs for underprepared domestic students as
admission with a IELTS score of just 4.0 (“not able
well. But domestic programs are usually targeted at
to use complex language”) on individual bands.
students who have faced specific challenges — such
The ANU programs are also administered by Study
as poverty, homelessness, geographic isolation, or
Group, trading under the potentially confusing name
Aboriginal or Torres Strait Islander disadvantage. They
‘ANU College’, which is especially troubling because
are not typically viewed or marketed as alternative
ANU itself is organised into seven academic colleges.
pathways for ordinary students who simply do
The ANU website advertises that “No additional
not meet the entry requirements. By prominently
IELTS is required to progress to the ... ANU Access
marketing alternative pathways to underprepared
English course”, and the ANU Access English course
international students, Australian universities are, in
advertises that students can progress to study at ANU
effect, taking actions that reduce their financial risks
with an overall grade of just 60% in its program.86
by increasing their standards risks. A standards-
As a result, by paying a minimum of $10,650 plus
first approach to international student admissions
fees, and committing to a minimum of 20 weeks
would apply the same criteria to the graduates of
of study (the period and fees could be higher if the
paid preparatory programs as they do to all other
student is starting from a low base competency),
applicants.
an international student who meets all of the ANU’s
admissions requirements except a good command Further evidence that Australian universities apply
of English can gain admission to ANU without ever particularly low admissions standards to Chinese
certifying an adequate command of the language students comes from Chinese Gaokao examination
through external testing.87 scores. Both the University of Sydney in Australia and
the University of Birmingham in the UK admit Chinese
Adelaide’s English-language foundation programs are students on the basis of their domestic Chinese
administered by Kaplan Higher Education, trading National College Entrance Examination (Gaokao)
under the similarly confusing name ‘University of scores, both being the first in their respective
Adelaide College’. It advertises that, due to their countries to do so. But despite the fact that Sydney
“unique partnership with the University of Adelaide, ranks substantially higher than Birmingham in all
all our foundation studies graduates are guaranteed three major global ranking systems, Sydney’s Gaokao
entry to their choice of the many degrees on offer.”88 cutoffs are substantially lower than Birmingham’s.
Other elite Australian universities offer similar Birmingham generally requires a minimum Gaokao
programs. The UNSW Foundation Studies website result of 80% for direct admission, whereas Sydney
leaves international students in no doubt that:89 generally requires 70% for ordinary degrees, 75%
for advanced degrees, and 80% only for its flagship
International students who do not satisfy the Dalyell Scholars program.93 The fact that a Chinese
entry requirements for an undergraduate degree student who meets the minimum admission threshold
can undertake a Foundation Studies program. of a mid-ranked UK university would be considered a
You are guaranteed a place in your chosen ‘high-achieving student’ at the University of Sydney
undergraduate degree at UNSW on completion. should give Australian universities pause for thought.94
11Political factors, competitive factors, and
macroeconomic factors could adversely affect
Chinese enrolments at Australian universities
The most serious risks posed by over-reliance on Chinese students attending Australian universities are
international students at Australia’s universities either diffuse and difficult to measure (like changes in
— and especially at the seven focus universities broad immigration policy) or prohibitively expensive
of Melbourne, ANU, Sydney, UNSW, UTS, Adelaide, to insure against (like currency fluctuations). Nine
and Queensland — are not academic, however, potential risk factors that could adversely affect
but financial. Unlike academic risk, financial risk Chinese student numbers are detailed below, grouped
management is not a university core competency, under three headings: political factors, competitive
and the financial risks being run by these seven factors, and macroeconomic factors. By far the
universities (and probably several others) are most serious (from a financial perspective) are the
profound. Even Australia’s chief education oversight macroeconomic factors that could lead to a sudden
body, the Tertiary Education Quality and Standards and severe fall in Chinese enrolments at Australian
Agency (TEQSA), seems not to recognise these risks: universities.
TEQSA identifies only one Australian university as
• Political factors
at “high risk” for financial sustainability, and three
more as “moderate risk”, while making no mention – P
otential political confrontations between
of Chinese or international student concentration in Australia and China101
a 66-page “risk findings” report.95 Yet the financial
– C
hinese concerns about the safety of Chinese
risks being run by many Australian universities are
students in Australia102
more extreme than the risks being run by comparable
US universities that engage more publicly with the – Changes in Australian immigration policy103
questions raised by their reliance on Chinese student
• Competitive factors
enrolments. And the risks being run in Australia
are likely to prove very difficult to manage using – Chinese
concerns about the value of an
the ordinary tools at the disposal of university international degree104
administrations.
– T
he rising quality of Chinese domestic degrees105
In the United States, the University of Illinois enrols
– H
igher admissions standards, particularly English
more Chinese students than any other university.
language standards106
Despite the fact that its overall international exposure
would put it in the bottom half of Table 6 in the • Macroeconomic factors
Appendix, it has taken out a US$60 million insurance
– T
he slowing of China’s rate of economic growth107
policy against “a significant drop in tuition fee revenue
from Chinese students” at its schools of business and – T
he future convertibility of the Chinese Yuan108
engineering.96 A payout will be triggered in the event
– F
luctuations in the value of the Australian
of an 18.5% or greater fall in Chinese student revenue
Dollar109
that occurs as a result of an (undisclosed) “specific
set of identifiable events.”97 In fact, the university
recently reported a minor year-on-year decline of 120 5.1. Political factors
students (from 5845 Chinese students down to 5725), — high likelihood / moderate impact
which it attributed to stricter visa requirements.98
The widely reported murder of a Chinese student Political factors that could interrupt the flow of
at the university may also have played a role.99 The Chinese students to Australia include adverse
university mentions visa restrictions and pandemics as international relations, Chinese government warnings
hypothetical policy triggers, and if the policy is really about study in Australia, and shifts in Australian
immigration policies. The key precedent for the effect
so restrictive, that would explain its relatively low
of an international political confrontation is China’s
price tag of US$424,000 per year over three years.100
ban on package tours to South Korea, which was
Other much more likely risk factors would be harder
implemented in response to the latter’s deployment of
to insure — and these may be more threatening to
a US missile system in 2017.110 But Chinese student
Australian institutions.
numbers in South Korea continued to grow after the
Australia’s China-dependent universities face several package tour ban — though perhaps more slowly
risk factors — many of them unique to Australia — than they otherwise might have.111 Regarding the real
that are likely to prove uninsurable. Insurance policies or perceived safety of Chinese students in Australia,
are generally written so as to be triggered by well- Chinese consular warnings have in fact been in place
defined external events, but the factors most likely to since 2017, with no reported effect on universities’
cause a large and sudden decline in the numbers of recruitment efforts.112
12Immigration policy is another political factor that could Australia, they seem unlikely to be determinative.
affect the attractiveness of Australia as a destination In particular, it seems unlikely that Chinese students
for international students, especially for students from already in Australia would withdraw due to political
poorer countries like China. In 2010, Australia’s Labor factors. Political factors thus are not likely to cause
government modestly tightened visa policies in ways sudden or catastrophic declines in the number of
that made it more difficult for university students Chinese international students coming to Australia.
to progress toward permanent residency, with the Their effect will likely be more muted, difficult to
result that “the higher education sector was alarmed isolate, and thus difficult to measure and insure.
by the fall in international student numbers that
was experienced in the wake of ... these reforms”,
according to a 2016 Parliamentary research paper.113
5.2. Competitive factors
International student enrolment growth across the
— low likelihood / low impact
higher education sector as a whole stalled between Australian universities exude confidence about the
2010 and 2013, only picking up again after the quality of their degrees, but the perceived value of
Coalition loosened policy again in late 2013.114 The an Australian degree — whether compared to another
2011-2012 stall is clearly visible in the international international degree or a domestic Chinese degree —
enrolment numbers for the seven focus universities is necessarily subjective. Moreover, universities always
reported in Table 8 in the Appendix, though it may face the dilemma that efforts to raise the perceived
have been due more to currency than to immigration quality of their degrees by tightening admissions
issues, as argued below. standards have the obvious effect of reducing the
number of students who are eligible for admission. But
Immigration is a perennial issue in Australian politics,
in any case there is little evidence that educational
with the Liberal Party’s 2019 election platform
quality plays much of a role in Chinese students’
promising to freeze immigration levels for the next
decisions to study in Australia.
term of government.115 The link between immigration
policy and international student enrolment is not A systematic review of 68 academic journal articles on
unique to Australia, but international comparisons Chinese students’ motivations for studying in Australia
are difficult to make because they are clouded by listed reputation as only one of nine major decision
differences in immigration regimes. In the United factors.121 The study, conducted by three UK-based
Kingdom and the United States, there is no clear graduate students (Keyu Zhai, Xing Gao, and Geng
route from a student visa to permanent residency; so Wang), identified the imbalance “between high costs
the link between immigration policy and international of studying in Australia and the low quality of teaching
student demand is less direct than in Australia. At and learning” as “the main problem for Chinese
the other extreme, Canada has a formal educational students”, but concluded that “the dilemma does not
route toward work permission, permanent residence, affect the enthusiastic pursuit of Australian higher
and citizenship.116 Roughly 60% of all international education.”122 Reviewing both the English-language
students in Canada intend to apply for permanent and Chinese-language literature on the topic, the
residence.117 Considering that 18% of international authors concluded that the symbolic capital of
students in Canada hail from western Europe and the studying abroad was more important than the actual
United States, the proportion of the remainder who quality of the degree, and that the Chinese labour
intend to stay is presumably even higher.118 market benefits of an international degree continued
to drive students toward Australia.123
Australia sits between these two poles. The potential
for small policy shifts to have large effects in Australia Questions are regularly raised about the job prospects
is reflected in the fact that the number of permanent of internationally-educated students who return
migration places granted directly to international to China, but in reality the Chinese graduate job
students fell precipitously from 30,170 in 2012-2013 market has recently become more challenging for
to just 13,183 in 2017-2018.119 Yet the fact that the all graduates, overseas and domestic.124 Chinese
student route to long-term residency in Australia is graduates with international degrees continue to
informal, and traces through many different pathways, command a premium on the domestic job market.125
makes it difficult to quantify with any certainty. The The rising prestige of domestic Chinese degrees as top
number of permanent migrants who once were in Chinese universities charge up the global rankings is
Australia on student visas — and whose student visas unlikely to affect this differentiating factor. Admission
may have helped their migration cases — is almost to top Chinese universities is strictly limited and
certainly much larger than official statistics suggest.120 extremely competitive, so no matter how much more
A clear and sudden disruption in routes to permanent prestigious they become, they will always represent a
migration might dramatically reduce the flow of fee- tiny proportion of each year’s total student intake.
paying international students, including students from
It is possible, however, that Australian universities
China, but the likely effects of the kinds of modest
could drive away Chinese applicants by raising
changes Australian governments have made in the
admissions standards in an effort to address perceived
past are complex and unpredictable.
laxness. Recent press coverage in Australia has
Although political factors may affect the calculations highlighted low admissions standards — particularly
of some Chinese students considering studying in English language standards — for international
13You can also read