#REALCOLLEGE 2021: BASIC NEEDS INSECURITY DURING THE ONGOING PANDEMIC - March 31, 2021 - The Hope Center | For College ...
←
→
Page content transcription
If your browser does not render page correctly, please read the page content below
#REALCOLLEGE 2021:
BASIC NEEDS INSECURITY DURING
   THE ONGOING PANDEMIC

           March 31, 2021
TABLE OF CONTENTS

     PAGE 3    Executive Summary
     PAGE 4    Introduction
               What is the #RealCollege Survey?                           Click the headers to
               Defining Basic Needs Insecurity                            navigate the report
               The Fall 2020 Data
               Who is Missing from the Data?
               A Note on Comparing Rates of Basic Needs Security Across Time
               Shifts in #RealCollege Respondents Over Time
     PAGE 11   New Economics of College
               Health
               Enrollment
               Employment
               Families
               Institution Budgets
     PAGE 25   Basic Needs Insecurity During the Pandemic
2|             Basic Needs Insecurity
               Food Insecurity
               Housing Insecurity
               Homelessness
               Disparities in Basic Needs Insecurity
               Basic Needs by Institution Type

     PAGE 38   Utilization of Supports
               Why Do Supports For Basic Needs Insecurity Matter?
               Emergency Aid
               Public Benefits
               Other Campus Supports
               Disparities in Use of Support
               Use of Support Across Institutions

     PAGE 54   Conclusion and Recommendations
               Recommendations
               Upcoming #RealCollege Survey Reports
               Acknowledgements
               Funder Disclosure
               About The Hope Center
               Suggested Citation

     PAGE 62   List of Participating Colleges

     PAGE 65   Notes and References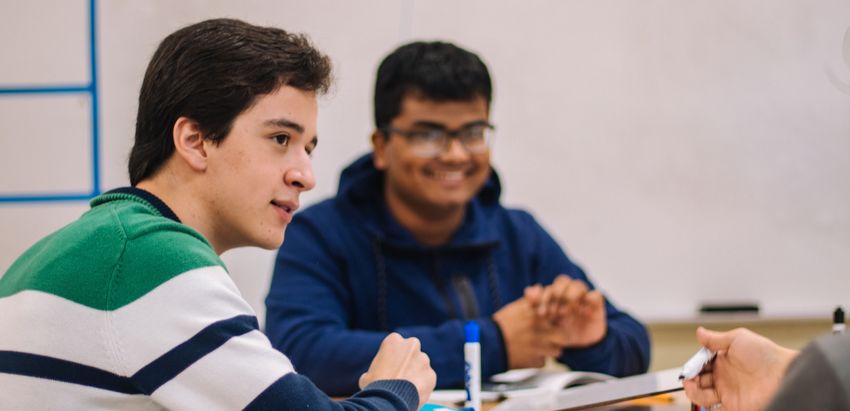
EXECUTIVE SUMMARY

     Entering the fall 2020 term, higher education was reeling from the coronavirus pandemic.
     Enrollment was down—particularly among students most at risk of basic needs insecurity; fewer
     students had completed the Free Application for Federal Student Aid (FAFSA); and college
     retention rates had dropped.1 Students and faculty were stressed and anxious.2 By the end of the
     term, more than 267,000 Americans died.3 At the same time, the federal government pumped
     an unprecedented $6 billion into student emergency aid via the Coronavirus Aid, Relief, and
     Economic Security (CARES) Act.4

     This report examines the pandemic’s impact on #RealCollege students who were able to continue
     their education in this challenging environment. Using our sixth annual #RealCollege Survey,
     fielded in fall 2020, we assessed students’ basic needs security and their well-being, as indicated
     by employment status, academic engagement, and mental health.

     In total, over 195,000 students from 130 two-year colleges and 72 four-year colleges and
     universities responded to the 2020 #RealCollege Survey. Students told us that:

3|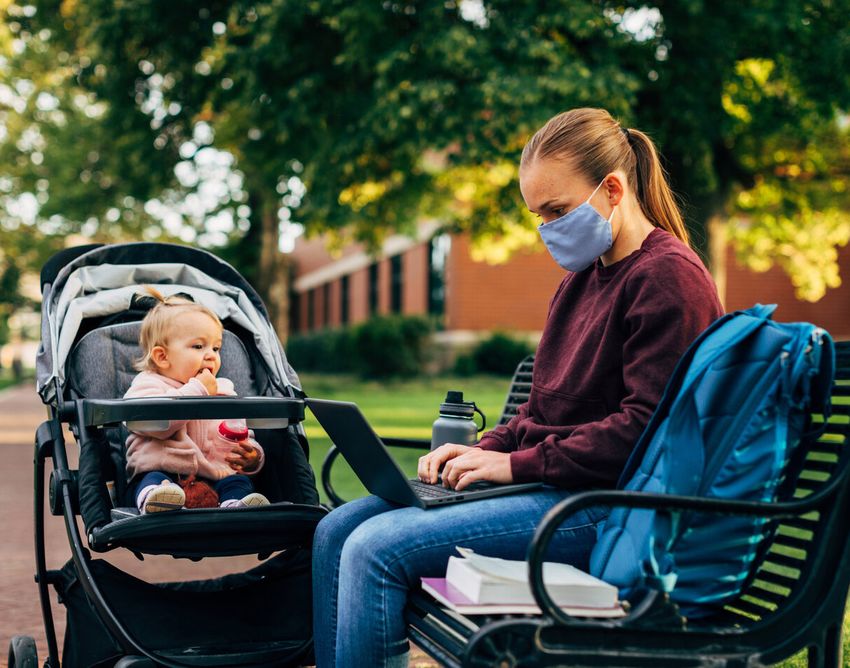
INTRODUCTION

     In fall 2020, more than six months into the coronavirus pandemic, colleges struggled to deal with
     the pandemic’s many impacts. Campuses tried—and often failed—to stay open, and budgets were
     cut at both public and private institutions.5 Widespread inequality deepened as well, with Black,
     Native American, and male students forgoing their educations at disproportionately higher rates.6
     Due to school closures, parenting students played dual roles as caretaker and student.7 And a
     pandemic-induced recession led to many students losing their jobs.8

     Students were challenged in new ways to make ends meet. While our team at The Hope Center
     for College, Community, and Justice has repeatedly documented that as many as half of all
     students experience basic needs insecurity, the onset of the pandemic shifted the realities of
     higher education: in many ways, the new economics of college have grown even more challenging
     over the past year.9 Rising college prices, stagnant wages, growing inequality, and—as of April
     2020–a global economic downturn, make attaining a college degree and achieving upward
     economic mobility especially tough for today’s #RealCollege students. Our research conducted
     early in the pandemic backs up this assertion, showing that nearly three in five students lacked
     adequate access to food or housing.10

4|

                                      As the crisis continued into the new school year, the situation
                                      became even more complex. Institutions of higher education
                                      experienced two major shifts:

                                      1. Emergency aid increased: Colleges and universities
                                         distributed more than $6 billion in federally funded
                                         emergency aid for the first time, thanks to the CARES Act.
                                         This was an unprecedented distribution of emergency aid at
                                         scale.11

                                      2. Enrollment declined: First-time college enrollment rates
                                         among both recent high school graduates and older
                                         students declined substantially, fewer students completed
                                         the FAFSA, and retention rates dropped.12

                                      Together, these forces could have stabilized rates of basic
                                      needs insecurity among students enrolled in college, even
                                      while national rates of basic needs insecurity continued to
                                      grow. This report considers both possibilities. Consistent with
                                      prior #RealCollege Survey reports, three specific measures of
                                      basic needs insecurity—food insecurity, housing insecurity, and
                                      homelessness—are examined.
Given that the survey was fielded at an extraordinary time,
     we explore the pandemic’s impact on students’ health and
     employment, as well as the array of student supports that
     were rapidly scaled in response to the pandemic. College and
     university budgets also are discussed. Finally, we offer specific
     recommendations for policymakers, practitioners, and college
     leaders. While the rollout of COVID-19 vaccines offers hope for
     the fall 2021 term, the pandemic’s effects will be felt for years,
     and leaders must prepare now for its ongoing challenges and
     impacts.

     WHAT IS THE #REALCOLLEGE SURVEY?

     Established in 2015, the #RealCollege Survey is the nation’s
     largest annual assessment of students’ basic needs. Since
     2015, the survey has been fielded at more than 530 colleges
     and universities and taken by more than 550,000 students.
     While the National Postsecondary Student Aid Survey recently
     added questions regarding food and housing insecurity, data
     will not be available until 2022, and no government agency
     currently reports on the security of students’ basic needs.13 The
5|   #RealCollege Survey was created to fill this vacuum.
                                                                          SINCE 2015, THE SURVEY
     In 2020, the need for data was especially dire; college leaders       HAS BEEN FIELDED AT
     faced an unprecedented shift to online learning, declining
     enrollment, and significant budget cuts. In fact, an institution-              more than
     based survey we administered in spring 2020 indicated that                       530
     nearly all colleges were looking for additional help addressing               colleges and
     students’ food and housing needs.14                                           universities

     The primary goal of the #RealCollege Survey is to equip                  AND TAKEN BY
     participating colleges with information they can use to
     support their students. Each participating college receives an                 more than
     institution-specific report, and many use those results to secure
     philanthropic dollars, advocate for students, and direct scarce
                                                                                   550,000
                                                                                     students
     resources more equitably and efficiently.
DEFINING BASIC NEEDS INSECURITY

     Students’ basic needs include access to nutritious and sufficient food; safe, secure, and adequate
     housing—to sleep, to study, to cook, and to shower; healthcare to promote sustained mental and
     physical well-being; affordable technology and transportation; resources for personal hygiene;
     and childcare and related needs.15

     Basic needs security means that there is an ecosystem in place to ensure that students’ basic
     needs are met.

     Basic needs insecurity (BNI) is a structural characteristic affecting students, not an individual
     characteristic. It means that there is not an ecosystem in place to ensure that students’ basic
     needs are met.

     The 2020 #RealCollege Survey measured three primary types of basic needs insecurity:

                       Food insecurity is the limited or uncertain availability of nutritionally adequate
                       and safe food, or the ability to acquire such food in a socially acceptable
                       manner.16 The most extreme form is often accompanied by physiological
                       sensations of hunger. The 2020 #RealCollege Survey assessed food security
                       using the U.S. Department of Agriculture’s (USDA) 18-item set of questions.17
6|
                       Housing insecurity encompasses a broad set of challenges that prevent
                       someone from having a safe, affordable, and consistent place to live.18 The 2020
                       #RealCollege Survey measured housing insecurity using a nine-item set of
                       questions developed by our team at The Hope Center. It looks at factors such as
                       the ability to pay rent and the need to move frequently.

                       Homelessness means that a person does not have a fixed, regular, and adequate
                       place to live. In alignment with the McKinney-Vento Homeless Assistance
                       Act, students are considered homeless if they identified as experiencing
                       homelessness or signs of homelessness (for instance, living in a shelter,
                       temporarily with a relative, or in a space not meant for human habitation).19
                       We use this inclusive definition of homelessness because students who are
                       experiencing homelessness and signs of homelessness face comparable
                       challenges.20

     Later in the report, we present rates for students experiencing “any BNI,” meaning the
     student was experiencing at least one of the following: food insecurity, housing insecurity, or
     homelessness.

     Additionally, while our measures of basic needs insecurity assess students’ needs during distinct
     periods—the prior month for food insecurity and the prior year for housing insecurity and
     homelessness—basic needs insecurity is fluid, and students’ experiences with basic needs may
     change over time.
THE FALL 2020 DATA

      In 2020, 202 colleges and universities in 42 states fielded the #RealCollege Survey (Figure 1).

     130 COMMUNITY COLLEGES & TECHNICAL COLLEGES                         AMONG THESE:
                                                                       14 HISTORICALLY BLACK COLLEGES &
      51 PUBLIC FOUR-YEAR COLLEGES & UNIVERSITIES
                                                                          UNIVERSITIES
      21 PRIVATE FOUR-YEAR COLLEGES & UNIVERSITIES                     5 TRIBAL COLLEGES & UNIVERSITIES

      Five postsecondary systems—Colorado Community College System, the University of Hawai‘i
      System, Virginia Community College System, Los Angeles Community College District, and San
      Diego Community College District—were also among the 202 participating colleges.

      FIGURE 1 | GEOGRAPHIC DISTRIBUTION OF 2020 #REALCOLLEGE SURVEY PARTICIPATION,
      BY SECTOR

7|

      SOURCE | 2020 #RealCollege Survey
      NOTES | See list of participating institutions on pages 62-64.

      Participating colleges emailed the survey link to all enrolled students between September and
      November 2020. While most colleges fielded the survey during the first four weeks of their fall
      term, disrupted fall schedules and campus closures—due to COVID-19 outbreaks, wildfires, and
      hurricanes—caused some institutions to send the survey to students later in the term.

      In total, the survey was distributed to more than 1.84 million enrolled students and taken by
      approximately 195,000 of them, yielding an estimated response rate of 11%—the highest for any
      #RealCollege Survey and comparable to response rates in similar surveys.21
The large number of overall responses also allows for extensive examination across characteristics
     such as college type, gender identity, and racial and ethnic background. Similarly, when asked
     at the end of the survey to share what college is like during a pandemic, more than 100,000
     students responded, capturing a wide range of experiences. Quotes from these responses are
     highlighted throughout the report.

     “[W]e are all struggling one way or another and we need to stop
     being ignored.
                                           – a student in Pennsylvania

                                       We are trying […] but life keeps knocking us down.
                                       Thank you to those who support us and understand us.”
                                                                                      – a student in Texas

8|
     WHO IS MISSING FROM THE DATA?

     The #RealCollege Survey is completed by current college students who choose to respond and
     attend institutions that opted-in to the survey. We are unable to report on students who never
     enrolled in college, stopped out of college, or attend colleges that did not field the survey, or who
     simply did not respond to the survey, despite being invited to do so. As a result, the estimates
     presented in this report may overstate or understate the true rates of basic needs insecurity in
     higher education.22

     In 2020, we are particularly concerned that our estimates are too low. Compared to prior years,
     students at the most risk of basic needs insecurity were much less likely to enroll in college
     in the fall. Overall college enrollment dropped just over four percent from fall 2019 to fall
     2020, meaning colleges lost approximately 400,000 new or returning students (Figure 2).23
     Among first-year students, enrollment was down 13%. Declines in enrollment were particularly
     pronounced for those at greatest risk of basic needs insecurity: students at two-year institutions,
     as well as Black and Native American students.24

     At the same time, rates of basic needs insecurity increased among the general population, and
     intention to enroll in college dropped. In December 2020, the U.S. Census Bureau reported that
     38% of adults were experiencing difficulty covering usual expenses and 14% did not have enough
     to eat.25 Among high school seniors, FAFSA completion rates were down 11.4% in January 2021
     compared to the previous year.26 Graduates from high schools with significant numbers of Black,
     Hispanic/Latinx, and economically disadvantaged students were far less likely to immediately
     enroll in college in 2020.27
FIGURE 2 | CHANGES IN UNDERGRADUATE   Nevertheless, there is ample evidence that
     ENROLLMENT IN FALL 2020, BY SECTOR,   the #RealCollege Survey is reliable and valid.
     GENDER, AND RACE/ETHNICITY            Several other major surveys of basic needs
                                           yield similar rates via different methods, and
                                           across six years and hundreds of colleges,
                                           #RealCollege Survey results remain fairly
                                           consistent.28

                                           For more information on fielding
                                           methodologies, and data representativeness,
                                           refer to the web appendices.

                                           A NOTE ON COMPARING RATES OF
                                           BASIC NEEDS SECURITY ACROSS
                                           TIME

                                           Each year, we partner with different colleges
                                           and universities to field the #RealCollege
                                           Survey, and each year different students
9|                                         respond. This means that we cannot definitively
                                           identify trends in basic needs security over
                                           time. However, given the importance of
                                           understanding the impacts of the pandemic,
                                           some comparisons to 2019 #RealCollege
                                           Survey data are included in this report. We also
                                           draw comparisons to the #RealCollege During
                                           the Pandemic Survey, fielded in the first few
                                           months of the pandemic.29 Additionally, in
                                           a few instances, the fall 2020 survey asked
                                           students who were enrolled in spring 2020 to
                                           reflect on experiences in the prior term; these
                                           questions illuminate the ongoing, accumulated
                                           impacts of the pandemic.

                                           SOURCE | National Student Clearinghouse
                                           NOTES | Information to the left are a part of the
                                           COVID-19: Stay Informed series, published by National
                                           Student Clearinghouse Research Center.
SHIFTS IN #REALCOLLEGE RESPONDENTS OVER TIME

       Shifts in college enrollment in fall 2020 (Figure 2) have implications for how we interpret
       #RealCollege Survey results over time.30 To understand if national enrollment trends are reflected
       in our data, we analyzed changes in our survey sample from 2019 to 2020, looking at one specific,
       unnamed two-year college—listed as “College X” here—and all two-year colleges that participated
       in both surveys.

       In our survey data, enrollment shifts are most apparent by enrollment status and age group (Table
       1). Among survey respondents at College X, the number of full-time students declined 19% from
       2019 to 2020, while the number of part-time students increased 82%. Looking at College X’s
       overall survey sample, full-time student representation is down 21 percentage points from 2019,
       and part-time student representation is up 18 percentage points. Across all community colleges,
       full-time student representation decreased 14 percentage points from 2019, while part-time
       student representation rose 11 percentage points. The representation shifts shown here mirror
       enrollment trends nationally and suggest that comparisons to prior years of survey data should
       consider changes in student composition.

       TABLE 1 | CHANGES IN #REALCOLLEGE SURVEY SAMPLE FROM 2019 TO 2020 FOR
       COLLEGE X AND COMMUNITY COLLEGES

10 |

       SOURCE | 2019 and 2020 #RealCollege surveys
       NOTES | Change in proportion represents the percentage point difference between proportion of each student
       subgroup from 2019 to 2020. “Community Colleges” denotes the 41 colleges that participated in both the 2019 and
       2020 #RealCollege surveys. Not all available categories are shown. Students can identify as more than one race and
       ethnicity, and/or gender.
NEW ECONOMICS OF COLLEGE
DURING THE PANDEMIC
Students and families have struggled with the new economics of college for the past 20 years.31
Stagnant incomes, declining state support for higher education, college price tags that strain
the finances of all but the top earners, rising wealth and income inequality, and a threadbare
social safety net have all made a college degree less attainable.32 In 2020, the pandemic-induced
recession exacerbated these issues, pushing Americans who were already on the edge firmly off
the cliff.33
This section explores how the pandemic impacted students and colleges in five areas: health,
enrollment, employment, families, and institution budgets.
HEALTH
This section includes references to suicide. Students experiencing
more than minimal symptoms of depression were referred to the
National Suicide Prevention Lifeline.
As COVID-19 cases in the United States fluctuated throughout
11 | 2020, students’ health suffered and their anxiety levels rose.
The Hope Center’s #RealCollege Survey During the Pandemic,
conducted in the spring, found that over half of respondents
exhibited at least moderate anxiety.34 Additional studies
indicated that students were struggling to concentrate,
worried about their academic performance, concerned about
their mental and physical health, and afraid for the health of
their friends and families.35 Most worryingly, suicidal ideation
increased, particularly among younger adults. Data from the
Centers for Disease Control and Prevention (CDC) from June
2020 showed that more than 25% of 18- to 24-year-olds had
considered suicide in the prior 30 days.36
“I attempted suicide in May. I am filling out this survey I’m considering killing
because I believe other students experiencing the same myself so I don’t have to
thing may not have the motivation or may be too anxious suffer through struggling
to fill it out. to be part of such an
– a student in Washington unrealistic workforce.”
– a student in ColoradoStudents’ mental health continued to suffer through fall 2020. Across college types, more than one-
third of students reported experiencing moderate to severe anxiety (Figure 3). Depression levels
were similar, with just over one-third of students experiencing moderate to severe depression.
FIGURE 3 | PERSONAL EXPERIENCES WITH ANXIETY AND DEPRESSION, BY SECTOR
12 | SOURCE | 2020 #RealCollege Survey
NOTES | Students “experienced anxiety” if they experienced moderate to severe levels of anxiety in the last two
weeks; while students “experienced depression” if they experienced moderate, moderately severe, or severe levels of
depression in the last two weeks. For more details on measures of anxiety and depression used in this report refer to
the web appendices.
Students’ anxiety and depression also varied with respect to race and ethnicity. Indigenous
students were nine percentage points more likely than their White peers to report experiencing
depression, with 45% of Indigenous students experiencing moderate to severe depression (not
shown; see web appendices). Moreover, rates of anxiety were slightly higher in 2020 than in 2019,
when 32% of students reported experiencing moderate to severe anxiety. The Hope Center will
explore these issues further in a mental health report.
“[College right now] is awful, you can’t focus because I often am too stressed
you’re constantly depressed and anxious that you about everything
aren’t doing enough, even though you’re writing (finances, bills,
papers every week while also working five days a week unemployment, food,
trying to make ends meet, living through a pandemic, rent, family, etc.) to
and traumatized by police brutality. properly focus on
anything and I can’t
– a student in Arizona
even relax or sleep.”
– a student in NevadaPersonal experiences with COVID-19, the disease caused by the novel coronavirus, were also
common. Overall, seven percent of student respondents said they had contracted COVID-19,
and about two in five had a close family member or friend who was sick (Figure 4). At two-year
colleges, 15% reported knowing someone who died of COVID-19; at four-year colleges, the
number was 10%. Given the surge of cases in late 2020 and early 2021, these numbers are likely
to rise.37 Indeed, a nationally representative survey indicated that by November 2020, more than
half of all Americans knew someone who had been hospitalized or had died from COVID-19, up
from 39% in August.38
FIGURE 4 | PERSONAL EXPERIENCES WITH COVID-19, BY SECTOR
13 |
SOURCE | 2020 #RealCollege Survey
NOTES | Some students may have more than one personal experience with COVID-19.
Mirroring national trends, students of color have been disproportionately impacted by the
pandemic.39 Black, Indigenous, and Latinx students were twice as likely as White students to know
someone who had died of COVID-19. We will further explore students’ experiences by race and
ethnicity in a report scheduled for fall 2021.ENROLLMENT
During the Great Recession in 2008, enrollment in higher education increased.40 But throughout
the pandemic, enrollment has fallen (see Figure 2 above).41 Students are choosing—or being
forced—to postpone college, and workers are not heading to college despite increases in
unemployment.
The causes of declining enrollment in 2020 are complex, with the move to online classes, the
desire for safety during a rampant health crisis, the high price of college during an economic
downturn, and the need to support family all playing roles.42 Among these factors, the shift to
online education had an outsized effect; data suggest that more than half of students planning to
attend a four-year college and over a third of students planning to attend a community college
decided not to attend in 2020 because the mode of instruction changed.43 For those students
who did return to campuses, there was risk involved. Research published by the CDC in January
2021 found that counties with in-person instruction experienced a 56% increase in the incidence
of COVID-19 cases in the 21-day periods before and after classes started.44
Among students who participated in the 2020 #RealCollege Survey, about three in four said they
took online-only classes in fall 2020 (not shown; see web appendices). Online-only instruction
was especially common at two-year colleges; 84% of students at two-year colleges moved to
online-only classes, while 66% of students at four-year colleges reported taking their courses
14 | entirely online (Figure 5). By comparison, national data indicates that in fall 2018 only 14% of
undergraduate students took their classes entirely online.45
FIGURE 5 | ONLINE VERSUS IN-PERSON CLASSES, BY SECTOR
Many students [at my
community college]
do not have access to
updated technology
to be able to excel
in school. I have
had a lot of internet
connectivity issues
and have been told
that is not an excuse
to not complete
work.”
SOURCE | 2020 #RealCollege Survey
NOTES | Rates above do not include students who did not know how they – a student in
would be taking classes in the fall as institutions navigated the realities of on- Colorado
campus study during second wave of the pandemic. Cumulative percentages
may not add up to 100 due to rounding.Campus closures were less common at four-year colleges. Sixty-five percent of four-year students
reported that their college was open for in-person classes in fall 2020 (Figure 6). Conversely,
among surveyed students at two-year colleges, 28% reported that their campus was open for in-
person classes during the fall term. As a result, campus supports like cafeterias and libraries may
have been more accessible to students at four-year schools.
FIGURE 6 | COLLEGE CLOSED FOR IN-PERSON CLASSES, BY SECTOR
15 |
SOURCE | 2020 #RealCollege Survey
NOTES | Cumulative percentages may not add up to 100 due to rounding.The pandemic also appeared to impact students’ course loads. Among two-year students, 44%
were enrolled full-time—defined as taking 12 or more credits—in fall 2020, a 17-percentage point
decrease from fall 2019 (Figure 7).46 Similarly, while 90% of four-year students surveyed in 2019
were enrolled full-time, only 75% of four-year students were enrolled full-time in the fall 2020
term.47 While these are not direct comparisons—the #RealCollege Survey samples in 2019 and
2020 differed in multiple ways—they suggest students enrolled in fewer courses in fall 2020 than
in fall 2019. By comparison, nationally representative data indicate full-time enrollment at four-
year colleges dropped just over two percent in fall 2020, and part-time enrollment remained
fairly stagnant.48 At two-year colleges, both full-time and part-time enrollment declined by about
nine percent in fall 2020.49
FIGURE 7 | FALL ENROLLMENT STATUS AMONG STUDENTS TAKING CREDIT-BEARING
COURSES, BY SECTOR AND YEAR
16 |
SOURCE | 2019 & 2020
#RealCollege surveys
NOTES | Part-time students took
fewer than 12 credits in the fall,
while full-time students took 12 or
more credits in the fall. Cumulative
percentages may not add up to 100
due to rounding.Students enrolled in spring 2020 reported numerous
challenges when asked to reflect on their experiences during
the pandemic. More than four in five indicated their campus
closed in spring 2020, and the shift to online classes was nearly
ubiquitous (Figure 8). Nearly three-quarters reported having
trouble concentrating on classes, and two in five reported
having to care for family members while attending class or
experiencing internet or computer-access issues. Caring for
family members while in class was especially pronounced
among students at two-year colleges, where respondents
were 16 percentage points more likely to report dealing with
this challenge than their four-year peers. Additionally, it
appears these challenges became more common by fall 2020.
While 63% of four-year students reported having trouble
concentrating on school in The Hope Center’s spring survey,
the rate was 80% in the fall.50
FIGURE 8 | OTHER CHALLENGES FACED SINCE SPRING
2020 DUE TO THE PANDEMIC, BY SECTOR
17 |
SOURCE | 2020 #RealCollege Survey
NOTES | Results to the left are limited
to students who were also enrolled
in college in spring 2020. Some
students may have experienced more
than one of the challenges listed.EMPLOYMENT
The pandemic shuttered businesses and led to widespread furloughs and layoffs.51 While
unemployment dipped slightly, to just under seven percent, in November 2020 (when colleges
finished fielding the #RealCollege Survey), it was still more than three percentage points above
pre-pandemic levels, and 10.7 million people were unemployed.52 Additionally, many simply
stopped looking for work, with 2.2 million individuals giving up on finding a job—despite wanting
one—from February to December 2020.53 Workers of color were especially impacted, with Black
workers over four percentage points more likely than White workers to be unemployed as of
November.54 Similarly, from February to June 2020, unemployment jumped seven percentage
points for White workers, but more than 10 percentage points for Latinx workers.55
There were also disparities in who lost work by gender, with women in the United States losing
one million more jobs than men from February to December 2020.56 Across gender and race,
women of color were disproportionately affected. Black, Latinx, and Asian women accounted for
all of the jobs lost by women in December, and Black and Latinx women were approximately three
percentage points more likely than White women to be unemployed.57 More than 150,000 Black
women left the labor force at the end of 2020.58
Students were also affected. About one in three respondents to the spring 2020 #RealCollege
During the Pandemic Survey indicated they had lost a job because of the pandemic.59 In an April
18 | 2020 survey conducted at Arizona State University, 40% of students reported losing a job,
internship, or job offer as a result of the pandemic.60 Additionally, while “young workers” does not
correlate directly to college students—many enroll in college later in life and not all young people
attend college—as of September 2020, workers ages 18–26 were roughly six percentage points
more likely than those 27 and older to have experienced a layoff.61
While the causes of job losses among college students are complex, contributing factors
include campus closures, lost work-study opportunities, and shuttered or scaled-back leisure
and hospitality businesses—where younger, economically disadvantaged students are more
likely to work.62 These factors could keep students underemployed for years to come. Industries
like the leisure and hospitality service sector may not recover any time soon, and once jobs
return, students will be competing against large numbers of displaced workers, many with more
experience and less restricted schedules.63
I was doing pretty well just a year ago. Now [...] I spend
every day looking for work, worrying about food and
rent, [and] how to pay even a little to keep attending
school—because I’m sunk if I don’t, and getting calls
from collection agencies, even a lawsuit from a credit
card company. It’s hard to focus on school.”
– a student in Hawai‘iMore than one-third of students who were employed before the pandemic reported losing a job
since the pandemic’s onset (Figure 9). Losing full-time work was less common than losing-part
time work. Additionally, approximately one in four students reported working fewer hours or
making less money at both part- and full-time jobs.
FIGURE 9 | JOB LOSS OR REDUCTION IN PAY OR HOURS, BY PRE-PANDEMIC JOB STATUS
19 |
SOURCE | 2020 #RealCollege Survey
NOTES | Results are among students who were also enrolled in college in spring 2020 and had at least one job before
the pandemic. Those with a full-time job worked 35 or more hours a week, whereas those with a part-time job worked
less than 35 hours a week.
I was lucky enough to
keep my job, only to
have reduced work
hours and question
whether food scarcity
would become my
problem. As a result,
I stopped attending
school for a part
of spring 2020 in
order to pay my rent.
School is a priority
for me, so this hurt
me deeply.”
– a student in
New YorkMirroring patterns of job loss in the broader U.S. population,
students of color experienced job losses and reductions in pay
and hours at higher rates than their White peers (Figure 10).64
Pacific Islander, Middle Eastern, and Black students were nine As a tipped worker,
to 10 percentage points more likely than White students to lose I make significantly
part-time work, or to have their hours or pay cut at a part-time less money now, but
position. Similarly, approximately two-thirds of Middle Eastern my rent and bills are
and Indigenous students lost work, pay, or hours at a full-time the same, so I need to
position, compared to 52% of White students. work more.”
– a student in
FIGURE 10 | JOB LOSS OR REDUCTION IN PAY OR HOURS, Colorado
BY RACE AND PRE-PANDEMIC JOB STATUS
20 |
SOURCE | 2020 #RealCollege Survey
NOTES | Results above are limited to students who were enrolled in college
in spring 2020 and had at least one job before the pandemic. Those with a
full-time job worked 35 or more hours a week, whereas those with a part-
time job worked less than 35 hours a week. Respondents could self-identify
with multiple racial or ethnic classifications.FAMILIES FIGURE 11 | CHALLENGES FACED BY
PARENTING STUDENTS DUE TO
As the pandemic dragged on, schools and THE PANDEMIC
daycare centers closed. As a result, many
parents—especially mothers—spent more time
on childcare.65 In summer 2020, women ages
25–44 were nearly three times more likely
than men to be unemployed due to childcare
demands.66 At the same time, parents—
although again, particularly mothers—faced
declines in employment.67 For parenting
students, the stress of “doing it all” may have
proved a barrier to enrolling or re-enrolling
in college in fall 2020, potentially biasing the
results presented here.
Among the more than 32,000 parenting
students who participated in the 2020
#RealCollege Survey, many are struggling
and have been since the pandemic began.
When asked about their experiences during
21 |
the spring 2020 term, approximately three-
quarters of parenting students reported
helping their children with schooling while
attending classes themselves (Figure 11).
Similarly, more than a quarter missed six or
more days of work or class due to childcare
arrangements. During the fall 2020 term,
more than six months into the pandemic,
approximately four in five parenting students’
children were home from school at least part-
time.
“I have been having an extremely
hard time doing my classes at home.
I have to help my kids with their
school and take care of everything
in the home. [There] are too many
distractions, internet does not always
work. SOURCE | 2020 #RealCollege Survey
NOTES | Results to questions about spring 2020 term
– a student in California
are limited to students who were enrolled in that term.
A parenting student is a parent, primary caregiver, or
guardian (legal or informal) of any children in or outside
their household.“Students who have
children are struggling
to focus on school.
Childcare is extremely
unaffordable. If we pay
for childcare, we are
struggling to pay for
other essential things
like electric bills, food,
and rent.
– a student in Maryland
In the week preceding the survey, most parenting students spent 40 or more hours caring for
their children, leaving little time for college coursework, or forcing them to engage in coursework
while also tending to their children (Figure 12).
FIGURE 12 | CHILDCARE CHALLENGES PARENTING STUDENTS FACED DUE TO THE
PANDEMIC
22 |
SOURCE | 2020 #RealCollege Survey
NOTES | A parenting student is a parent, primary caregiver, or guardian (legal or informal) of any children in or
outside their household.
On other measures of well-being, parenting students fared somewhat better than the larger
student population. For instance, the rate of anxiety among parenting students was nine
percentage points lower than the rate among non-parenting students, and the rate of depression
was 12 percentage points lower (not shown; see web appendices). However, parenting students
took fewer courses, with only 33% of parenting students at two-year colleges enrolled full-time.INSTITUTION BUDGETS
Prior to the pandemic, many colleges were strapped for funds. As of 2019, per-student funding
for higher education was still nearly nine percentage points below pre-Great Recession levels,
despite growing every year for the past seven years.68 Between 2008 and 2018, per-student state
funding for higher education declined in all but nine states.69 With the pandemic, state budgets
suffered further loses.70 As of June 2020, public colleges were already seeing their state funding
cut three to five percent, and early estimates indicated that higher education would need $46
billion to offset future funding cuts.71 By February 2021, an analysis indicated that U.S. colleges
and universities could lose a combined $183 billion as a result of the pandemic.72
Declines in revenue from tuition, housing, food services, and other profit-making services
exacerbated budget shortfalls.73 In a survey of the 199 member institutions of the Association
of Public and Land-grant Universities, respondents reported losing $20.8 billion in revenue
across the spring, summer, and fall 2020 terms.74 Perhaps most worrying was the 13% drop in
first-year enrollment observed in fall 2020, which could influence institution budgets for as
many as six years as new students make their way to graduation.75 The situation is especially grim
at community colleges, which not only are facing steeper declines in enrollment, but are also
inequitably funded, taking in $78 billion less per year—or $8,800 less per student—than four-year
colleges.76
23 | Because of the pandemic, colleges are also stretching existing resources. Costs have increased
due to expanded online learning and coronavirus-mitigation efforts.77 Staff have also had to adjust
support services, figuring out how to support students remotely, while many were dependent
on campus resources like computer labs.78 Furloughs and layoffs also mean colleges have fewer
staff, some of whom are experiencing basic needs insecurity themselves.79 Even after campuses
re-open, colleges’ costs may remain higher than normal. Coronavirus-mitigation efforts will likely
need to continue for some time.In the face of these budgetary challenges, the federal government provided institutions and
students with some relief. Signed into law in March 2020, the CARES Act allocated a combined
$14 billion to emergency student aid and the institutional costs associated with the pandemic.80
Congress provided additional funding for higher education via the Consolidated Appropriations
Act, passed in December 2020, and the American Rescue Plan Act, signed into law in March
2021. These supports are not reflected in the #RealCollege Survey as only CARES Act funds were
available to students and institutions in fall 2020. As of March 2021, federal relief for higher
education totaled approximately $77 billion.81
The funds rightly prioritized higher education as a pillar of the American economy and its
future workforce. In an unprecedented move, Congress also mandated that colleges provide
a significant portion of the funds to students in the form of emergency aid, underscoring the
importance of giving students cash and trusting them to address their individual expenses.82
However, because they were responsible for administering the funds, colleges were also forced
to rapidly scale existing emergency aid programs.83 In a tacit acknowledgment of the pandemic’s
disparate impacts on communities of color, the three bills also dedicated a combined $6 billion to
Historically Black Colleges and Universities (HBCUs), Tribal College and Universities (TCUs), and
other Minority Serving Institutions (MSIs).84
All told, the pandemic’s impact on higher education is considerable. In fall 2020, many students
experienced depression or anxiety, were personally impacted by COVID-19, or lost work.
24 | Parenting students often missed class or work to tend to their children. At the same time,
significant numbers of students choose to forgo college altogether, eroding already suffering
college budgets. Moreover, disparities in experiences according to students’ race and ethnicity,
gender, college sector, and parenting status were observed. When evaluating the security of
students’ basic needs, all these challenges must be recognized.
“College is expensive.
We students need
more money to
survive. We are your
future, and you are
failing us as a country
by not passing a bill
for COVID emergency
aid. We are starving.
Losing our housing.
Help us.
— a student in
WashingtonBASIC NEEDS INSECURITY DURING THE PANDEMIC
Going into the fall 2020 term, it was unclear how students’ basic needs would be affected by
the pandemic. While The Hope Center has consistently found that more than half of students
experience some form of basic needs insecurity, the fall 2020 term was unique.85 Enrollment
among marginalized groups declined, and Congress allocated $6 billion for emergency aid. Many
colleges—particularly two-year colleges—increased basic needs insecurity supports prior to the
pandemic, perhaps leaving them better prepared to address students’ needs once the crisis arose.
At the same time, students faced a myriad of challenges, including rising unemployment and
campus closures, that could increase their basic needs insecurity.
This section presents rates of basic needs insecurity among 2020 #RealCollege Survey
respondents. While basic needs insecurity goes beyond food and housing insecurity—
transportation, healthcare, and childcare, among others concerns, are also vital to students’
success—this section defines “experiencing any basic needs insecurity (BNI)” as experiencing food
insecurity, housing insecurity, or homelessness.
25 |BASIC NEEDS INSECURITY
Among the more than 195,000 students who participated in the 2020 #RealCollege Survey, 58%
were experiencing basic needs insecurity (Figure 13). Rates of insecurity were higher at two-
year colleges, where 61% of students experienced some form of basic needs insecurity. At both
two- and four-year colleges, students were most likely to experience housing insecurity. When
compared to prior #RealCollege surveys, the percentage of students experiencing some form of
basic needs insecurity was not meaningfully higher in 2020 than in prior years.86
FIGURE 13 | BASIC NEEDS INSECURITY RATES, BY SECTOR
26 |
SOURCE | 2020 #RealCollege Survey
NOTES | “Any BNI” includes students
who experienced food insecurity,
housing insecurity, or homelessness
within the last year. For more details
on how each measure of basic needs
insecurity was created, refer to the
web appendices.FOOD INSECURITY
Within the USDA’s 18-question framework for food security, respondents are considered food
insecure if they have low or very low levels of food security. Among survey respondents at
two-year colleges, 38% experienced food insecurity in the 30 days prior to the survey, with just
over 16% experiencing low food security and a little more than 22% experiencing very low food
security (Figure 14). At four-year colleges, 29% of students reported experiencing food insecurity.
FIGURE 14 | LEVEL OF FOOD SECURITY, BY SECTOR
27 | SOURCE | 2020 #RealCollege Survey
NOTES | According to the USDA,
students at either low or very low
levels of food security are termed
“food insecure.” Cumulative
percentages may not add up to 100
due to rounding. For more details on
how we measure food security, refer
to the web appendices.The USDA survey items used to measure food security range from nutrition (“I could not afford
to eat balanced meals”) to hunger (“I went hungry but didn’t eat because there wasn’t enough
money for food”).87 Among these, students were most likely to worry about running out of food
(Figure 15). Over two in five survey respondents at two-year colleges and nearly a third of those
at four-year colleges worried about their food running out before they had money to buy more.
Approximately one-third of respondents at two-year colleges and one-fourth of respondents at
four-year colleges cut the size of meals or skipped meals at least once in the 30 days prior to the
survey. These patterns are consistent with another national survey conducted in November 2020,
which found that approximately three in 10 college students missed a meal at least once per week
since the start of the pandemic.88 Rates of food insecurity observed on the 2020 #RealCollege
Survey were also similar to those observed on the 2019 #RealCollege Survey.89
FIGURE 15 | FOOD SECURITY QUESTIONS, BY SECTOR
For students like
myself who do not
have parents to
financially support
28 | them, during times
like these, it is hard
to both balance your
finances to make
ends meet such as
rent, bills/utilities,
and even the ability
to eat a full day’s
meal, let alone a
nutritionally balanced
meal.”
– a student in Texas
SOURCE | 2020 #RealCollege Survey
NOTES | Some students may have
experienced more than one of the
circumstances listed to the left.HOUSING INSECURITY
About half of survey respondents at two-year colleges and two in five at four-year colleges
experienced housing insecurity (Figure 16). The most common challenges for respondents, across
college sector, were not being able to pay the full amount of their rent, mortgage, or utility bills.
Over one in 10 survey respondents at four-year colleges moved three or more times in the 12
months preceding the survey, much higher than the proportion of two-year respondents (3%).
Since four-year colleges are typically more residential than two-year colleges, this likely reflects
changes in reopening plans; a sample of nearly 3,000 colleges found that about two-thirds
changed their reopening plans at least once between March and September.90 By comparison,
only four percent of four-year students moved three or more times in the 2019 #RealCollege
Survey.91 Moving can be financially and emotionally taxing, straining already scarce resources.
Meanwhile, respondents at two-year colleges were twice as likely as those at four-year colleges to
have an account default or go into collections. At both two- and four-year colleges, approximately
five percent of survey respondents left their household because they felt unsafe.
FIGURE 16 | HOUSING INSECURITY, BY SECTOR
29 | Off-campus
housing is a huge
burden on students
who signed lease
renewals [during the
pandemic]. Simply
because they are still
forcing students to
pay rent with money
they don’t have.”
– a student in
California
SOURCE | 2020 #RealCollege Survey
NOTES | Some students may have
experienced more than one of the
circumstances listed to the left. For
more details on how we measure
housing insecurity, refer to the web
appendices.When compared to results from the 2019 #RealCollege Survey, housing insecurity was up in
2020, particularly at four-year colleges.92 While 35% of four-year students experienced housing
insecurity in 2019, 43% experienced housing insecurity in 2020.93 Increases in the number of
students at four-year colleges moved three or more times, contributing to this uptick. Not
paying in full for rent, mortgage, and utilities also appeared to have a role. For instance, two-
year students were seven percentage points less likely to pay their full utility bill in 2020 than in
2019.94
30 |
HOMELESSNESS
In the 12 months prior to the survey, 14% of survey respondents experienced homelessness
(Figure 17). Self-identifying as homeless was approximately 10 percentage points less
common than experiencing the conditions of homelessness. Most respondents experiencing
homelessness—about one in 10 survey respondents overall—stayed in temporary accommodations
or couch-surfed in the past year.
Overall, rates of homelessness were similar for two- and four-year students. In fact, for the first
time in the #RealCollege Survey’s history, the percentage of students experiencing homelessness
at two- and four-year colleges was the same; in previous surveys, students at two-year colleges
experienced higher rates of homelessness.95 While more research is needed to better understand
this pattern, it is possible that the pandemic had a larger impact on housing security among four-
year students.FIGURE 17 | EXPERIENCES WITH HOMELESSNESS, BY SECTOR
31 |
SOURCE | 2020 #RealCollege Survey
NOTES | Some students may have
experienced more than one of the
circumstances listed to the left. For
more details on how we measure
homelessness, refer to the web
appendices. Numbers are rounded to
the nearest whole number.
For me [college] is hard because I have to work full time at night, I live in a hotel, and it
makes it very hard to study due to the noises.”
– a student in TexasDISPARITIES IN BASIC NEEDS INSECURITIES
Students of color were more likely to experience basic needs
insecurity (Figure 18). Across two- and four-year institutions, The classes are
75% of Indigenous, 70% of Black, and 70% of American Indian way too expensive
or Alaska Native students experienced food insecurity, housing especially if you are
insecurity, and/or homelessness. Meanwhile, the rate of basic Black [and] live in
needs insecurity among White students was 54%. Given that poverty. It’s hard
enrollment among Black and Native American students fell to pay for the class
especially precipitously in 2020, it is possible the actual rates and rent let alone
for these groups are even higher.96 books for your class
or equipment for
Students who identified as LGBTQ were also more likely to the class as well.
experience basic needs insecurity, with 65% of LGBTQ students Sometimes you have
experiencing some form of basic needs insecurity. Across to make a difficult
gender identities, female students were seven percentage choice: pay for your
points more likely than male students to experience basic needs class or don’t eat for
insecurity. a couple of days.”
– a student in Florida
FIGURE 18 | DISPARITIES IN BASIC NEEDS INSECURITY
32 | BY RACIAL AND ETHNIC IDENTITY, LGBTQ STATUS, AND
GENDER IDENTITY
SOURCE | 2020 #RealCollege Survey
NOTES | Classifications of gender
identity and racial/ethnic background
are not mutually exclusive. Students
could self-identify with multiple
classifications. For more detail on
how each measure of basic needs
insecurity was constructed, refer to
the web appendices.First-generation college students, Pell Grant recipients, and part-time students also were more
likely to experience basic needs insecurity than their counterparts (Figure 19). The rate of basic
needs insecurity was especially high (67%) among Pell Grant recipients when compared to the
rate (50%) among students who were not Pell Grant recipients.
FIGURE 19 | DISPARITIES IN BASIC NEEDS INSECURITY, BY FIRST-GENERATION STATUS,
PELL GRANT STATUS, AND ENROLLMENT STATUS
SOURCE | 2020 #RealCollege Survey
NOTES | First-generation status is
33 | determined by whether a student’s
parents’ highest level of education
completed is a high school diploma or
GED. For more details on how each
measure of basic needs insecurity
was constructed, refer to the web
appendices.Consistent with past Hope Center research, some life circumstances were also associated with
higher rates of basic needs insecurity.97 Among students with experience in the foster-care
system, the rate of basic needs insecurity was 21 percentage points higher than among students
with no foster-care experience (Figure 20). Justice-system involved students also experienced
high rates of basic needs insecurity, with three in four experiencing food insecurity, housing
insecurity, and/or homelessness. Meanwhile, the rate of basic needs insecurity for students with
no interaction with the justice system was 57%. Among parenting students, 70% experienced
basic needs insecurity; the rate among non-parenting students was 55%. Disparities in housing
insecurity were especially prominent, with parenting students 15 percentage points more likely
than non-parenting students to experience housing insecurity (not shown; see web appendices).
FIGURE 20 | DISPARITIES IN BASIC NEEDS INSECURITY, BY FOSTER-CARE INVOLVED,
JUSTICE-SYSTEM INVOLVED, AND PARENTING STATUS
34 |
SOURCE | 2020 #RealCollege Survey
NOTES | Students who have been convicted of a crime are considered justice-system involved. For more details on
how each measure of basic needs insecurity was constructed, refer to the web appendices.BASIC NEEDS BY INSTITUTION TYPE
The 202 colleges and universities that fielded the 2020 #RealCollege Survey are diverse. Their
enrollments, geographic settings, and resources vary widely. Unfair funding formulas, based on
full- or part-time status, leave community colleges significantly underfunded as compared to
four-year colleges where most students attend full-time.98 Similarly, different states allocate
vastly different amounts to higher education, and minority-serving institutions are largely
underfunded.99 Additionally, institutions serve a variety of demographic groups.100 People of color
have been systematically excluded from many institutions of higher education, and policies like
affirmative action continue to be challenged.101 As a result, institutional context matters when
considering rates of basic needs insecurity.
Among the 130 two-year colleges that fielded the 2020 #RealCollege Survey, the average rate
of basic needs insecurity was 60% (Figure 21). By comparison, the average rate among four-year
colleges was 56%. However, the highest rate (82%) was observed at a four-year college.
FIGURE 21 | VARIATION IN BASIC NEEDS INSECURITY RATES ACROSS INSTITUTIONS,
BY SECTOR
35 |
SOURCE | 2020 #RealCollege Survey
NOTES | For more details on rates shown in the figure above or details on how each measure of basic needs insecurity
was constructed, refer to the web appendices.Rates of basic needs insecurity also varied slightly by region
and setting. Across college types, the highest rates of basic
needs insecurity were observed in the West (Table 2). At two-
year colleges, students in cities experienced the highest rates
of basic needs insecurity (62%). Among four-year colleges,
students attending rural colleges were the most likely to
experience basic needs insecurity (57%).
At HBCUs, which have often been under-resourced, rates
of basic needs insecurity were especially high.102 Sixty-seven
percent of students at HBCUs experienced food insecurity,
housing insecurity, or homelessness. Students at HBCUs were
14 percentage points more likely to experience basic needs
insecurity than students at non-HBCUs. To explore these issues
further, The Hope Center intends to publish a report about
basic needs at HBCUs later in 2021.
TABLE 2 | DISPARITIES IN BASIC NEEDS INSECURITY, BY
SECTOR AND REGION, SETTING, AND HBCU STATUS
36 |
SOURCE | 2020 #RealCollege
Survey & Integrated Postsecondary
Education Data System (2019)
NOTES | Rates to the left are
weighted by the number of student
responses per type of institution.
For more details on how each
measure of basic needs insecurity
was constructed, refer to the web
appendices.At four-year colleges, students attending wealthier institutions were less likely to experience
basic needs insecurity (Figure 22). The lowest rate of basic needs insecurity (49%) were observed
at colleges with endowments per pupil of more than $25,500, while the highest rate (55%) was at
colleges whose endowment per pupil is less than $1,200.
FIGURE 22 | DISPARITIES IN BASIC NEEDS INSECURITY, BY ENDOWMENT (AMONG
FOUR-YEAR INSTITUTIONS)
37 |
SOURCE | 2020 #RealCollege Survey & Integrated Postsecondary Education Data System (2019)
NOTES | Rates above are weighted by the number of student responses per type of institution. Colleges that did not
report information on their endowments are excluded from the figure. For more details on how each measure of
basic needs insecurity was constructed, refer to the web appendices.
In fall 2020, rates of basic needs insecurity remained significant. While they did not vary
substantially from rates in 2019, nearly three-fifths of students who responded to the 2020
survey—more than 100,000 students—were experiencing some form of basic needs insecurity.
Many students worried about running out of food, moved three or more times, or lived
temporarily with others. Housing insecurity was up when compared to prior years, particularly
at four-year colleges. Moreover, disparities in students’ basic needs across gender, race and
ethnicity, life experiences, and college were apparent.UTILIZATION OF SUPPORTS
In late March 2020, the CARES Act became law.103 The bill offered students and colleges financial
relief, particularly in the form of emergency aid.104 Nevertheless, it had shortfalls. Funding
formulas in the CARES Act meant that community colleges received significantly less support
than four-year colleges, and students who were claimed as dependents were ineligible for CARES
stimulus checks, even if they earned income and filed a tax return.105 Sixty-four percent of CARES
Act funds earmarked for higher education had been spent by the end of September 2020, seven
months into the pandemic.106 At the end of July 2020, the federal government failed to extend
pandemic unemployment insurance, causing nearly 30 million Americans to lose $600 per
week.107
We were broke already due to the pandemic and loss of the $600 a week help from the
federal government, but really, really struggled when I had to pay for school before my
FAFSA came in. I didn’t know it took so long for financial aid to actually get to me. I had
to pay for my laptop and graphing calculator out of pocket, and have been paying rent
late which is scary because evictions were not on hold.”
38 | – a student in Colorado
Some college students also were ineligible for existing public supports. For instance, the USDA
denied multiple requests to waive requirements for college students applying for Supplemental
Nutrition Assistance Program (SNAP) benefits, compounding existing confusion about the
program.108 Similarly, there was considerable confusion over CARES Act eligibility requirements,
and in April and May 2020, few students reported accessing available CARES supports.109
“I think that it’s unfair that the government strategically Some students have
did not create any programs to help 18–24-year-olds their parents’ support.
with the COVID pandemic. My family claimed me as Some of us need to
a dependent which meant that I didn’t get any money support our parents.”
from the stimulus even though I filed my own taxes but
they didn’t get any money on my behalf for supporting – a student in
me either since I was over the age of 18 and didn’t meet California
the cutoff for the extra $500 for each dependent.
– a student in PennsylvaniaYou can also read