Multi-criteria segmentation of syndicates trading in the Lloyd's market
←
→
Page content transcription
If your browser does not render page correctly, please read the page content below
Multi-criteria segmentation of
 syndicates trading in the
       Lloyd’s market
        Mémoire d’actuariat

                   Muriel Blum
                  November 2017

        Mémoire à tendance professionnelle
          Collège des Ingénieurs Paris
                PartnerRe Paris

        Academic Supervisor: Olivier Lopez
     Supervisor at PartnerRe: Matthew Hazzard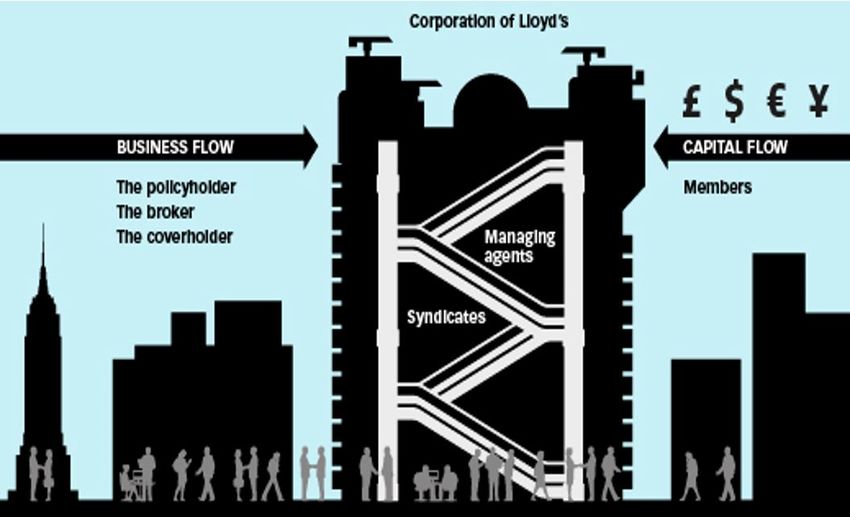
Abstract
   Key words: Lloyd’s market, reinsurance, syndicate, capital provider, seg-
mentation, linear model building

    The Lloyd’s market in London is a unique marketplace which enables in-
surance and reinsurance syndicates to access worldwide and specialist risks
thanks to a global license and distribution network, its brand name as well as
stable financial strength ratings.
    The team "Capital at Lloyd’s" in the international reinsurance group Part-
nerRe is active as a capital provider for syndicates trading in the Lloyd’s
market. In order to identify the right opportunities for such long-term com-
mitments while optimizing the return on capital, it is desirable to segment
the syndicates according to their expected profitability in the future as well
as other characteristics.
    By compiling and studying data from different sources as well as reviewing
existing analyses of syndicates, this project aims at refining the understanding
of success factors and establishing a method for systematically analyzing and
comparing all the syndicates trading in the Lloyd’s market.
    Professional intuition is combined with statistical methods to identify a
set of characteristics of syndicates that deserve a closer look when searching
for the most profitable syndicates.
    Two new segmentation methods are presented as alternatives to syndicate
segmentation approaches based on two existing external scoring systems. One
has been developed based on the outcomes of linear model building presented
in this work. The other one is much more based on professional intuition and
on strategic preferences of PartnerRe.
    Hypothetical portfolios composed of syndicates segmented with these four
different methods as well as a random selection are compared in terms of
performance. Two approaches to portfolio construction and three different
measures for profitability are compared.
    The methods for syndicate segmentation that were developed in this project
are not clearly better than existing methods. Nevertheless, the development
of these methods represents an independent confirmation of the rankings es-
tablished by external sources. When looking at those rankings in the future,
their predictions can be used with an increased confidence.
    The Lloyd’s market is an attractive marketplace for a capital provider
who is able to identify and seize suitable opportunities through a complex
process which starts from a multi-criteria segmentation of syndicates, results in
successful capital deals and requires the expertise of experienced professionals
all along the way.

                                        i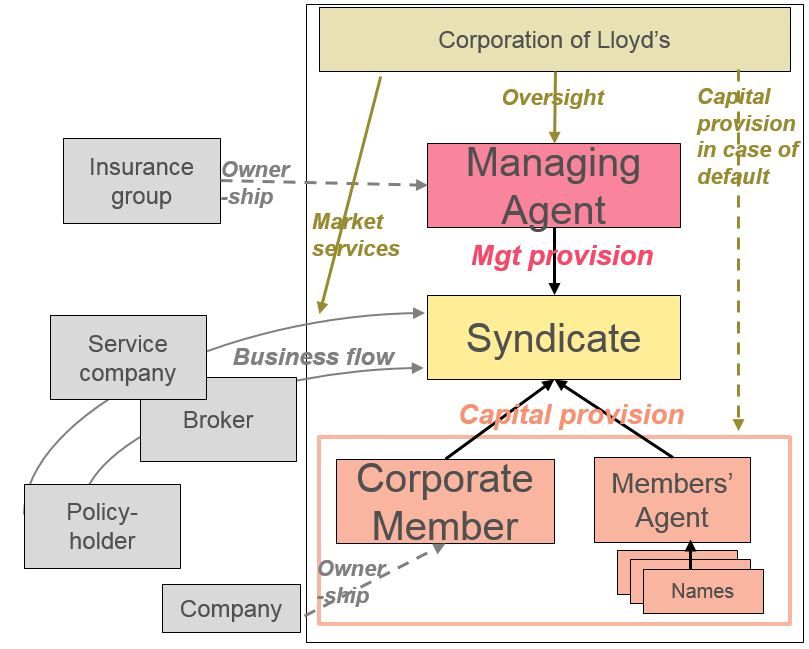
Résumé
    Mots clés : Marché des Lloyd’s, réassurance, syndicat, fournisseur de
capital, segmentation, modélisation linéaire
    Le Lloyd’s market à Londres est une place de marché unique au monde qui
permet aux entreprises d’assurance et de réassurance d’accéder à des risques
globaux et spécialisés grâce à un réseau de licences et de distribution global,
à sa réputation et à la stabilité de sa solidité financière.
    L’équipe "Capital at Lloyd’s" au sein du groupe de réassurance PartnerRe
est active en tant que fournisseur de capital pour des syndicats opérant dans
le Lloyd’s market. Dans le but d’identifier les meilleures opportunités pour ce
type d’engagements à long terme tout en optimisant le retour sur investisse-
ment, il est important de segmenter les syndicats en fonction de leur profita-
bilité attendue pour le futur ainsi qu’à d’autres caractéristiques.
    En compilant des données de différentes sources et des analyses existantes
de syndicats, ce projet a pour objectif d’affiner la compréhension des facteurs
de succès et d’établir une méthode pour systématiquement analyser et com-
parer tous les syndicats actifs du Lloyd’s market. L’intuition professionnelle
est combinée avec des méthodes statistiques pour identifier un ensemble de
caractéristiques des syndicats qui devraient être prises en compte lors de la
recherche des syndicats les plus profitables.
    Deux nouvelles méthodes de segmentation des syndicats sont présentées
ici comme alternatives aux approaches de segmentation basées sur deux sys-
tèmes de notation extérieurs. L’une d’entre elles a été développée en utilisant
les résultats de modèles linéaires présentés dans ce travail. L’autre méthode
est basée sur des réflexes professionnels et sur les préférences stratégiques de
PartnerRe.
    Des portefeuilles hypothétiques composés de syndicats segmentés avec ces
quatre différentes méthodes ainsi qu’avec une sélection aléatoire sont compa-
rées les unes aux autres en termes de performance. Deux différentes manières
de construire un portefeuille et trois différentes mesures de profitabilité sont
comparées. Les méthodes de segmentation des syndicats qui ont été deve-
loppées dans le cadre de ce projet ne sont pas clairement meilleures que les
méthodes existantes. Néanmoins, le développement de ces méthodes repré-
sente une confirmation indépendante des systèmes de notation établis par des
sources externes. Ce sera donc avec une confiance renforcée que les predictions
de ces derniers pourront être prises en compte dans le futur.
    Le Lloyd’s market est une place de marché intéressante pour un fournisseur
de capital s’il est capable d’identifier et de saisir les opportunités adéquates
dans un processus commençant par la segmentation multi-critère des syndi-
cats, demandant l’expertise de professionnels expérimentés tout au long du
processus et résultant de prises de capital réussies.

                                       ii
Contents
Abstract i
Résumé ii
Acknowledgments v
Notes about Notation vi
Abbreviations vi
1 Introduction 1
2 Theoretical Part 3
2.1 Particularities of the Lloyd’s market . . . . . . . . . . . . . . . 3
2.1.1 History . . . . . . . . . . . . . . . . . . . . . . . . . . . 3
2.1.2 Structure . . . . . . . . . . . . . . . . . . . . . . . . . . 4
2.1.3 Accounting . . . . . . . . . . . . . . . . . . . . . . . . . 7
2.1.4 Capacity vs. Capital . . . . . . . . . . . . . . . . . . . . 8
2.1.5 Chain of Security . . . . . . . . . . . . . . . . . . . . . . 10
2.1.6 Capital model . . . . . . . . . . . . . . . . . . . . . . . . 10
2.2 Existing analyses of syndicates . . . . . . . . . . . . . . . . . . 14
2.2.1 Syndicate Research Limited . . . . . . . . . . . . . . . . 14
2.2.2 Members’ Agents . . . . . . . . . . . . . . . . . . . . . . 15
2.3 Theory about linear modeling . . . . . . . . . . . . . . . . . . . 16
3 Practical Part (Application) 19
3.1 Objectives . . . . . . . . . . . . . . . . . . . . . . . . . . . . . . 19
3.2 Availability and quality of data . . . . . . . . . . . . . . . . . . 19
3.2.1 Quantitative data . . . . . . . . . . . . . . . . . . . . . 19
3.2.2 Qualitative data . . . . . . . . . . . . . . . . . . . . . . 20
3.3 Preliminary considerations and analyses . . . . . . . . . . . . . 21
3.3.1 What exactly are we looking for? . . . . . . . . . . . . . 21
3.3.2 Different ways of defining profitability . . . . . . . . . . 22
3.3.3 Comparing groups of syndicates . . . . . . . . . . . . . 25
3.4 Building linear models to understand drivers of syndicate prof-
itability . . . . . . . . . . . . . . . . . . . . . . . . . . . . . . . 27
3.4.1 Model building approaches . . . . . . . . . . . . . . . . 28
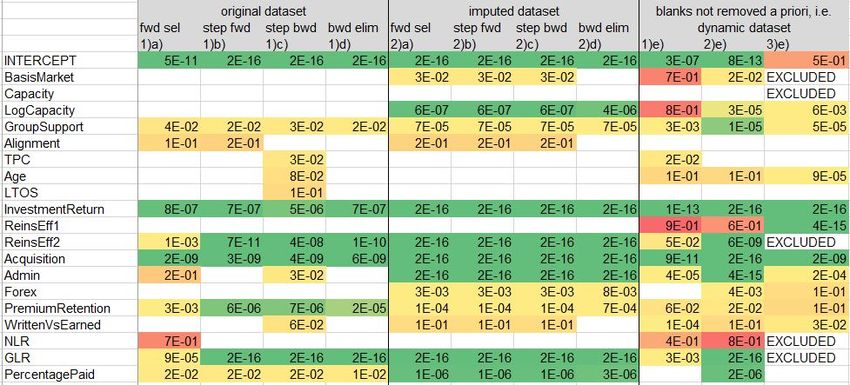
3.4.2 Models trained with original data . . . . . . . . . . . . . 34
3.4.3 Models trained with imputed data . . . . . . . . . . . . 41
3.4.4 Exploring the forced exclusion of variables . . . . . . . . 44
3.4.5 Conclusions from the linear models for profitability . . . 45
iii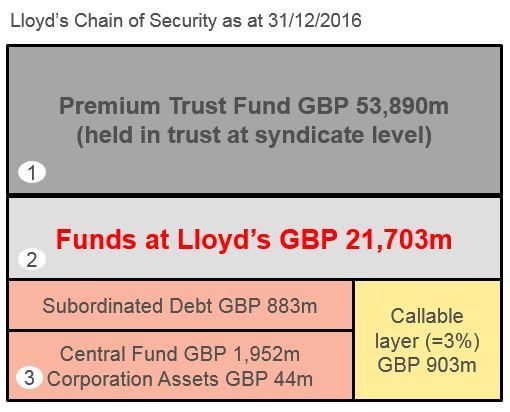
3.5   Selection of criteria and weighting for segmentation . . . . . . .      50
   3.6   Main results and discussion . . . . . . . . . . . . . . . . . . . .     50
         3.6.1 Comparing the performance of portfolios selected with
                 different methods . . . . . . . . . . . . . . . . . . . . . .   50
         3.6.2 Comparing the benefits and costs of the different methods         55
         3.6.3 Ideas to further improve the segmentation methods . . .           60
   3.7   The selection of target syndicates in practice . . . . . . . . . .      61
   3.8   Diversification benefit and portfolio management . . . . . . . .        62

4 Conclusion                                                                64
  4.1 Value created . . . . . . . . . . . . . . . . . . . . . . . . . . . . 64
  4.2 Critical discussion . . . . . . . . . . . . . . . . . . . . . . . . . 64
  4.3 Outlook . . . . . . . . . . . . . . . . . . . . . . . . . . . . . . . 65

References                                                                       67

List of Figures                                                                  69

List of Tables                                                                   70

Appendix I (non-confidential)                                                    71

                                       iv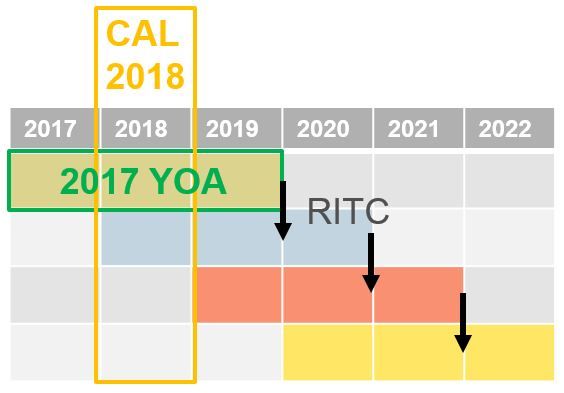
Acknowledgments
    My special thanks go to Matthew Hazzard and Michel Büker for giving me
the opportunity to work on this Mémoire. They have supervised and guided
me during the work on this topic as well as all along the mission that I realized
in their team in the framework of the MBA program at Collège des Ingénieurs.
    Matthew has always been patient in answering my questions and explaining
me the particularities of the Lloyd’s market and he has supported my work
by sharing his expertise.
    I also thank Olivier Lopez for all his efforts as the academic supervisor of
this Mémoire. I appreciated the scientific guidance that he gave me during
our meetings.
    Special thanks also go to Sili Lu at PartnerRe who has helped me with
the software R and with related questions. Furthermore, I am grateful to Karl
Whitehead, Adrien Haegel and many other colleagues at PartnerRe who have
supported me directly or indirectly during my time at PartnerRe.
    I would also like to thank Bruno Boulay and Hélène Feau who have accom-
panied my mission and my work on the Mémoire on the side of the Collège
des Ingénieurs.
    Last but not least, I thank my family and friends for their continued sup-
port.

                                       v
Notes about Notation
The decimal separator in this document is the point. The comma is used
to indicate thousands.
The following list spells out the abbreviations used in this document and
indicates the corresponding page numbers.
Abbreviations
AIC Akaike Information Criterion. 18, 38, 46, 47, 72
APCL Argenta Private Capital Limited. 15, 16, 20, 29, 50–52, 54, 60,
64, 70
BIC Bayes Information Criterion. 18, 38, 46, 72
CAL Calendar year. 8, 23–26, 28, 29, 50, 51, 65, 69, 77
CM Corporate Member. 1, 4, 5, 32, 62
ECA Economic Capital Assessment. 10, 12
FAL Funds At Lloyd’s. 9–13, 62
GPW Gross Premiums Written, gross of reinsurance. 5, 7, 21, 32
LCR Lloyd’s Capital Return. 10, 12
MA Managing Agent. 1, 4, 5, 7, 10, 12, 14, 15, 23, 26, 30, 62
NEP Net Earned Premiums, net of reinsurance. 21, 22, 32, 34
NPW Net Premiums Written, net of reinsurance. 21, 32
RDS Realistic Disaster Scenario. 4, 15, 22, 60, 62
RITC Reinsurance To Close. 4, 7, 8, 16
ROC Return On Capital. 2, 9, 14, 24, 28, 51, 54, 55
SBF Syndicate Business Forecast. 9, 16
SCO Syndicate Continuity Opinion. 14, 15, 54
SCR Solvency Capital Requirement. 10, 12, 15
SPA Special Purpose Arrangement. 5, 16, 25, 42
SRL Syndicate Research Limited. 14, 15, 19–21, 29, 32, 50–52, 54, 60,
64, 65
TPC Third Party Capital. 1, 5, 8, 16, 25–27, 29, 32, 51, 53, 62, 63, 69
YOA Year Of Account. 7, 8, 15, 23–26, 28, 29, 51, 52, 69, 77
vi1 Introduction
The time-honored Lloyd’s market in London is a unique marketplace which
enables insurance and reinsurance companies to access worldwide and special-
ist risks thanks to a global license and distribution network, its brand name
as well as stable financial strength ratings.
The Lloyd’s market has a capital framework which cannot readily be dupli-
cated elsewhere combined with an overarching, consistent performance man-
agement framework across all key aspects of a business. Lloyd’s "Chain of
Security" and its capital model are interesting to look at from an actuarial
point of view.
For PartnerRe as an international reinsurance group, it is attractive to par-
ticipate in this market. In particular, PartnerRe’s Paris-based team responsi-
ble for "Capital at Lloyd’s" (formerly known as "Lloyd’s Net Quota Share and
Multiline") is active as a capital provider for syndicates trading in the Lloyd’s
market.
Syndicates are created on an annual basis to write insurance and reinsur-
ance business. They are backed financially by so-called Members and oper-
ated by Managing Agents (MAs). The capital providers, i.e. Members, can be
wealthy individuals (called Names) or Corporate Members (CMs). The role
of a MA is to run a syndicate on behalf of the capital providers. This basic
structure of the Lloyd’s market is schematically illustrated in Figure 1 (see
page 6).
While a large part of the CMs are owned by (re)insurance companies which
typically also own MAs, there is also Third Party Capital (TPC) embedded
into such vehicles. All the capital provided by Names (through a variety of
vehicles) should also be considered as TPC because Names are third parties.
However, in this document, given the marginal interest in the role played by
Names, the term TPC is usually used as a shorthand for corporate third party
capital, meaning capital invested by companies through CMs.
Those companies which own and control a MA in support of their own
syndicate are providing so-called "corporate capital" (first party, not third
party) through their dedicated CM. If all of the capital backing a syndicate is
corporate capital, the syndicate is called "fully aligned". On the other hand,
if there is a panel of capital providers of a syndicate, including either Names
and/or (corporate) TPC, the syndicate is "non-aligned" 1 .
PartnerRe is currently providing TPC to several different syndicates and
1. These definitions of alignment are very specific and should not be confused with the
colloquial use of the word "alignment" for example in the sentence "the interests of the two
parties are well aligned".
1is aiming at further increasing the number of such investments over the next
few years.
Therefore, in order to optimize the Return On Capital (ROC), it is desir-
able to identify the syndicates which are most likely to be profitable in the
future. Even though a syndicate is an annual venture, the participation in a
syndicate is oftentimes seen as a long-term commitment, making it even more
important to select the right opportunities.
There are a multitude of factors that play a role in the selection of in-
vestment opportunities, including many "soft" factors relating to people in the
market. However, it would be desirable to complement and corroborate the
experience of the investment managers in PartnerRe’s "Capital at Lloyd’s"
team with a systematic quantitative analysis.
By integrating data from different sources as well as existing analyses of
syndicates, this project aims at refining the understanding of success factors
and establishing a method for systematically analyzing and comparing all the
syndicates trading in the Lloyd’s market.
Professional intuition is combined with statistical methods to identify a set
of characteristics of syndicates that deserve a closer look when searching for the
most profitable syndicates. Practical considerations such as data availability,
methodological artifacts and simplicity of the method are also discussed.
Subsequently, by defining selection criteria and corresponding weightings,
segmentation methods for everyday use can be obtained. One will be based
on the outcomes of a linear model building process while another one will be
based on professional reflexes and strategic preferences of PartnerRe.
A comparison of the added value of these segmentation methods compared
to alternative approaches as well as a critical discussion thereof complete the
practical part of this Mémoire.
Given the specificities of the problem and the particularities of the Lloyd’s
market, the topics relating to this Mémoire are not well covered in body of
literature formed by past Mémoires. The references in this text will therefore
mainly point to documentation surrounding the Lloyd’s market. We believe
that the contents are nevertheless relevant for the French Institut des Actu-
aires.
22 Theoretical Part
The theoretical part presents some relevant concepts about the Lloyd’s
market before looking at two existing approaches to syndicate scoring and
finally briefly recalling some theory about linear modeling.
2.1 Particularities of the Lloyd’s market
In view of the peculiar structure of the Lloyd’s of London market, this theo-
retical part begins by giving some background, introducing some key concepts
and clarifying some terminology.
2.1.1 History
More than 300 years ago, a coffee house in London, the Edward Lloyd’s
Coffee House emerged as a hub for information about shipping. The latest
news about marine adventures were highly relevant to the first individuals
providing shipping insurance - a very profitable but risky business. Therefore,
during the first half of the 18th century, the Lloyd’s establishment became a
hotspot of marine underwriting and its influence reached a global scale.
In the 1760s, the underwriting diversified to some non-marine lines of busi-
ness, in 1769, a restructuring resulted in the "New Lloyd’s" and in 1773 a man
called John Julius Angerstein originated the concept of a lead underwriter,
meaning that others followed him by underwriting the same policies at the
same rates.
In 1811, the creation of a network of Lloyd’s agents further increased the
flow of information to Lloyd’s and thereby consolidated its reputation and
expertise. By the middle of the 19th century, financial security was reinforced
by requiring Members to put up a deposit to support their underwriting.
By 1870, the concept of large syndicates was introduced, thereby increasing
the size of the lines that could be written and standing up to the growing
competition from companies outside of Lloyd’s.
The first Lloyd’s reinsurance policy on American risks was written in the
1880s. In the 1890s, the role of brokers became increasingly important.
At the start of the 20th century, a financial audit process was introduced
at Lloyd’s as a consequence of some scandalous financial failures. Moreover,
the pricing of policies became much more risk-based thanks to a wide range of
data and studies about hurricanes, earthquakes, etc. Also at the beginning of
the 20th century, business began to be written through delegated authorities
in other countries.
The San Francisco earthquake in 1906 resulted in several other novelties,
including excess of loss reinsurance. In the 1920s, a case of an enormous debt
3of an underwriter initiated the creation of the "Central Fund", adding even
more financial security to policyholders. The globalization emerging in the
1960s made Lloyd’s business truly international.
In 1986 the New Lloyd’s building at One Lime Street was opened. A series
of problems in the 1980s and 1990s relating to some very risky covers, unlimited
liability and other issues resulted in "the most turbulent and traumatic time"
[1] in Lloyd’s history. The subsequent restructuring and the establishment
of "Equitas", a vehicle into which all pre-1993 business was transferred by
Reinsurance To Close (RITC), marked a new beginning for a more robust and
modern Lloyd’s.
In 1994, the first CMs began underwriting. In 2001, Lloyd’s became sub-
ject to oversight by the new Financial Services Authority. In the 2000s, sev-
eral other new concepts and entities were introduced, including the Franchise
Board (responsible for underwriting and risk management standards across
the market), annual accounting (supposed to replace three-year accounting,
see Section 2.1.3) and Realistic Disaster Scenarios (RDSs) (requiring syndi-
cates to model their expected losses for certain major disasters).
The current development of Lloyd’s is guided by the Vision 2025 that was
launched in 2012.
This brief summary of the history of Lloyd’s was based on [1], where many
more details can be found.
2.1.2 Structure
Lloyd’s is not a company but a marketplace for brokers and syndicates.
Insurance and reinsurance business is written when the right connections are
made between underwriters and brokers representing policyholders.
Lloyd’s describes itself as the world’s leading market for specialist insur-
ance.
The typical flow of business, illustrated in Figures 1 and 2, begins with the
policyholder who requires some insurance cover.
On behalf of the policyholder, a broker will then place the risk in the
market. The brokers are the intermediaries between the insured and the un-
derwriters of the syndicates. With their specialist knowledge of the market,
the brokers approach the underwriters, introduce the business and receive 15-
30% of premium. There are about 200 broker firms in the Lloyd’s market and
they bring business from about 200 countries and territories.
Furthermore, there are so-called coverholders who place risks. They are
also known as managing general agents (not to be confused with MAs). Under
the terms of a binding authority issued by a MA, these companies can enter
into insurance contracts in the name of the Members of the corresponding
syndicate. Some of the Lloyd’s brokers can act as coverholders.
4The MAs manage the syndicates, i.e. are responsible for all operational
decisions and processes. The people actually running the syndicates are thus
people working for the corresponding MAs - a syndicate as such is not really
a company or any other legal entity. Nevertheless, the syndicates are said to
write insurance risks.
The risks are actually borne by the Members who provide the capital to
back the syndicates. As capital providers, these Members are exposed to the
liabilities resulting from underwriting, at least up to their limit of liability. The
Members are also those who benefit from profits made by the syndicates. The
MAs are of course taking their share of the profits as well - their remuneration
is based on a combination of fees and profit commissions.
The two basic types of Members are Names and Corporate Members
(CMs), corresponding to individuals and to companies respectively. Among
the CMs, there are those which are dedicated to a specific syndicate and those
which participate in several syndicates. TPC CMs are typically in the second
category, i.e. they back different syndicates. The portfolio of such CMs and
the corresponding interactions with MAs are managed by Members’ Agents.
For Names, it is also essential to have recourse to the services of a Members’
Agent in order to be active in the market.
Finally, there is the Corporation of Lloyd’s which supports the market in
various ways. It is for example responsible for the overarching performance
management framework, for market services and for the interaction with reg-
ulatory authorities. Additionally, the Corporation of Lloyd’s is managing the
central assets of Lloyd’s which form the third link in the Lloyd’s "Chain of
Security", see Section 2.1.5.
The number of syndicates and MAs has been evolving over time. Table 1
gives an idea of the number of these entities in the past few years. In 2017,
there are 96 active syndicates, 57 Managing Agents and 4 Members’ Agents
(3 main ones).
Some syndicates are so-called Special Purpose Arrangements (SPAs) which
depend on another syndicate and its MA. As they are taking a part of the book
of business of their parent syndicate, some accounting adjustments have to be
made when determining capacity, premium or other figures at the Lloyd’s
market level.
The Lloyd’s market as a whole has a capacity of about 30 billion GBP
(see Table 1), with "capacity" referring to an upper limit of premiums gross of
reinsurance but net of acquisition costs (see also Section 2.1.4).
In contrast, the Gross Premiums Written, gross of reinsurance (GPW)
as it appears in usual financial statements is gross of reinsurance and gross
of acquisition costs. As the acquisition costs and the amount of unutilized
5Figure 1 – Schematic representation of the Lloyd’s market showing the flows
of business and of capital as well as the Corporation of Lloyd’s which oversees
the market. Source [13].
Figure 2 – Schematic representation of the structure of the Lloyd’s market
showing the different internal and external stakeholders and their interactions.
For simplicity, only one syndicate is depicted.
6capacity are roughly compensating each other, the GPW is oftentimes quite
close to capacity, but the two should not be confused. The total Lloyd’s GPW
was for example GBPm 30,538 in 2016 and GBPm 27,545 in 2015 (see Lloyd’s
pro forma financial statements).
Table 1 – Number of syndicates, MAs and Members’ agents active in the
Lloyd’s market over the past years. Source [9].
2017 2016 2015 2014 2013
Lloyd’s Capacity (GBPm) 30,198 27,609 26,266 26,527 24,998
Syndicates 96 98 99 95 90
Managing Agents 57 59 59 56 55
Members’ Agents 4 4 4 4 4
2012 2011 2010 2009 2008
Lloyd’s Capacity (GBPm) 24,167 23,314 22,951 18,136 16,106
Syndicates 90 92 87 85 80
Managing Agents 56 56 54 53 51
Members’ Agents 4 4 4 4 4
2.1.3 Accounting
Originally, the syndicates at Lloyd’s have always used three year account-
ing. A Year Of Account (YOA), also called underwriting year, includes every
risk written during the corresponding calendar year with all the premiums and
claims related to it. For business written in long-tail lines of business such as
casualty, the claims will appear quite far in the future, sometimes several years
later than the risk was written. Even for short-tail lines of business such as
property, it is clear that for policies underwritten towards the end of a given
year, the premiums and claims will materialize over a period longer than the
underwriting year.
The concept of three year accounting thus corresponds quite well to the
period at risk of business underwritten during a given year and with annual
policies. Historically, the three year accounting goes back to the maritime
logic that Lloyd’s would pay claims if a ship did not return after three years.
After the end of the third year, the syndicates work on the RITC. This is
a contract between the Members of the closing YOA and the following YOA.
The latter take on all prior liabilities in exchange for a premium that they
receive from the members of the closing YOA. The YOA can thereafter be
called a "closed" year.
RITC thus corresponds to passing on the reserves for liabilities successively
from one YOA to another. The terms of an RITC have to be fair and equitable
7according to Lloyd’s rules. This means that whenever there are too many
uncertainties in the RITC, the corresponding YOA will be left "open" until
estimates are more reliable.
Nowadays, Lloyd’s is using annual accounting. This makes it more com-
parable to other (re)insurance players. The basis for annual accounting is the
Calendar year (CAL).
However, many syndicates still use three year accounting, especially the
syndicates with TPC because in their case, the participation of such capi-
tal providers (which can participate with different shares on different YOAs)
requires that different underwriting years can be separated from each other.
As Figure 3 illustrates, the CAL and the YOA are not the same.
Figure 3 – Schema illustrating the difference between YOA and CAL and the
closing of each YOA into the subsequent YOA by the RITC mechanism.
2.1.4 Capacity vs. Capital
Besides accounting periods, another potential source of confusion in the
Lloyd’s market it the concept of capacity.
The so-called stamp capacity (or "capacity" or "stamp") of a syn-
dicate is an upper limit of premium income net of acquisition costs
(but gross of reinsurance).
Acquisition costs consist of commissions paid to brokers and other related
expenses.
8To prevent any confusion between capital and capacity, we usually spell
out capacity rather than abbreviating it.
The planned premium income that a syndicate declares in its business plan
(known as Syndicate Business Forecast (SBF)) which has to be approved by
Lloyd’s is usually lower than the capacity. This is to allow room for exchange
rate movements or increasing premium in the aftermath of a sudden change in
market conditions. Syndicates can only underwrite more premium than their
capacity if they get permission from Lloyd’s.
The capital that Members put up to support the underwriting
of the syndicate(s) in which they participate is known as Funds At
Lloyd’s (FAL).
The amount of FAL depends on the riskiness of the business, but it is in
most cases lower than the capacity that it is backing.
The FAL is lodged at Lloyd’s in the form of cash, shares or bank guarantees.
In some special cases, the funds can be held at syndicate level and are known
as FIS.
These assets represent the second link in Lloyd’s "Chain of Security", see
Section 2.1.5.
When speaking about the profitability of a syndicate, it is common to
consider the ratio of the financial result to the capacity of the syndicate.
Profit in GBPm
Profitability =
Capacity in GBPm
This allows for a straightforward calculation and for inter-syndicate com-
parability of profitability, whereas the ratio of profit to capital would depend
on the Member under consideration.
In particular, those Members who invest in a portfolio of syndicates may
enjoy a diversification benefit that lowers the amount of capital that they
need to put up compared to the sum of equivalent participations by different
Members.
The ratio between capital and capacity is thus individual to each Member.
More details about capital setting will be given in Section 2.1.6.
When it comes to making general assumptions, here we use a ratio of:
FAL
= 60%
Capacity
The Members’ Agent Hampden assumes a ratio that changes over time:
40% for 2001-2007, 45% for 2008-2011 and 50% from 2012 onwards [16].
Our 60% assumption is thus rather conservative.
The ROC of a participation in Lloyd’s syndicates is thus roughly a factor
1/60% = 1.67 bigger than the profitability expressed as profit per capacity.
92.1.5 Chain of Security
Lloyd’s capital structure is quite unique and powerful. It provides very high
financial security to the policyholders all while being quite capital-efficient for
Members.
There are three links in the so-called "Chain of Security", as schematically
illustrated in Figure 4:
1. Syndicate level assets
2. Members’ Funds at Lloyd’s (FAL)
3. Central assets
The first link in the Chain of Security are the premiums collected by the
syndicates which are held in trust at the syndicate level. They are the first
resource for settling valid claims of policyholders.
Second, there is the capital held in trust funds at Lloyd’s for each Member,
i.e. the FAL. In cases where syndicate assets are insufficient to meet liabilities,
the MA makes a call on Members’ FAL.
The third link in the Chain of Security consists of different types of central
assets of Lloyd’s. The "Central Fund" is available at the discretion of the
Council of Lloyd’s to meet any Member’s insurance liabilities. Similarly, there
are also the corporation assets and the subordinated debt which are available
as central assets. Moreover, Lloyd’s retains the right to call a contribution of
3% of capacity from all syndicates, meaning that there are another GBP 900m
providing further financial security to policyholders.
2.1.6 Capital model
The calculation to determine the required amount of FAL is done at the
level of each Member. Members participating in different syndicates may get
a diversification benefit from their portfolio of participations.
The underlying "Lloyd’s Internal Model" is not public. Members can use
the "Member Modeller" to calculate their capital requirements based on their
portfolio. The different steps of the capital setting process - which is known as
Economic Capital Assessment (ECA) - are schematically illustrated in Figure
5 and briefly described below. More information about the ECA can be found
in Lloyd’s ECA guidance manual [3].
Among the inputs for the Lloyd’s Internal Model, there are the numbers
about the Solvency Capital Requirement (SCR) of each of the trading syndi-
cates. The process by which Lloyd’s collects information about each syndi-
cate’s capital position is the so-called Lloyd’s Capital Return (LCR).
Each syndicate is obliged to determine its SCR in two different manners:
on a one-year basis and "to ultimate". The SCR on a one-year basis (SRC1)
10Figure 4 – Schematic representation of Lloyd’s unique capital structure, called
the "Chain of Security". There are three links, namely the syndicate level
assets, the Members’ Funds at Lloyd’s (FAL) and the central assets. Adapted
from [2].
11is consistent with Solvency II regulations and its calculation is a regulatory
requirement. However, Lloyd’s considers the ultimate SCR (uSCR) as the
more appropriate risk measure [4]. The uSCR takes into account the risks
over the full lifetime of the liabilities as assessed at a confidence level of 1:200.
Along with the uSCR and SCR1 numbers, each syndicate, i.e. its MA,
submits a "SCR Documentation" which allows Lloyd’s to understand the op-
erational details of the syndicate’s internal model and its compliance with
regulation.
Next, the uSCR is uplifted by a certain percentage to yield the ECA.
Currently the uplift is 35% (confirmed for 2018), but this number might change
in the future as it is subject to annual review by Lloyd’s Franchise Board. The
SCR together with the Lloyd’s uplift and any potential Solvency II accounting
adjustments is called the ECA of the syndicate.
The minimum regulatory capital requirements for a Member are cal-
culated from the ECA values of the different syndicates that this Member is
backing. Adjustments due to diversification or concentration of risks within
the portfolio are made. This is the stage where the Lloyd’s Internal Model
comes into play. The ECA values of the syndicates are combined to yield the
Members’ ECAs.
Members’ FAL requirements are calculated twice a year. This process of
capital setting is called "coming into line".
A Member’s FAL must be at least 40% of its total capacity. This is now
required for all Members while in the past there were exceptions for members
writing mainly Motor business. The FAL that the Member actually puts up
is thus not necessarily equal to the ECA number coming from the model.
Moreover, Lloyd’s will introduce a limit on Tier 2 capital (e.g., letters of
credit and bank guarantees) in Members’ FAL. The limit will be at 90% of
ECA for the 2019 YOA and then further decreasing (80% for 2020 and 75%
for 2021) [5]. Solvency deficits will have to be fully covered by Tier 1 capital
(e.g., cash, bonds and equities).
Data collected through the LCR are a direct input into the Lloyd’s Internal
Model and are also used to calibrate it. There is a series of updates of the
"Member Modeller" software during autumn corresponding to the different
stages at which Lloyd’s receives and approves data and documents provided
by the MAs. The parameters of the Lloyd’s Internal Model are also reviewed
and updated based on historical data.
Furthermore, there are always some new focus areas in which the capital
setting process should be improved. Currently, attention is directed for exam-
ple to the lack of adjustment of the internal models to widening of terms and
conditions. The additional risk of wider terms and conditions is currently not
12Figure 5 – Schematic representation of the capital assessment processes which
at the end indicate how much FAL each Member has to put up.
13reflected in increased capital requirements and thus there is no internal cost
to such underwriting decisions. Another example is the topic of Cyber lines of
business where the parametrization and validation processes are under review
and the MAs are required to submit additional information.
2.2 Existing analyses of syndicates
Before starting to develop our own framework for scoring the performance
of syndicates, we summarize the approaches taken by other organizations.
2.2.1 Syndicate Research Limited
Syndicate Research Limited (SRL) is a company whose main activity is
to provide research about the syndicates. In its own words, it is a company
"committed to providing independent research on all active syndicates trading
at Lloyd’s" and it "offers 100% coverage of individual Lloyd’s syndicates as
well as the Lloyd’s market as a whole" [6].
The team at SRL has many years of cumulated Lloyd’s expertise.
SRL publishes a variety of data and analyses about the syndicates trading
in the Lloyd’s Market. Their profiles about each syndicate and each MA
provide a set of relevant data and descriptions at one glance.
As a synthetic evaluation, SRL assigns a so-called Syndicate Continuity
Opinion (SCO) to a syndicate.
The SCO is based on a "Scorecard" which is based on quantitative fac-
tors complemented by qualitative considerations. The resulting "Aggregate
Score" is then transformed into the SCO by making further adjustments due
to qualitative information if necessary.
Specifically, the information taken into account in the Scorecard are the
following (weighting indicated in parentheses):
— 9 year average ROC (70%)
— 2 year average ROC (5%)
— 2 year average Combined Ratio (5%)
— Absolute number of distinct material business lines (15%)
— 2 year average of Expenses (incl. forex) % Net Premiums Earned (5%)
Each of these factors is evaluated on the C-, C, C+, B-, B, B+, A-, A, A+
scale, corresponding to numerical values 1 to 9.
After calculation of the weighted average (with the weights as indicated
above), the Scorecard indicator is subject to further adjustment based on the
"Other Considerations".
14These Other Considerations are based on the following factors and result
in an adjustment of the score within the range indicated in parentheses:
— Franchise value (±0.5)
— Underwriting cycle management (−0.5)
— Percentage of new business lines (−0.5 or −0.25)
— Management stability (−0.5)
— Group/External support (from −1 to +1)
Finally, the resulting score is mapped back to the C- to A+ scale, yielding
the SCO.
A Scorecard is available for 75 syndicates (representing 94% of the market’s
capacity) and a SCO is given for 45 syndicates (74% of the market’s capacity).
2.2.2 Members’ Agents
Argenta Private Capital Limited (APCL) is one of the three main Mem-
bers’ Agents in the Lloyd’s market. In order to facilitate the investment de-
cisions of the Members utilizing their services, they publish a brochure with
syndicate profiles in which a variety of ratings are given to each syndicate with
which they collaborate.
It is important to notice that the data and analyses published by APCL
do not cover all the syndicates trading in the Lloyd’s market, but only the
syndicates open to APCL Members (28 for the 2017 YOA, 27 for the 2018
YOA). This is a big difference to SRL and will be further discussed in Section
3.2 about data availability.
The overall rating that APCL gives to a syndicate ranges from D through
C, C+, B, B+, A to A+.
They do not disclose the full details of their methodology (and they write
that "the rating includes a degree of subjectivity" [12]), but the main factors
taken into account in their different scorings are nevertheless indicated.
The "Risk Rating" is designed to indicate the likelihood of a large loss for
the syndicate relative to the market as a whole. It is based on a combination
of the SCR, the RDS, the volatility of past results, the exposure to reinsurance
failure and the quality of the MA. The Risk Rating is given on a verbal scale
(Lower, Medium, Higher, Very High).
Several other ratings are given on a scale from 0 to 10. Table 2 shows what
kind of information the different scores are based on.
Comments about Auction Price:
Some of the capacity is held on a secure basis for the corresponding Mem-
bers, i.e. it cannot be taken away from them by the MA of the respective
syndicate. The origin of this so-called "freehold" capacity was an agreement
15Table 2 – Factors for the different APCL ratings and the corresponding
methodology.
APCL
Factors Calculation
Rating
For adding a line of
Capital Marginal capital requirement 25k to a portfolio of
1m GBP
1 in 30yrs Aggregate Exceedance
Catastrophe (details undisclosed)
Probability figures (latest SBF)
a) Claims paid at 3yrs % Some combination
Tail ultimate claims of both (details
b) RITC premium % net premium undisclosed)
Adjusted avg auction price 10 if not traded at
Cost
(previous year) auctions (e.g. SPAs)
a) Capacity available at
Scarcity auctions Ratio of the two
b) Capacity provided by TPC
that Members negotiated with Lloyd’s in the early 1990s after the "Recon-
struction and Renewal" project. Since 1995, this capacity owned by Members
can be traded via auctions.
The auction price can give an indication of how successful a syndicate is.
However, as it is only the freehold capacity that is traded on auction, this
measure is available only for a limited number of syndicates (e.g. only 19
syndicates in 2016).
2.3 Theory about linear modeling
In a linear model, the dependence of a dependent variable y on multiple
independent variables x1 , ..., xp is described as
yi = (β0 + β1 xi1 + β2 xi2 + ... + βp xip ) + εi
for each observation i.
The independent error terms εi are assumed to follow a normal distribution
with mean 0 and equal variance σ 2 .
Ordinary Least Square regression is a statistical method to determine the
parameters of the linear model for a given dataset. If the predictor variables
x1 , ..., xp are given, the calculation of the least square estimates of the coeffi-
cients β, written as β̂, is straightforward and the resulting relationship can be
used to predict y from x1 , ..., xp .
16E[Y ] = βˆ0 + βˆ1 X1 + βˆ2 X2 + ... + βˆp Xp
The sum of the squares of the errors (residuals) is written as SSResid .
Similarly, SSRegr stands for the sum of the squares of the regression and
SST otal for the total sum of squares. With ȳ designating the mean value of
the observed yi values, we can write
n
X n
X n
X
SSResid = (yi − yˆi )2 SSRegr = (yˆi − ȳ)2 SST otal = (yi − ȳ)2
i=1 i=1 i=1
However, the fundamental problem in this work is that it is not known in
advance which independent variables should be included in the model. There-
fore, the selection of predictors to be included in the model is the main part
of the analysis.
Generally, we can distinguish between two ways of selecting variables [21]:
1. Comparing all possible subsets of the pool of candidate predictors
with a certain criterion for quality of fit.
2. Using a search algorithm and a criterion for quality of fit for finding an
optimal model in an iterative way.
The first approach can only be implemented if the number of potential
predictors p is low because the number of subsets scales as 2p (because each
predictor can either be in a subset or not (2 possibilities) with all of these p
decisions being independent). Hence, the second approach will be taken here
(for 19 independent variables, 219 = 5240 288).
There are different search algorithms for this iterative approach, namely
— Forward selection
— Backward elimination
— Stepwise regression
A basic way to describe the quality of fit of a model is the R-squared value
R2 , also called the coefficient of determination:
Explained variation SSRegr SSResid
R2 = = =1−
Total variation SST otal SST otal
However, the R2 will continue to improve when more variables are added.
That is why it is more useful to look at the adjusted R2 value, written as Ra2 ,
which takes into account the number of variables [23]:
n−1
Ra2 =1− (1 − R2 )
n−p
17with n designating the number of observations and p the number of pre-
dictors. The number of parameters of the model is p + 1 due to the intercept.
As each criterion has its advantages and its limitations, there are many
criteria that have been developed for comparing the quality of fit of linear
models. Two other criteria that will be used in this work are the following:
— Akaike Information Criterion (AIC)
— Bayes Information Criterion (BIC) which is also known as Schwarz’
Bayesian Criteria (SBC)
These are criteria that consist of a combination of two elements: on the
one hand the maximum likelihood estimates of the model parameters (on a
logarithmic scale) and on the other hand an adjustment penalizing for the
number of predictors.
The lower the value, the better. According to [18], the expressions for
these criteria in a regression setting are:
AIC = constant + n log(SSResid ) + 2p
BIC = constant + n log(SSResid ) + log(n)p
with n designating the number of observations and p the number of predictors
as above 2 .
BIC penalizes a high number of variables more strongly than AIC, meaning
that its use will result in a final model with fewer retained variables.
2. It should be noted that the last term of the expression is given differently depending on
the source, with sometimes p + 1 or (p + 1) + 1 instead of p. It is the number of βi parameters
of the model that is (p + 1), i.e. the predictors plus the intercept (in some sources written as
"p" unlike here). The actual formulas are AIC = n + n log 2 + n log( SSResidn
) + 2(q + 1) and
SSResid
BIC = n + n log 2 + n log( n ) + log(n)(q + 1) for a model with q = p + 1 parameters
(β0 to βp ) and σ 2 taken into account as well. However, the difference of AIC or BIC values
between two models - the quantity of interest in an iterative search algorithm - will be the
same regardless of these subtleties. More details can be found in [20].
183 Practical Part (Application)
3.1 Objectives
This work aims at providing some insights into the success factors of syn-
dicates and at translating those into a segmentation method that can assist
the investment decisions of PartnerRe as capital provider to syndicates. This
implies that the following main steps should be taken:
1. Make an inventory of available data and find a way to use them in a
practical way (Section 3.2).
2. Search for factors that are associated with syndicate profitability (Sec-
tions 3.3 and 3.4).
3. Combine the identified factors to a scoring system that can be used to
rank syndicates (Section 3.5).
4. Compare the performance of this scoring system to other available
methods in terms of benefits and costs (Section 3.6).
The first objective is closely related to other projects of PartnerRe’s "Capi-
tal at Lloyd’s" team which go beyond the scope of pure syndicate segmentation
and are therefore not discussed here.
For achieving the second objective, a combination of expert knowhow and
mathematical modeling was considered as most promising. Linear model
building is thus used to complement the intuition of professionals with many
years of experience.
The methodologies and discussions relating to the third objective are mostly
confidential and thus presented in Appendix II. Nevertheless, a brief high level
summary of this part is given in the main document.
The conclusions from the fourth objective are in the end placed in the
practical context of PartnerRe as a capital provider to Lloyd’s syndicates.
3.2 Availability and quality of data
This section concerns the objective number 1 set above (Section 3.1),
namely making an inventory of available data in order to find ways to use
them in a practical way.
Quantitative and qualitative data are discussed separately.
3.2.1 Quantitative data
Data about Lloyd’s syndicates was combined from several different sources:
— SRL Syndicate Peer Data, an Excel file published quarterly
— Lloyd’s Statistics, a set of Excel files published annually
19— APCL brochure, a series of syndicate profiles published annually
— SRL Syndicate Profiles, a series of syndicate profiles updated at irreg-
ular intervals
In general, all these sources provide high quality data.
APCL data is not really usable for a segmentation method that should
cover all the syndicates because it is only available for the syndicates with
which APCL is dealing (fewer than 30 syndicates).
The main weakness of the data is the lack of data for certain years and for
certain syndicates.
For the data that comes from financial statements, it is supposed that the
accuracy of the data is high.
Accuracy might be less high for variables that are based on some undis-
closed analysis by the data providers. For example the variable "Lloyd’s Busi-
ness as % Group Total" is based on some analysis by SRL which we did not
try to reproduce and double-check.
Selected quantitative data used for linear model building:
As preparation for the linear model building process described in Section
3.4 below, a subset of the available data was chosen. For linear model building,
it is desirable to have a high number of data points. That is why a certain
set of variables was chosen for which data availability is high and/or which
are considered as relevant in modeling profitability. These selected elementary
variables are presented in Table 3.
The annual accounting profit and loss statement of each syndicate is avail-
able in the Lloyd’s Statistics. This is therefore a good starting point for a
series of variables. Attention has to be paid to the signs of the different vari-
ables. Table 3 therefore contains a column that describes which variable is
given with which sign.
3.2.2 Qualitative data
There are various types of qualitative data that one might want to take
into account as well.
Subjective impressions of PartnerRe underwriters who have practical ex-
perience in dealing with syndicates have been collected as -/0/+ along with
explanatory comments. These data are not used for the model building or
the segmentation, but they can be displayed next to the ranked syndicates as
additional information.
In the different descriptive text paragraphs in the syndicate profiles pro-
vided by SRL and APCL, there is also a lot of useful information. However,
practically speaking, the extraction of this information is not straightforward.
20Table 3 – Selected variables for linear model building. Labels with S refer to SRL data while labels with L refer to the Statistics. The labels are introduced to facilitate the definition of candidate predictors based on variable transfor- mations, see Table 4. Net Earned Premiums, net of reinsurance (NEP) is different from Net Premiums Written, net of reinsurance (NPW), which can be calculated by adding L1 and L2. Label Description Unit Typical sign S1 Capacity GBPm always >0 S2 Lloyd’s Business as % Group Total % always >0 S3 Aligned Dedicated Share of Syndicate Capacity % % always >0 L1 Gross Premiums Written (GPW) GBPm >0 income L2 Outward reinsurance premiums GBPm 0 income L4 Syndicate investment return GBPm >0 income L5 Claims paid gross amount GBPm 0 income L7 Change in provision for claims gross amount GBPm 0 income L9 Operating expenses acquisition cost GBPm
ple, it would be imaginable to build two separate segmentation methods with
one aiming at maximizing profitability and the other aiming at minimizing
volatility. One could then take the intersection of the two rankings, i.e. the
syndicates which are ranked high in both of them.
    However, this approach was discarded because the presence of a low num-
ber of high-volatility syndicates can be accepted if the investment portfolio
is quite large. Given than PartnerRe is now participating in more than 10
syndicates, it can accept small shares of syndicates with a high volatility.
    That is why the focus was laid purely on profitability in this segmentation
work. The considerations relating to volatility remain to be applied at a later
stage, with different measures of volatility being potentially involved. The
standard deviation of profitability over a given time horizon (for example 4 or
8 years) is the most obvious measure of volatility. An alternative approach is
to look at the RDS percentages that the syndicates provide in their business
plans, which is in practice hindered by limited access to data. It can also
be a combination of the two that is used to create a score for filtering out
high-volatility syndicates if necessary.

    We would therefore like to identify measurable characteristics of
a syndicate which are associated with high profitability.
    Many of the characteristics of a syndicate are directly or indirectly re-
flected in certain variables for which data is available. The following list is
not exhaustive but gives a few examples of factors which might affect the
profitability of a syndicate:
    — The size of the syndicate resulting in economies of scale => consider
        the variable capacity or a variation thereof.
    — The experience accumulated within the syndicate => consider the age
        of the syndicate.
    — The riskiness of the business written, because as expected, a high
        volatility is usually associated with high profitability => consider the
        RDS percentages.
    — The efficiency of the operations of the syndicate => consider the ex-
        pense ratio (administrative and acquisition expenses divided by NEP).

3.3.2   Different ways of defining profitability
   Before going further, it has to be clear what we mean by profitability.
   It has already been defined that profitability is the financial result divided
by the capacity of a syndicate, as opposed to the capital (see Section 2.1.4
above).
   Next, it has to be clarified which accounting system we are considering. As
described in Section 2.1.3 above, there are some particularities of accounting at

                                       22
Lloyd’s, namely the difference between CAL and YOA. Both types of data are
used in this work depending on the context, so it is important to distinguish
them.
One can also look at different time horizons over which profitability can
be averaged in order to get a meaningful value despite the cyclic nature of the
(re)insurance market.
These degrees of freedom taken together result in a multitude of potential
definitions of profitability of a syndicate. They will be further explored in the
"Comments about taking averages" below.
To add to the complexity, it is not only the profitability of closed ac-
counting periods that could be considered as relevant, but also the forecasted
profitability of currently open YOAs. The most recent developments of a
syndicate could actually be of high importance for the segmentation.
Comments about forecasts of syndicates’ results:
Every quarter starting from the end of the fifteenth month of a YOA, i.e.
as of quarter 5, the MAs are establishing forecasts of their syndicates’ results.
Hence, for any analysis based on YOA results, the question arises whether
or not to take into account the forecasted results of the open YOAs. If they
are not taken into account, the latest developments are ignored. If they are
taken into account, the data availability between different syndicates diverges
because only the non-aligned syndicates are obliged to make these forecasts
public.
Also, it should be kept in mind that these are forecasts and that by nature
it is difficult to forecasts the returns of (re)insurance - a major loss event
might result in a significant deterioration of forecasted results. This is also
why forecasts are not even published before the fifteenth month of a YOA.
Moreover, the first forecasts come with a wide range between worst case
and best case. The midpoint of these two estimates is usually different from a
syndicates point-estimate. However, the latter, which is the more interesting
one, is not public information.
Finally, the trends observed in the development of forecasts over time often
follow the underwriter’s maxim "good years get better and bad years get worse"
[14]
All of these aspects should be kept in mind when thinking about profitabil-
ity.
Comments about taking averages:
When looking at profitability - expressed as percentage of capacity unless
indicated differently - it seems useful to look at long-term averages. However,
the question arises of how to choose the most suitable period.
23You can also read