Hypothesis Formalization: Empirical Findings, Software Limitations, and Design Implications - export.arXiv.org
←
→
Page content transcription
If your browser does not render page correctly, please read the page content below
Hypothesis Formalization: Empirical Findings, Software Limitations, and
                                        Design Implications

                                        EUNICE JUN, University of Washington, USA
                                        MELISSA BIRCHFIELD, University of Washington, USA
                                        NICOLE DE MOURA, Eastlake High School, USA
                                        JEFFREY HEER, University of Washington, USA
                                        RENÉ JUST, University of Washington, USA
arXiv:2104.02712v1 [cs.OH] 6 Apr 2021

                                        Data analysis requires translating higher level questions and hypotheses into computable statistical models. We present a mixed-methods
                                        study aimed at identifying the steps, considerations, and challenges involved in operationalizing hypotheses into statistical models, a
                                        process we refer to as hypothesis formalization. In a content analysis of research papers, we find that researchers highlight decomposing a
                                        hypothesis into sub-hypotheses, selecting proxy variables, and formulating statistical models based on data collection design as key steps.
                                        In a lab study, we find that analysts fixated on implementation and shaped their analysis to fit familiar approaches, even if sub-optimal. In
                                        an analysis of software tools, we find that tools provide inconsistent, low-level abstractions that may limit the statistical models analysts
                                        use to formalize hypotheses. Based on these observations, we characterize hypothesis formalization as a dual-search process balancing
                                        conceptual and statistical considerations constrained by data and computation, and discuss implications for future tools.

                                        ACM Reference Format:
                                        Eunice Jun, Melissa Birchfield, Nicole de Moura, Jeffrey Heer, and René Just. 2021. Hypothesis Formalization: Empirical Findings,
                                        Software Limitations, and Design Implications. 1, 1 (April 2021), 26 pages. https://doi.org/10.1145/nnnnnnn.nnnnnnn

                                        1   INTRODUCTION

                                        Using statistics to answer real-world questions requires four steps: (i) translating high-level, domain-specific questions
                                        and hypotheses into specific statistical questions [17]; (ii) identifying statistical models to answer the statistical questions;
                                        (iii) implementing and executing these statistical models, typically with the help of software tools; and (iv) interpreting
                                        the results, considering the domain-specific questions and applying analytical reasoning.
                                            For example, suppose a census researcher asked, “In the United States (U.S.), how does an individual’s sex relate to
                                        their annual income?” Drawing upon their prior experiences and exploratory data visualizations, the researcher knows
                                        that income in the U.S. is skewed, and they want to know how the distributions of income among males and females
                                        differ (step i). However, before implementing, they (implicitly) define their causal model: The researcher knows that
                                        other factors, such as education and race, may be associated with employment opportunities, which may then influence

                                        Authors’ addresses: Eunice Jun, emjun@cs.washington.edu, University of Washington, Seattle, Washington, USA; Melissa Birchfield, mbirch2@
                                        cs.washington.edu, University of Washington, Seattle, Washington, USA; Nicole de Moura, nicoledemoura4@gmail.com, Eastlake High
                                        School, Sammamish, Washington, USA; Jeffrey Heer, jheer@cs.washington.edu, University of Washington, Seattle, Washington, USA; René Just,
                                        rjust@cs.washington.edu, University of Washington, Seattle, Washington, USA.

                                        Permission to make digital or hard copies of all or part of this work for personal or classroom use is granted without fee provided that copies are not made or
                                        distributed for profit or commercial advantage and that copies bear this notice and the full citation on the first page. Copyrights for components of this work
                                        owned by others than ACM must be honored. Abstracting with credit is permitted. To copy otherwise, or republish, to post on servers or to redistribute to
                                        lists, requires prior specific permission and/or a fee. Request permissions from permissions@acm.org.
                                        © 2021 Association for Computing Machinery.
                                        Manuscript submitted to ACM

                                        Manuscript submitted to ACM                                                                                                                                  1
2 Eunice Jun, Melissa Birchfield, Nicole de Moura, Jeffrey Heer, and René Just
Fig. 1. Definition and overview of the hypothesis formalization steps and process.
Hypothesis formalization is a dual-search process of translating a conceptual hypothesis into a statistical model implementation. Blue
indicates steps and transitions that we identified. Black indicates steps and transitions discussed in prior work. “Mathematical Equation”
(dashed box) was rarely an explicit step in our lab study but evident in our content analysis. Our findings (blue arrows) subsume several
of the transitions identified in prior work. When they do not, prior work’s transitions are included in black. Hypothesis formalization is a
non-linear process. Analysts iterate over conceptual steps to refine their hypothesis in a hypothesis refinement loop. Analysts also iterate
over computational and implementation steps in a model implementation loop. Data collection and data properties may also prompt
conceptual revisions and influence statistical model implementation. As analysts move toward model implementation, they increasingly
rely on software tools, gain specificity, and create intermediate artifacts along the way (e.g., causal models, observations about data, etc.).
income. As such, they refine their conceptual hypothesis to consider the possible effects of race, education, sex, and
their interactions on income. They plan to fit a generalized linear model with race, education, sex, and their two-way
interactions as predictors of income (step ii). They start implementing a script to load and model data (step iii). The
researcher receives a small table of results and is surprised to receive a convergence warning. After further investigation,
they simplify their model and remove the interaction effects to see how that may affect convergence (revise step iii). This
time, their model converges, and they interpret the results (step iv), but they really want to study how sex and race interact,
so they return to implementation (step iii) and proceed as before, iteratively removing and adding effects and changing
computational parameters, and as a by-product shifting which high-level conceptual hypothesis is reflected in the model.
Performing statistical data analysis goes well beyond invoking the correct statistical functions in a software library.
Analysts, such as the census researcher, must go back and forth between conceptual hypothesis and model implementation
realities, grappling with domain knowledge, limitations of data, and statistical methods.
We refer to the process of translating a conceptual hypothesis into a computable statistical model as hypothesis
formalization. This process is messy and under-scrutinized, and consequently we investigate the steps, considerations,
challenges, and tools involved. Based on our findings, we define hypothesis formalization as a dual-search process [47]
that involves developing and integrating cognitive representations from two different perspectives—conceptual hypotheses
Manuscript submitted to ACMHypothesis Formalization: Empirical Findings, Software Limitations, and Design Implications 3
and concrete model implementations. Analysts move back and forth between these two perspectives during formalization
while balancing conceptual, data-driven, statistical, and implementation constraints. Figure 1 summarizes our definition
and findings. Specifically, the paper addresses the following questions:
• RQ1 - Steps: What is the range of steps an analyst might consider when formalizing a hypothesis? How do these
steps compare to ones that we might expect based on prior work?
• RQ2 - Process: How do analysts think about and perform the steps to translate their hypotheses into model
implementations? What challenges do they face during this process?
• RQ3 - Tools: How might current software tools influence hypothesis formalization?
To develop a broad understanding of the steps (RQ1 - Steps) and considerations (RQ2 - Process) involved in hypothesis
formalization, we first conducted a content analysis of 50 randomly sampled research papers across five different domains.
We find that researchers decompose their research hypotheses into specific sub-hypotheses, derive proxy variables from
theory and available data, and adapt statistical analyses to account for data collection procedures.
To validate and deepen our understanding of hypothesis formalization (RQ1 - Steps and RQ2 - Process), we designed
and conducted a lab study in which we observed 24 analysts develop and formalize hypotheses in-situ. We find that
analysts foreground implementation concerns, even when brainstorming hypotheses, and try to fit their hypotheses and
analyses to prior experiences and familiar tools, suggesting a strong influence of tools (RQ3 - Tools).
To identify how tools may shape hypothesis formalization (RQ3 - Tools), we reviewed 20 statistical software tools.
We find that although the tools support nuanced model implementations, their low-level abstractions can focus analysts on
statistical and computational details at the expense of higher-level reasoning about initial hypotheses. Tools also do not
aid analysts in identifying reasonable model implementations that would test their conceptual hypotheses, which may
explain why analysts in our lab study relied on familiar approaches, even if sub-optimal.
Our content analysis, lab study, and tools analysis inform one another and suggest three design implications for tools
to more directly support hypothesis formalization: (i) connect statistical model implementations to their mathematical
representations, (ii) provide higher-level abstractions for expressing conceptual hypotheses and partial model specifications,
and (iii) develop bidirectional computational assistance for authoring causal models and relating them to statistical models.
By defining and characterizing hypothesis formalization, we aim to advance the discourse around data analysis, more
precisely understand how people conduct data analysis, reveal opportunities for more transparent and reproducible
analyses, and inform future tools that support end-users in their analysis processes.
2 BACKGROUND AND RELATED WORK
Our work integrates and builds upon prior research on frameworks of scientific discovery, theories of sensemaking,
statistical practices, and empirical studies of data analysts.
2.1 Dual-search Model of Scientific Discovery
Klahr and Simon characterized scientific discovery as a dual-search process involving the development and evaluation
of hypotheses and experiments [47]. They posited that scientific discovery involved tasks specific to hypotheses (e.g.,
revising hypotheses) and to experiments (e.g., analyzing data collected from experiments), which they separated into two
different “spaces,” and tasks moving between them, which is where we place hypothesis formalization.
Extending Klahr and Simon’s two-space model, Schunn and Klahr proposed a more granular four-space model
involving data representation, hypothesis, paradigm, and experiment spaces [73, 74]. In the four-space model, conceptual
Manuscript submitted to ACM4 Eunice Jun, Melissa Birchfield, Nicole de Moura, Jeffrey Heer, and René Just
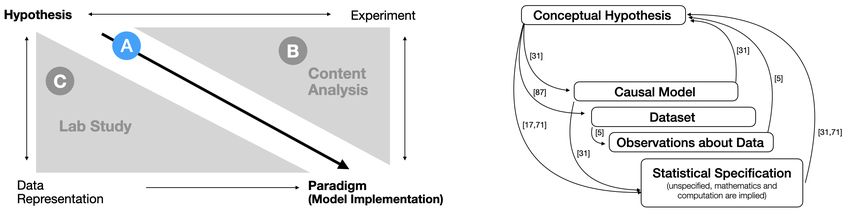
Fig. 2. Relationship between hypothesis formalization and prior work.
Left: Schunn and Klahr’s four-space model of scientific discovery (stylized adaptation from Figure 1 in [73]), which includes unidirectional
information flow from the hypothesis space to the paradigm space (which includes model implementation). Hypothesis formalization (A)
is focused on a tighter integration and the information flow between hypothesis and paradigm spaces. Specifically, the information flow
is bidirectional in hypothesis formalization. Our content analysis (B) and lab study (C) triangulate the four-space model to understand
hypothesis formalization from complementary perspectives. Right: Hypothesis formalization steps also identified in prior work on
theories of sensemaking, statistical thinking, and data analysis workflows (citations included to the right of the arrows). Hypothesis
formalization is finer grained and involves more iterations. While prior work broadly refers to mathematical equations, partial model
specifications, and computationally tuned model implementations as statistical specifications, hypothesis formalization differentiates
them. This paper provides empirical evidence for theorized loops between conceptual hypothesis and statistical specification (see
Figure 1).
hypothesizing still lies in the hypothesis space, and hypothesis testing and statistical modeling lies in the paradigm
space. As such, hypothesis formalization is a process connecting the hypothesis and paradigm spaces. In Schunn and
Klahr’s four-space model, information flows unidirectionally from the hypothesis space to the paradigm space. Here
we extend this prior research with evidence that hypothesis formalization involves both concept-to-implementation and
implementation-to-concept processes. (see Figure 1). Figure 2 augments Schunn and Klahr’s original diagram (Figure
1 in [73]) with annotations depicting how our content analysis of research papers and lab study triangulate a tighter
dual-space search between hypothesis and paradigm spaces with a focus on hypothesis formalization. Our mixed-methods
approach follows the precedent and recommendations of Klahr and Simon’s [48] study of scientific discovery activities.
2.2 Theories of Sensemaking
Human beings engage in sensemaking to acquire new knowledge. Several theories of sensemaking [49, 68, 71] describe
how and when human beings seek and integrate new data (e.g., observations, experiences, etc.) to develop their mental
models about the world.
Russell et al. [71] emphasize the importance of building up and evaluating external representations of mental models,
and define sensemaking as “the process of searching for a representation and encoding data in that representation to
answer task-specific questions.” External representations are critical because they influence the quality of conclusions
reached at the end of the sensemaking process and affect how much time and effort is required in the process. Some
representations may lead to insights more quickly. Russell et al. describe the iterative process of searching for and refining
external representations in a “learning loop complex” that involves transitioning back and forth between (i) searching for
and (ii) instantiating representations.
Grolemund and Wickham argued for statistical data analysis as a sensemaking activity [31]. They emphasize the (1)
bidirectional nature of updating mental models of the world and hypotheses based on data and collecting data based on
hypotheses and (2) the process of identifying and reconciling discrepancies between hypotheses and data. Their depiction
of the analysis process parallels Klahr and Simon’s framework of scientific discovery.
Manuscript submitted to ACMHypothesis Formalization: Empirical Findings, Software Limitations, and Design Implications 5
In this paper, we consider hypothesis formalization to be a learning loop [71] where the conceptual hypothesis is
an external representation of a set of assumptions analysts may have about the world (e.g., an implicit causal model),
that ultimately affects which models are specified and which results are obtained. We found that that there are smaller
learning loops as analysts search for and revise intermediate representations, such as explicit causal models, mathematical
equations, or partially specified models. The hypothesis and model refinement loops can themselves be smaller learning
loops embedded in the larger loop of hypothesis formalization.
2.3 Statistical Thinking
Statistical thinking and practice require differentiating between domain and statistical questions. The American Statistical
Association (ASA), a professional body representing statisticians, recommends that universities teach this fundamental
principle in introductory courses (see Goal 2 in [17]).
Similarly, researchers Wild and Pfannkuch emphasize the importance of differentiating between and integrating
statistical knowledge and context (or domain) knowledge when thinking statistically [65, 66, 87]. They propose a four step
model for operationalizing ideas (“inklings”) into plans for collecting data, which are eventually statistically analyzed. In
their model, analysts must transform “inklings” into broad questions and then into precise questions that are then finally
turned into a plan for data collection (see Figure 2 in [87]). Statistical and domain knowledge inform all four stages.
However, it is unknown what kinds of statistical and domain knowledge are helpful, how they are used and weighed
against each other, and when certain kinds of knowledge are helpful to operationalize inklings. Our work provides more
granular insight into Wild and Pfannkuch’s proposed model of operationalization and aims to answer when, how, and
what kinds of statistical and domain knowledge are used during statistical data analysis.
More recently, in Statistical Rethinking [58], McElreath proposes that there are three key representational phases
involved in data analysis: conceptual hypotheses, causal models underlying hypotheses (which McElreath calls “process
models”), and statistical models. McElreath, like the ASA and Wild and Pfannkuch, separates domain and statistical
ideas and discusses the use of causal models as an intermediate representation to connect the two. McElreath emphasizes
that conceptual hypotheses may correspond to multiple causal and statistical models, and that the same statistical model
may provide evidence for multiple, even contradictory, causal models and hypotheses. McElreath’s framework does not
directly address how analysts navigate these relationships or how computation plays a role, both of which we take up in
this paper.
Overall, our work provides empirical evidence for prior frameworks but also (i) provides more granular insight into
how and why transitions between representations occur and (ii) scrutinizes the role of software and computation through
close observation of analyst workflows in the lab as well as through a follow-up analysis of statistical software. Based on
these observations, we also speculate on how tools might better support hypothesis formalization.
2.4 Empirical Studies of Data Analysts
Data analysis involves a number of tasks that involve data discovery, wrangling, profiling, modeling, and reporting [45].
Extending the findings of Kandel et al., both Alspaugh et al. [1] and Wongsuphasawat et al. [88] propose exploration as a
distinct task. Whereas Wongsuphasawat et al. argue that exploration should subsume discovery and profiling, Alspaugh et
al. describe exploration as an alternative to modeling. The importance of exploration and its role in updating analysts’
understanding of the data and their goals and hypotheses is of note, regardless of the precise order or set of tasks. Battle
and Heer describe exploratory visual analysis (EVA), a subset of exploratory data analysis (EDA) where visualizations
are the primary outputs and interfaces for exploring data, as encompassing both data-focused (bottom-up) and goal- or
Manuscript submitted to ACM6 Eunice Jun, Melissa Birchfield, Nicole de Moura, Jeffrey Heer, and René Just
hypothesis-focused (top-down) investigations [5]. In our lab study, we found that (i) analysts explored their data before
modeling and (ii) exploratory observations sometimes prompted conceptual shifts in hypotheses (bottom-up) but at other
times were guided by hypotheses and only impacted statistical analyses (top-down). In this way, data exploration appears
to be an important intermediate step in hypothesis formalization, blurring the lines between exploratory and confirmatory
data analysis.
Decisions throughout analysis tasks can give rise to a “garden of forking paths” [27], which compounds for meta-
analyses synthesizing previous findings [44]. Liu, Boukhelifa, and Eagan [53] proposed a broad framework that char-
acterizes analysis alternatives using three different levels of abstraction: cognitive, artifact, and execution. Cognitive
alternatives involve more conceptual shifts and changes (e.g., mental models, hypotheses). Artifact alternatives pertain
to tooling (e.g., which software is used for analysis?), model (e.g., what is the general mathematical approach?), and
data choices (e.g., which dataset is used?). Execution alternatives are closely related to artifact alternatives but are more
fine-grained programmatic decisions (e.g., hyperparameter tuning). We find that hypothesis formalization involves all
three levels of abstraction. We provide a more granular depiction of how these levels cooperate with one another.
Moreover, Liu, Althoff, and Heer [54] identified numerous decision points throughout the data lifecycle, which they
call end-to-end analysis. They found that analysts often revisit key decisions during data collection, wrangling, modeling,
and evaluation. Liu, Althoff, and Heer also found that researchers executed and selectively reported analyses that were
already found in prior work and familiar to the research community. Hypothesis formalization is comprised of a subset
of steps involved in end-to-end analysis. Thus, we expect hypothesis formalization will be an iterative process where
domain norms will influence decision making. It is nonetheless valuable to provide insight into how a single iteration
— from a domain-specific research question to a single instantiation of a statistical model (among many alternatives
which may be subsequently explored) — occurs. Our depiction of hypothesis formalization aims to account for more
domain-general steps and artifacts, but we recognize that domain expertise and norms may determine which paths and
how quickly analysts move through hypothesis formalization.
In summary, our work differs in (i) scope and (ii) method from prior work in HCI on data analysis practices. Whereas
hypothesis formalization has remained implicit in prior descriptions of data analysis, we explicate this specific process.
While previous researchers have relied primarily on post-analysis interviews with analysts, our lab study enables us to
observe decision making during hypothesis formalization in-situ.
2.5 Expected Steps in Hypothesis Formalization
Towards our first research question (RQ1 - Steps), prior work suggests that hypothesis formalization involves steps in
three categories: conceptual, data-based, and statistical. Conceptually, analysts develop conceptual hypotheses and causal
models about their domain that guides their data analysis. With respect to data, analysts explore data and incorporate
insights from exploration, which can be top-down or bottom-up, into their process of formalizing hypotheses. The
statistical concerns analysts must address involve mathematical and computational concerns, such as identifying a
statistical approach (e.g., linear modeling), representing the problem mathematically (e.g., writing out a linear model
equation), and then implementing those using software. In our work, we find evidence to support separating statistical
considerations into concerns about mathematics, statistical specification in tools, and model implementation using tools.
A key observation about prior work is that there is a tension between iterative and linear workflows during hypothesis
formalization. Although sensemaking processes involve iteration, concerns about methodological soundness, as evidenced
in pre-registration efforts that require researchers to specify and follow their steps without deviation, advocate for,
or even impose, more linear processes. More specifically, theories of sensemaking that draw on cognitive science, in
Manuscript submitted to ACMHypothesis Formalization: Empirical Findings, Software Limitations, and Design Implications 7
particular [31, 71], propose larger iteration loops between conceptual and statistical considerations. Research concerning
statistical thinking and practices [17, 87] appear less committed to iteration. Empirical work in HCI on data analysis
embraces iteration during exploration and observes iteration during some phases of confirmatory data analysis, such as
statistical model choice, but not in others, such as tool selection. In our work, we are sensitive to this tension and aim to
provide more granular insight into iterations and linear processes involved in hypothesis formalization. We also anticipate
that the steps identified in prior work will recur in our content analysis and lab study, but we do not limit our investigation
to these steps.
3 CONTENT ANALYSIS OF RESEARCH PAPERS
To identify what actions analysts take to formalize hypotheses (RQ1 - Steps) and why (RQ2 - Process), we examined 50
peer-reviewed publications. For breadth, we sourced the papers from five different domains.
3.1 Methods
Dataset: Our dataset consisted of 50 randomly sampled papers published in 2019, ten from each of following venues: (1)
the Proceedings of the National Academy of Sciences (PNAS), (2) Nature, (3) Psychological Science (PS), (4) Journal
of Financial Economics (JFE), and the (5) ACM Conference on Human Factors in Computing Systems (CHI). We
sampled papers that used statistical analyses as either primary or secondary methodologies from these venues because they
represent a plurality of domains and Google Scholar listed them among the top three in their respective areas in 2018.1
We analyzed published papers because researchers are not only likely but required to report significant operationalization
choices in their publications. Finally, we focused on papers published in 2019 to capture most recent practices.2
Analysis Approach: When coding and analyzing the papers, we were interested in learning about the breadth of steps
involved in hypothesis formalization rather than assessing how well papers fit a predetermined set of steps. We also wanted
to detect any co-occurrence or ordering among steps. Based on these considerations, the first two authors iteratively
developed a codebook to code papers at the paragraph-level. The codebook contained five broad categories: (i) research
goals, (ii) data sample information, (iii) statistical analysis, (iv) results reporting, and (v) computation. Each category had
more specific codes to capture more nuanced differences between papers. For example, research goals could be statements
or questions about something unknown, or focused examinations of possible associations between constructs, among
other codes. This tiered coding scheme enabled us to see general content patterns across papers and nuanced steps within
papers. The first two authors reached substantial agreement (IRR = .69 - .72) even before resolving disagreements. The
first three authors then (i) read and coded all sections of papers except the figures, tables, and auxiliary materials;3 (ii)
discussed and summarized the papers’ goals and main findings to ensure comprehension and identify contribution types;
and (iii) visualized and scrutinized each paper as a “reorderable matrix” [6]. Our supplementary materials include our
codebook with definitions and examples and summaries, citations, and matrices for each paper.
3.2 Findings
We coded a total of 2,989 paragraphs across 50 papers. Results were the most commonly discussed topic. Approximately
31% of the paragraphs (in 50 papers) discussed interpretations of statistical results, and 11% (in 37 papers) provided
1
Venues were often clustered in the rankings without an obvious top-one, so we chose among the top three based on ease of access to publications (e.g.,
open access or access through our institution).
2
Some papers were accepted and published before 2019, but the journals had included them in 2019 issues.
3
PNAS and Nature papers included a materials and methods section after references that were distinct from extended tables, figures, and other auxiliary
material. We coded the materials and methods sections.
Manuscript submitted to ACM8 Eunice Jun, Melissa Birchfield, Nicole de Moura, Jeffrey Heer, and René Just
details about statistical results (e.g., parameter estimates). Interpreted results often co-occurred with statistical results. 21%
of paragraphs (in 40 papers) described data collection design (e.g., how the experiment was designed, how the data were
collected, etc.). Specifications of statistical models appeared in 19% of paragraphs (in 50 papers). 11% of paragraphs (in
45 papers) discussed proxy variables, or measures to quantify abstract constructs (e.g., music enjoyment).
Researchers mentioned software used for statistical analysis in 3% of paragraphs (in 25 papers), sometimes even
specifying function names and parameters, a level of detail we did not expect to find in publications. To our surprise, more
papers mentioned software than included equations. Only fifteen papers (JFE: 9, PS: 5, PNAS: 1) included equations in a
total of 71 paragraphs. This suggests that mathematical equations, though part of the hypothesis formalization process,
are less important to researchers than their tool-specific implementations.
Papers published in PNAS and Nature had noticeably different structures than the CHI, JFE, and PS papers. The
PNAS and Nature papers decoupled research goals, data sample properties, and results (in the main paper body) from
data collection design and statistical analysis (in the appended materials and methods section). For individual studies
in the CHI, JFE, and PS papers, codes repeated in noticeably linear patterns from research goals to data collection and
sample information to proxy variables and statistical analyses to results. We also examined papers’ contribution types,
identifying those that presented empirical findings (41 papers), validated a prototype system (8 papers), or developed
a new methodology (6 papers). We include a detailed description of paper contributions and venue differences in our
supplementary material.
3.2.1 Researchers decompose hypotheses into sub-goals that correspond to statistical analyses. In approximately
70% of papers in the corpus, we found that researchers deconstructed their motivating research questions and overarching
hypotheses into more tightly scoped objectives or relationships of interest that map to specific statistical analyses.
For example, in [22], the researchers asked how theories of macroevolution varied across groups of species. The
authors divided pre-existing hypotheses into three classes of hypotheses and assessed each class in turn. For one class
of “geometric” hypotheses about insect egg size, the researchers discriminated between two opposing hypotheses by
examining “the scaling exponent of length and width (the slope of the regression of log-transformed length and log-
transformed width).” As this example demonstrates, hypothesis formalization involves an iterative hypothesis refinement
process at the conceptual level. This refinement process distills hierarchies of hypotheses and/or a single conceptual
hypothesis into sub-hypotheses and formalizes these sub-hypotheses in statistical model implementations. Researchers
also relate sub-hypotheses to one other during this process, which implies their causal models about the motivating
conceptual hypothesis (and domain).
3.2.2 Researchers concretize hypotheses using proxies that are based on theory or available data. Proxy variables
further refine conceptual hypotheses by identifying how observable some concepts are, measuring the observable ones,
indirectly measuring the less observable ones, and comparing measurement choices to other possible measures or ideal
scenarios. As such, proxy variable selection is an important transition step between conceptual and data concerns during
hypothesis formalization.
When defining proxy variables, researchers (i) used previously validated measures when available for theoretical
and methodological soundness, such as the Barcelona Music Reward Questionnaire (BMRQ) to measure music reward
(in [36]), or (ii) developed new measures as a research contribution. For example, in [26], the authors develop an EEG-
based measure for “immersiveness” in VR they demonstrated to be superior to previous measures that required halting
immersive VR experiences to ask users about immersion. Researchers also sometimes justified choosing proxies based on
available data. For example, in [29], the researchers wanted to develop a proxy variable for job rank based on titles and
Manuscript submitted to ACMHypothesis Formalization: Empirical Findings, Software Limitations, and Design Implications 9
“financial outcomes” (e.g., compensation, bonuses, etc.) to see if housing bankers were promoted or demoted after the
2008 stock market crash. However, because the financial outcomes were not public, the researchers relied on title only to
compare bankers’ ranks, which was sub-optimal because job titles differ between companies.
Researchers consider their proxy choices as study limitations and consider alternative proxies to ensure that their
findings are robust. Validating findings with multiple proxies suggests that hypothesis formalization can be a recursive
process. Proxies lead to follow-up hypotheses about possible latent measurement factors, for instance, which in turn lead
to additional analyses that address the same conceptual hypothesis.
3.2.3 Data collection and sampling influence statistical analysis. Researchers often described their data sampling and
study design as factors that necessitated additional steps in their analysis process. In [7] and [64], researchers accounted
for effects of task order in their study protocol by running additional regressions or analyzing tasks separately. Researchers
also ran initial analyses to assess the effect of possibly confounding variables in their study design, such as gender in [20]
or location of stimuli in [83]. Other times, researchers performed robustness checks after their main analyses, such as in
response to a gender imbalance in [64] and possible sample selection biases due to database constraints in [38].
Although data collection driven by statistical modeling plans was expected of replication studies (e.g., [7, 64, 89])
or papers that make methodological contributions (e.g., [15, 16]), we found an instance in [2]—neither replication nor
methodological contribution—where researchers explicitly reported selecting a statistical model before designing their
study. The researchers chose to use a well-validated computational model, the linear ballistic accumulator (LBA), to
quantify aspects of human decision making. This model selection influenced the way they designed their study protocol
so that they could obtain a sample large enough for accurate parameter estimation.
Based on these observations, it seems that modeling choices more frequently react to data collection processes and
possible sample biases, following a linear data collection-first process implied by prior work. However, there are also
instances where model implementation comes first and researchers’ data collection procedures must adhere to modeling
needs, suggesting a previously missing loop between statistical model implementation and data collection that is separate
from any influences conceptual hypotheses have on data collection.
3.3 Takeaways from the Content Analysis
The content analysis confirmed prior findings on (i) the connection between hypotheses and causal models, (ii) the
importance of proxies to quantify concepts, and (iii) the constraints that data collection design and logistics place on
modeling. Extending prior work, the content analysis also (i) suggested that decomposing hypotheses into specific
objectives is a mechanism by which conceptual hypotheses relate to causal models; (ii) crystallized the hypothesis
refinement loop involving conceptual hypotheses, causal models and proxies; and (iii) surfaced the dual-search nature of
hypothesis formalization by suggesting that model implementation may shape data collection.
The content analysis also raised questions about how much the pressures to write compelling scientific narratives [46]
influence which aspects of hypothesis formalization are described or omitted (e.g., in practice, model implementations
may constrain data collection more often than we found in our dataset), how the steps are portrayed linearly even though
the process may have been more iterative, how analysts determine which tools to use, and how analysts without domain
expertise may approach hypothesis formalization differently. These questions motivated us to design and conduct a
lab study to provide greater visibility into how analysts who are not necessarily researchers approach the process with
expectations of rigor but without pressure of publication.
Manuscript submitted to ACM10 Eunice Jun, Melissa Birchfield, Nicole de Moura, Jeffrey Heer, and René Just
4 EXPLORATORY LAB STUDY
To understand analysts’ considerations (RQ2 - Process) while formalizing their hypotheses (RQ1 - Steps), as well as the
role of statistical software in this process (RQ3 - Tools), we designed and conducted a virtual lab study.
4.1 Methods
Analysts: We recruited 24 data analysts with experience in domains ranging from marketing to physics to education,
through Upwork (22) and by word of mouth (2). Twelve analysts worked as scientists, freelance data scientists, project
managers, or software engineers. Six were currently enrolled in or just finished graduate programs that involved data
analysis. Five identified as current or recent undergraduates looking for jobs in data science. One was an educator.
Analysts self-reported having significant experience on a 10-point scale adapted from [24] (min=2, max=10, mean=6.4,
std=2.04) and would presumably have familiarity with hypothesis formalization.
Protocol: Based on our content analysis findings, we designed and conducted a lab study with three parts. We compensated
analysts $45 for their time. The first author conducted the study and took notes throughout. Parts 1 and 3 were recorded
and automatically transcribed using Zoom.
Part 1: Structured Tasks. Part 1 asked analysts to imagine they were leading a research team to answer the following
research question: “What aspects of an individual’s background and demographics are associated with income after they
have graduated from high school?”4 We asked analysts to complete the following tasks:
• Task 1: Hypothesis generation. Imagining they had access to any kind of data imaginable, analysts brainstormed at
least three hypotheses related to the research question.
• Task 2: Conceptual modeling. Next, analysts saw a sample data schema and developed a conceptual model for one
or more of their hypotheses. We used the term “conceptual model” instead of “causal model” to avoid (mis)leading
analysts. We provided the following definition: “A conceptual model summarizes the process by which some
outcome occurs. A conceptual model specifies the factors you think influence an outcome, what factors you think
do not influence an outcome, and how those factors might interact to give rise to the outcome.”
• Task 3: Statistical model specification. Finally, we presented analysts with a sample dataset and instructed them to
specify but not implement a statistical model to test one or more of their hypotheses.
After the three tasks, we conducted a semi-structured interview with analysts about (i) their validity concerns5 and (ii)
experiences. To help us contextualize our observations and assess the generalizability of our findings, we asked analysts
to compare the study’s structure and tasks to their day-to-day data analysis practices.
Part 2: Take-home analysis. After the first Zoom session, analysts implemented their analyses using the previously
shown dataset, shared any analysis artifacts (e.g., scripts, output, visualizations, etc.), and completed a survey about their
implementation experience. Prior to Part 3, the first author reviewed all submitted materials and developed participant-
specific questions for the final interview.
Part 3: Final Interview. The first author asked analysts to give an overview of their analysis process and describe the
hypotheses they tested, how their analysis impacted their conceptual model and understanding, why they made certain
implementation choices, what challenges they faced (if any), and any additional concerns about validity.
Materials: The data schema and dataset used in the study came from a publicly available dataset from the Pew Research
Center [79]. Each task was presented in a separate document. All study materials are included as supplementary material.
4
We chose the open-ended research question about income after high school because we expected it to be widely approachable and require no domain
expertise to understand.
5
If analysts were unfamiliar with the term “validity,” we rephrased the questions to be about “soundness” or “reliability.”
Manuscript submitted to ACMHypothesis Formalization: Empirical Findings, Software Limitations, and Design Implications 11
Analysis: The first author reviewed the analysts’ artifacts multiple times to analyze their content and structure; thematically
analyzed notes and transcripts from analysts’ Zoom sessions; and regularly discussed observations with the other authors
throughout analysis.
4.2 Findings and Discussion
Eighteen of the 24 analysts we recruited completed all three parts of the study. The other six analysts completed only the
first Zoom session. In our analysis, we incorporate data from all analysts for as far as they completed the study.
We found that analysts had four major steps (RQ1 - Steps) and considerations (RQ2 - Process): (i) identifying or
creating proxies, (ii) fitting their present analysis to familiar approaches, (iii) using their tools to specify models (RQ3 -
Tools), and (iv) minimizing bias by being data-based. Analysts also faced challenges acquiring and incorporating domain
and statistical knowledge (RQ2 - Process).
4.2.1 Analysts consider proxies and data collection while articulating hypotheses. We encouraged analysts to not
consider the feasibility of collecting data while brainstorming hypotheses. Yet, while brainstorming hypotheses, analysts
expressed concern with how to measure constructs [A2, A5, A8, A12, A18, A22, A24] and how to obtain data [A2, A6,
A8, A9, A11, A21, A24].
For instance, A18 grappled with the idea of ‘privilege’ and how to best quantify it:
“I’m trying to highlight the fact that those who will be privileged before graduation...that experience will
enable them to make again more money after graduation. I won’t say ‘privilege’ because we need to quantify
and qualify for that...it’s just an abstract term.”
Eventually, A18 wrote two separate hypotheses about ‘privilege,’ operationalizing it as parental income: (1) “People with
higher incomes pre graduating, end up having higher differences between pre and post graduation incomes than those
with lower incomes pre graduation.” and (2) “People with parents with lower incomes tend to have lower incomes pre
graduation than those with parents with higher incomes.”
A18 continued to deliberate ‘privilege’ as measured by low and high income, saying, “...again you need to be careful
with low and high because these are just abstract terms. We need to quantify that. What does it mean to be ‘low?’ What
does it mean to be ‘high?’”. Finally, A18 decided to “maybe use the American standards for low income and high income.”
Although an accepted “American standard” may not exist, A18 nevertheless believed that cultural context was necessary
to specify because it could provide a normalizing scale to compare income during analysis, demonstrating how analysts
plan ahead for statistical modeling while brainstorming and refining hypotheses.
Similarly, A2 was very specific about how to measure personality: “More extraverted individuals (extraversion
measured using the corresponding social network graph) are likely to achieve higher yearly income later in life.”
In the presence of the data schema, more analysts were concerned with proxies [A2, A5, A6, A7, A8, A9, A16, A18,
A21]. Some even adapted their working definitions to match the available data, similar to how researchers in the content
analysis determined proxies based on data. For instance, A8, who hypothesized that “individuals interested in STEM
fields tend to earn more post high school than individuals interested in other fields,” operationalized “interest” as “Major”
— a variable included in the data schema — even though they had previously brainstormed using other proxies such as
club attendance in high school.
These analysts’ closely related considerations of data and concept measurement demonstrate how conceptual hypotheses
and data collection may inform each other, corroborating our findings from the content analysis.
Manuscript submitted to ACM12 Eunice Jun, Melissa Birchfield, Nicole de Moura, Jeffrey Heer, and René Just
Fig. 3. Sample statistical specification (A8).
The lab study tasked analysts to specify their statistical models without considering implementation. Analyst A8 wrote a list (split
across two pages) of detailed steps involved in creating new variables, cleaning and wrangling data, visualizing data, and testing their
hypothesis. We expected analysts would articulate their statistical models mathematically. Instead, analysts specified their statistical
models using todo lists and summaries of steps, which sometimes included mentions of software tools, showing that implementation was
an important consideration and that tool familiarity may limit which statistical models analysts consider and implement.
4.2.2 Analysts consider implementation and tools when specifying statistical models. When we asked analysts to
specify their models without considering implementation, we anticipated they would write mathematical models that they
could then implement using their tools because (a) some researchers in the literature survey did so in their papers and (b)
several analysts mentioned having years of analysis experience. However, despite the explicit instruction to disregard
implementation, 16 analysts provided to-do lists or summaries of steps to perform a statistical analysis as their model
specifications [A1, A2, A3, A5, A7, A8, A9, A11, A12, A14, A16, A18, A20, A21, A22, A24]. Only one analyst, A19
(6/10 analysis experience), attempted to specify their models mathematically but gave up because although they knew the
general form of logistic regression, they did not know how to represent the specific variables in the model they wanted to
perform.
For example, A8 (7/10 for analysis experience), specified a list of steps that included creating new variables that
aggregated columns in the dataset, cleaning and wrangling the data, visualizing histograms, performing chi-squared
test, and interpreting the statistical results. Notably, A8 also specified null and alternative hypotheses, which acted as an
intermediate artifact during hypothesis formalization. Figure 3 shows A8’s statistical specification.
Nine analysts went so far as to mention specific libraries, even functions, that they would use to program their analyses
[A3, A9, A12, A13, A14, A16, A19, A21, A23]. In their reflective interviews, analysts also expressed that they often do
not specify models outside of implementing them, which A19 succinctly described:
“I don’t normally write this down because all of this is in a [software] library.”
The implementation and software details analysts discussed and included in their specifications suggest that analysts
skip over mathematical equations and jump to specification and implementation in their tools even though some papers
included equations as an intermediate step in our content analysis. Additionally, analysts’ statistical knowledge is situated
Manuscript submitted to ACMHypothesis Formalization: Empirical Findings, Software Limitations, and Design Implications 13
in the programs they write, and their knowledge of and familiarity with tools constrains the statistical methods they
explore and consider. As such, tools may be a key point of intervention for guiding analysts toward statistical methods
that may be unfamiliar but are best suited for their conceptual hypotheses.
4.2.3 Analysts try to fit analyses to previous projects and familiar approaches. Analysts spent significant thought
and time categorizing their analyses as “prediction”, “classification” or “correlation” problems [A2, A3, A7, A10, A11,
A18, A19, A21, A22]. To categorize, analysts relied on their previous projects. While reflecting on their typical analysis
process, A21 said,
“I usually tend to jump...to look at data and match [the analysis problem] with similar patterns I have
seen in the past and start implementing that or do some rough diagrams [for thinking about parameters,
data type, and implementation] on paper...and start implementing it.”
Analysts also looked at variable data types (i.e., categorical or continuous) to categorize. For example, A3 pivoted
from thinking about predicting income to classifying income groups (emphasis added) based on data type information:
“The income, the column, the target value here, is categorical. I think maybe it wouldn’t be a bad idea to
see what classification tasks, what we could do. So instead of trying to predict because we’re not trying to
predict an exact number, it seems...like more of a classification problem...”
A provocative case of adhering to prior experiences was A6. Although several analysts were surprised and frustrated
that income was ordinal in the dataset with categories such as“Under $10K,” “$10K to $20K,” “$20K to $30K,” up to
”150K+”, none went so far as A6 to synthetically generate normally distributed income data so that they could implement
the linear regression models they had specified despite saying they knew that income was not normally distributed.
When asked further about the importance of normal data, A6, a research scientist, described how they plan analyses
based on having normal data, strive to collect normally distributed, and rely on domain knowledge to transform the data
to be normal when it may not be after collection:
“...I feel like having non normal data is something that’s like hard for us to deal with. Like it just kind of
messes everything up like. And I know, I know it’s not always assumption of all the tasks, but just that we
tend to try really hard to get our variables to be normally distributed. So, you know, we might like transform
it or, you know, kind of clean it like clean outliers, maybe transform if needed...I mean, it makes sense
because like a lot of measures we do use are like depressive symptoms or anxiety symptoms and kind of
they’re naturally normally distributed...I can probably count on my hand the number of non parametric
tests I’ve like included in manuscripts.”
A6’s description of their day-to-day analyses exemplifies the dual-search nature of hypothesis formalization: Analysts (i)
jump from hypothesis refinement to model specification or implementation with specific proxies in mind and then (ii)
collect and manipulate their data to fit their model choices.
We recognize that analysts may have taken shortcuts for the study they would not typically make in real life. Neverthe-
less, the constraints we imposed by using a real-world dataset are to be expected in real-world analyses. Therefore, our
observations still suggest that rather than consider the nature and structure of their hypotheses and data to inform using
new statistical approaches, which statistical pedagogy and theory may suggest, analysts may choose familiar statistical
approaches and mold their new analyses after previous ones.
4.2.4 Analysts try to minimize their biases by focusing on data. Throughout the study, analysts expressed concern
that they were biasing the analysis process. Analysts drew upon their personal experiences to develop hypotheses
Manuscript submitted to ACM14 Eunice Jun, Melissa Birchfield, Nicole de Moura, Jeffrey Heer, and René Just
[A5, A10, A13, A15, A16, A20, A21, A24] and conceptual models [A8, A12, A20, A24]. A12 described how their
personal experiences may subconsciously bias their investigation by comparing a hypothetical physicist and social worker
answering the same research question:
“Whereas a social worker by design...they’re meant to look at the humanity behind the numbers [unlike
a physicist]. So like, they may actually end up with different results...actually sitting in front of this data,
trying to model it.”
A few analysts even refused to specify conceptual models for fear of biasing the statistical analyses [A10, A11, A19].
On the surface, analysts resisted because they believed that some relationships, such as the effect of age on income,
were too “obvious” and did not warrant documentation [A10, A11]. However, relationships between variables that were
“obvious” to some analysts were not to others. For instance, A10 described how income would plateau with age, but other
analysts, such as A18 while implementing their analyses, assumed income would monotonically increase with age.
When we probed further into why A10, A11, and A19 rejected a priori conceptual models, they echoed A10’s belief
that conceptual models “put blinders on you.” Even the analysts who created conceptual models echoed similar concerns
of wanting to “[l]et the model do the talking” in their implementations [A3, A15, A18, A19]. Instead of conceptual
modeling, A10 chose to look at all n-ary relationships in the dataset to determine which variables to keep in a final
statistical model, saying,
“It’s so easy to run individual tests...You can run hypothesis tests faster than you can actually think of
what the hypothesis might be so there’s no need to really presuppose what relationships might exist [in a
conceptual model].”
Of course, one could start from the same premise that statistical tests are so easy to execute and conclude that conceptual
modeling is all the more important to prioritize analyses and prevent false discoveries.
Similarly, analysts were split on whether they focused their implementation exclusively on their hypotheses or examined
other relationships in the dataset opportunistically. Nine analysts stuck strictly to testing their hypotheses [A1, A4, A5,
A6, A7, A11, A13, A20, A24]. However, five analysts were more focused on exploring relationships in the dataset and
pushed their hypotheses aside [A2, A3, A10, A16, A18], and an additional four analysts explored relationships among
variables not previously specified in their hypotheses in addition to their hypotheses [A14, A15, A17, A21]. A18 justified
their choice to ignore their hypotheses and focus on emergent relationships in the data by saying that they wanted to be
“open minded based on the data...open to possibilities.”
Analysts’ concerns about bias and choice of which relationships to analyze (hypothesis only vs. opportunistic) highlight
the tension between the two searches involved in hypothesis formalization: concept-first model implementations and
implementation-first conceptual understanding. Conceptual models are intermediate artifacts that could reconcile the two
search processes and challenge analysts’ ideas of what “data-driven” means. However, given some analysts’ resistance
to prior conceptual modeling, workflows that help analysts conceptually model as a way to reflect on their model
implementations and personal biases may be more promising than ones that require them before implementation.
4.2.5 Analysts face challenges obtaining and integrating conceptual and statistical information. Based on analysts’
information search behaviors and self-reports, we found that analysts faced challenges obtaining and integrating both
domain and statistical knowledge.
Analysts consulted outside resources such as API documentation, Wikipedia, and the Towards Data Science blog
throughout the study: one while brainstorming hypotheses [A13]; three while conceptual modeling [A12, A13, A22]; six
Manuscript submitted to ACMHypothesis Formalization: Empirical Findings, Software Limitations, and Design Implications 15
while specifying statistical models [A3, A6, A12, A13]. Six analysts also mentioned consulting outside resources while
implementing their analyses [A1, A3, A11, A14, A15, A21]. By far, statistical help was the most common.
Furthermore, when analysts reflected on their prior data analysis experiences, they detailed how collaborators provided
domain and statistical expertise that are instrumental in formalizing hypotheses. Collaborators share data that help domain
experts generate hypotheses [A9], critique and revise conceptual models and proxies [A4, A8], answer critical data quality
questions [A10], and ensure statistical methods are appropriate [A5, A6, A22].
In the survey participants completed after implementing their analyses, the three most commonly reported challenges
were (i) formatting the data [A1, A4, A5, A6, A13, A16, A18, A20, A21, A24], (ii) identifying which statistical analyses
to perform with the data to test their hypotheses [A1, A11, A14, A18, A20, A21], and (iii) implementing and executing
analyses using their tools [A1, A6, A7, A13, A20, A21]. Although we expected analysts would have difficulty wrangling
their data based on prior work [45], we were surprised that identifying and executing statistical tests were also prevalent
problems given that (a) analysts were relatively experienced and (b) could choose their tools. These results, together with
our observations that analysts rely on their prior experiences and tools, suggest that analysts have difficulty adapting to
new scenarios where new tools and statistical approaches may be necessary.
4.3 Takeaways from the Lab Study
After the first session, 13 out of the 24 analysts described all the tasks as familiar, and 10 described most of the tasks
and process as familiar. Analysts commonly remarked that although the process was familiar, the order of the tasks
was “opposite” of their usual workflows. In practice, analysts may start with model implementation before articulating
conceptual hypotheses, which opposes the direction of data analysis that the ASA recommends [17]. Nevertheless, our
observations reinforce the dual-search, non-linear nature of hypothesis formalization.
Moreover, one analyst, A24, a physics researcher who primarily conducted simulation-based studies expressed that
the study and its structure felt foreign, especially because they had no control over data collection. Other analysts in the
study also described the importance of designing and conducting data collection as part of their hypothesis formalization
process [A4, A6, A9]. Designing data collection methods informs the statistical models analysts plan to use and helps to
refine their conceptual hypotheses by requiring analysts to identify proxies and the feasibility of collecting the proxy
measures, reinforcing what we saw in the content analysis. The remarks also suggest that disciplines practice variations of
the hypothesis formalization process we identify based on discipline-specific data collection norms and constraints. For
example, simulating data may sometimes take less time than collecting human subjects data, so analysts working with
simulations may dive into modeling and data whereas others may need to plan experiments for a longer period of time.
Finally, we found that analysts relied on prior experiences and tools to specify and formalize their hypotheses. Tools
that scaffold the hypothesis formalization process by suggesting statistical models that operationalize the conceptual
hypotheses, conceptual models, or partial specifications analysts create along the way may (i) nudge analysts towards
more robust analyses that test their hypotheses, (ii) overcome limitations of analysts’ prior experiences, and (iii) even
expand analysts’ statistical knowledge. Thus, we investigated how current tool designs serve (or under-serve) hypothesis
formalization.
5 ANALYSIS OF SOFTWARE TOOLS
To understand how the design of statistical computing tools may support or hinder hypothesis formalization (RQ3 -
Tools), we analyzed widely used software packages and suites. Our observations in the lab study motivated and focused
our analysis. Throughout, we use the term “package“ to refer to a set of programs that must be invoked through code,
Manuscript submitted to ACMYou can also read