Risk Assessment to Model Encounter Rates Between Large Whales and Sea Turtles and Vessel Traffic from Offshore Wind Energy on the Atlantic OCS ...
←
→
Page content transcription
If your browser does not render page correctly, please read the page content below
OCS Study
 BOEM 2021-034

Risk Assessment to Model Encounter
Rates Between Large Whales and Sea
Turtles and Vessel Traffic from Offshore
Wind Energy on the Atlantic OCS

U.S. Department of the Interior
Bureau of Ocean Energy Management
Office of Renewable Energy Programs
OCS Study
 BOEM 2021-034

Risk Assessment to Model Encounter
Rates between Large Whales and Sea
Turtles and Vessel Traffic from Offshore
Wind Energy on the Atlantic OCS

April 2021

Authors:
Mary Jo Barkaszi (CSA)
Mark Fonseca, Ph.D. (CSA)
Tom Foster (DHI)
Amit Malhotra (Geo Horizons)
Kim Olsen (CSA)

Prepared under Task Order 140M0119F0033
By
CSA Ocean Sciences Inc.
8502 SW Kansas Avenue
Stuart, Florida 34997

U.S. Department of the Interior
Bureau of Ocean Energy Management
Office of Renewable Energy Programs
DISCLAIMER
Study concept, oversight, and funding were provided by the U.S. Department of the Interior, Bureau of
Ocean Energy Management (BOEM), Environmental Studies Program, Washington, D.C., under Contract
Number 140M0119F0033. This report has been technically reviewed by BOEM, and it has been approved
for publication. The views and conclusions contained in this document are those of the authors and should
not be interpreted as representing the opinions or policies of the U.S. Government, nor does mention of
trade names or commercial products constitute endorsement or recommendation for use.

 REPORT AVAILABILITY
To download a PDF file of this report, go to the U.S. Department of the Interior, Bureau of Ocean Energy
Management Data and Information Systems webpage (http://www.boem.gov/Environmental-Studies-
EnvData/), click on the link for the Environmental Studies Program Information System (ESPIS), and
search on 2021-034. The report is also available at the National Technical Reports Library at
https://ntrl.ntis.gov/NTRL/.

 CITATION
Barkaszi MJ, Fonseca M., Foster T, Malhotra A, Olsen, K. 2021. Risk Assessment to Model Encounter
 Rates Between Large Whales and Vessel Traffic from Offshore Wind Energy on the Atlantic OCS.
 Sterling (VA): U.S. Department of the Interior, Bureau of Ocean Energy Management. OCS Study
 BOEM 2021-034. 54 p + Appendices.

 ACKNOWLEDGMENTS
We thank Dr. Robert Kenney and Mr. John Calambokidis for their valuable input regarding marine
mammal species behavior, technical input to the marine mammal risk matrix, and review of the draft
document.
Contents
List of Figures ................................................................................................................................................iii

List of Animation Figures.............................................................................................................................. iv

List of Tables ................................................................................................................................................ iv

List of Abbreviations and Acronyms............................................................................................................. vi

1 Introduction ........................................................................................................................................... 1
 1.1 Framework .................................................................................................................................... 2
 1.2 Scope/Goals of Project ................................................................................................................. 3
 1.3 Terminology................................................................................................................................... 4

2 Risk Assessment................................................................................................................................... 4
 2.1 Approach and Methods ................................................................................................................. 4
 2.2 Data Sources................................................................................................................................. 7
 2.2.1 Literature ............................................................................................................................... 7
 2.2.2 Vessel Data ........................................................................................................................... 7
 2.2.3 Marine Mammal and Sea Turtle Data ................................................................................... 8
 2.3 Matrices ......................................................................................................................................... 8
 2.3.1 Region Matrix ........................................................................................................................ 8
 2.3.2 Vessel Matrix ....................................................................................................................... 10
 2.3.3 Species Matrix ..................................................................................................................... 12
 2.4 Encounter Factors ....................................................................................................................... 12
 2.4.1 Vessel and Animal Size ...................................................................................................... 13
 2.4.2 Vessel Speed ...................................................................................................................... 13
 2.4.3 Animal Density and Activity ................................................................................................. 14
 2.5 Aversion ...................................................................................................................................... 15

3 Model for Predicting the Expected Number of Animals Encountered (Strikes) .................................. 15
 3.1 Approach and Methods ............................................................................................................... 16
 3.2 Assumptions ................................................................................................................................ 16
 3.3 Vessel Strike Risk Criteria........................................................................................................... 19
 3.4 Mathematical Description ............................................................................................................ 21
 3.5 Model Implementation ................................................................................................................. 27
 3.5.1 Route Segment Length ....................................................................................................... 27
 3.5.2 Relative Heading of Animal ................................................................................................. 28
 3.5.3 Animal Dive Profile .............................................................................................................. 29
 3.5.4 Aversion .............................................................................................................................. 29

 i
Contents
(Continued)
 3.6 Strike Risk Discussion ................................................................................................................. 30
 3.6.1 Effect of Vessel Speed ........................................................................................................ 30
 3.6.2 Effect of Vessel Dimensions ............................................................................................... 34
 3.6.3 Sensitivity Analysis .............................................................................................................. 34
 3.6.4 Validation Using Agent-based Model .................................................................................. 34

4 Graphical User Interface ..................................................................................................................... 36
 4.1 Vessel Transit Encounters .......................................................................................................... 37
 4.1.1 GUI Inputs ........................................................................................................................... 37
 4.1.2 GUI Outputs ........................................................................................................................ 40
 4.2 Within Wind Farm Vessel Encounter Probability ........................................................................ 41
 4.2.1 GUI Inputs ........................................................................................................................... 41
 4.2.2 GUI Outputs ........................................................................................................................ 46

5 Calculator Application ......................................................................................................................... 46

6 Literature Cited.................................................................................................................................... 49

Appendix A: Sample Large Whale Physical Standards and Monthly Dive Activity Look up Tables ......... A-1

Appendix B: Agent-based Strike Probability Matrix Tool .......................................................................... B-1

Appendix C: Detailed Description of User Inputs and Graphical User Interface Outputs ......................... C-1

 ii
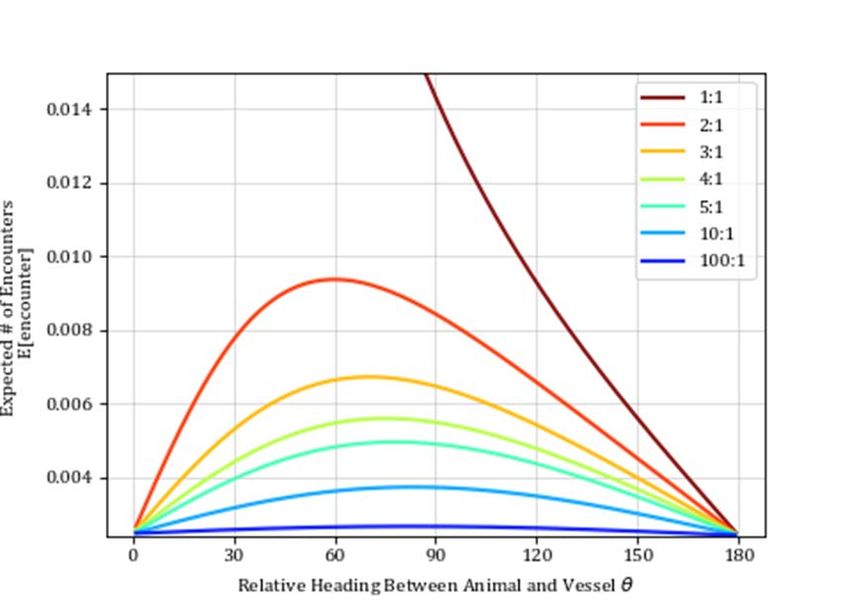
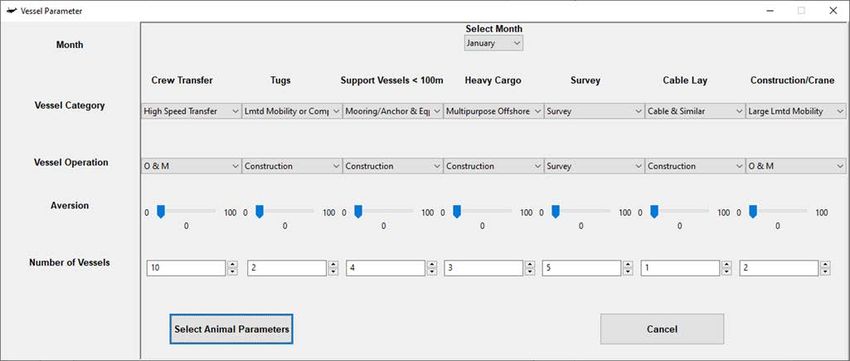
List of Figures
Figure 1. Current Bureau of Ocean Energy Management Atlantic Wind Energy Areas .......... 6

Figure 2. Risk factor region matrix boundaries ........................................................................ 9

Figure 3. Plan view illustration of the division of a vessel route (red line) into
 individual segments of equal length (black squares) .............................................. 18

Figure 4. Plan view diagram of the square domain (shown in black) centered
 about a single ( ) segment of the vessel route ................................................... 19

Figure 5. Illustration of an example vessel-animal encounter within a route segment .......... 20

Figure 6. Illustration of the trajectories .................................................................................. 21

Figure 7. Depiction of a vessel sailing through a route segment, with several possible
 animal trajectories shown ....................................................................................... 23

Figure 8. (Left) Diagram illustrating the mathematical framework used to estimate the
 total encounter area , which is shown in two parts as light red and dark
 red parallelograms corresponding to the initial encounter off the bow, then
 from the starboard side of the vessel, respectively ................................................ 25

Figure 9. Diagram of the geometric relationships used to calculate the total encounter
 area , as the combined area of the light red and dark red parallelograms
 corresponding to the initial encounter off the bow, then from the starboard
 side of the vessel, respectively ............................................................................... 26

Figure 10. Relationship of the relative heading between animal and vessel heading ( )
 in degrees, the ratio of vessel and animal velocities, and expected
 encounters on a 28-kilometer transit ...................................................................... 28

Figure 11. Relationship among vessel speed, animal speed, and expected encounters ........ 31

Figure 12. Relationship between vessel dimensions and the number of expected
 encounters.............................................................................................................. 33

Figure 13. Comparison between the analytical and numerical models ................................... 35

Figure 14. Screen capture of graphical user interface, prompting the user to select a
 Monthly Transit to a wind farm area or a Daily Wind Farm calculation .................. 37

Figure 15. Screen capture of graphical user interface used to select vessel route
 options in the risk model ......................................................................................... 38

Figure 16. Screen capture of the graphical user interface vessel parameters and their
 number of trips in the vessel transit total ................................................................ 39

Figure 17. Screen capture of graphical user interface animal parameters available in
 the graphical user interface of the strike risk model ............................................... 40

Figure 18. Screen capture of a graphical user interface used vessel route ............................ 41

 iii
List of Figures
(Continued)
Figure 19. Screen capture of graphical user interface entry into the wind farm portion
 of the graphical user interface ................................................................................ 44

Figure 20. Screen capture of graphical user interface wind farm total process graphical
 user interface.......................................................................................................... 45

Figure 21. Screen capture of graphical user interface animal parameters .............................. 46

Figure 22. Screen capture of graphical user interface Aggregator Module function ............... 47

Figure 23. Screen shot of graphical user interface Aggregator queries .................................. 48

Figure B-1. Example animal dive profile ................................................................................. B-4

Figure B-2. Snapshot showing ship identifying animal and performing evasive
 maneuver ............................................................................................................. B-6

Figure B-3. Numerical model domain extension ..................................................................... B-8

List of Animation Figures
Animation B-1. Basic collision animation .............................................................................. B-3

Animation B-2. Diving animation ........................................................................................... B-4

Animation B-3. Diving parent-calf animation ......................................................................... B-5

Animation B-4. Animal behavior animation ........................................................................... B-6

Animation B-5. Model domain extension .............................................................................. B-7

Animation B-6. Model domain extension 2 ........................................................................... B-7

List of Tables
Table 1. Vessel category characteristics used in the Vessel Risk Calculator ...................... 11

Table 2. Sample matrix format for a species (X) in a given month (Y) within the
 Northeast region ..................................................................................................... 12

Table 3. List of constant parameters used to generate the expected number of
 encounters in Figure 11 .......................................................................................... 31

Table 4. Summary of parameters used to compare the analytical and numerical
 (agent-based) models ............................................................................................ 36

 iv

List of Tables
(Continued)
Table 5. Vessel speeds by vessel type and percent time stationary based on animal
 swim speeds, while operating in the wind farm area during construction and
 survey stages of wind farm development ............................................................... 42

Table A-1. North Atlantic right whale activity look up table (Baumgartner and Mate,
 2003; Borcuk et al., 2017; Engelhaupt and Aschettino, 2020; Hain et al.,
 2013; Hayes et al., 2020; Kenney, 2020; Kraus and Kenney, 1991;
 Parks et al., 2011; Roberts, 2018, 2020; Watwood and Buonantony, 2012) ....... A-1

Table A-2. Humpback whale activity look up table (Borcuk et al., 2017; Engelhaupt and
 Aschettino, 2020; Hayes et al., 2020; Kenney, 2020; Noad and Cato, 2007;
 Roberts, 2018, 2020; Watwood and Buonantony, 2012) ..................................... A-3

Table A-3. Fin whale activity look up table (Borcuk et al., 2017; Calambokidis et al.,
 2019; Engelhaupt and Aschettino, 2020; Kenney, 2020; Roberts, 2018;
 Watwood and Buonantony, 2012) ........................................................................ A-5

Table A-4. Minke whale activity look up table (Borcuk et al., 2017; Christiansen et al.,
 2011; Engelhaupt and Aschettino, 2020; Hayes et al., 2020; Kenney, 2020;
 Roberts, 2018, 2020; Watwood and Buonantony, 2012) ..................................... A-6

Table A-5. Sei whale activity look up table (Borcuk et al., 2017; Engelhaupt and
 Aschettino, 2020; Hayes et al., 2020; Kenney, 2020; Roberts, 2018, 2020;
 Watwood and Buonantony, 2012) ........................................................................ A-7

Table A-6. Blue whale activity look up table (Borcuk et al., 2017; Engelhaupt and
 Aschettino, 2020; Hayes et al., 2020; Kenney, 2020; Lagerquist et al.,
 2000{Calambokidis, 2019 #156; Roberts, 2018, 2020; Watwood and
 Buonantony, 2012) ............................................................................................... A-8

Table A-7. Sperm whale activity look up table (Borcuk et al., 2017; Engelhaupt and
 Aschettino, 2020; Hayes et al., 2020; Kenney, 2020; Roberts, 2018, 2020;
 Watwood and Buonantony, 2012) ........................................................................ A-9

Table A-8. Sea Turtle activity look up table (Arendt et al., 2012; Borcuk et al., 2017;
 Department of the Navy, 2007a, b; Watwood and Buonantony, 2012) .............. A-10

Table B-1. List of Parameters ................................................................................................ B-1

 v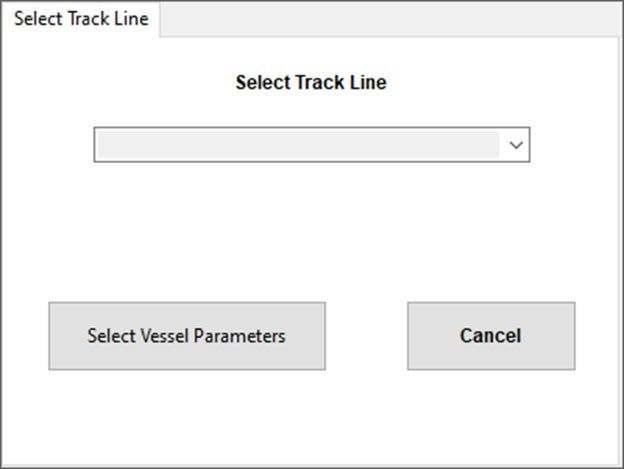
List of Abbreviations and Acronyms
AIS Automatic Identification System
AM Aggregator Module
BOEM Bureau of Ocean Energy Management
CSA CSA Ocean Sciences Inc.
GUI graphical user interface
IWC international whaling commission
km kilometer
kn knot
m meter
NARW North Atlantic right whale
NEPA National Environmental Policy Act
NMFS National Marine Fisheries Service
OCS outer continental shelf
SAG surface active group
U.S. United States
UME unusual mortality event

 vi
1 Introduction
With development of offshore wind projects, the Bureau of Ocean Energy Management (BOEM) must
evaluate the associated environmental risks. One such risk is the potential impacts of vessel operations on
marine species, specifically vessel strikes, which have been identified as a source of injury and mortality
in large whales and sea turtles (Chaloupka et al., 2008; Douglas et al., 2008; Foley et al., 2019;
Laist et al., 2001; Pace, 2011). Most reports of vessel strikes involve large whales and sea turtles, but
collisions with smaller marine mammal species have also been reported (Evans et al., 2011;
van Waerebeek et al., 2006). Vessel interactions with small cetaceans and seals are believed to occur less
frequently, have not been identified as requiring a higher level of assessment, and subsequently are not
included in this model. Vessel strikes happen when encounters between a vessel and an animal occur and
the animal or vessel fails to detect one another in time to react and avoid a collision. Variables that
contribute to the likelihood of a strike include vessel speed, vessel size and type, the species behavior, and
barriers to vessel detection by an animal (e.g., acoustic masking, heavy traffic, biologically focused
activity). In some cases, mitigation measures such as the use of lookouts and time/area speed restrictions
may be in the place that reduce the risk associated with the vessel operation.

Large whale species most frequently involved in vessel strikes include the fin whale (Balaenoptera
physalus), North Atlantic right whale (NARW) (Eubalaena glacialis), humpback whale (Megaptera
novaeangliae), minke whale (Balaenoptera acutorostrata), sperm whale (Physeter macrocephalus),
sei whale (Balaenoptera borealis), grey whale (Eschrichtius robustus), and blue whale (Balaenoptera
musculus) (Dolman et al., 2006). The international whaling commission (IWC) maintains a ship strike
database that helps inform relevant researchers or managers about global ship strike “hot spots” to better
prescribe mitigation measures (International Whaling Commission, 2021) and subsequently, several
publications have summarized or applied these ship strike statistics to management and mitigation
(Cates et al., 2016; Jensen and Silber, 2003; Schoeman et al., 2020). Laist et al. (2001) provided historical
and current records of the vessel types and speeds associated with marine mammal collisions. From these
records, most severe and lethal marine mammal injuries involved larger ships (≥80 m), but fast-moving,
smaller vessels also produced lethal injuries (Laist et al., 2001). Vessel speed also was found to be a
significant factor; 89% of the records involved vessels moving at ≥14 knots (Laist et al., 2001).
Delphinids such as the common bottlenose dolphin (Tursiops truncatus) and common dolphin (Delphinus
delphis) actively approach vessels to swim within the pressure wave produced by the vessel’s bow.
Because of their mobility and directed behavior regarding vessels, these delphinids are at lower risk of
possible vessel strike compared to large whale species (Glass et al., 2009; Jensen and Silber, 2003; Laist
et al., 2001; van der Hoop et al., 2015).

The U.S. Marine Mammal Stock Assessment Reports (https://www.fisheries.noaa.gov/national/marine-
mammal-protection/marine-mammal-stock-assessments) include an assessment of annual human-caused
mortality and serious injury including vessel strikes (Caretta et al., 2020; Hayes et al., 2020; Muto et al.,
2020). In 2016, a high number of humpback whale mortalities prompted the National Marine Fisheries
Service (NMFS) to declare an Unusual Mortality Event (UME) for Atlantic coast humpback whales
(NMFS, 2020). To date, 126 humpback whales have been found dead between Maine and Florida. Of the
carcasses that have been examined, approximately 50% have shown signs of human interaction, including
vessel strikes. Between 2016 and 2017, the number of vessel strikes for this species was more than
six times the 16-year average for the region (NMFS, 2019). Between 2013 and 2017, there were
0.8 annual vessel strikes each of fin whales and sei whales (NMFS, 2019). From 2013 to 2017, 1.0 minke
whale per year had reported ship strike mortalities (NMFS, 2019). Minke whale vessel strikes have been
documented from New York, Virginia, and Rhode Island (NMFS, 2019). Sea turtle strandings reported to
have vessel strike injuries has been reported to be as high as 25 percent in the Chesapeake Bay, Virginia

 1
(Barco et al., 2016). Similarly, Foley et al. (2019) reported that roughly one-third of stranded loggerhead,
leatherback, and green sea turtles in Florida had injuries indicative of a vessel strike.

For NARWs, ship strikes pose a substantial risk to the species’ recovery, mainly due to their small
population size, behavioral characteristics, and habitat preferences, which make them highly susceptible
to vessel encounters. From 2013 through 2017, the average reported mortality and serious injury to
NARWs due to vessel interaction was 1.3 whales per year (NMFS, 2019). In June 2017, the NMFS
initiated an UME for NARWs (NMFS, 2020) due to a significant increase in mortalities. Since 2017,
30 dead NARWs have been reported, 8 of which showed strong evidence of vessel strike injuries (NMFS,
2020). Some carcasses could not be examined or did not have clear cause of death, while other reports are
pending (NMFS, 2020). With the potential biological removal threshold for the NARW stock at
applicable to assessing risk of vessel strikes across wind development projects along the U.S. Atlantic
coast. In the existing models, vessel movement is treated as a point to point transit which is equivalent to
the transits considered in the wind vessel strike risk model. However, vessel activity on the wind farm
may be quite different from a standard point-to-point transit with additional time spent within the wind
farm area at varied speeds and trajectories. Therefore, the risk framework needed to separate vessel
transits between ports and a lease area, and vessel behavior while operating within the wind farm to
appropriately assess the risk of both conditions for vessel operation scenarios defined for offshore wind
activities.

Due to the difficulties of quantifying overall vessel strike risk and specifically the risk from various types
of vessel operations associated with the development of the offshore wind industry on the OCS, there was
a need for a desktop predictive assessment tool to quantify the strike risk of large whales and sea turtles
over large spatial and temporal scales indicative of current and future offshore wind energy project
development. While project-based assessments of vessel traffic and potential vessel strike impacts are
required from project developers, no comprehensive assessment of vessel strike risk occurs over all
phases of a single project or across multiple projects. Individual project risk to vessel strikes likely is very
low, but the outlook for offshore wind development along the U.S. Atlantic coast demands that vessel
strike risk be assessed on a more comprehensive basis to inform National Environmental Policy Act
(NEPA) decisions and the public.

This study identifies the most sensitive parameters for vessel type, operation, and species conditions that
contribute to the potential for vessel strikes in order to produce a robust analytical framework for
assessing strike risk associated with offshore wind development. A detailed risk assessment was
conducted to establish critical parameters from vessels and species included in the analytical model.

1.2 Scope/Goals of Project
The objective of this study was to characterize the risk of vessel strikes on large whales and sea turtles
from different vessel types that operate in support of the current leased and unleased OCS wind energy
areas (“wind farms” 1) in the Atlantic and to develop a model that accounts for geospatial, temporal, and
species-specific parameters in the vessel operations area for these wind energy areas.

The study was conducted in four stages. The first stage characterized the baseline conditions for vessel
traffic along the Atlantic OCS and within “wind farms”, including vessel types, operational parameters,
and operational behavior of the vessels during different stages of offshore wind development
(e.g., surveys, construction, operations). Additionally, the first stage developed an analytical framework
that used existing data to calculate encounter numbers based on species information, including density,
behavior, vessel parameters, geographic area, and development stage of offshore wind. The second stage
assessed and identified the quantitative parameters used to calculate strike risk and developed an
analytical model enumerating potential encounter numbers for large whales and sea turtles within user-
driven scenarios. In the third stage, a geographic user interface (GUI) that operates with the model was
developed to allow users to create complex scenarios of vessel activity which interacts with animal
density distributions. The GUI also provides access to text reports of the expected encounter values
generated by the model using the scenario inputs and encounter risk heat maps displayed in a geographic

1
 Here, the term “wind farm” is used generically and includes all the destinations that the user will be able to select
in the Calculator. This list is composed of data compiled from BOEM data sources
(BOEM_Lease_Areas_4_13_2020 and BOEM_Wind_Planning_Areas_4_13_2020) and includes Wind Planning /
Wind Energy Areas, Call Areas, Lease Areas and actual wind farm designations within Lease Areas.

 3
context. The potential for an actual strike can be simulated through manipulation of vessel activity and
animal behavioral response to vessels. The fourth stage developed the capacity of the GUI to allow
aggregation of model results from multiple, user-defined scenarios.

1.3 Terminology
Before proceeding, some important terminology used throughout this document should be introduced. A
“strike” is a physical collision between animal and vessel. An “encounter” refers to an event during which
a vessel and an animal are in close proximity and within a strike risk zone. Although “encounter”
typically is used to describe a vessel-animal interaction not resulting in a strike (e.g., an animal being
sighted and passing 100 m from a vessel), in the present context, an encounter describes a precursor
situation that could result in a strike unless either the animal, vessel, or both averts. Strike risk increases
as encounters increase but decreases with aversion of the animal and/or vessel. The analytical model
reports the expected number of animals encountered by a vessel in the user-defined scenario; strike risk is
approached by allowing the user to manipulate the effectiveness of aversion by the vessel and animal.

2 Risk Assessment
The risk of an encounter between a vessel and an animal depends on vessel activities and animal behavior
and distribution. As data suggest, there is a large volume of vessel activity that does not result in an
animal encounter or strike; however, vessel strikes remain a significant contributor of injury and mortality
in several large whale species (Carretta et al., 2019; Jensen and Silber, 2003; Muto et al., 2019; NMFS,
2019) and sea turtles (Foley et al., 2019). Estimated vessel strike mortality ranges exceed potential
biological removal thresholds for some species, indicating vessel strikes threaten the recovery or
continued existence of a population (NMFS, 2019; Rockwood et al., 2018). Simply put, regardless of the
relatively low numbers of strikes in relation to the volume of vessel traffic, the current level of vessel
strike mortality is a persistent threat, and in the case of NARWs, must be avoided to assist the recovery
the of this critically endangered species. Therefore, identifying the probability of vessel/animal
encounters provides a mechanism to assess strike risk for species within a given vessel scenario.
Overlapping vessel presence and animal densities are a primary driver for potential encounters (Williams
and O'Hara, 2010); however, other vessel- and animal-based factors can influence the likelihood of an
encounter, and thus strike risk (Crum et al., 2019).

2.1 Approach and Methods
There are multiple contributing activities (e.g., commercial shipping, coastal dredging, fishing, recreation)
that can affect a species’ strike risk along the U.S. Atlantic coast, but development of this modeling tool
focused on a programmatic scale of offshore wind development and operations. Assessing strike risk from
vessels operating in support of offshore wind development is necessary under NEPA requirements and
assists in identifying vessel activities that present risk that could be mitigated, under the purview of
agencies overseeing wind development. The risk of a vessel strike has several components. This report
addresses the first order component of that risk, the probability of a vessel encountering an animal.
Subsequent components, including whether that encounter becomes an actual strike (e.g., did the animal
or vessel detect one or the other and avert to avoid a strike) or the consequences of that strike (e.g., animal
mortality), were not explicitly modeled. However, the GUI provided with this encounter model allows a
user to create theoretical scenarios that consider actual strike risk by varying the effectiveness of aversion
(by both a vessel and an animal) such that the resulting expected value begins to approximate the number
of potential strikes. Through creation of individual scenarios, built on the first order component
(i.e., encounters), users may assess the overall likelihood of vessel strikes occurring. The combined

 4
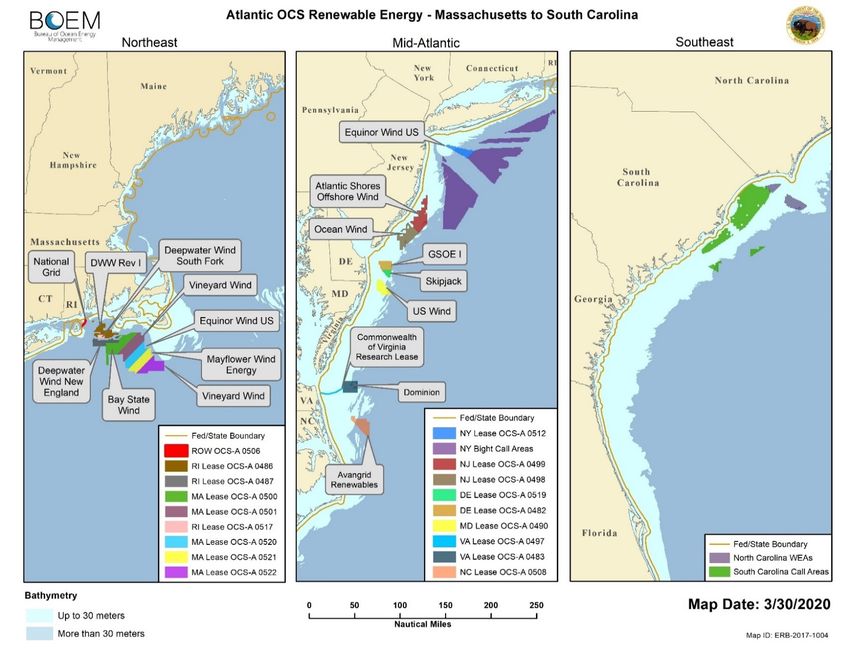
predictive model and associated GUI is called the Vessel Risk Calculator (referred to henceforth as the
‘Calculator’).

Importantly, this risk assessment, as a predictor of animal-vessel encounters, required a spatial scale
covering the Atlantic OCS (Figure 1) and a temporal scale of at least 50 years, given the expected
longevity of wind farm operations. Figure 1 includes all BOEM wind Call Areas and only illustrates the
potential areas for development for determining encounter scenarios. As no large-scale commercial wind
farms have yet been constructed in the U.S., it was necessary to identify the factors influencing encounter
risk for the Calculator using the best available information while maintaining flexibility to adapt to
changing vessel and biological data as well as ongoing and future wind development activities.

To build the risk factors for the Calculator, a series of matrices necessary to inform the components of the
analytical model (Section 3.3) were developed such that each risk factor independently contributed to the
overall risk of an encounter. Each risk factor matrix (Section 2.3) provides data, using the best available
information, that help forecast an encounter and thus begin to determine the vulnerability of an animal to
a vessel strike.

 5
Figure 1. Current Bureau of Ocean Energy Management Atlantic Wind Energy Areas

 6
2.2 Data Sources
Data were derived from published journal articles, government reports (e.g., BOEM, U.S. Navy, NMFS),
wind permitting and planning documents (e.g., construction and operations plans), and vessel automatic
identification system (AIS) data services. Data utilized in the look up tables for the model are described in
Section 2.3; individual species look up tables are provided in Appendix A; summarized vessel data is
provided in Table 1.

2.2.1 Literature

Traditional literature searches were performed to include species-specific information, vessel strike
studies, risk assessments, and encounter modeling. Most publications accessed were published after 2012.

2.2.2 Vessel Data

Several types of vessel data were needed to build risk factor matrices (Section 2.3) and to develop vessel
and port information necessary for the GUI. BOEM provided data on offshore wind industry activities
that were used to identify the vessel type, number, function, and dimensions expected to operate during
wind farm site investigation surveys, construction, operations, and maintenance phases of development.
Vessels were categorized according to physical characteristics, including size (length, beam, gross
tonnage), average operating speed, and draft. These vessel categories and characteristics were further
refined from AIS records gathered from two European wind farms. The AIS data provided a series of
vessel positions that also included vessel names, course heading, speed, destination, vessel draft, and
estimated time of arrival. From this information, the activity (e.g., speed, number of trips within 24 hours,
percentage of time stationary) for each vessel category was summarized during transit to and from or on
the wind farm to better characterize the model vessel activities.

Vessel activity (i.e., behavior) is different when in transit between a port and wind farm and when the
vessel is working within the wind farm. Therefore, two components, a port-to-wind farm route (transit)
component and an on-site (within the wind farm) behavior component, were necessary to build the vessel
routes for user-defined scenarios. Common port-to-wind farm routes were built from the U.S. Coast
Guard (2016) Atlantic Coast Port Access Route Study (ACPARS); construction and operations plans; a
BOEM port study (Whitney et al., 2016); and a BOEM-provided proprietary fishing routes study
(unpublished data, provided to CSA, October 2019). Geographic information system (GIS) coverages of
the most applicable transit routes between ports and wind leases were built by combining the available
data.

Unlike transiting, predicting behavior of vessels while operating in the wind farm (lease) area largely
depends on the function of the vessel while in the lease area (e.g., crew transfer, survey, installation, blade
delivery). These functions can vary by development phase, operations within each phase, weather, and
operational schedules. Because the U.S. currently does not have large-scale wind projects on the OCS,
information was gathered from the AIS data feeds from two European wind farms: the Beatrice Wind
Farm (Moray Firth, North Sea, Scotland) during its construction between 2017 and 2019, and the Gwynt
y Môr Wind Farm (Wales, United Kingdom) during its operation and maintenance between 2016 and
2019. AIS positions in 2-hour increments were obtained from Vessel Finder, Ltd, for all vessels recorded
within the geographic boundaries of the wind farms. As with the BOEM provided data, all vessels were
categorized according to physical characteristics, including size (length, beam, gross tonnage), average
operating speed, and draft. Vessels not likely to be associated with wind farm activities (e.g., yachts,
sailing vessels, container ships, cruise ships, oil tankers) were removed from the analysis. Vessels
categorized in the AIS data as fishing vessels or cargo ships were assessed on a case by case basis as to
whether that vessel was likely associated with wind farm activities or not. Once all vessels were

 7
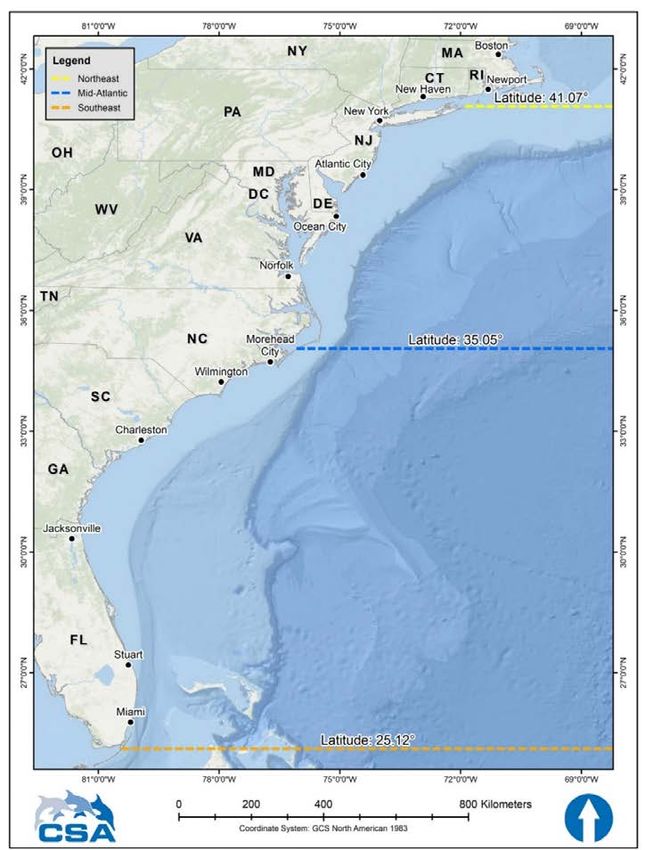
categorized, each vessel category was summarized by the number of records on the wind farm
(21,107 two-hour observations from among the seven vessel categories for the Beatrice Wind Farm, and
59,322 two-hour observations from among the seven vessel categories for the Gwynt y Môr Wind Farm
and the percentage of time vessels in each category were moving at speeds not exceeding that of the swim
speed for the animal species used in the scenario (see section 2.3.2) were assumed to be functionally
stationary). The average speed of moving vessels also was calculated for each vessel category at each
wind farm. A grand mean of the two wind farms was computed for the average speeds of moving vessels
and the percentage of time moving for each vessel category. All data manipulation and analysis was
performed using SAS software (SAS Institute, Inc., 2016). How this within-wind farm vessel behavior
was incorporated into the model is further explained in Section 4.2.

2.2.3 Marine Mammal and Sea Turtle Data

In addition to traditional literature, several marine mammal and sea turtle databases/reports were accessed
to obtain density, distribution, and swim depth data. All density information for cetaceans was derived
from Roberts et al. (2016, 2020) data layers (available at cetsound.noaa.gov). For sea turtles, the U.S.
Navy Operating Area (OPAREA) Density Estimates (NODES) (Department of the Navy, 2007a,b) were
used as the primary data source and available through the Duke University Ocean Biogeographical
Information System (OBIS). Consistent swim depth data were limited in journal publications. The most
consistent format was provided in the Navy Undersea Warfare Center’s dive distribution and group size
parameter reports (Borcuk et al., 2017; Watwood and Buonantony, 2012). The dive data were
supplemented with regional or species-specific depth distribution information, as appropriate.

Swim depth and duration were assigned based on species’ expected activity within one of three east coast
regions: Southeast, Mid-Atlantic, or Northeast. Species activity data were broken into three categories
based on primary ecological function: foraging, migrating, or calf-care. An additional category, surface
active group (SAG), was added for the NARW. Each activity was assigned to a corresponding swim
depth bin and mean time within the bin as well as mean swim speed. While highly generalized, this
approach enabled consistent treatment across all species. For species with additional information
available, subject matter experts were consulted and the information was supplemented with published
literature. Subject matter experts, namely Dr. Robert Kenney and Mr. John Calambokidis, served as
reviewers and contributors to the species data input to the matrices and the general assumptions made
about individual species.

2.3 Matrices
Marine species and vessel data populated the matrices used by the Calculator to identify the correct data
for input. The model uses three matrices: a region matrix, a species matrix, and a vessel matrix. The
region matrix separates the Atlantic OCS into three sections that correspond to species density and
activity changes typical for large whale and sea turtle species. The species matrix uses species density and
activity data associated with the month and actual locations input by the user through the GUI. The vessel
matrix uses the physical characteristics and behavior of the vessel associated with the phase of wind farm
development and the transit selected by the user. The matrices are described further in the following
subsections.

2.3.1 Region Matrix

The study area was divided into three regions (Southeast, Mid-Atlantic, and Northeast), primarily based
on changes in marine mammal species densities by month. Sea turtle densities generally follow seasonal
patterns, and although their densities are more consistent in the south and mid-Atlantic, the patterns are
applicable to the regional divisions. Mysticete whale species were used to determine the location of

 8
separation boundaries due to their seasonal migrations between low latitude calving grounds and high
latitude feeding grounds. Odontocete whale species, while showing some seasonal movements, do not
exhibit the same clear changes in densities over large spatial scales. The primary species considered were
humpback, NARW, fin, minke, and sei whales. The blue whale was not considered because the species
has a relatively uniform density along the entire study area (Roberts et al., 2016). The Southeast,
Mid-Atlantic, and Northeast regions were subjectively divided by latitude lines of 25.12°, 35.05°, and
41.07°, respectively (Figure 2). These areas serve to determine the primary behavior categories
(i.e., foraging, migrating, calf-care, and SAG) expected for each species. While animal behaviors and
densities do not change at such clearly demarcated locations, it was necessary to set some physical
boundaries to ensure the model will use the most appropriate data available for each region.

Figure 2. Risk factor region matrix boundaries
 Boundaries indicate the Southeast, Mid-Atlantic, and Northeast regions, subjectively identified by
 changes in monthly animal densities. Each area is located to the north of the respective boundary
 line.

 9
2.3.2 Vessel Matrix

Using the data sources described in Section 2.2.2, seven categories of vessels were developed to group
vessels based on similar physical characteristics such as size, draft, and average operational speeds
(Table 1). The data from the identified vessels was compiled and ranges for the width, length, tonnage,
and draft categories were determined. In addition, from the AIS data, the percent time moving within the
windfarm area and the mean speed traveling versus the time spent stationary was determined. These data
provided ranges for each parameter, and the mean of those ranges was used to best characterize that group
of vessels and provide a data-driven default for each of the vessel parameters. Table 1 provides the vessel
categories and corresponding mean characteristics used in the model. Vessel speeds in the matrix are
default suggestions based on information for each vessel type; however, the user can modify speeds
directly using the GUI.

While the vessel type may change throughout the period of wind development in the U.S., the general
function and size of a vessel type are unlikely to notably change, and these generalizations are reflected in
the matrix. Individual vessels will vary, and the user should be aware that some vessels may not fit well
into the vessel categories. Therefore, users should carefully design vessel scenarios and assign vessels
into categories that best represent the characteristics of the vessel (Table 1). The calculator offers
flexibility by allowing the user to design multiple scenarios and specify additional parameters such as trip
numbers, vessel speed, and track lines within each vessel category.

 10
Table 1. Vessel category characteristics used in the Vessel Risk Calculator
 Mean
 Default Percent
 Mean Mean Mean Mean Speed
 General Transit Time
 Category Activity Example Vessels Width Length Gross Draft when
 Vessel Types Speed Moving in
 (m) (m) Tonnage (m) Moving1 in
 (kn) WFA
 WFA (kn)
 Crew transfer, service,
 High speed
 1: refueling, guard vessel, multi- HSC, crew boats,
 transfer/crew 10 25 150 25 2 42 17
 Crew Transfer purpose support, pilot boats
 vessels
 MMO/biological surveys
 Component feeder, tug
 support, foundation Tugs, utility
 installation, foundation Limited mobility vessels, small
 2:
 transport, acoustic monitoring, or companion dredges, guard 18 68 1,200 14 4 44 7
 Tugs
 ESP transport, secondary vessels vessels, small
 work, snag, anchor handling crane barge
 support
 3: Noise mitigation, component Mooring/anchor Anchor, buoy,
 Support Vessels feeder, repair vessel, grapnel and equipment mooring handlers, 12 60 3,500 15 6 26 7
2.3.3 Species Matrix

The species included in the risk analysis model include:
 • Fin whale (Balaenoptera physalus);
 • Minke whale (Balaenoptera acutorostrata);
 • Sei whale (Balaenoptera borealis);
 • Humpback whale (Megaptera novaeangliae);
 • North Atlantic right whale (Eubalaena glacialis);
 • Blue whale (Balaenoptera musculus);
 • Sperm whale (Physeter macrocephalus);
 • Leatherback sea turtle (Dermochelys coriacea); and
 • Hard-shelled turtles (loggerhead [Caretta caretta], green [Chelonia mydas], and Kemp’s ridley
 [Lepidochelys kempii]).

As described in Section 2.2.2, each species has a unique density, activity composition, and swim speed
that provides required model information. Physical parameters (e.g., animal’s mean length, width) for
each species also are provided in the matrix for model access.

A sample species matrix framework (without species-specific data) is provided in Table 2, showing how
data are incorporated by the model. The monthly species matrices for whales and sea turtles considered in
the model are provided in Appendix A.

Table 2. Sample matrix format for a species (X) in a given month (Y) within the Northeast region
 Mean % Population % Time in
 Length, Mean Swim Derived Density
 Species = X Density Within each each Depth
 Width, Group Speed (km2) at each Depth
 Month = Y (animals Activity Bin Based
 Draft (m)b Sizeb (m s-1)c Bin and Speed
 km-2)a Categoryb on Activity
 0–10 m #
 # % Foraging # 10–20 m #
 >20 m #
 0–10 m #
 Northeast # #,#,# # % Migrating # 10–20 m #
 >20 m #
 0–10 m #
 # % Calf-care # 10–20 m #
 >20 m #
a
 Data from Roberts et al. (2016).
b
 Data from literature and subject matter expert reviews.
c
 Data from Navy Undersea Warfare Center reports (Borcuk et al., 2017; Watwood and Buonantony, 2012).
# represents species-specific data from tables in Appendix A.

2.4 Encounter Factors
The encounter factors are the resulting data entered into the corresponding matrices that independently
serve to increase or decrease the probability of an encounter between an animal and a vessel. Other vessel
strike models and analyses of vessel strikes in the literature account for various encounter factors,
sometimes individually and sometimes in combination (e.g., Dolman et al., 2006; Rockwood et al., 2018;
Silber and Bettridge, 2010). Taken individually, an encounter factor fundamentally makes the animal
more or less accessible to being struck. For this study, encounter factors are considered outside of
behavioral aversion from the animal or vessel. In this way, the risk assessment identifies the probability

 12
for an animal to be within a three-dimensional strike risk zone (encounter) but does not further calculate if
a physical interaction and a strike may occur which is dependent on a number of other unpredictable
factors and circumstances. The strike risk zone is identified as a 1 km2 analysis block containing both the
vessel and the animal, with the animal in a depth bin within the mean vessel draft and at a trajectory that,
with no aversion, will intersect with the vessel. While the actual strike zone is smaller than 1 km2
(Silber et al., 2010), the minimum functional information scale (e.g., vessel routes, animal densities) to
assess risk in the model would not be applicable (or prudent to use) at finer scales. The mathematical
expression of how these encounter factors contribute to the model is detailed in Section 3.3.

2.4.1 Vessel and Animal Size

Vessel strikes can occur from all types and sizes of vessels, from large container ships to small personal
watercraft (Dolman et al., 2006; Laist et al., 2001). The physical dimensions of the vessel and animal will
influence the strike zone in that if a vessel or animal occupies more “space” in the water, there is an
increase in the likelihood of an encounter. Vessels that are longer, wider, or have deeper drafts increase
the size of the vessel footprint within the water column, thus increasing the likelihood of an encounter.
Jensen and Silber (2003) summarized the vessel characteristics of reported whale strikes between 1975
and 2002 and showed that, while all vessel classes are represented, most incidents involve relatively large
vessels. However, Jensen and Silber (2003) also cautioned that certain vessel classes likely are
over-represented due to reporting requirements (e.g., U.S. Navy, U.S. Coast Guard, whale watching) and
an unbiased account of all vessel strikes likely is not attainable. Other vessel strike models have used
physical parameters of vessels to assess strike probability (Fonnesbeck et al., 2008; Rockwood et al.,
2018; Williams and O'Hara, 2010) as well as strike severity (Silber et al., 2010; Wang et al., 2007). The
current risk assessment does not address strike severity, only encounter risk (and strike risk with
utilization of aversion options). However, while the gross tonnage of the vessel does not influence the
overall risk, it contributes to the vessel’s ability to avoid a strike (and to the severity of a strike) and
should be considered when selecting aversion effects in the GUI.

Similarly, animals that are longer and wider present a larger “target” in the water for a potential strike.
Few studies have addressed the size of the animal as a contributing factor outside the behavioral context
associated with those animals (Crum et al., 2019; Martin et al., 2016; Silber et al., 2010). The strike risk
will be influenced by the size of the animal by increasing the relative target size within the strike risk
zone.

2.4.2 Vessel Speed

Vessel speed has been widely assessed in vessel strike literature (Berman-Kowaleski et al., 2010; Conn
and Silber, 2013; Dolman et al., 2006; Gende et al., 2011; Jensen and Silber, 2003; Martin et al., 2016;
Redfern et al., 2013; Silber and Bettridge, 2010; Wang et al., 2007) and has significant influence on the
probability and severity of a strike in real-world circumstances. In addition to reduced response time for
the vessel, studies suggest increased vessel speed is a causative factor in an animals’ inability to avoid
collision (Dolman et al., 2006; Laist et al., 2001; Rockwood et al., 2018; Silber and Bettridge, 2010).
Vessel speed has less effect on strike risk over a fixed distance with fixed target density when there are no
behavioral components considered (Yin et al., 2019). Vessel speed has a significant effect on strike risk
only when behavioral components are considered, thus the ability for the user to input animal or vessel
aversion is an important variable that can provide insights to the encounter risk based on vessel speeds.
The key mathematical relationship between vessel speed and encounter risk is that the expected number
of animal encounters (and hence opportunities for a strike to occur) decreases exponentially with
increasing vessel velocity through only that single 1 km2 block (i.e., the vessel is spending less time
within a block, hence, less time for an encounter to occur). However, as noted by virtually every author
that has addressed the subject: slow moving vessels provide more time for the animals and vessel
operators to avert the collision (e.g., Crum et al., 2019; Martin et al., 2016; Vanderlaan and Taggart,

 13
2007), such that strike risk (rather than encounter risk) will increase with increasing vessel speed. The two
findings are entirely consistent. It must be recognized that the aversion probabilities of both ship and
animal should reflect the speed of the vessel, with an increasing chance of overall aversion the lower the
vessel speed. It is noted that user-defined aversion for vessel and animal is included as an option in the
Calculator.

2.4.3 Animal Density and Activity

Higher animal (and vessel) densities increase strike risk (Rockwood et al., 2018; Williams and O'Hara,
2010; Yin et al., 2019) and those densities vary spatially and temporally for each species and vessel type.
The species density data used to provide risk model input (Roberts, 2018; Roberts et al., 2016)
(unpublished data) were developed using long-term transect survey data linked to ocean habitat
information as well as remotely sensed sea surface temperatures and chlorophyll concentrations during
the survey periods. The density models (Roberts et al., 2016) estimated abundance for areas that have not
been surveyed and provided the spatially registered data needed for the scale of this project. Roberts
(2020) further updated model results for NARW by implementing three major changes: increasing spatial
resolution, generating monthly estimates on three time periods of survey data, and dividing the study area
into five discrete regions. These changes are designed to produce estimates that better reflect the most
current, regionally specific data, and to provide better coastal resolution. While local animal densities are
highly dynamic and currently in flux due to climate factors influencing ocean conditions (Charif et al.,
2020; Davies et al., 2019; Gowan et al., 2019; O'Neil et al., 2019; Tulloch et al., 2019); the Roberts et al.
(2016); and Roberts (2018, 2020) data are the best available data accessible in a single published database
at the required spatial extent and resolution for the Calculator. As data are updated (e.g., Roberts, 2018)
(unpublished data), they can be incorporated into the matrices and model.

Within any population, location, and season, there will be different percentages of animals engaged in a
variety of activities whose frequency of occurrence ranged from 0 to 100%. Animal activity categories
(foraging, migrating, calf-care, and SAG) dictate the mean group size, swim speed, and time within
specified depth bins, which are used as encounter factors in the model. For example, whales in calf-care
activity typically spend more time in the shallower depth bins than whales engaged in foraging activity,
thus increasing the strike risk for the portion of the population expected to be engaged in calf-care.

Group Size

Higher mean group sizes within 1 km2 will increase the probability of an encounter; however, over the
course of a transit, the probability would be countered by areas without animals because of aggregation.
The aggregation condition that presents the greatest strike risk is the SAG behavior demonstrated by
NARWs. Rather than aggregating densities where a percentage of the population is likely to be in a SAG,
the effective size of the whales was increased in the corresponding percentage of the population density to
account for the aggregation condition.

Swim Speed

Increased animal swim speeds, when within the strike risk range, will decrease strike risk by decreasing
the amount of time an animal is within the predicted strike risk zone (Section 3.3). Animal swim speeds
have been used in other vessel strike models without the inherent behavioral aspects of a whale’s speed in
relation to a vessel (Crum et al., 2019; Martin et al., 2016; Silber et al., 2010). However, swim speeds are
highly contextual and depend on animal activity, life stage, disturbance, and other factors that make
assignment of a consistent swim speed a challenge. Swim speeds have been reported in topical studies
(Baumgartner and Mate, 2003; Blix and Folkow, 1995; Hain et al., 2013; Henderson et al., 2018;
Lagerquist et al., 2008; Noad and Cato, 2007), but the only comprehensive list of mean swim speeds for

 14
You can also read