Study cases of energy, microclimate and aeraulic simulations at district scale: engineering and management frameworks for smarter urban ...
←
→
Page content transcription
If your browser does not render page correctly, please read the page content below
Study cases of energy, microclimate and aeraulic
 simulations at district scale:
 engineering and management frameworks for
 smarter urban development

 Thomas Pinol
 KTH – Industrial Engineering and Management
 Grenoble INP Phelma – Energy & Nuclear Engineering

 Master’s Thesis – June 2017
Master of Science Thesis EGI 2017:0040

 Study cases of energy, microclimate and
 aeraulic simulations at district scale:
 engineering and management frameworks
 for smarter urban development

 Thomas Pinol

Approved Examiner Supervisor

June 12th, 2017 Hatef Madani Nelson Sommerfeldt
 Commissioner Contact person

 UrbanPractices Christian Rozier

 Abstract
With population growth and climate change issues, cities will face social, economic and environmental
challenges. They are accountable for most of the energy consumption and GHG emissions, and the
building sector represents roughly 40% of the final energy consumption worldwide. Still, cities transform
by renewing or creating districts, which design comes with specific engineering and management
methods. Simulations tools at district scale might lead to more sustainable urban development by
considering phenomena at such scale.

Energy, microclimate and aeraulic simulations are performed on two study cases from real estate projects
in France. This thesis investigates whether the tools allow to unlock new development strategies, and
which engineering and management frameworks they require. The benefits for urban planners and
architects are discussed, and the replicability of the tools is assessed. The studies also provide academic
knowledge, beneficial to the actors for qualitative analyses.

The energy needs and potential of energy sharing are assessed. Sensitivity analyses on design
characteristics such as windows or insulation provide insight on their respective impacts on energy needs
and sharing. The microclimate and heat island effects in the district are investigated, thanks to the
evolution of air temperature and comfort index PET, bringing knowledge on the effects of trees and
buildings. The winds within several urban plans are also simulated, providing insight on comfort in the
district as well as academic experience on the relations between architecture and winds. Those studies
therefore provide assessment and recommendations for the district, as well as knowledge for future
qualitative and quantitative analyses. Plus, modeling and management issues and their resolutions help
to construct a framework to improve the efficiency of such studies in terms of time, and therefore cost.
Eventually, a simplified aeraulic study tests the engineering and management frameworks. Finally,
conclusions present the design strategies and the management requirements to replicate such studies.

Keywords: sustainable urban development, simulation tool, district design, energy, comfort,
microclimate, aeraulic, engineering and management framework, return of experience.

Sammanfattning
Med befolkningstillväxt och klimatfrågor kommer städerna att möta sociala, ekonomiska och
miljömässiga utmaningar. De är ansvariga för de flesta av energiförbrukningen och växthusgasutsläppen,
och byggsektorn utgör ungefär 40% av den slutliga energiförbrukningen. Ändå, transformerar städerna
genom att förnya eller skapa distrikt, vilken design kommer med specifika ingenjörsmetoder och
hanteringsmetoder. Simuleringsverktyg i distriktskalan kan leda till en mer hållbar stadsutveckling
genom att överväga fenomen i sådan skala.

Energi, mikroklimat och aerauliska simuleringar utförs på två studiefall från fastighetsprojekt i
Frankrike. Denna maggisteruppsats undersöker om verktygen tillåter att låsa upp nya
utvecklingsstrategier, och vilka tekniska och ledande ramar de behöver. Fördelarna för stadsplanerare
och arkitekter diskuteras, och verktygets replikerbarhet bedöms. Studierna ger också akademisk kunskap
som är till nytta för aktörerna för kvalitativa analyser.

Energianvändningen och potentialen för energidelning utvärderas. Känslighetsanalyser på
designegenskaper som fönster eller isolering ger insikt om deras respektive inverkan på energibehov och
delning. Mikroklimat och ”värme ö effekter” i distriktet undersöks tack vare utvecklingen av
lufttemperaturen och komfortindex PET, vilket ger kunskap om effekterna av träd och byggnader.
Vindarna inom flera stadsplaner simuleras också, vilket ger insikt om komfort i distriktet samt akademisk
erfarenhet av relationerna mellan arkitektur och vindar. Dessa studier ger därför bedömning och
rekommendationer för distriktet, samt kunskaper om framtida kvalitativa och kvantitativa analyser.
Dessutom, modellerings- och hanteringsfrågor och deras resolutioner bidrar till att konstruera en ram
för att förbättra effektiviteten av sådana studier i form av tid och därmed kosta. Så småningom tester
en förenklad aeraulisk studie av konstruktions- och förvaltningsramarna. Slutligen presenterar
slutsatserna designstrategierna och förvaltningskraven för att replikera sådana studier.

Nyckelord: hållbar stadsutveckling, simuleringsverktyg, distriktsdesign, energi, komfort, mikroklimat,
aeraulisk, teknik- och ledningsramar, erfarenhet av erfarenhet.
“ What good is an idea,
if it remains an idea? “

 Simon Sinek
Preamble and acknowledgments

 Preamble and acknowledgments

Student in nuclear and energy engineering from Grenoble Institute of Technology, France, I have chosen
to diversify myself in sustainable energy engineering and energy management at Kungliga Tekniska
Högskolan, Sweden, as I have always wanted to have a holistic view on the energy sector. After some
very interesting classes, I have decided to perform my internship and master’s thesis in the Smart Energy
and Smart City sector, to clearly have a view of energy utilization and strategies to adopt in territories,
districts and buildings.

I would like to thank Christian Rozier, CEO of Urban Practices, who accommodated me for this thesis,
as well as Nelson Sommerfeldt from KTH who has been a great supervisor, helping me in the thesis
process.

Thanks to Alain Kergoat, Solenn Tardivell, and the Ubiant team with whom I was happy to work. I
also thank the Project Descartes team, as well as the ICADE team, for the great projects we have been
working on.

Finally, thanks to my parents, grandparents, family and friends, for their unconditional support

 Page|I
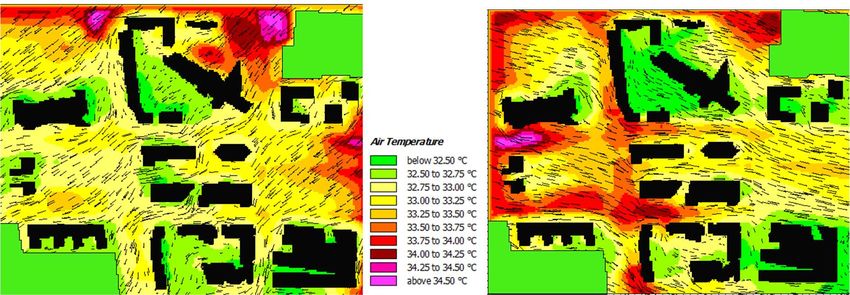
Table of contents

Table of contents

List of figures, tables and equations ...................................................................................................... III
Glossary ...................................................................................................................................................V
1. Introduction .......................................................................................................................................1
2. Methods .............................................................................................................................................2
 2.1. Energy needs at district scale ...................................................................................................3
 2.2. Heat Island Effect and micro-climate .......................................................................................3
 2.3. Aeraulic simulations..................................................................................................................4
 2.4. Project framework.....................................................................................................................4
3. Review of the energy-building context ..............................................................................................7
 3.1. Energy market context .............................................................................................................7
 3.2. Regulations ...............................................................................................................................8
 3.3. Construction techniques for energy efficiency...........................................................................9
 3.4. Labels ...................................................................................................................................... 10
 3.5. “EcoQuartier” and “Ecocité” .................................................................................................. 11
 3.6. District studies ........................................................................................................................ 12
 3.7. Building Information Modeling ............................................................................................... 14
4. Results and analysis ........................................................................................................................ 15
 4.1. Engineering knowledge for urban development ...................................................................... 15
 Energy needs at district scale ............................................................................................. 15
 Heat Island Effect (HIE) and micro-climate ....................................................................... 26
 Aerodynamics of the district ............................................................................................... 35
 CONCLUSIONS ON THE ENGINEERING FRAMEWORK ........................................... 47
 4.2. Management framework.......................................................................................................... 48
 Energy requirements ........................................................................................................... 48
 Management return of experience ....................................................................................... 50
 Project management framework ......................................................................................... 54
 CONCLUSIONS ON THE MANAGEMENT FRAMEWORK .......................................... 56
 4.3. Simplified studies in an urban development call for tender.................................................... 57
5. Conclusions ...................................................................................................................................... 61
Bibliography ........................................................................................................................................... 63

 Page|II
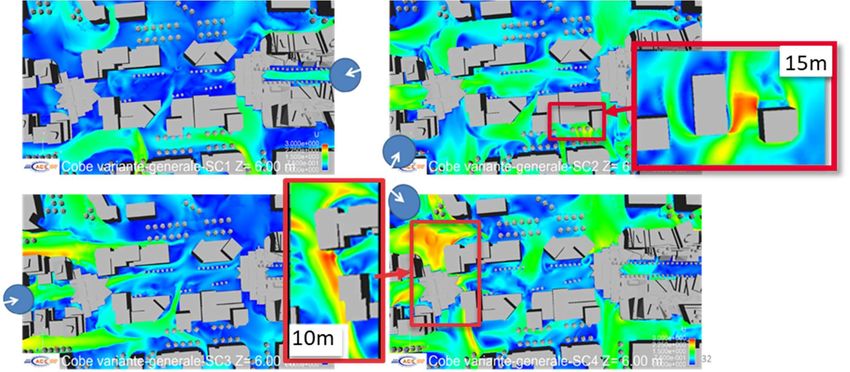
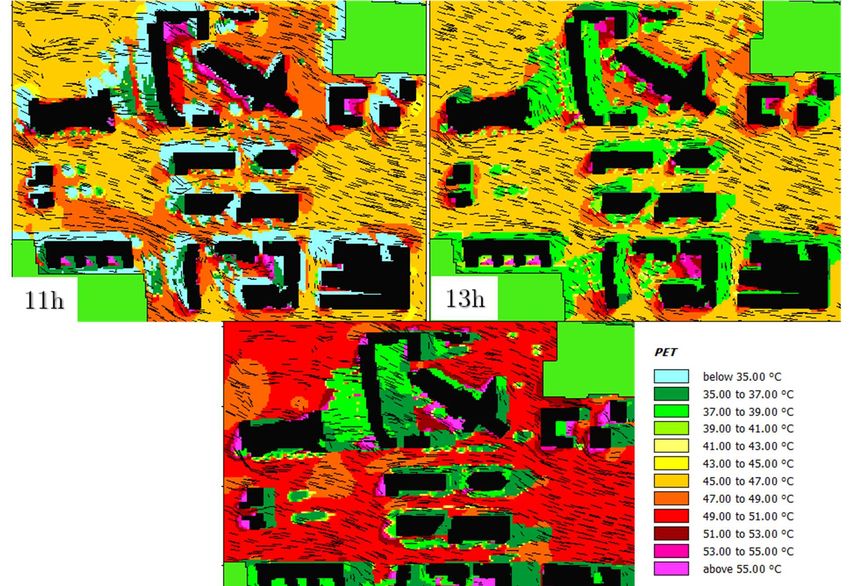
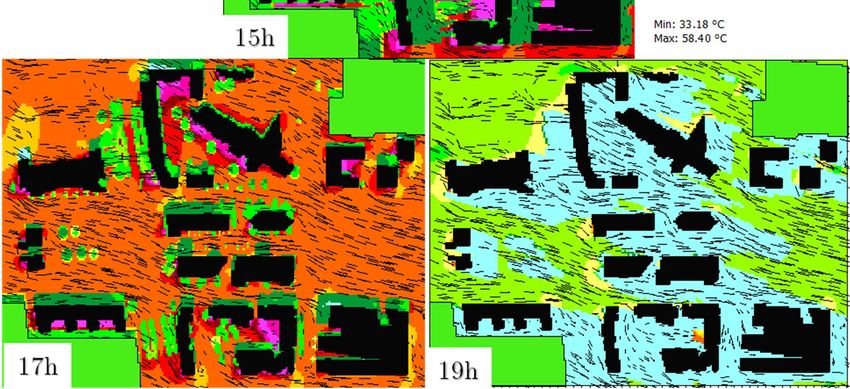
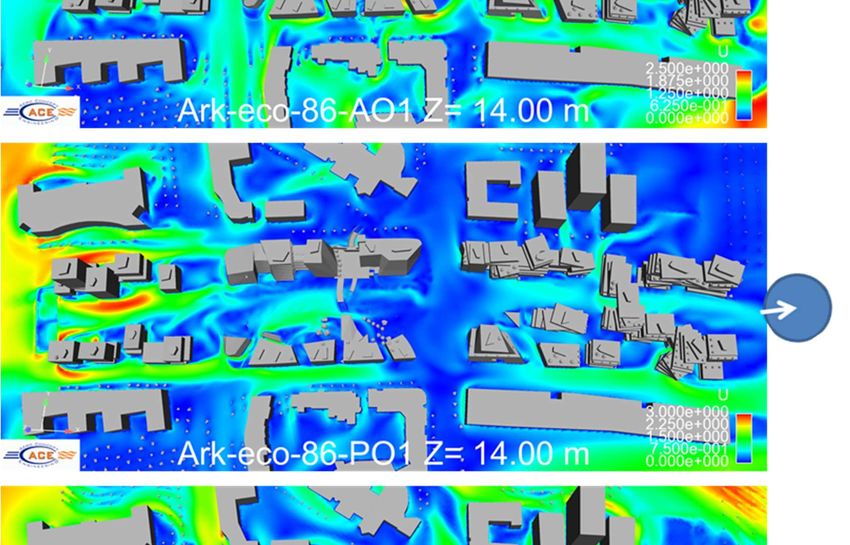
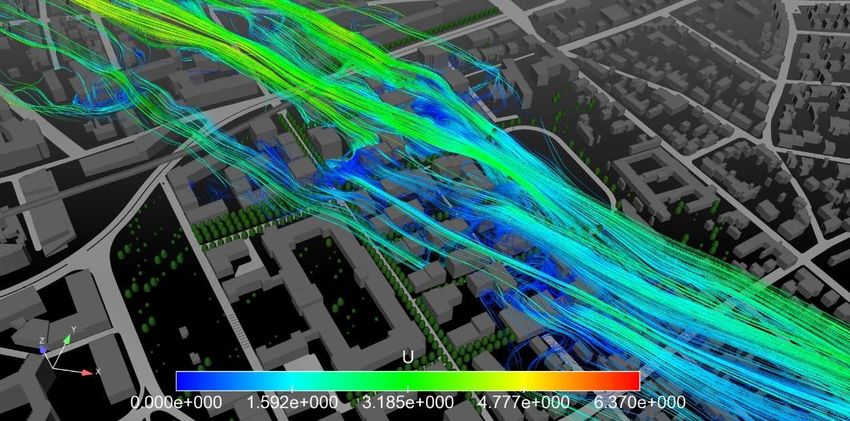
List of figures, tables and equations

 List of figures, tables and equations
Figure 1 - Methodology for the framework __________________________________ 2
Figure 2 - Heat Island Effect over several types of urban zones ______________________ 3
Figure 3 - Artistic view of Cité Descartes [11] ________________________________ 4
Figure 4 - Management diagram of the EcoCité Descartes project ____________________ 5
Figure 5 - B1 of the urban planner (top) and the real estate developer (bottom) ____________ 6
Figure 6 - French final energy consumption per sector [13] _________________________ 7
Figure 7 - Final energy consumption per type in the residential-tertiary sector [13] __________ 8
Figure 8 - Final consumption in the residential sector [13] _________________________ 8
Figure 9 - Evolution of French Thermal Regulation [14] __________________________ 9
Figure 10 - Windspeeds modeled with UrbaWind (left) – Smartseille design principle (right) _____ 13
Figure 11 - Solar flux and tree interactions [33] _______________________________14
Figure 12 - Solar fluxes trapping between buildings [30] __________________________ 14
Figure 13 - Repartition of building types - residential=blue - offices=green; commercial=red _____ 16
Figure 14 - Energy needs of the 9 configurations (insulation type ; cooling temperature) _______ 17
Figure 15 - Effect of insulation type and cooling set point on energy needs _______________ 17
Figure 16 - Relative difference between insulations _____________________________ 18
Figure 17 - Zones' distribution in DIMOSIM : diffcult to compare (left) and simple (right) ______ 19
Figure 18 - Energy needs per m²: dispersion of the results _________________________ 19
Figure 19 - Power loads over the year for the reference case ________________________ 20
Figure 20 - Cumulative power loads, reference case _____________________________ 21
Figure 21 – Power loads: zoom on a day in inter-season (October) ____________________ 22
Figure 22 - Total needs after and before sharing for the 9 configurations ________________ 22
Figure 23 - Vegetation plan and tree foliage transmission potential over the year ___________ 26
Figure 24 - 3D CAD model with Envi-met (left) and zoom on B1 (right) ________________ 27
Figure 25 - Evolution of the solar radiation flux (W/m²) in March, September and October _____ 27
Figure 26 - Solar radiation flux in January and February: effect of solar masks on southern facades _ 28
Figure 27 - Solar radiation on northern facades in summertime ______________________ 28
Figure 28 - Effect of the reflections on incident flux (December and July), in kWh/m²/month ____ 29
Figure 29 - Average surface temperature (°C) and maximal temperature, in July____________ 29
Figure 30 - Temperature of facade at 15:00 __________________________________ 30
Figure 31 - Effect of trees on surfaces' temperatures ____________________________ 30
Figure 32 - Air temperature with NE wind (left) and SW wind (right) __________________ 31
Figure 33 - Air temperature with wind flow NE (left) and WNW (right) ________________ 31
Figure 34 - PET comfort index at 15:00 for W-N-W wind _________________________ 32
Figure 35 - Evolution of the PET index during the day __________________________ 33
Figure 36 - Angle frequency in Orly, near Marne-la-Vallée. Source: Météonorm_____________ 35
Figure 37 - Windspeed frequency in Orly, near Marne-la-Vallée. Source: Météonorm _________ 36
Figure 38 - Effect of speed on particles' direction (3m/s left & 37.5m/s right) _____________ 36
Figure 39 - Modelling of the trees _______________________________________ 37
Figure 40 - Effect of trees on wind reduction _________________________________ 37
Figure 41 - Effect of trees at different windspeeds (3m/s left & 37.5m/s right) _____________ 38
Figure 42 - Windspeeds in the main urban plan, 4 directions of wind __________________ 39
Figure 43 - Comparison between architect 1 (top) and 2 (bottom) for S-S-E wind ___________ 40
Figure 44 - Analysis of B1 part, real estate architect (1m; 10m and 15m above ground) ________ 41
Figure 45 - Wind flow for buildings lower than 15m ____________________________ 41
Figure 46 - Analysis of four various district urban plan, S-S-E wind (main urban plan at the center) 43

 Page|III
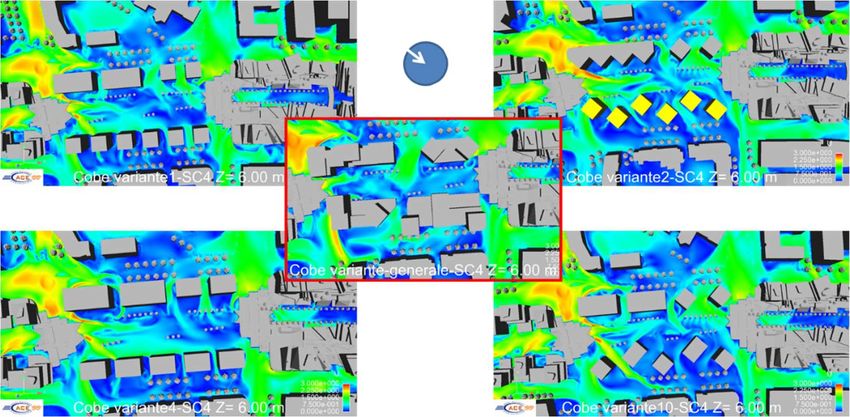
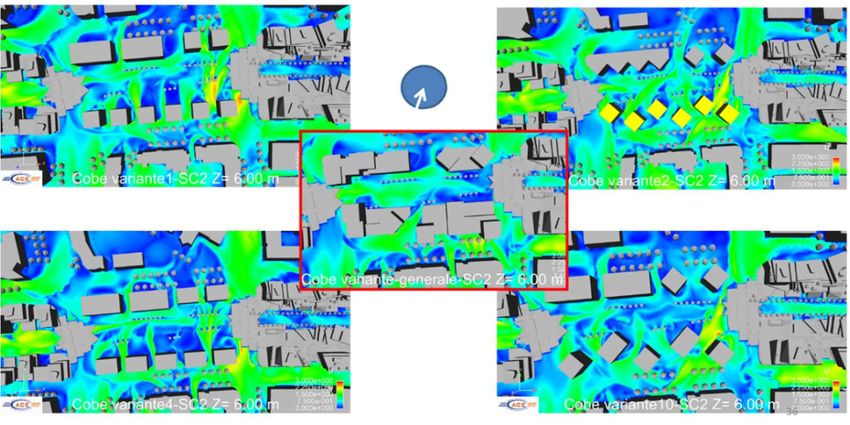
List of figures, tables and equations

Figure 47 - Analysis of four various district urban plan, W-N-W wind __________________ 43
Figure 48 - Grading area for wind comfort __________________________________ 44
Figure 49 - Selection of the zones for comfort assessment __________________________ 45
Figure 50 - Shapes to banish to avoid Venturi effect ____________________________ 46
Figure 51 - Grande Arche, Paris La Défense _________________________________ 47
Figure 52 - Issues in the initial model (left) and solving (right) ______________________ 51
Figure 53 - Second architect model file received, using the modeling chart________________ 52
Figure 54 - Mismatch between existing buildings between architect 1 and 2 _______________ 52
Figure 55 - Evolution of the energy needs calculation ____________________________ 54
Figure 56 - The three steps of the formation system ____________________________ 56
Figure 57 - The district in Toulouse for the call for tender (13 ha) ____________________ 57
Figure 58 - Wind repartition in the district [Source: météo France] ____________________ 58
Figure 59 - Model of the simulation ______________________________________ 58
Figure 60 - West-North-West and South winds, windspeeds at 1.8m above ground ___________ 59
Figure 61 - Wind path lines (W-N-W wind) _________________________________ 59
Figure 62 - West-North-West wind, windspeeds in a vertical plane near the subway __________ 60
Figure 63 - Problem met with the model: two layers over imposed in the file ______________ 60
Figure 64 - Simplified process for modeling __________________________________ 62

Table 1 - Summary of the three main environmental labels [16], [17], [18], [19] _____________ 11
Table 2 - Average energy needs per building type ______________________________ 18
Table 3 - Energy needs and reductions ____________________________________ 23
Table 4 - Sensitivity analysis on district needs ________________________________ 23
Table 5 - Properties and strategies related to solar impact _________________________ 24
Table 6 – Physiological Equivalent Temperature (PET) comfort index _________________ 32
Table 7 - Qualitative analysis of the ten district's variations ________________________ 42
Table 8 - Beaufort Scale [44] __________________________________________ 44
Table 9 - Grades for plans' comparisons ___________________________________ 45
Table 10 - Summary of 3D CAD modeling: from architects to engineers _________________ 51
Table 11 - Differences in surfaces in the modeling tools of two simulations _______________ 53
Table 12 - Simulation tools comparisons on a reference building _____________________ 54

Equation 1 - Energy sharing potential _____________________________________ 21
Equation 2 - Potential reduction ________________________________________ 22

 Page|IV
Glossary

Glossary

AEC Architecture, Engineering and Construction industry
BIM Building Information Modeling

BREEAM British Research Establishment Environmental Assessment Method

CAD Computer Aided Design

CSTB Scientific Center for Building Techniques (stands for Centre Scientifique et
 Technique du Bâtiment)
DHW Domestic Hot Water

DIMOSIM Energy simulation program developed by French scientific center for buildings
 (CSTB)
EcoCité French state investment program to promote innovative urban development,
 collaborative economies and sustainable energy in cities
EcoQuartier French label for sustainable districts

EMS Energy Management System

EnviBatE Energy simulation program developed by La Rochelle University

Envi-Met Commercial microclimate simulation program

EPA Public Urban planner (stands for Etablissement Public d’Aménagement)

GHG Green House Gas

GIS Geographic Information System

HIE Heat Island Effect

HQE High Environmental Quality (stands for Haute Qualité Environnementale)

HVAC Heating, Ventilation and Air Conditioning

ICT Information and Communication Technologies

LEED Leadership in Energy and Environmental Design

Mtep Mega Ton Oil Equivalent (Mtoe) (stands for Million Tonne equivalent pétrole)

PEB Positive Energy Building

RT2012 Thermal Regulation (currently applied from since 2012)

 Page|V
Introduction

1. Introduction
The sustainable urban development has become a key concern for the last decades. With population
growth and climate change issues, cities worldwide will face social, economic and environmental
challenges. Indeed, by 2050 the urban population is expected to reach 80% of global population [1] while
cities already demand 75% of energy resources, and are responsible for 80% of Green House Gases
emissions [2]. As constructions and infrastructures last for decades, urban planning and design is essential
to create or upgrade cities, for cleaner, smarter and more resilient territories.

In the European Union, the building sector is the main energy consumer with 38% of final energy [3],
and represents 36% of CO2 emissions. In France, it represents 44% of the energy consumption, i.e.
70MToe [4], increasing by 25% over the past two decades. With more than 90% of the time one spends
being in a building (residential or tertiary), comfort is also a criterion for the attractiveness of the
buildings and cities. Following Grenelle Laws and Thermal Regulation, energy consumption is expected
to be halved by 2050 compared to 2012 levels, with a step of -38% by 2020 [5]. Other objectives of
renewable energy integration and energy thresholds set a solid framework for new constructions in both
the residential and tertiary sectors.

Even if strong policies are still lacking at district scale especially for energy sharing, incentives and tools
for sustainable urban development have emerged, fostering greener and more collaborative projects.
Environmental and energy labels both at building and district scale allow for exemplary projects. Such
projects provide the AEC industry and public authorities with both demonstrators to test new
technologies, as well as methods to gather knowledge and democratize such highly performing districts.
This strategy aims at making greener territories quicker, and help to improve regulations towards more
stringent ones.

At the same time, new technologies and methods help to plan, design and build more efficient and
resilient cities. Information and Communication Technologies (ICT) and energy technologies make cities
and buildings smarter. Building Information Modeling (BIM) as a project tool helps to gather means for
better project management. Energy Management Systems (EMS) make energy supervision a tool for
facility managers and owners for better energy utilization. Sustainable City, Green City, Smart City and
other concepts aim at making the best use of technologies and environmental practices for more livable
cities. Cutting in carbon and GHG emissions, reduce needed resources and optimizing the used ones and
limit climate change are key goals of the cities of tomorrow, amongst social, transportation, economic,
health, welfare, safety and many other issues and constraints. Risk management might also appear as a
key tool for resilient and flexible cities, facing increasing hazards. Yet, the new smart districts will only
be accepted by citizens if they comply with their expectations and do not only put in place technologies,
but include the user in the processes and take their expectations into consideration [6].

Urban planners must therefore cope with as many issues and uncertainties. Still, this thesis does not
intend to provide a framework for Smart Cities design, but rather a framework to engineer more efficient
and comfortable districts. Cities indeed transform step by step in renewing or creating districts, and
such projects have specific engineering and management methods related to their scales. The main
objective of this thesis is to investigate whether performing simulations in preliminary design phases can
be an asset for smarter urban development, and which engineering and management framework it does
require.

 Page|1
Methods 2. Methods This thesis will study the engineering and management aspects of preliminary studies at district scale through simulation tools. Such studies are meant to help the urban planners and real estate developers to create an energy efficient and exemplary district, while keeping comfort a priority. The thesis will therefore try to answer those three questions: Are simulation tools at district scale useful to urban planners and architects? Which urban development strategies do these tools unlock? Which management is necessary to perform such studies? The thesis is mainly based on study cases of actual real estate projects in France, a first one in advanced planning phase and the second one in early planning phase. Simulations are conducted by experts in their domains and a management and synthesis work is performed in this thesis to capitalize a return of experience on both technical and organization aspects. The simulations are run on the first project, and the second one serves for proposing a Smart City strategy, supported by simulations, that are therefore re-tested in part. First, a review of construction techniques for energy performance is performed, as well as policies which lead to more sustainable urban development. Then the study cases are analyzed and finally conclusions are drawn. The method for this thesis is represented by the schematic in Figure 1. An iterative process is used: the framework is designed from return of experience on the main project and re-applied to be assessed and improved. Figure 1 - Methodology for the framework The academic return of experience is based on engineering aspects of the simulations, helping urban planners to design the district. Such aspects are energy and/or comfort related. The management return of experience is needed to assess the replicability of the simulations. Such aspects are time, cost or organization related. To use these tools or methods in other projects, one must prove them useful and feasible. Three tools and methods are studied in this thesis: 1. Energy needs at district scale, with the DIMOSIM tool performed by the CSTB (Scientific Center for Building Techniques) 2. Heat Island Effect and micro-climate, with the EnviBatE tool from La Rochelle University and TIPEE platform, and Envi-Met, a commercial microclimate program 3. Aeraulic simulation of the district, with the Computational Fluid Dynamics software OpenFoam performed by AeroConcept Engineering enterprise Page|2
Methods These tools are aimed to assess independent aspects of the buildings in the district, from the pure energy needs of the systems and buildings, the wind effects between the buildings, to the full microclimate. They all aim at providing extra information and pre-design the district so that architects and study offices design and build an exemplary district. Therefore, these studies test the preliminary inputs and are not based on the final data. They also investigate engineering strategies that intend to assess aspects that are not usually looked upon. 2.1. Energy needs at district scale Buildings are usually designed independently with Dynamic Thermal Simulation and more advanced Dynamic Energy Simulation which gather thermal behavior of the building with other aspects such as lighting, Heating Ventilation Air Conditioning (HVAC), internal gains of occupants and systems, weather and aeraulic conditions. They also compute production, transformation and distribution systems. While well understood at small scale, it is uncommon to compute tens of buildings together. Physical phenomena are to be considered at a larger scale and must therefore drop specific and detailed analysis. Still, such study can help to design energy sharing and energy needs, to implement a District Heating and Cooling Network, or energy sharing between a dozen of buildings thanks to heat pumps and recovery systems. The use of DIMOSIM tool allow for buildings to be modeled in only a few thermal zones, with physical properties and equipment, as well as considering occupancy profiles. 2.2. Heat Island Effect and micro-climate Scientific research has shown that a significant temperature difference is remarked between urban and rural areas [7]. This phenomenon is called the Heat Island Effect (HIE), which reflects mainly two aspects [8], [9]: The urban area made of concrete and buildings is a greater absorber of thermal energy than vegetized areas, which contributes to longer inertia of this thermal energy. This latter is trapped and increase the temperature over greater period. Anthropogenic activities, such as transportation, increase the air pollution, responsible for local warming. The main responsible for local air temperature rise is air conditioning, which rejects heat outside buildings. This effect has a feedback loop, as cooling increase outside temperature cooling needs increase, and so on. Figure 2 - Heat Island Effect over several types of urban zones Simulation tools can help to assess the microclimate and the design of the district [10]. The goal of this study is to analyze the district regarding the HIE effect, thermal comfort and energy potential. Microclimate can affect architecture on mainly two aspects, the first one being the location and volumes of the buildings, and the second one being materiality aspects such as albedo, local architectural details (balconies, shading…). The influence of urban elements such as vegetation is also a key parameter. Page|3
Methods

 2.3. Aeraulic simulations
Based on fluid mechanics methods from Euler and Bernoulli equations, the Computational Fluid
Dynamics (CFD) methods evolved with empirical models and improvement of computational power.
Well known from the aeronautic, automotive and fluids engineers, such numerical methods are
uncommon in the architect field. Still, wind is a great influencer of architecture, as shapes often recall
fluid movement. Plus, wind is a comfort criteria in living areas, and the Beaufort scale relates this.

This study aims at assessing the buildings shapes and vegetation considering the comfort within the
district. Urban planners then have specific information to act on the urban plan and buildings
architecture.

 2.4. Project framework
These simulations tools are tested on Project Descartes, an EcoCité urban development project in Marne-
la-Vallée, France. On a wide territory, EPA Marne leads several projects, one of them being the Descartes
district, a 100.000m² area from both part of a railway, dedicated to becoming a demonstrator for energy
performance. Several kinds of innovations are tested on this project, from methods to techniques, and
one should expect a return of experience to assess the replicability of the actions. The main goal of the
project is to create an exemplary district from the energy point of view, but also in comfort, mix of use-
cases and space utilization.

Real estate projects usually gather a lot of actors and a robust project management is needed to avoid
bias, delays and extra costs. In this case, extra actors and processes are present in a pre-design phase,
which makes the process even more complex.

The district is separated in three parts: A1, B1 & C1, from left to right in Figure 3.

 Figure 3 - Artistic view of Cité Descartes [11]
EPA, as the commander of the operation and public organization receiving funds from the state, is the
top supervising entity in the first place, yet real estate developers will end to be the owners of the field

 Page|4
Methods and buildings. In the Investment for the Future Program, the French State has funded part of the project to acquire larger knowledge on construction and therefore expects a return of experience. The project is organized as shown in Figure 4: the French state provides subsidies to the public urban development agency, which plays the role of project organizer for the municipalities of the territory. In the first place, an architect designed the district and specified goals and orientations for how to live in this place. Very innovative, this first design should serve as a basis for the whole project, when real estate developers (one for each part), selected on contest, come to design and build the district with their own architects and study offices. By choice, the real estate developer for B1 (at the center of the district) has been selected to take part in the research process. This research process, funded by the State and coordinated by the urban development agency has several sub-parts, one of them being the Energy Performance Management: based on the modeling of the district by the first architect and the architect of B1, innovative research simulations are conducted to: Draw recommendations on the district energy performance through a technical and methodological guide for the real estate developers to consider Set an innovative framework for the real estate developers to follow and therefore ensure performance, for instance through an “integrated formation system” Provide a return of experience about the research itself: are those researches useful and is the process replicable? Figure 4 - Management diagram of the EcoCité Descartes project The architects provide with urban plans: 1. First architect who states the shapes and spirit of the project (Figure 5 top) 2. Second architects who, separately design A1, B1, C1, and should respect the spirit and global shapes (Figure 5 bottom). Still, they can diverge from the initial plan. Page|5
Methods

Therefore, the simulations are provided with an initial plan from architect 1, and several plans from
architect 2 (on B1, center of the district) at different steps of their advancement. The simulations can
run on the initial plan from architect 1 and influence the following plans, as well as running on the final
plans of architect 2 to help designing the final district urban morphology.

 Figure 5 - B1 of the urban planner (top) and the real estate developer (bottom)

 Page|6
Review of the energy-building context

3. Review of the energy-building context

 3.1. Energy market context
Worldwide, the energy consumption keeps rising, with only short declines or slowing in financial crisis
periods, such as in 2008. Estimation by the Energy Information Agency are 48% increase by 2040
compared to 2012 levels. Renewable energies are forecasted to soar, as is natural gas, while coal and
nuclear only have restrained increase. Liquid fuels are still dominating the energy market, especially
governing the transportation market as today’s situation. Still, in OECD countries, energy consumptions
are steady and projected as slightly increasing, while non-OECD countries will have a proportional
increase of energy consumption by 2040 [12].

Similarly, in France, the energy consumption has followed the OECD trend, and even decreased since
the financial crisis (Figure 6). Major energy consumers are the residential-tertiary sector at 44,4%,
followed by transportation and industry sectors respectively with 31,8% and 17,7% of the market share.

 MToe =

 Transports
 Agriculture
 Residential-Tertiary
 Steel Industry
 Industry

 Figure 6 - French final energy consumption per sector [13]
The share of electricity has kept rising over the last four decades, with increasing electrification of urban
areas and equipment. Worldwide, electricity consumption has risen by 350% between 1973 and 2013,
and by 280% in France. While coal’s share in the energy market falls, electricity and thermal energy
from renewable energies increases. Regarding the electricity market only, the tertiary and housing sector
is the main consumer, with 68,6% share, way ahead industry and transport. CO2 emissions kept steady
over the last twenty years, slightly decreasing from 2005 and reaching 353 megatons of CO2 in 2012, but
unitary emissions decreased from 89 kgC02/m² in 1973 to 30 kgCO2/m² in 2012.

The residential-tertiary sector is mainly consuming electricity (37%), but one can notice the sharp
increase of renewable energies since 1973, reaching 15% in 2012 (Figure 7). The trends are to replace
petroleum and coal by carbon-free and more efficient technologies. The share of gas also increased as
heating technologies using boilers democratized and gas prices stayed under 0,07€ per kWh, while
electricity roughly costs 0,12€/kWh.

 Page|7
Review of the energy-building context

 Electricity
 Waste & Renewable
 Gas
 Petroleum
 Coal

 Figure 7 - Final energy consumption per type in the residential-tertiary sector [13]
With increasing population, the consumption of the housing sector is steady and even decreases over the
last years. The mean energy consumption per house is 1,6 toe/year, equivalent to 18,5MWh of final
energy. This represents roughly 20MWh per inhabitant considering that a little more than 2 people
occupy a house on average in France. In 2011, the average unitary energy consumption was 186kWh of
primary energy per square meter per year (kWhpe/m²/y). From 1973, it has dropped by roughly 1,2%
per year. (Figure 8)

 Gas
 Electricity
 Fuel
 Wood
 District heating
 Oil
 Coal

 Figure 8 - Final consumption in the residential sector [13]

Similarly, the tertiary sector energy consumption is mainly based on electricity, gas being more marginal
than in residential. The trend also shows a decrease of fuels utilization. Heating and hot water represent
more than the half of the consumption, however depending on the type of facility. While the average
unitary consumption is around 200kWhpe/m²/y, commercial and offices buildings, which are the main
types of buildings in terms of number, ranges from 230 to 260kWh/m².

 3.2. Regulations
Since Kyoto protocol and Grenelle laws, energy and GHG emissions have become of primary concern for
public authorities, wishing to greatly reduce energy consumption of all activities, including buildings.
Following Grenelle 1, The French government enacted the renovation of public buildings to reach 38%
savings by 2020, and renewed the Thermal Regulation: RT2005 being replaced by RT2012. Applicable
to all buildings since 2013. From Grenelle 1, RT2012 asks for technological and industrial improvements
to provide new buildings with energy technologies ensuring their performance, low emission rates and
the national energy independence. RT2012 obliges buildings to consume less than 50kWh/m²/year of
primary energy – on average -, regarding the five-regulated use-cases: heating, DHW (Domestic Hot

 Page|8
Review of the energy-building context Water), lighting, cooling, and auxiliaries (mainly pumps & ventilation systems). This energy threshold can be exceeded, only if local renewable energies – such as Photovoltaics (PV), waste treatment or wind – can bring the global consumption back to 50kWh/m²/year. What are called Low Consumption Buildings (Bâtiment Basse Consommation, BBC) represent buildings that were built anticipating or following RT2012 recommendations, such projects starting now to give some return of experience. Regarding the Grenelle, the goal of the RT2012 is to reduce primary energy consumption by 150 billion kWh between 2013 and 2020 - representing 23 billion €, based on the electricity price – and 13 million tons of CO2. Even with constantly improving technologies, it is unsure whether the constructions built after 2012 would have been better than before, as real estate developers would maybe have reduced costs at the expenses of quality, as it is done in other industrial sectors. The evolution of Thermal Regulations is depicted in Figure 9 [14]. Figure 9 - Evolution of French Thermal Regulation [14] RT2012 asks for a certified calculation to be performed and three main criteria to be respected: bioclimatic design, primary energy consumption and comfort temperature. The calculation process is described in the law and software must receive approval of authorities to be used as RT2012 certificates. 3.3. Construction techniques for energy efficiency This section will present the main techniques and parameters that influence energy consumption of buildings. Amongst them, one can dissociate passive to active solutions, the first one making the building intrinsically efficient, the second one aiming at utilizing just the necessary energy for an active management of the equipment. Passive solutions aim at increasing the intrinsic quality of the building to optimize the utilization of the incoming energy. The types of energy that are subject to passive solutions are mainly: solar energy (direct & indirect radiation, wind), geothermal energy of the soil, and internal gains of the occupants, and all the parameters that can influence it: shading, wind-shading, insulation, etc. [15] Building and architecture design The energy performances can be enhanced through the optimization of many parameters. Considering the environment, the orientation helps to capture or protect from solar energy depending on the season. Thermal insulation of walls and windows, which allow for inertia to be created, enhance the thermal behavior. Up to 80% of thermal losses could be avoided with outdoor thermal insulation. Similarly, 90% of air leakages could be avoided with good air tightness between carpentry and walls, or at electrical equipment locations. Finally, ventilation systems, such as balanced ventilation (dual flow), allow for a better equilibrium between internal temperature and air renewal, enhancing by 70% the energy losses compared to usual ventilation (single flow) [15]. Page|9
Review of the energy-building context Heating and cooling systems As roughly half of the energy is consumed by heating in the average residential homes in France, the consumption can be optimized by installing energy efficient equipment: condensing and low temperature boiler, renewable energy equipment (solar thermal, heat pumps, geothermal, biomass), and cogeneration boilers. Electrical equipment Finally, one of the growing consuming items are electrical equipment for domestic or entertainment usages. 15% of residential consumptions come from lighting and home appliances. The only possibility is to install equipment with high energy grades, such as LED lights or high-performance washing machines, etc. Active solutions aim at the using the necessary energy by an active management of the equipment. Smart devices are the main active solutions. They can measure, control and regulate electrical consumption of buildings through sensors (temperature, CO2, hygrometric, presence, opening…) and actuators. These devices then act or help the user to act to avoid useless consumptions. These solutions mainly represent the Smart Home market, and are estimated to reduce energy consumptions by 10% to 20% in homes. 3.4. Labels Beyond laws represented by RT2012, certifications and labels aim at adding extra value to projects by certifying extra performances compared to regulations. Labels can be delivered by certification agencies and are based on specific processes and criteria that projects must follow and fulfil. Labels can focus on specific elements, but mainly are about: Thermal insulation calculations and certifications by a study office Air tightness tests Controlled ventilation for air quality Orientation and architectural conception Use of renewable energies and energy efficient technologies for heating, cooling and domestic hot water Home appliances User’s behavior Mainly, regulations kept following labels by adapting to those latter and taking experience from them. RT2012 has taken in account the BBC (Building Low Energy) label of 2007, which then has been replaced by Effinergie+, stating goals of 30 kWh ep/m²/year. PEB (Positive Energy Building) is labelled in France by BEPOS Effinergie (Bâtiment à Energy POSitive) since the end of 2013. Grenelle II asks that all new buildings are PEB from 2020, which will be the standard for RT2020. From 2013 to the arrival of the standard, BEPOS label prepares AEC industry to elaborate criteria and objectives. This label is used as a test and capitalized return of experience. BEPOS criteria of course include RT2012, but also Effinergie+ standards. Extra requirements are: Grey energy analysis “Ecomobility”, meaning that users displacements are considered, which restrains the location of the building Process to assess that equipment function properly in use Page|10
Review of the energy-building context Environmental labels at international level focus on other aspects than pure energy consumption of buildings, as the previously mentioned labels. Three main labels are on the market: Building Research Establishment Environmental Assessment Methodology (BREEAM), established 1990 in UK Leadership in Energy & Environmental Design (LEED), established 1998 in USA Haute Qualité Environnementale (HQE), established 2004 in France Table 1 - Summary of the three main environmental labels [16], [17], [18], [19] Label BREEAM LEED HQE Performance 5 4 4 levels Pass / Good /Very Certified / Silver / Bon / Très bon / Excellent / good /Excellent / Gold / Platinium Exceptionnel Outstanding Criteria 10 criteria 9 criteria 14 criteria Management ; Water ; Management ; Water ; Eco-construction : building & Health ; Energy ; Site durability ; environment, materials, low Waste ; Transport ; transport & location ; impact construction Pollution ; Ecology ; innovation ; energy é Eco-management: energy, water, Innovation ; Materials atmospheric pollution ; waste, maintenance regional priorities ; Comfort: hygrothermics, visual materials & resources ; impact, olfactive impact interior quality Health: sanitary quality, air, water Allows for THPE labels in France The labels also offer a specific mention for project that respect extra criteria while in operation phase. This is essential to continuously assess the buildings, with the real usages, and not only on paper and computer calculations. This adds extra value to the buildings and enhance AEC industry’s knowledge about how the buildings and users behave in real life, and how they evolve along time. 3.5. “EcoQuartier” and “Ecocité” Worldwide, many districts have been innovative and engaged in environmental approach: Hammarby Sjöstad in Sweden, Fribourg-en-Breisgau in Germany -being in 1996 the very first district of the kind-, Caserne de Bonne in France, etc. At larger scale, many cities engage in political campaign of energy and environmental procedures, such as Paris, Stockholm, Rotterdam, London… and other cities. At the district level, energy and environmental performances are of primary interest for public authorities. The trend in France, and Europe in terms of urban development has been at district scale, either using free lands or completely renewing districts. A lot of urban development operations were launched in France by municipalities through call for tenders. Many aspects are to be considered in such urban development operations: energy, ecology, social, economics, construction, architecture, etc. The EcoQuartier approach was initiated in 2008 [20], a state label named after it was released in 2012 by the French ministry of ecology, durable development and energy (MEDDE). This approach aims at increasing the comfort of users in districts and improve the AEC industry’s and public authorities’ knowledge to build better cities. Indeed, even if buildings might belong to private owners (real estate developers, social landlords, trustees…), the overall district is often a mix of housing, commercial, offices, infrastructures, public infrastructures, etc. and therefore need to be under public regulation and control Page|11
Review of the energy-building context of the municipalities. The label aims at promoting energy performance and ecological footprint with high standards. Innovation and highly performing techniques are encouraged to fulfil the cited criteria. Many examples could be cited as more than 50 projects are now fully labeled EcoQuartier and more than 200 under process. One of the first district is for instance Caserne de Bonne in Grenoble engaged since 2009 and labelled in 2013. The main characteristics of an EcoQuartier are: Energy: Reduction of energy consumption of buildings and inclusion of renewable energies Mobility: foster soft mobility and common transports, limiting cars… Water: rainwater recovery, used water management… Waste: selective sorting, recycling… Biodiversity: favor biodiversity development, reduce construction footprint on flora and fauna Construction: materials management, recycling, respect of neighborhoods… Furthermore, users are at the center of the approach, and their education is also a specific aspect of EcoQuartier. EcoQuartier will keep evolving till the AEC industry and municipalities fully integrate all the aspects natively in every construction project. The approach will improve along with innovation and construction techniques, and continuously search for new models, adapt to cities’ needs and current situations, to lead all the actors towards better cities. Another approach, named EcoCité [21], is slightly different than EcoQuartier. To face climatic changes and cities attractivities challenges, the French State favors ecological transition of territories at an even larger scale than EcoQuartiers. The “Programme Investissement d’Avenir”, literally Investment for the Future Program, is gathering investments for innovation to be tested in different sectors: industry, health, energy, and cities. The sub-program “Ville de demain”, literally City of tomorrow, is allocated with 668 million euros to favor new ways of designing cities. Since 2010, the French State alongside with public and private actors favors very innovative projects. They aim at developing more attractive and resilient cities. Thirty-one territories are part of the program and engaged in innovative projects to assess methods and techniques to improve cities’ design. These projects are not incompatible with the EcoQuartier label, but are slightly different and at a larger scale. The aim of EcoCité is to finance experiments and demonstrators to test new urban models at metropolitan scale. EcoCité is therefore complementary to EcoQuartier and represents the next step to fully apprehend cities’ scales. An example of an EcoCité is the territory of Marne-la-Vallée, which engaged 14 innovation projects, to bring new ways of designing districts, to unlock technical and organizational processes and then accelerate the energetic transition. The goal is to assess the replicability and improve the knowledge of public and private organizations, for further redevelopment of these techniques, using a strong return of experience. Innovations for this project are for instance 5th generation road, Building Information Modeling, PEB in wood construction, agriculture in urban area, acoustic engineering, vibration absorption of buildings, and finally energy efficient design [22]. The energy efficient design part is the object of the study case of this thesis, return of experience and organizational management, as well as engineering, are discussed further in the next chapter. 3.6. District studies For centuries, urban development has been considering climate and environment, as well as smart infrastructures. Mediterranean cities with the heritage of ancient Roma feature smart thermal water networks, narrow streets to cope with summer heat, and refreshing gardens. However, the recent Page|12
Review of the energy-building context

urbanization has proved to be intensive construction to cope with residential needs and economic
development, and not much considering the efficiency and comfort aspects. That is only until recent
awareness of climate and resources issues that deeper studies were undertaken, mainly for academic
purposes, and very scarcely for real projects. The emergence of simulation tools has progressively enabled
for studies to be undertaken, mainly at building level. Dynamic Energy Simulation (DES) of thermal
and energy equipment in buildings is nowadays of common use, to design the building properties and
equipment that are installed in it. The emerging Smart Cities project also led to huge numerical
simulations of fluxes in cities, as well as large scale urbanization and energy plans.

Still, district scale studies are rare, but their interest is sharply increasing as one finds that the
urbanization is nowadays performed district by district. Indeed, the rehabilitation of former industrial
areas or residential areas leads to projects of a few hectares to be presented to call for tenders by
municipalities. Real estate developers and urban planners could then use such tools to design efficient
district.

Energy simulations at district scale are basically extension of DES tools with adapted physical models,
with software being able to compute several buildings representing a few thermal zones instead of a few
buildings with a lot of thermal zones. Floors are for instance only modeled, instead of each room. This
simplification lead to differences in results, but this simplification is necessary to compute as many
buildings.

Micro-climate and aerodynamic simulation of districts seems to be still at academic level and step by
step enters the engineering industry. The study of the site of French Ecole Polytechnique was for instance
performed thanks to the UrbaWind software, to assess comfort next to buildings (Figure 10) [23]. A
district is Marseille, France, was recently designed using aeraulic simulations for buildings to be resilient
to the Mistral wind [24].

 Figure 10 - Windspeeds modeled with UrbaWind (left) – Smartseille design principle (right)
Micro-climate has been thoroughly studied regarding urban development and energy consumptions of
buildings [25], urban shapes for comfort on EcoQuartier districts as well [26]. They of course consider
water and vegetation as parts of the equation [27], coupling energy and fluid dynamics equation [28].
Trees were assumed, in 1985, to save $273 annually thanks to cooling savings, erosion and pollution
protection [29]. Indeed, cooling could be reduced by 15% to 35% with proper tree utilization [8]. Urban
shapes also affect the solar fluxes, as well as material types [30]. The effect of cool-paints was compared
to the effect of vegetation and proved to be more effective to reduce Heat Island Effect, by sharply
increasing heat reflection and therefore reducing outdoor temperature [31].

Still, it is rare to perform such studies at district scale for actual projects, costs and time often being
issues, as well as lack of actual benefits for the project. Microclimate simulation software such as Envi-

 Page|13
Review of the energy-building context

MET [32], which models the thermal evolution of the urban scene, can be used but calculations are time
consuming.

 Figure 11 - Solar flux and tree interactions [33] Figure 12 - Solar fluxes trapping between buildings [30]

 3.7. Building Information Modeling
Another change in the AEC industry comes from the Information and Communication Technologies
(ICT), both for home automation improvement with Smart Homes and Smart Cities, but also for the
engineering and management part of building design. The Building Information Modeling, BIM, is both
a process and a tool. The BIM sets steps for building design, from 3D modeling to financing, management
and time: the 6D model. BIM also represents the 3D CAD model itself, which gathers all the information
of the building(s): geometrical, physical properties, materials types, but also information on each object
in the building (windows, pipes, doors, …) with their names, model, production number, etc. [34]

BIM allows, therefore, a more collaborative approach of the construction, from design to actual building.
All actors have access to the same file, with the exact same information. Level of Detail (LoD) evolves
from the beginning to the end of the project. BIM is expected to shift the workflow towards the beginning
of the project, spending more time designing than building, thanks to BIM’s advantages. Indeed, BIM
should lead to less delays and costs, less defects, more client satisfaction. Indeed, as all actors
collaborates, problems are less probable to occur in both design phase (clash detection, unique model),
but also during construction phase (interactive plans, construction timeline…) [35], [36].

BIM is expected to bring extra value regarding energy performance, as it can be used for simulations. It
could enhance the design phase of the building with more accurate data, but also help to consider life-
cycle analysis, and be used during building operations as well [37]. BIM based energy management
frameworks develop since the appearance of BIM [38], using the tool for both design and operation [39].

 Page|14
Results and analysis 4. Results and analysis 4.1. Engineering knowledge for urban development This section presents how urban development can be engineered in pre-design phase through the help of simulation tools. Those tools do not intend to thoroughly design the district on each and every aspect of energy. Indeed, at district scale the goal is to provide a wide view on a specific aspect with possibilities of focus. Furthermore, pre-design intends at diving orientations for the urban plan and not the construction itself, meaning that no complete control is possible on final energy consumptions of specific equipment in place. As mentioned in the Methods section, three studies were conducted on the Descartes district: 1. Simulation of energy needs at district scale 2. Simulation of the Heat Island Effect and micro-climate 3. Simulation of the aerodynamics (CFD) of the district The analyses are conducted separately, but a similar methodology is used: Data input gathering, model setup, understanding of the main characteristics of the district Preliminary analysis and model confirmation Analysis based on scenario (independent from human choices), variations (dependent on human choices) and parameters: o Scenario: weather input (e.g. wind), macro-economic and social conditions o Variations Geometrical: urban shapes, building architecture, urban elements (tree, bridge) Technical: type of material, equipment, physical properties… Usage: occupation profiles, consumption profiles, windows opening… o Parameters: related to the simulation tools, such as: Meshing accuracy Timestep Thermal zones All the studies are analyzed regarding different scenarios, variations and parameters, to bring extra value on the results and academic return of experience. Separating those types of study also allows to bring coherence in the studies and simplifies the management process. Energy needs at district scale Using a Dynamic Energy Simulation tool DIMOSIM [40] with the district modeled thanks to CityGML energy needs and potential of a district heating system can be simulated. The simulation model is based on physical phenome at the scale of buildings, considering the envelope and thermal transfers, energy systems, solar inputs and masks, pressure and temperature in piping networks, etc. The calculations are dynamic all over the year with a time step set to 1h, providing 8760 data points for the outputs, which are energy needs for heating, cooling, and Domestic Hot Water (DHW). The calculations are based on the following inputs: Weather file: solar input, outdoor temperature. Page|15
You can also read


