ENERGY TRANSITION SHELL - REPORT - Shell Global

Page created by Marc Simpson
 
CONTINUE READING
ENERGY TRANSITION SHELL - REPORT - Shell Global
SHELL

ENERGY
TRANSITION
REPORT

             1
ENERGY TRANSITION SHELL - REPORT - Shell Global
SHELL AND
THE ENERGY TRANSITION

CONTENTS
Chair’s message and Chief Executive Officer’s introduction
Executive summary
1. Towards a low-carbon future
2. Shell Scenarios
3. Our resilience in the medium term, to 2030
4. Changing our portfolio in the long term, after 2030
5. Shell’s actions today
6. Working with others
Closing Comment

                                                             3
ENERGY TRANSITION SHELL - REPORT - Shell Global
CHAIR’S MESSAGE
   Chad Holliday, Chair
                                                 This report is an important step in answering a question     We also support the goal to improve access to energy        There are many uncertainties ahead. No doubt we will
                                                 I’m often asked by investors, politicians, reporters, and    for the 1.1 billion people on earth who are still without   have setbacks along the way, but when that happens
                                                 even friends. How can Shell survive, let alone thrive, as    electricity, and the 3 billion who cook using solid         we are determined to pick ourselves up and move on
                                                 the world transitions to lower-carbon energy?                fuels that pollute their air and reduce the quality of      quickly. The key will be to engage, learn and adapt to
                                                                                                              people’s lives.                                             find and realise new opportunities. And the same spirit
                                                 As you will read here, we see several possible paths                                                                     of innovation that has been the foundation of Shell’s
                                                 towards a lower-carbon energy system. And we believe         Shell can play a part here by offering new energy           success for more than a century will continue to fuel
                                                 we have a strategy that is flexible enough to keep in step   supplies to communities that are underserved, and           our success in the future.
                                                 with the changes in the energy system as they unfold.        by providing cleaner energy solutions in the form of
                                                                                                              electricity generated from a combination of natural gas     In the three years since I became Chair of Shell, I have
                                                 This strategy is based on creating strong returns for our    and renewable energy.                                       seen great progress. Under Ben’s leadership, we have
                                                 shareholders and continuing to provide the world with                                                                    improved free cash flow and returns to shareholders. We
                                                 the oil and gas it needs for decades to come. It is based    Preparing for the future                                    acquired BG Group, speeding up our growth in natural
                                                 on exploring new business models and technologies to         Today’s Shell has many strengths: we have a global          gas and deep water to help meet demand for oil and
                                                 help us find the clear commercial winners in a lower-        energy supply and trading network; we have the              gas in the decades ahead. We have set bold climate-
                                                 carbon world.                                                biggest branded retail network in the world; we are a       related ambitions to prepare our company for the
                                                                                                              world leader in natural gas, the cleanest-burning fossil    future, and we have created a New Energies business,
                                                 Contributing to society                                      fuel when burnt to produce electricity; and we have         that is focusing on new, lower-carbon fuels and power.
                                                 Thriving through the energy transition also means            some of the best engineering and project management
                                                 working with society. The United Nations’ sustainable        expertise around.                                           I like to think that our New Energies business is
                                                 development goals provide an excellent roadmap, with                                                                     sowing different seeds in different places. Over time,
                                                 their pledges to end poverty, protect the planet and         We are preparing for the future by using those              we will see where the best and most profitable crops
                                                 ensure prosperity for all by 2030.                           strengths while investing in new areas of energy,           start to grow. Then we will give the winners all the
                                                                                                              whether that is wind or solar power, charging points        nourishment they need to flourish.
1	Throughout this report, Shell expresses
                                                 Shell is helping advance some of these goals. We             for electric vehicles or lower-carbon biofuels.
   Net Carbon Footprint in grams of carbon       have set an ambition to reduce the Net Carbon                                                                            These are the many reasons why the Board of Directors
   dioxide (CO2) equivalent per megajoule
                                                 Footprint1 of our energy products by around half by the      Building new skills                                         of Royal Dutch Shell is confident that the company will
   consumed. This includes methane and
   other greenhouse gas emissions. It covers     middle of the century. And we will review our progress       Over the course of the coming decades, as the world         continue to thrive and navigate the opportunities, and
   emissions directly from Shell operations,     every five years to make sure we are in step with society    moves increasingly towards lower-carbon energy, we          risks, of the energy transition ahead.
   those caused by third parties who supply
   energy for that production and those from
                                                 as it moves towards the Paris Agreement goal of limiting     will have to learn new skills at Shell. And the ways we
   consumption of these products by end-users.   global warming.                                              work will have to evolve.                                   CHAD HOLLIDAY
                                                                                                                                                                          Chair

                                                                                                                                                                                                                                     5
ENERGY TRANSITION SHELL - REPORT - Shell Global
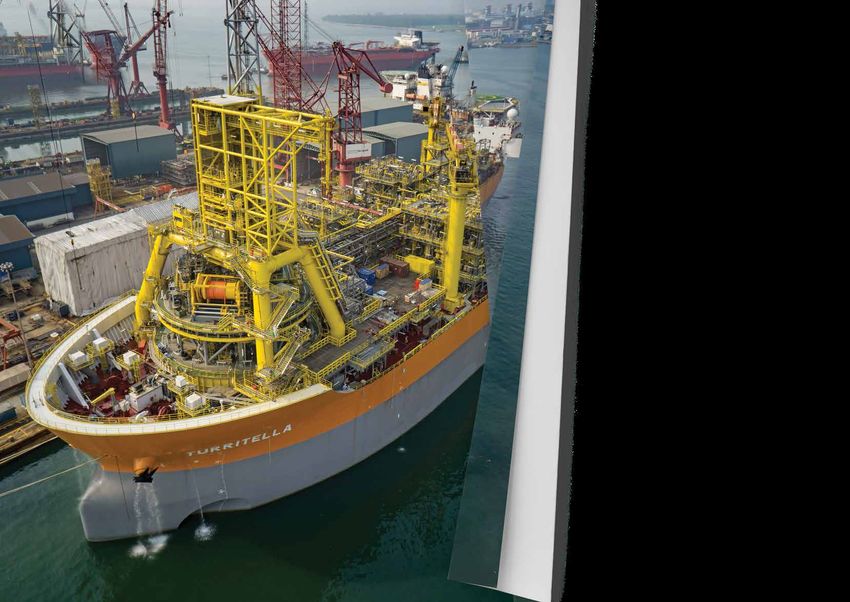
changes in the world. A rising global population and          We have many ways to achieve this ambition. They            and a greater use of renewable energy to power
                                                                    rising standards of living should continue to drive           include reducing emissions from our own operations, and     homes and businesses.
                                                                    growth in demand for energy for decades to come.              changing the mix of products we sell to our customers.
                                                                                                                                                                                              However, these steps will not be enough on their
                                                                    At the same time, there is a transition under way to a        This will drive change across our portfolio. It is likely   own. This is a long-term journey. There are tough
                                                                    lower-carbon energy system with increasing customer           to mean more renewable power, biofuels, and electric        challenges ahead that society will need to address
                                                                    choice and potential price volatility.                        vehicle charging points; supplying more natural gas         because the transition will require enormous levels
                                                                                                                                  for power, industry and transport; helping further          of investment, and profound changes in consumer
                                                                    Increased transparency                                        advance technology to capture and store carbon safely       behaviour.
                                                                    This report helps answer questions from shareholders,         underground; and helping develop natural carbon
                                                                    governments and non-governmental organisations                sinks like forests and wetlands to help compensate for      Shell is also on a journey. We cannot know exactly
                                                                    about what the energy transition means for Shell. It          those emissions that society will find harder to avoid.     how this transition will play out, or how long it will
                                                                    follows talks with the Financial Stability Board’s Task                                                                   take. But it could mean significant changes for Shell in
                                                                    Force on Climate-related Financial Disclosures, that is       We are already making investments in these areas.           the long term. We will learn, and adapt our approach
                                                                    calling on companies to be more open about climate-           And we expect to do more. We also expect to                 over time.
                                                                    related risks and opportunities.                              continue to invest in sustaining oil and gas supply to
                                                                                                                                  meet growing demand for energy around the world.            Understanding what climate change means for our
                                                                    I see this move towards greater transparency as an                                                                        company is one of the biggest strategic questions on
                                                                    excellent opportunity to demonstrate Shell’s strength         Achieving society’s goals                                   my mind today. In answering that question, we are
                                                                    and resilience in this period of profound change.             I am hopeful that the world can achieve the goals of        determined to work with society and our customers.
                                                                                                                                  the Paris Agreement. I believe society has the scientific   We will help, inform and encourage progress towards
Ben van Beurden, CEO
                                                                    This report has two main aims: to show our financial          knowledge, and that it is technically possible to           the aims of the Paris Agreement. And we intend to
                                                                    and portfolio resilience in the short and medium term         achieve a world where global warming is limited to          continue to provide strong returns for shareholders
       CHIEF EXECUTIVE OFFICER’S                                    to 2030, and to explain how we are preparing to               well below two degrees Celsius.                             well into the future.
       INTRODUCTION                                                 adapt for the longer term.
       We have set three strategic ambitions for Shell. They                                                                      In fact, many changes are happening already. We see         BEN VAN BEURDEN
       all provide a strong foundation for managing the risks       As you will read here, we assess the financial                a rising number of electric vehicles in some countries,     CEO
       and opportunities linked to the transition to a lower-       resilience of Shell’s business until the end of the next
       carbon energy system.                                        decade against a range of oil prices, which we have
                                                                    determined based on assumptions about economic
       Our first ambition is to provide a world-class investment    growth, government policies, consumer choices and
       case, which means being the number one company in            technology developments.
       our sector in terms of total shareholder return. This will
       give us the financial capacity to invest in areas where      And we use our scenarios analysis to look further
       we see growth, and to withstand volatility in oil and        into the future, where there is far more uncertainty. In
       gas prices, as well as in downstream manufacturing           this future, consumer choice, government policy and
       and marketing margins.                                       technological advances will influence the development
                                                                    of the energy system in ways that will be far reaching
       The second is to thrive through the transition to lower-     but impossible to predict with precision.
       carbon energy by meeting society’s need for more
       and cleaner energy. This means providing the mix of          Lower-carbon mix
       products our customers need as the energy system             If society is to meet the aims of Paris, we believe it will
       evolves. It means investing in assets that will remain       have to stop adding to the stock of CO2 from energy
       financially resilient in the energy system of the future.    in the atmosphere by 2070. That will require the world
                                                                    to significantly reduce the amount of CO2 produced for
       The third is to sustain Shell’s societal licence to          each unit of energy used by 2050.
       operate, to make a real contribution to people’s lives.
       This means being a responsible energy company that           Shell plans to keep pace and catch up with society’s
       operates with care for people and the environment.           progress towards the Paris goals. That will likely
                                                                    mean we need to reduce the Net Carbon Footprint of
       Our strategy is underpinned by Shell’s outlook for the       our energy products by around half by the middle of
       energy sector and the need to adapt to substantial           the century.

                                                                                                                                                                                                                                                         7
ENERGY TRANSITION SHELL - REPORT - Shell Global
Executive SUMMARY

      This report describes Shell’s
      understanding of the transition to
      a lower-carbon energy system2.
      It explains how we are driving
      our business strategy in the
      context of climate-related risks and
      opportunities. It presents why we are
      confident that Shell is resilient to the
      changes that may take place and
      how we intend to thrive by supplying
      the types of energy our customers
      will need through the transition. It
      also contains our response to the
      recommendations of the Financial
      Stability Board’s Task Force on
      Climate-related Financial Disclosures.

      2	This report is an update to the ‘Shell: Energy Transitions and
         Portfolio Resilience’ report (2016).

                                                                          9
ENERGY TRANSITION SHELL - REPORT - Shell Global
Chapter 1                                                                                                                 This is one of a series of Shell
TOWARDS A LOW-CARBON FUTURE describes the                   flexibility and intent to maintain a strong balance sheet
                                                                                                                          publications that contain information
importance of energy to support growth and prosperity.      to provide further resilience.
It highlights the societal challenge to provide more                                                                      about our view of climate change,
energy while reducing carbon emissions. Shell supports      We conclude there is a low risk of Shell having               the energy transition and our
the Paris Agreement to tackle climate change.               stranded assets, or reserves that we cannot produce
                                                            economically, in the medium term.                             company strategy.
Consumers, companies and governments will face
tough choices, and the path towards lower-carbon            Chapter 4                                                     The Financial Stability Board - TCFD
energy will vary by country and sector. Shell sees          CHANGING OUR PORTFOLIO IN THE LONG TERM,                      The Task Force on Climate-related Financial
commercial opportunity in the drive to provide more         BEYOND 2030 describes Shell’s intent to move in step          Disclosures (TCFD) is a global initiative to
and cleaner energy.                                         with society towards a lower-carbon future. It describes      get companies across all sectors to assess
                                                            our ambition to halve the Net Carbon Footprint of             climate-related risks and opportunities.
Chapter 2                                                   the energy products we sell by 2050. This will mean           It recommends that companies disclose
SHELL SCENARIOS explains how we navigate                    reducing emissions from our operations, but most of           information in four areas: governance,
uncertainties in the energy system by developing            the reductions will come from changing the portfolio          strategy, risk management, targets and
scenarios. It gives highlights from our three main          of products we sell.                                          metrics. Shell supports the work and
scenarios, called Mountains, Oceans and Sky. They                                                                         objectives of the TCFD. In this report, we
describe a wide range of possible outcomes for the          We outline the ways we could achieve this ambition.           provide information investors need to assess
energy system and show we expect demand for oil             These include selling more natural gas compared to oil,       our strategy and performance.
and gas to be higher in 2030 than today.                    selling more biofuels, selling more electricity, developing
                                                            more carbon capture and storage (CCS) capacity and            Shell discloses TCFD-relevant information
Sky shows the most rapid transition to lower-carbon         employing nature-based solutions, such as planting            through different channels:
energy. It represents a challenging but technically         forests or restoring wetlands to act as carbon sinks.
                                                                                                                          ■■   This is our second report on energy
possible and economically plausible pathway for the
                                                                                                                               transitions. It describes our strategy to
world to achieve the temperature goal of the Paris          Chapter 5
                                                                                                                               remain resilient and thrive through climate-
Agreement. Under this scenario, changes in energy           SHELL’S ACTIONS TODAY provides examples of how
                                                                                                                               related risks and opportunities.
demand emerge in the 2020s, and materially impact           we are already active in many of the growth areas
the energy system in the 2030s and beyond.                  that will drive our continued success and resilience. It      ■■   The Shell Annual Report/20-F provides
                                                            describes how we are managing operational emissions                further information on our governance and
In all three scenarios, investment in new oil and gas       including methane, growing our existing businesses                 risk management of climate change.
production will remain essential to meet society’s          in areas such as liquefied natural gas and investing          ■■   The annual Shell Sustainability Report
ongoing demand for oil and gas for decades to come.         in new businesses such as new fuels, electric-vehicle              publishes relevant climate-related emissions
                                                            charging and providing electricity to homes.                       performance data.
Chapter 3
                                                                                                                          ■■   Periodic Shell scenario publications share
OUR RESILIENCE IN THE MEDIUM TERM, TO 2030                  Chapter 6
                                                                                                                               our analysis and understanding of the
demonstrates our ability to remain competitive and          WORKING WITH OTHERS illustrates the ways we
                                                                                                                               ways the energy system could evolve over
resilient even in Sky, our scenario that shows the most     are collaborating and sharing our knowledge with the
                                                                                                                               the long term.
rapid transition to lower-carbon energy. We present         many different actors in society. We aim to help inform
the sources of our resilience to potential changes in the   and accelerate the policy, technology and societal
energy system. These include our strategy to reshape        changes that will be necessary to achieve a successful        Our company website contains further
the company, the diversity and quality of our portfolio     transition.                                                   relevant information such as equity emissions
of businesses and geographic footprint, and our strong                                                                    performance data, executive speeches, feature
financial framework.                                        This section also explains that we see a government-          articles and news items. We have mapped
                                                            led price on carbon as an essential tool for reducing         Shell´s 2018 disclosures against the TCFD’s
We describe our active portfolio management that            emissions.                                                    recommended categories in the appendix at
will grow our business in areas that we expect to be                                                                      the end of this report (see page 77).
important in the energy transition, while reducing costs
and improving our CO2 performance. We illustrate
our capacity to generate free cash flow and the
sensitivity of our cash flow to oil prices ranging from
$40 to $100 per barrel and to government-led CO2
costs. And we explain our capital discipline, capital

                                                                                                                                                                              11
ENERGY TRANSITION SHELL - REPORT - Shell Global
1.
Towards a LOW-CARBON FUTURE

                               Society today faces a challenge
                               on an unprecedented scale:
                               how to meet increasing energy
                               needs while reducing carbon
                               emissions.

                               As societies grow and people
                               pursue a higher quality of life,
                               demand for energy increases. It fuels
                               economies, homes, schools, industry,
                               transport and construction. It’s the
                               vital ingredient in the products and
                               services many of us take for granted
                               in our everyday lives.

                                                                       13
ENERGY TRANSITION SHELL - REPORT - Shell Global
Today’s energy system is the result of many                                   IEA KEY ENERGY STATISTICS 2017
decades of choices by consumers, energy
suppliers and governments. Societies want                                                               10%
energy that is reliable, widely available and                                                 4%
                                                                                                                                  27%
affordable. As a result, hydrocarbons account                                            5%
for more than 80% of the energy mix.
                                                                                                          13,647
Now society faces one of its toughest challenges                                                           Mtoe
ever: how to provide more energy to a growing
                                                                                      22%
world population, while also reducing the
greenhouse gas emissions that contribute to
                                                                                                                               32%
climate change and to air pollution, which affect
people around the world.
                                                                                                  Coal               Nuclear
                                                                                                  Oil                Renewables including Hydro
Addressing this fundamental challenge must                                                        Natural gas        Bio-energy
include providing energy to the 1.1 billion
people who have no access to electricity, or the                              Mtoe = Million tonnes of oil equivalent
                                                                              Source: International Energy Agency, 2017.
3 billion people3 who still rely on solid fuels like
firewood or dung for cooking and heating.
                                                                                                                                                        Way forward                                                 Other sectors, such as the iron, steel, cement, plastic
3   Source: The World Health Organization.                                                                                                              Governments took a great stride forward in 2015,            and chemical industries, and certain types of transport,
                                                                                                                                                        when they came together in Paris to reach a landmark        currently rely on the unique ability of hydrocarbons to
                                                                                                                                                        agreement to tackle climate change. Shell welcomes          provide extremely high temperatures, chemical reactions
                                                                                                                                                        and supports the Paris Agreement and the ambition to        or dense energy storage. Today, many of these cannot
SOCIETAL CHALLENGE
                                                                                                                                                        limit the global rise in temperatures to well below two     be electrified at all, or only at a prohibitively high cost.
                                                                                                                                                        degrees Celsius (2°C) above pre-industrial levels.
                                               2015                                                                        2070                                                                                     The solutions will also vary by geography. Different
                                                                                Increasing population                                                   It is an ambition that will depend on unprecedented         countries have different needs depending on local
                                               7 billion                                                                   >10 billion                  collaboration between governments, companies and            circumstances: their development priorities, types of
                                                                                                                                                        society, and crucially, realism about the challenges        economy, domestic energy resources, ability to invest
                                                                                                                                                        ahead. It requires a transformation in the way energy       and national energy policies.
                                                                                                                                                        is produced, distributed and used.
                                                                            Increasing energy demand                                                                                                                As a result, the transformation of the energy system
                                                                                                                                                        Capital investment measured in trillions of dollars over    will move at different paces and produce different
                                               570 exajoules                                                               1,000 exajoules              decades will be necessary to finance both new sources       outcomes and different energy mixes in different
                                                                                                                                                        of energy, and to adjust existing infrastructure. It will   sectors and countries. It will require trade-offs by
                                                                                                                                                        also be necessary to change how energy is consumed,         energy consumers, companies and governments.
                                                                                                                                                        as a vast range of capital assets that consume energy –     It will require willingness to make hard choices.
                                                                          Need to reduce CO2 emissions                                                  from homes, domestic appliances, vehicles, machinery
                                                                                                                                                        and entire industries – will need to be adapted or          This is the reality of the change needed across the
                                                                                                                           Net Zero                     replaced.                                                   world to meet the aims of Paris. It is a transition that
                                               32 gigatonnes CO2e                                                                                                                                                   will span decades. For companies, it will create both
■ Challenge for more and cleaner energy                                                                                    Emissions
■ Reduction required in the carbon intensity                                                                                                            The solutions will vary by economic sector. Some,           risks and opportunities.
    of every unit of energy consumed                                                                                                                    like clothes and food manufacturing, require low-
Sources: Population – UN world population projections, energy consumption. 2015 – IEA World Energy Outlook (WEO) 2017, 2070 outlook – Shell scenarios   temperature processes and mechanical activities,            Shell is an active player in and has embraced
analysis from A Better Life with a Healthy Planet CO2 emissions: 2015 – IEA WEO 2017: 2040 – IEA WEO 2017 Current policies scenario;                    which electricity is well suited to deliver. These can      the transformation of the energy system. We see
2017 – Shell scenario analysis from A Better Life with a Healthy Planet.
                                                                                                                                                        therefore be powered by low and zero carbon sources         commercial opportunity in participating in the global
                                                                                                                                                        of power, including renewable energy.                       drive to provide more and cleaner energy solutions.

                                                                                                                                                                                                                                                                                   15
ENERGY TRANSITION SHELL - REPORT - Shell Global
2.
Shell SCENARIOS

                   Shell uses scenarios to
                   stretch our thinking and
                   consider events that may
                   only be remotely possible.

                   It is impossible to predict with
                   precision how future energy systems
                   will evolve, because there are too
                   many unknowns. Unknowns about
                   how technologies will develop, about
                   the types of energy consumers will
                   choose, about the energy policies
                   governments will implement.

                   Shell develops scenarios4 to navigate
                   such uncertainty and to inform and
                   test our business decisions. They are
                   not forecasts or business plans. They
                   describe what could happen, under
                   certain circumstances.

                   4   www.shell.com/scenarios

                                                           17
ENERGY TRANSITION SHELL - REPORT - Shell Global
Today, our three main scenarios are called                        Both Mountains and Oceans deliver net-zero                                           SHELL AND ENERGY SCENARIOS
Mountains, Oceans and – our most recent                           emissions5 (NZE) from the energy system by                                           For over four decades, Shell has developed scenarios
– Sky. One of the variables they explore is                       the end of the century. But they fall short of the                                   to deepen our strategic thinking and consider the future.
the type and level of collaboration between                       temperature goal of the Paris Agreement.                                             Today, the Shell scenario team comprises energy experts,
governments, businesses and energy users                                                                                                               modellers, economists, political scientists and social analysts.
and the impact this has on the energy system.                     Sky builds on this earlier work and assumes                                          We share and regularly test our thinking and modelling with
                                                                  that society takes actions so as to meet the                                         expert institutes, including the International Energy Agency
For example, in Mountains, strong                                 Paris goal. It requires unprecedented and                                            (IEA) based in Paris, France, the Massachusetts Institute of
governments and powerful economic                                 sustained collaboration across all sectors                                           Technology (MIT) Joint Program on the Science and Policy of
actors work together to create stability and                      of society, supported by highly effective                                            Global Change (Cambridge, USA) and the Energy Information
maintain their own interests. This enables                        government policy.                                                                   Administration (Washington, USA). MIT has used our energy
big initiatives like the deployment of carbon                                                                                                          model profiles to calculate the global warming trajectories for
capture and storage (CCS) at scale or the                         In Sky, the world reaches net-zero CO2                                               our scenarios. They publish their findings independently6. Their
building of widespread gas and hydrogen                           emissions from the energy system by                                                  evaluation concludes that the central estimate of the global
infrastructure.                                                   2070 and achieves the goal of the Paris                                              temperature rise in the Sky scenario is 1.75ºC above pre-
                                                                  Agreement to limit the rise in temperatures                                          industrial levels with an 85% chance of remaining below 2ºC.
In contrast, in Oceans, competitive                               to well below two degrees Celsius (2°C).
markets and a strong private sector are the                                                                                                            WORLD ENERGY RELATED CO2 EMISSIONS
main engines of change. There is major                            Like Mountains and Oceans, Sky adopts an
                                                                                                                                                                                        50
technology innovation, but big coordinated                        approach grounded in the reality of the current

                                                                                                                                                   CO2 emissions, gigatonnes per year
initiatives are more difficult to achieve.                        economic policy development mechanisms.                                                                               40

Energy needs are increasingly delivered                           But it then progressively becomes driven simply
                                                                                                                                                                                        30
through a patchwork of initiatives.                               by the goal to achieve NZE by 2070.
                                                                                                                                                                                        20

                                                                                                                                                                                        10

HIGH HURDLES                                                                                                                                                                            0
Sky is a technologically, industrially and economically                            Industry: Sky assumes that industrial applications
                                                                                                                                                                                        -10
possible route to achieving the goals of the Paris                                 are electrified where possible. To provide the negative
                                                                                                                                                                                               2000        2025              2050          2075         2100
Agreement. It is ambitious and challenging to deliver. The                         emissions required to achieve net-zero emissions from
magnitude of change needed under Sky is apparent in                                the energy system, Sky requires the construction of                                                                          Sky             Oceans              Mountains
                                                                                                                                                       Source: Shell analysis, Sky scenario.
some of the main developments in different sectors.                                around 10,000 large CCS plants by 2070, compared to
                                                                                   fewer than 50 in operation in 2020.                                 GLOBAL AVERAGE SURFACE TEMPERATURE RISE
Electricity: The share of electricity in final energy                                                                                                                                   3.0
consumption rises from 18% today to 26% by 2030                                    Land use: Sky achieves net-zero global deforestation
and grows to as much as 50% by 2060. Renewable                                     by 2070. In addition, an area the size of Brazil being                                               2.5

energy overtakes fossil fuels such as oil, gas and coal                            reforested offers the possibility of limiting warming to                                             2.0

                                                                                                                                                   ° C above 1861-1880
as the primary source of energy in the 2050s. The                                  1.5°C, the ultimate ambition of the Paris Agreement.
world uses hardly any fossil fuels in the power sector                                                                                                                                  1.5

after 2060. The share of nuclear in the global electricity                         Hydrogen: The share of hydrogen in total final energy
                                                                                                                                                                                        1.0
mix remains steady at around 10% to 2070. A new                                    consumption rises from less than 1% before 2040, to 6% by
addition to the sector is generation from biomass                                  2070. It is used as a high-density and storable energy source                                        0.5

combustion, which is linked with CCS to offer an                                   in transport and industry. Importantly in Sky, it is produced
                                                                                                                                                                                        0.0
important carbon sink.                                                             from water electrolysis using mainly renewable power.
                                                                                                                                                                                        -0.5
                                                                                                                                                                                               1900      1940         1980          2020     2060       2100
Mobility: The percentage of internal combustion                                    In Sky, these changes begin to emerge during the
engines (ICE) in passenger cars falls from 100% in 2010                            2020s and accelerate over time. Some sectors,                                                               History          Sky             Oceans              Mountains
to around 75% by 2030. By 2050, it is impossible                                   countries or even cities move more rapidly than others.
                                                                                                                                                       Source: MIT.
to buy a new passenger vehicle powered by an ICE                                   Globally, these early developments begin to make a
anywhere in the world.                                                             material impact on the energy system in the 2030s.
                                                                                                                                                       6	For MIT’s findings for Mountains, Oceans and Sky, see: https://globalchange.
                                                                                                                                                          mit.edu/publications/joint-program (report numbers 291 and 330).

5	Net-zero emissions means that any CO2 from energy emitted into the atmosphere is balanced by extracting CO2 elsewhere so
   that the total stock of CO2 stops growing – an essential step to tackling climate change. Extracting CO2 from the atmosphere
                                                                                                                                                                                                                                                                19
   can be done using technologies such as CCS or by nature itself.
Growth in energy demand
                                                                                                                                                                                                                    In all our scenarios, energy demand grows               In countries such as China, India and across
                                                                                                                                                                                                                    during the century as the global population             Africa, all forms of primary energy – including
                                                                                                                                                                                                                    increases to more than 10 billion and the               both hydrocarbons and renewable sources –
                                                                                                                                                                                                                    world becomes more prosperous. They all                 grow strongly from today’s base to support
                                                                                                                                                                                                                    feature continued long-term demand for oil              industrialisation, build modern economies and
                                                                                                                                                                                                                    and gas, alongside rapid growth in renewable            raise living standards.
                                                                                                                                                                                                                    sources like wind and solar, and low-emission
              1400                                                                                                                                                                                                  fuels such as biofuels.                                 The transition to new sources of energy around
                                                                                                                                                                                                                                                                            the world requires major changes to industrial,
              1200
                                                                                                                                                                                                                    The energy mix varies between regions and               commercial and residential infrastructure. This
                                                                                                                                                                                                                    countries because of their different starting           takes time and substantial investment, so the
                                                                                                                                                                                                                    points, levels of development, types of                 pace of change will build in the 2020s and
              1000
                                                                                                                                                                                                                    economy, and energy resources available                 accelerate thereafter.
                                                                                                                                                                                                                    locally. In north-west Europe, energy demand
EJ per year

               800
                                                                                                                                                                                                                    remains relatively constant and renewables
                                                                                                                                                                                                                    overtake hydrocarbons as the dominant
               600                                                                                                                                                                                                  primary energy source.

               400

               200

               PRIMARY
                0      ENERGY BY SOURCE IN THE THREE SCENARIOS                                                                                                                               PRIMARY ENERGY USE BY GEOGRAPHY
                                              MTN    OCN        SKY                MTN     OCN     SKY                MTN      OCN     SKY         MTN    OCN     SKY

                                   2000              2025                                  2050                                2075                       2100
                                                                                                                                                                                                   600 600

               MTN = Mountains                      Oil                     Biomass                 Solar
               OCN = Oceans
                                                    Biofuels                Coal                    Wind
                                                    Natural gas             Nuclear                 Other renewables                                                                               500 500

                   1400
               Source: Shell analysis, Sky scenario.
                                                                                                                                                                                                   400 400

                            1200

                            1000                                                                                                                                                                   300 300

                                                                                                                                                                                                                                                                                                        Oil Oil

                                                                                                                                                                                            EJ per year
              EJ per year

                                                                                                                                                                                                                                                                                                           Natural
                                                                                                                                                                                                                                                                                                                Gas Gas

                                                                                                                                                                              EJ per year
                            800                                                                                                                                                                                                                                                                         Natural
                                                                                                                                                                                                                                                                                                        CoalCoal
                                                                                                                                                                                                   200 200                                                                                                 Nuclear
                                                                                                                                                                                                                                                                                                        Nuclear
                            600
                                                                                                                                                                                                                                                                                                           Hydro-electricity
                                                                                                                                                                                                                                                                                                        Hydro-electricity
                                                                                                                                                                                                                                                                                                            Biofuels
                                                                                                                                                                                                                                                                                                        Biofuels
                            400                                                                                                                                                                                                                                                                             Biomass
                                                                                                                                                                                                                                                                                                        Biomass     & Waste
                                                                                                                                                                                                                                                                                                                & Waste
                                                                                                                                                                                                    100 100                                                                                                 Biomass
                                                                                                                                                                                                                                                                                                        Biomass      - Traditional
                                                                                                                                                                                                                                                                                                                - Traditional
                                                                                                                                                                                                                                                                                                           Geothermal
                                                                                                                                                                                                                                                                                                        Geothermal
                            200
                                                                                                                                                                                                                                                                                                        SolarSolar
                                                                                                                                                                                                                                                                                                           Wind
                                                                                                                                                                                                                                                                                                        Wind

                              0                                                                                                                                                                                                                                                                             Other
                                                                                                                                                                                                                                                                                                        Other     renewables
                                                                                                                                                                                                                                                                                                              renewables
                                                                                                                                                                                                          0   0
                                                    MTN    OCN        SKY                 MTN     OCN    SKY                MTN       OCN    SKY         MTN     OCN    SKY                                       2017201720702070    2017201720702070   2017201720702070      2017201720702070
                                      2000                 2025                                 2050                              2075                         2100                                                   North
                                                                                                                                                                                                                  North     America
                                                                                                                                                                                                                        America              Europe
                                                                                                                                                                                                                                         Europe              AsiaAsia                  Africa
                                                                                                                                                                                                                                                                                  Africa            Source: Shell analysis, Sky scenario.

                            MTN = Mountains               Oil                      Biomass                  Solar
                            OCN = Oceans
                                                          Biofuels                 Coal                     Wind
                                                          Natural gas              Nuclear                  Other renewables                                                                                                                                                                                                                 21
Oil and gas demand in                    OIL, GAS AND COAL: SHARE OF WORLD'S PRIMARY ENERGY                                                                        NEED FOR CONTINUED                                      WORLD OIL DEMAND RANGES VS BASE SUPPLY
Shell Scenarios                                                                                                                                                    OIL AND GAS INVESTMENT
                                                                 90%                                                                                                                                                                  120
The three scenarios result in                                                                                                                                      Natural decline in production
different outlooks for demand for                                80%                                                                                               happens because the pressure
                                                                                                                                                                                                                                      100
oil, gas and coal. They all show                                 70%                                                                                               and production efficiency in oil
that demand for oil and gas is                                                                                                                                     and gas reservoirs decreases over
higher in 2030 than today, but that                              60%                                                                                                                                                                   80
                                                                                                                                                                   time. This makes it increasingly

                                        TPE Fossil / TPE Total
                                                                                                                                                                                                                                                                                                                                 Supply
the share of oil, gas and coal in                                50%                                                                                               expensive and eventually                                                                                                                                      Gap

                                                                                                                                                                                                                          mln boe/d
the overall energy system falls.                                                                                                                                   uneconomic to produce. Such                                         60
                                                                 40%
                                                                                                                                                                   decline rates average 5% per
The Sky scenario, the most rapid                                 30%                                                                                               year across the oil and gas                                         40
transition, results in the lowest                                                                                                                                  industry, according to the IEA.
                                                                 20%
overall demand for oil, gas and                                                                                                                                    Without ongoing investment to                                       20
coal in the long term. Oil demand                                10%                                                                                               boost production from existing
grows 1% per year from 2020-25.                                                                                                                                    fields, the production decline rate
                                                                 0%                                                                                                                                                                    0
It peaks around the middle of the                                                                                                                                  would be about 7% per year,
                                                                       2000   2010       2020         2030           2040         2050         2060         2070                                                                        2005        2010       2015        2020          2025         2030         2035       2040
decade and then falls by about 1%                                                                                                                                  according to the IEA. Over a
                                                                                                             Year                                                                                                                                                                 Year
per year until about 2040.                                                                                                                                         period of five years, that would
                                                                 Sky          IEA Below 2 Degree Scenario           IEA Sustainable Development Scenario (WEO17)   translate into about 30 million
                                                                                                                                                                                                                          These charts compare Shell's projections of energy demand of our scenarios (in yellow) with those
In 2050, demand for oil is 78                                    Oceans       IEA 2 Degree Scenario                 IEA Current Policies Scenario (WEO17)
                                                                                                                                                                   barrels of oil equivalent per day                      of the IEA (dotted lines). They also show natural decline in production rates (in blue).
                                                                 Mountains                                          IEA New Policies Scenario (WEO17)
million barrels a day (mb/d)                                                                                                                                       (mmboe/d) of lost production
– about 85% of today’s oil                                                                                                                                         from the current level of around                       WORLD GAS DEMAND RANGES VS BASE SUPPLY
                                          WEO17 = IEA’s World Economic Outlook publication
production. Even in 2070, oil use                                                                                                                                  95 mmboe/d.
                                                                                                                                                                                                                                      250
remains around 50-60 mb/d,
because of the continued need for        Source: Shell analysis, Sky scenario and IEA.
oil in heavy transport, as well as                                                                                                                                                                                                    200
chemical manufacturing.                                                                                                                                                               Supply Existing + Planned Fields
                                                                                                                                                                                      Extra Recovery Existing Fields
Gas demand in Sky rises 2% per                                                                                                                                                        Shell Demand Range                              150

year between 2020-2025 and                                                                                                                                                            IEA Demand WEO17 CPS
                                                                                                                                                                                                                                                                                                                                 Supply

                                                                                                                                                                                                                          EJ
by 1.5% between 2025-2030. It                                                                                                                                                         IEA Demand WEO17 NPS                                                                                                                       Gap
                                                                                                                                                                                                                                      100
peaks around the middle of the                                                                                                                                                        IEA Demand WEO17 SDS

2030s and falls by 0.5% per year                                                                                                                                                      IEA Demand OMR17
                                                                                                                                                                                      IEA Demand GMR17
for the rest of the decade.                                                                                                                                                                                                            50

In all three scenarios, investment in
                                                                                                                                                                                                                                        0
new oil and gas production will be
                                                                                                                                                                                  Source: Shell analysis, IEA.
essential to meet ongoing demand.                                                                                                                                                                                                       2005        2010       2015        2020          2025         2030         2035       2040

That’s because demand for oil and                                                                                                                                                                                                                                                 Year

gas shrinks more slowly than the
                                                                                                                                                                   IEA SCENARIOS
natural decline in production from
existing oil and gas fields under
                                                                                                                                                                     IEA Current Policies Scenario                            CPS           An outlook on the basis of just those policies in place
any credible scenario.

                                                                                                                                                                     IEA New Policies Scenario                               NPS            Derived from the policies already in place and those officially announced

                                                                                                                                                                                                                                            An integrated approach to achieving internationally agreed objectives
                                                                                                                                                                     IEA Sustainable Development Scenario                     SDS
                                                                                                                                                                                                                                            on climate change, air quality and universal access to modern energy
                                                                                                                                                                                                                           OMR
                                                                                                                                                                     IEA Oil Market Report 17                               17
                                                                                                                                                                                                                                            IEA five-year oil market forecast

                                                                                                                                                                                                                            GMR             Provides a detailed analysis of supply and trade developments,
                                                                                                                                                                     IEA Gas Market Report 17                                17             infrastructure investments, and demand-growth forecast through 2022

                                                                                                                                                                   https://www.iea.org/publications/freepublications/publication/market-report-series-oil-2017.html
                                                                                                                                                                   http://www.iea.org/bookshop/741-Market_Report_Series:_Gas_2017

                                                                                                                                                                                                                                                                                                                                     23
3.
OUR RESILIENCE in the medium term,
to 2030

                                      Shell’s strategy, portfolio and
                                      strong financial framework
                                      give us the sources of resilience
                                      to potential changes in the
                                      energy system to 2030.

                                      The transition to lower-carbon energy
                                      presents opportunities, as well as
                                      risks, for Shell. It requires major
                                      changes to industrial, commercial
                                      and residential infrastructure. This
                                      takes time and substantial investment.

                                      We are reshaping our company
                                      to provide the energy, and related
                                      products and services, that consumers
                                      need as society works to meet the
                                      goals of the Paris Agreement.

                                                                               25
Our strategic ambitions are to be a world-class             SHELL STRATEGY                                                                      These sources of resilience reduce the risk of stranded assets in our
investment case, to thrive through the energy transition,                                                                                       portfolio, a risk we see as low.
and to maintain a strong societal licence to operate.       Our Purpose
                                                            We power progress together
                                                            by providing more and           Strategic Ambitions                                 We consider the resilience of our portfolio in the medium term by
We aim to grow our business in areas that will be           cleaner energy solutions.       World-Class Investment Case                         exploring potential ranges in oil prices, and their implications for
                                                                                           Thrive in the Energy Transition
essential in the energy transition, and where we                                         Strong Societal Licence to Operate                     Shell’s cash flows. To ensure that we challenge our thinking, these
see growth in demand over the next decade. We                                                                                                   ranges go beyond the prices implied by our three main scenarios –
expect these will include natural gas, chemicals,                                                                                               Mountains, Oceans and Sky.
electricity, renewable power, and new fuels such as
                                                                               Aspired Portfolio             Winning Capabilities
biofuels and hydrogen. We are also growing our oil                                         Cash              Customer Centricity
                                                                                                                                                In the longer term, after 2030, there is far more uncertainty. Here we
business, including in deep water and shales, to meet                                      engines
                                                                                                             Commercial Value Delivery          use scenarios to consider how we could reshape Shell’s portfolio of
                                                                                           Growth            Technology Commercialisation
continued demand.                                                                          priorities
                                                                                                             Project Delivery
                                                                                                                                                products to meet the changing needs of society, depending on how
                                                                                           Emerging
                                                                                           opportunities     Operational Excellence             the pace of transition develops.
We have a diverse portfolio – both geographically                        Underpinned by our Values, Goal Zero, and People
and across different parts of the energy industry.
This means we are not dependent on any one                  At the same time, we plan to maintain a strong financial
country or sector. It also means we can respond             framework. This means growing free cash flow and                                SOURCES OF RESILIENCE
to change.                                                  creating the financial capacity to provide returns to
                                                            investors, and to invest in new business models.                                                                         SHELL STRATEGY
We assess portfolio decisions, including divestments
and investments, against potential impacts from the         It also means reducing costs in our businesses so that
transition to lower-carbon energy. These include higher     we can profitably produce the oil and gas that the
regulatory costs linked to carbon emissions and lower       world will need for decades to come, even if prices
demand for oil and gas.                                     remain low for a long time.                                                          PORTFOLIO                                                  FINANCIAL FRAMEWORK
                                                                                                                                                 ■■   Diverse business segments                             ■■   Growing free cash flow
                                                                                                                                                 ■■   Geographic diversity                                  ■■   Capital discipline and flexibility
                                                                                                                                                 ■■   Active portfolio management                           ■■   Strong balance sheet
                                                                                                                                                      - Lowering costs
                                                                                                                                                      - Improving CO2 performance

                                                                                                                                                                                         RESILIENCE
                                                                                                                                                               The ability to meet our financial commitments, maintain a strong balance
                                                                                                                                                                        sheet and provide attractive returns for our shareholders

                                                                                                                                                                                                                                                      27
PORTFOLIO
Diverse business segments                                                                                                               Geographic diversity
The energy system will evolve differently in                                                                                            Our global business has operations
different countries and economic sectors,                                                                                               in more than 70 countries, giving
and the business risks and opportunities will                                                                                           us a wide geographic reach. This
vary significantly. Our diverse business helps                                                                                          exposure is spread across countries
reduce our exposure to unexpected changes                                                                                               at different stages in their economic
in any one sector or country. It also gives us                                                                                          development and transition to
the ability to shift in and out of assets and                                                                                           lower-carbon energy, reducing
businesses depending on our outlook.                                                                                                    our exposure to potential rapid
                                                                                                                                        changes in any one country.
Our resilience is strengthened by having
operations in many parts of the energy                                                                                                  In 2017, 19 countries accounted
system, as demonstrated by our seven                                                                                                    for about 80% of Shell’s cash flow
strategic themes: Conventional Oil and Gas,                                                                                             from operations. These included
Deep Water, Shales, Integrated Gas, Oil                                                                                                 Australia, Brazil, Canada, Nigeria,
Products, Chemicals and our recently created                                                                                            Qatar and the USA. We expect
New Energies business, that focuses on                                                                                                  a similar spread in our sources of
power and new fuels.                                                                                                                    cash flow from operations in the
                                                                                                                                        coming decade.
These businesses range from the primary
extraction of energy and its processing, to                                                                                             During this time, we expect to see
the eventual sale to customers, giving us                                                                                               a reduction in demand for oil and
flexibility to manage risk and returns as the                                                                                           gas in some countries, as well
energy system evolves.                                                                                                                  as rapid growth in others. For
                                                                                                                                        example, our Sky scenario shows
We have demonstrated the strength of our                                                                                                that demand for oil starts to decline
integrated model. In the past three years,                                                                                              globally after 2025 but still grows
our Downstream business, which includes                                                                                                 in some countries, including India
chemicals, marketing, and refining and                                                                                                  and China until the middle of
trading, generated strong earnings.                                                                                                     the century.

This helped offset the impact of the downturn     OUR PORTFOLIO DIVERSITY PROVIDES                                                      We are adapting the products we
in oil and gas prices on our Upstream             RESILIENCE THROUGH PRICE CYCLES                                                       offer to match the different needs of
and Integrated Gas businesses. It also                                                                                                  our customers in different countries.
                                                                  2013        2014            2015        2016           2017
demonstrated how each part of the energy
system can be impacted differently by shifts                $ billion                                                           $/bbl

in demand, supply and commodity prices.                     25

                                                            20                                                                   100

                                                 Earnings
                                                                                                                                  80
                                                            15
                                                                                                                                  60
                                                            10
                                                                                                                                  40
                                                             5
                                                                                                                                  20
                                                             0                                                                     0
                                                             -5

                                                            Downstream       Integrated Gas          Brent price (RHS)
                                                            Upstream         Corporate

                                                  Source: Shell analysis.

                                                                                                                                                                                29
Active portfolio management                                                                                                                                            Reducing our CO2 intensity
We are reshaping our portfolio by growing our                                       We are also adjusting our businesses to meet changing                              Managing our CO2 performance is an
Integrated Gas, Chemicals, and New Energies                                         demand in different countries. For example, we are                                 important part of our long-term resilience.
businesses. These are the areas where we could see                                  offering hydrogen and electric-vehicle charging, in                                We consider CO2 performance when we
the highest increases in demand over the next decade                                addition to liquefied natural gas (LNG) and biofuels, in                           take decisions about our portfolio.
as the world transitions to lower-carbon energy.                                    European markets such as Germany where we see a
                                                                                    faster transition to lower-carbon energy.                                          For example, our petrochemicals complex in
We took an important step in the reshaping of our                                                                                                                      Pennsylvania, USA will use a co-generation
portfolio with the acquisition of BG Group in 2016.                                 And we plan to grow the number of retail sites in                                  facility to produce both heat and electricity
This acquisition accelerated our growth in Integrated                               countries such as China, Mexico, India, Indonesia and                              for the plant, as well as surplus electricity that
Gas where we expect more demand as gas is the                                       Russia where we see demand for oil products growing                                will be exported to the grid at a lower CO2
cleanest-burning hydrocarbon when used to generate                                  in the next decade.                                                                intensity than the regional average.
electricity. The acquisition also increased our positions
in deep water, especially in Brazil.                                                We assess our portfolio decisions, including                                       The plant will also have a highly efficient
                                                                                    divestments and investments, against potential impacts                             ethylene cracker which will result in top-
We are expanding in the power market because we                                     from the transition to lower-carbon energy. These                                  quartile CO2 intensity, according to
expect the energy system to increasingly electrify in                               include higher regulatory costs linked to carbon                                   benchmarking specialists Solomon.
the coming decades. And we expect the power sector                                  emissions and lower demand for oil and gas.                                        We expect the plant to begin commercial
to shift toward lower-CO2 electricity generated by gas                                                                                                                 production early in the next decade.
and renewables.                                                                     The portfolio changes we are making reduce the risk
                                                                                    of having assets that are uneconomic to operate, or                                In Canada, we have included measures to
We are investing in areas such as wind power                                        oil and gas reserves that are uneconomic to produce                                reduce carbon intensity at our Groundbirch
generation in the Netherlands and the supply of power                               because of changes in demand or CO2 regulations.                                   asset, a tight shale gas operation in British
to retail customers in the UK. This takes advantage of                                                                                                                 Columbia. These include using electricity
our existing gas and power trading capabilities while                                                                                                                  instead of natural gas for the processing plant,
building new business models for the future.                                                                                                                           using gas instead of diesel to power drilling
                                                                                                                                                                       and using solar energy to power pumps.

DEMAND IMPACT UNDER SKY FOR DIFFERENT ENERGY PRODUCTS                                                                                                                  We actively consider the use of carbon
                                                                                                                                                                       capture and storage (CCS) to reduce
                                Compound annual growth rates (CAGR) for the defined period in time.
                                                                                                                                                                       emissions from our projects. Where CCS
                                  World                                       India                                        US                                          is not economically feasible at current CO2
                                   2020-      2025-      2030-      2040-      2020-       2025-      2030-      2040-      2020-      2025-       2030-      2040-    prices, we design some projects to be
                                   2025       2030       2040       2060       2025        2030       2040       2060       2025       2030        2040       2060
                                                                                                                                                                       available for CCS retrofits in the future.
Coal                               +0.3%       -0.6%      -1.7%      -2.8%      +5.8%      +2.5%      +1.6%       -1.0%      -3.4%       -4.4%      -7.8%      -3.8%

Gas                                +2.1%      +0.9%       -0.5%      -3.3%      +5.4%       -1.4%      -3.3%      -0.3%      +1.0%       -0.8%      -1.2%      -3.7%
                                                                                                                                                                       Shell standards require that operating assets
Oil¹                               +0.9%       -0.9%      -0.9%      -1.6%      +4.8%      +2.6%      +2.7%      +1.2%       -1.4%       -3.5%      -4.3%      -4.7%
                                                                                                                                                                       with CO2 emissions of more than 50,000
Biofuels                           +2.5%      +1.2%      +9.6%       +5.5%      +5.0%      +9.0%     +11.7%     +16.5%       -1.9%       -6.4%    +13.1%      +0.9%    tonnes of CO2 equivalent per year create
Oil products*                      +1.0%       -0.8%      -0.2%      -0.7%      +5.2%      +2.6%      +3.2%      +1.8%       -1.4%       -3.6%      -3.0%      -3.4%   greenhouse gas (GHG) management plans
 consumed by road transport        +0.9%       -1.1%      -0.4%      -1.6%      +5.5%      +2.9%      +3.7%      +2.1%       -1.5%       -4.3%      -3.7%      -5.0%   that seek to improve our CO2 performance.
 consumed by aviation              +1.6%      +0.9%      +3.0%       +2.1%      +7.2%      +5.1%      +7.4%      +5.9%       -0.3%       -1.3%     +1.1%      +0.8%    These plans provide clarity on investment
 consumed by marine                +1.2%      +0.8%      +0.7%       -0.0%    +19.7%     +12.9%       +5.5%       -0.5%      -0.6%       -1.0%      -0.8%      -1.1%   options to reduce CO2 intensity in each of our
 consumed by industry              +1.5%       -2.7%      -6.4%     -11.5%      +4.7%      +0.1%      +0.6%       -6.7%       0.0%       -3.3%      -7.7%     -24.5%
                                                                                                                                                                       assets, and have allowed us to identify and
                                                                                                                                                                       prioritise opportunities across our portfolio.
 used for (petro)chemicals         +2.1%      +1.3%      +0.8%      +0.2%       +5.5%      +3.6%      +2.3%      +0.8%       -0.2%       -1.5%      -2.6%      -6.9%

Hydrogen                          +29.7%     +25.9%     +17.6%     +12.6%     +32.4%       +8.0%     +14.2%     +16.6%     +32.3%     +32.5%      +23.3%      +9.4%

Solar PV                          +20.3%     +19.0%     +10.3%       +6.0%    +17.5%      +16.1%      +9.5%     +11.2%     +19.0%     +24.0%      +10.2%      +3.1%

Solar Thermal                      +8.1%      +8.3%      +8.3%       +4.9%    +22.2%      +12.0%      +4.3%      +6.4%       +2.6%      +5.1%     +19.9%       -1.5%

Wind                              +11.3%      +9.5%     +10.1%       +5.4%    +20.2%      +12.8%      +8.8%      +4.0%       +3.4%      +6.6%     +10.8%      +6.8%

1 Oil demand excludes refinery gains, biofuels and synthetics.
* The demand for liquid hydrocarbon fuels is used as a proxy for oil products demand. By 2030, a minor fraction (less than 5%) of the liquid hydrocarbon fuels will
   come from biofuels alongside crude oil. By 2060, this will be close to 25% on average globally (more than 10% in India and close to 40% in the USA).

Source: Shell analysis, Sky scenario.                                                                                                                                                                                       31
CAPITAL INVESTMENT                                                                     CAPITAL INVESTMENT

STRONG FINANCIAL                                                                      $ billion (per annum)                2018 – 2020
                                                                                                                                                                            30                                           Non- and little

FRAMEWORK
                                                                                            Oil products                   4-5                                                                                           discretionary spend
                                                                                                                                                                            25                                           Small scale and large
                                                                                            Conventional oil + gas         4-5                                                                                           value growth opportunities
                                                                                                                                                                            20
                                                                                            Integrated gas                 4-5

                                                                                                                                                                $ billion
We are managing our financial framework to preserve                                                                                                                         15

our sources of resilience. Shell’s financial strength and                                   Deep water                     5-6
                                                                                                                                                                            10
access to capital give us the ability to reshape our                                                                                                                                     30
                                                                                            Chemicals                      3-4                                                           30                                   Non-
                                                                                                                                                                                                                              Non- and
                                                                                                                                                                                                                                    and little
                                                                                                                                                                                                                                         little
portfolio and to lead and respond as demand changes.                                                                                                                         5                                                discretionary
                                                                                                                                                                                                                              discretionary spend
                                                                                                                                                                                                                                               spend
                                                                                                                                                                                25
                                                                                                                                                                                25
It also allows us to withstand volatility in oil and                                        Shales                         2-3                                               0
                                                                                                                                                                                                                              Small
                                                                                                                                                                                                                              Small scale
                                                                                                                                                                                                                              value
                                                                                                                                                                                                                                    scale and
                                                                                                                                                                                                                                          and large
                                                                                                                                                                                                                                               large
                                                                                                                                                                                                                              value growth
                                                                                                                                                                                                                                    growth opportunities
                                                                                                                                                                                                                                            opportunities
gas markets.                                                                                                                                                                  Capital
                                                                                                                                                                                20
                                                                                                                                                                                20
                                                                                                                                                                                      investment - per annum 2018 -’20
                                                                                            New energies                   1-2

                                                                                                                                                                               billion
                                                                                                                                                                            $$ billion
                                                                                                                                                                              15
                                                                                                                                                                               15
This strong financial framework is based on growing                                   Total                                25-30
                                                                                                                                                                        Source: Shell.
free cash flow, continued capital discipline and capital                                                                                                                      10
                                                                                                                                                                               10
flexibility, and a strong balance sheet.
                                                                                                                                                                                         55

Growing free cash flow                                                       Capital discipline and flexibility                                                  reduced00 annual capital investment by $22 billion9,
                                                                                                                                                                          Capital investment  -- per
                                                                                                                                                                                                 per annum 2018 -’20
We are confident we can continue to grow our organic                         Over recent years, we have improved our capital                                     from $46   billion
                                                                                                                                                                          Capital      in 2013
                                                                                                                                                                                   investment         to $24
                                                                                                                                                                                                     annum    billion
                                                                                                                                                                                                           2018  -’20 in 2017. We

free cash flow with revenues from projects that are                          discipline. There are two elements to our approach:                                 will maintain our annual capital investment range of
coming onstream and further operational and cost                             ■■ Applying more stringent resilience criteria to capital                           between $25 billion and $30 billion until 2020, with
efficiencies.                                                                   allocation decisions, by seeking lower break-even                                the option to go below the lower end of the range but
                                                                                prices and shorter payback periods (the time it takes                            with the communicated commitment to not go above
We expect to generate organic free cash flow7, the                              for Shell to fully recover its capital investment) from                          the higher end.
cash available after capital investment, of between $25                         our projects;
billion and $30 billion per year in 2020 at $65 per                          ■■ Improving our project delivery capability to more                                Discretionary capital spending provides us with the
barrel, in money-of-the-day terms. This excludes the cash                       consistently achieve our cost and schedule targets                               flexibility to respond to volatility in energy markets. In the
we generate from divestments as we seek a financial                             and to improve the capital efficiency of our                                     remaining period to 2020, we expect around 30% of our
framework that is based on the strength of the underlying                       investment portfolio.                                                            capital spending to be discretionary, meaning that we have
business cash flows. Organic free cash flow should be                                                                                                            flexibility in how we spend it; whether to grow the value of
well in excess of our debt and dividend payments.                            For example, all projects in conventional oil and gas                               our existing businesses, or to invest in new businesses.
                                                                             with a planned final investment decision (FID) over the
7	Organic free cash flow is defined as free cash flow excluding inorganic
                                                                             next two years have a forward-looking break-even price                              We expect the size of our discretionary spending to
   capital investment and divestment proceeds.
                                                                             of below $40 per barrel8 (see section on Upstream).                                 grow in the early 2020s. This will happen as more of
                                                                                                                                                                 our strategic themes move from growth priorities, which
CASH FLOW FROM OPERATIONS EXCLUDING                                          We are also looking for projects with shorter payback                               require high levels of capital investment, to cash engines,
WORKING CAPITAL MOVEMENTS                                                    periods, such as our shales investments in the USA,                                 which require less capital and generate more cash.
 $ billion
                                                                             Canada and Argentina, and our Oil Products
                                                                             investments in Mexico and India.                                                    We see our Deep Water strategic theme moving from a
 50
                                                                                                                                                                 growth priority to a cash engine by 2020, for example.
                                                                             This strategy is producing strong returns even at a time
 40
                                                                             of lower oil prices. Our cash flow from operations                                  Strong balance sheet
 30                                                                          when oil prices were $54 per barrel in 2017 is in line                              A strong balance sheet allows Shell to manage
                                                                             with the cash flow from operations we achieved when                                 volatility in oil and gas markets, including the flexibility
 20                                                                          oil prices were $99 per barrel in 2014.                                             to access debt markets if we need to. Shell plans
                                                                                                                                                                 to maintain a strong balance sheet by reducing
 10                                                                          Our capital discipline gives us greater flexibility                                 and maintaining gearing levels to 20% or below,
                                                                             for investments in the future. For example, we have                                 compared to around 25% at the end of 2017.
  0

             2014            2015              2016               2017       8	The forward-looking breakeven price for pre-FID projects is calculated based on all forward-looking costs associated with pre-FID projects in our
-10
                                                                                development portfolio. Accordingly, this typically excludes exploration & appraisal costs, lease bonuses, exploration seismic and exploration team
                                                                                overhead costs. The forward-looking breakeven price for pre-FID projects is calculated based on our estimate of resources volumes that are currently
      CFFO ex W/C                                                               classified as 2C under the Society of Petroleum Engineers’ Resource Classification System. As these pre-FID projects are expected to be multi-decade
                                                                                producing projects, the less than $40 per barrel projection will not be reflected either in earnings or cash flow in the next five years.
                                                                             9 This excludes the acquisition of BG Group in 2016.
                                                                                                                                                                                                                                                       33
AVERAGE IEA CRUDE OIL IMPORT PRICE BY SCENARIO10

                                                            160
                                                            140
                                                            120
                                                            100
                                                                     80

RESILIENCE                                                           60
                                                                     40

IN PRACTICE                                                          20
                                                                                0
                                                                                                                                                                               CPS - Oil IEA (real) - $2016/b
                                                                                                                                                                               NPS - Oil IEA (real) - $2016/b

                                                                                       2000      2005   2010    2015     2020      2025    2030    2035     2040               SDS - Oil IEA (real) - $2016/b

                                                            Source: IEA WEO 2017.

STRESS TESTING OUR PORTFOLIO
To assess our financial resilience in the short and         For comparison, the average Brent price for the last                                                   Today, around 60% of our Integrated Gas portfolio
medium term to 2030, we look at the sensitivity of our      five years has been around $70 per barrel. The                                                         is linked to oil prices. Based on our view of possible
cash flow to changes in oil prices, and to changes in       IEA’s most rapid transition scenario – the Sustainable                                                 future oil prices, we consider a range of between $6
the cost of CO2 emissions. We expect that the risks         Development Scenario – indicates an average oil                                                        and $12 per million British thermal units (MMBtu)
associated with the energy transition will ultimately be    price of $6811 per barrel in the period to 2030. The                                                   to 2030 for LNG to be a plausible price for Asian
reflected in the price of oil and gas, and therefore this   IEA’s Current Policies Scenario, that models current and                                               markets, where we sell around 60% of our LNG.
is the basis for stress testing our portfolio.              announced energy policies, indicates an average price
                                                            of $9011 per barrel for the same period.
Our scenarios show a range of possible outcomes for
the energy system based on factors including growth in
                                                            INDUSTRY UNDEVELOPED RESOURCES BREAKEVEN COST CURVE RANGES
demand, the development of new technologies, world
                                                            (INCLUDING YTF*)
politics and government policy.
                                                                                       160
Given this range of outlooks, we consider a range                                      140
of between $40 and $100 per barrel of oil to 2030
                                                                                       120
to be likely. We have used our assumptions about

                                                             Breakeven (Brent $/bbl)
the future cost of supply (the price at which it makes                                 100

economic sense to produce resources) as the floor for                                   80
our range.
                                                                                        60

                                                                                        40
Prices could move above or below this range.
However, when oil prices fall, levels of industry                                       20

investment tend to decline, which could lead to                                          0
reduced production. Eventually, higher prices could                                          0           200            400           600             800          1000           1200           1400           1600            1800              2000

be needed to support new investment in production to                                                                                                Undeveloped Crude resource (bin bbl)
meet demand.                                                                                                                                                          Median
                                                                                                                                                                                                                     R/P** (Years)
We therefore think it is unlikely that oil prices would                                          North American LTO        OPEC Onshore Conventional            Non-OPEC Onshore Conventional
                                                                                                                                                                                                                     $40/bbl            11
                                                                                                                                                                                                                     $80/bbl            33
remain at the lower end of our price range for
                                                                                                 Bitumen/EHO          Deep Water          OPEC Offshore Shelf       Arctic        Non-OPEC Offshore Shelf            $120/bbl           52
several years.

                                                            * YTF: Yet To Find
                                                            ** R/P is Undeveloped Resource volume divided by the current production rate, which gives an indication of future
                                                            development potential compared to needs. It excludes volumes from already developed fields.
                                                            Source: Wood Mackenzie, Rystad Energy, IHS, EIA, NEB (Canada), IEA and Shell internal data/analysis.

                                                            10 A
                                                                ctual 2017 oil prices averaged $54 per barrel and actual prices for the                           11 T he IEA oil price reflects the “weighted average import price among IEA
                                                               first three months of 2018 averaged $66 per barrel (source: US Energy                                   member countries”. Source World Economic Outlook 2018.
                                                               Information Administration).

                                                                                                                                                                                                                                                         35
Sensitivity to oil prices                                                               The capital investment levels included in our business
Assuming we meet the conditions in our operational                                      plan offer sufficient flexibility to be reduced by $5-10
plans, especially with regards to production and costs,                                 billion per year, without materially impacting the long-
we estimate that to 2027, a $10 per barrel change                                       term sustainability of our business.
in oil prices would be expected to have a roughly
$6 billion impact per year on our cash flow from                                        Our financial framework could sustain a potential
operations. This is an indicative estimate and not a                                    reduction of up to $15 billion per year in organic
prediction.                                                                             free cash flow, according to our estimates. Some of
                                                                                        the ways we could respond to this shortfall include
Based on this assumption, if the oil price fell from                                    reducing capital investment to below $25 billion,
around $65 per barrel today to $40 per barrel money-                                    further reducing operational expenditure, increasing
of-the-day, our cash flow from operations would be                                      our levels of debt and accelerating divestments.
expected to decrease by $15 billion per year.12
                                                                                        If prices were to remain below the bottom of our range
Similarly, if the oil price rose to $100 per barrel                                     for more than three to five years, an outcome we think
money-of-the-day, our cash flow from operations would                                   unlikely, we would consider making further strategic,
be expected to rise by $21 billion per year.12                                          portfolio and financial framework choices to remain
                                                                                        financially resilient.
In addition to the resilience of our cash flow from                                                                                                            LOW RISK OF STRANDED ASSETS
operations, we are also managing the resilience of our                                  Conversely, in periods of high oil and gas prices we                   Every year, we test our portfolio under different scenarios, including prolonged
organic free cash flow by actively managing the upper                                   would use the excess organic free cash flow to strengthen              low oil prices. In addition, we rank the break-even prices of our assets in the
levels of our expected capital investment.                                              our balance sheet and consider share buybacks.                         Upstream and Integrated Gas businesses to assess their resilience against low oil
                                                                                                                                                               and gas prices. These assessments indicate that the risk of stranded assets in the
                                                                                                                                                               current portfolio is low.

A    $10   PER BARREL                                                                   A     $10   PER TONNE
                                                                                                                                                               At December 31, 2017, we estimate that around 80% of our current proved oil
                                                                                                                                                               and gas reserves, will be produced by 2030 and only around 20% after that
                                                                                                                                                               time. Production that is already on stream will continue as long as we cover our

CHANGE IN OIL PRICES                                                                    INCREASE IN GLOBAL CO2                                                 marginal costs.

WOULD BE EXPECTED TO HAVE A ROUGHLY
                                                                                        PRICES WOULD RESULT IN                                                 We also estimate that around 76% of our proved plus probable oil and gas

$6 BILLION
                                                                                                                                                               reserves, known as 2P, will be produced by 2030, and only 24% after that time.

                A REDUCTION
IMPACT PER YEAR OF ABOUT
ON OUR CASH FLOW
FROM OPERATIONS
                                                                                        $1 BILLION                                                  Sensitivity to government-led CO2 prices
                                                                                                                                                    At our current CO2 emission levels, we estimate that
                                                                                                                                                                                                               with an impact of a reduction of around $1 billion on
                                                                                                                                                                                                               a net present value basis.

                                                                                        IN SHELL’S PRE-TAX
                                                                                                                                                    a $10 per tonne increase in global CO2 prices would
                                                                                                                                                    result in a reduction of about $1 billion in Shell’s       Between now and 2030, we are confident that
                                                                                        CASH FLOWS                                                  pre-tax cash flows. By embedding a CO2 cost in our
                                                                                                                                                    outlook for cash flow, we are reflecting potential
                                                                                                                                                                                                               our current portfolio is resilient in Sky, our most
                                                                                                                                                                                                               rapid transition scenario. For Shell, this means that
                                                                                                                                                    changes and ensuring our cash flow is robust in the        we will still produce and sell the oil and gas that
                                                                                                                                                    face of these changes.                                     society needs, while preparing our portfolio to move
                                                                                                                                                                                                               more into lower-carbon energy, where this makes
12	Significant variations in oil and/or gas prices will potentially impact certain operating costs, or
                                                                                                                                                    In 2017, we increased the CO2 costs reflected in our       commercial sense.
    result in foreign exchange movements the effect of which are not reflected in this price sensitivity.                                           cash-flow projections as part of our planning process,

                                                                                                                                                                                                                                                                       37
RESILIENCE: HIGHLIGHTS FROM OUR                               We can also tailor our exploration work and
      UPSTREAM, INTEGRATED GAS AND                                  investment to meet expected demand and prices for oil
      DOWNSTREAM BUSINESSES                                         and gas.
      In the section below, we examine the potential
      impact of the risks and opportunities related to              The recent lower oil prices have been a significant
      climate change on our businesses and how we are               catalyst for improved competitiveness in Shell’s
      managing that impact. Each of our businesses has              Upstream business, which has improved our resilience.
      different characteristics and strategies that support their
      resilience in the period to 2030.                             Since 2015, we have reduced costs in Upstream by
                                                                    more than 20%, while increasing production by 20%.
      Upstream
      Our Upstream business covers three strategic themes:          At today’s oil price, that means Upstream is generating
      Conventional Oil and Gas, Deep Water and Shales.              significant cash flows for the Group, enough to pay
      It manages the exploration for, and the extraction of         taxes and reinvest capital to bring more production on
      crude oil, natural gas and natural gas liquids. It also       line, while still helping pay dividends and reduce debt.
      markets and transports oil and gas, and operates the          Even if oil prices fell to $40 per barrel, the lower end
      infrastructure necessary to deliver them to market.           of our range, Upstream would still generate cash flow
                                                                    from operations.
      In 2030, we expect demand for oil and gas to be
      higher than today in each of our Mountains, Oceans            Break-even prices are an important indicator of the
      and Sky scenarios. To meet that demand, we expect to          resilience of our Upstream projects. For example,
      make continued investments in finding and producing           deep-water projects waiting for a final investment
      oil and gas.                                                  decision have an average forward-looking break-even
                                                                    price14 of below $30 per barrel, providing us with
      Today, we hold around 8.8 years of proved reserves            competitive growth opportunities.
      and 13 years of 2P reserves. We hold between
      20 and 26 years of resources (2P plus 2C13). As a             In one project, the Vito deep-water project in the Gulf
      result, we believe we have the potential to sustain our       of Mexico, we reduced overall capital investment costs
      Upstream business into the 2030s.                             by 70% compared to our initial concept.

      We continue to explore for more resources to meet             And in the Permian basin in the USA, we have
      the expected demand for oil that we see in Sky in the         reduced direct field expenses in our shales business by
      2030s. We will continue to develop our projects to            33% in the last year, and by 60% since 2015.
      be competitive on costs so that we are resilient even if
      there is excess supply and low oil prices.

                                                                                                                                                      We will continue to assess and adjust investments          ■■   Improving capital efficiency to lower break-even
                                                                                                                                                      to sustain our oil and gas resources, with significant          prices;
                                                                                                                                                      flexibility to respond to expected demand, prices and      ■■   Considering specific performance standards on CO2
                                                                                                                                                      other relevant factors.                                         intensity for various asset classes when investing in
                                                                                                                                                                                                                      new assets;
                                                                                                                                                      When making investments we consider the following          ■■   Deploying technologies to further drive resilience,
                                                                    13	Contingent Resources are the discovered recoverable petroleum volumes
                                                                        associated with a project that has not yet been deemed technically and        factors to enhance resilience:                                  including the use of CCS and renewables in
                                                                        commercially mature and thus these resources do not qualify as Reserves.      ■■ Short-cycle investment and flexibility to allow              Upstream assets;
                                                                    14	The forward-looking breakeven price for pre-FID projects is calculated
                                                                        based on all forward-looking costs associated with pre-FID projects in our
                                                                                                                                                         production to increase or decrease in response to       ■■   GHG and energy management to lower CO2
                                                                        development portfolio. Accordingly, this typically excludes exploration &        changes in demand or price (for example in Shales);          intensity and potential costs from carbon prices in
                                                                        appraisal costs, lease bonuses, exploration seismic and exploration team
                                                                                                                                                      ■■ Focusing on projects that generate positive cash flow        our operating assets.
                                                                        overhead costs. The forward-looking breakeven price for pre-FID projects
                                                                        is calculated based on our estimate of resources volumes that are currently      in a short period of time (for example, by adding
                                                                        classified as 2C under the Society of Petroleum Engineers’ Resource              new wells to existing deep-water fields);
Design concept for the Vito facility.                                   Classification System. As these pre-FID projects are expected to be multi-
                                                                        decade producing projects, the less than $30 per barrel projection will not
                                                                        be reflected either in earnings or cash flow in the next five years.

                                                                                                                                                                                                                                                                              39
You can also read