Perspectives on Climate-Related Scenarios - Risks and Opportunities JUNE 2021
←
→
Page content transcription
If your browser does not render page correctly, please read the page content below
Perspectives on
Climate-Related
Scenarios
Risks and Opportunities

 JUNE 2021
Table of Contents                                                                                       Glossary of terms
                                                                                                        barrel: 42 U.S. gallons — a common volume measure for crude oil and petroleum products
01  Letter from the President and CEO                                                                   barrel of oil equivalent or boe: A unit of energy based on the energy released by burning one
                                                                                                        barrel of crude oil or 5.8 million British thermal units
02  MPC and MPLX Operations
                                                                                                        bcm: Billion cubic meters (a measure of natural gas volume)
03  Introduction                                                                                        bpcd: Barrels per calendar day — the average of how much crude oil or other feedstock a refinery
    05       Business Planning and Capital Allocation                                                   processes over a period of time, divided by the number of days in that period, typically 365 days (a
                                                                                                        common rate measure for petroleum refineries)
    06       Market-Based Carbon Programs                                                               bpd: Barrels per day — a common rate measure for crude oil and petroleum products
    07       Scope 3 Emissions                                                                          CDP: formerly known as the Carbon Disclosure Project, CDP is a not-for-profit charity that
                                                                                                        runs a global disclosure system for investors, companies, cities, states and regions to report
09  Climate Scenario Planning                                                                           environmental data
    11	Midstream                                                                                       CO2e: Carbon dioxide equivalent — a common unit of measurement converting all greenhouse
                                                                                                        gases to carbon dioxide. MPC calculates CO2e emissions using the EPA factors identified in Table
    19       Refining and Marketing                                                                     A-1 at 40 CFR Part 98.
    25       Renewable Fuels                                                                            EII®: Energy Intensity Index, a measure proprietary to energy consulting firm HSB Solomon
                                                                                                        Associates LLC
29  Managing Physical Risks to Our Facilities
                                                                                                        EPA: The U.S. Environmental Protection Agency
32  Governance                                                                                          ERM: Enterprise Risk Management
35	Metrics and Targets                                                                                 ESG: Environmental, social, and governance
38  TCFD Recommendation Index                                                                           GHGs: Greenhouse gases, such as carbon dioxide and methane
                                                                                                        IEA: International Energy Agency
                                                                                                        IEA’s CPS: Current Policies Scenario
                                                                                                        IEA’s SDS: Sustainable Development Scenario
                                                                                                        LNG: Liquefied natural gas
                                                                                                        LPG: Liquefied petroleum gases
                                                                                                        Tonne or metric ton: 2,205 pounds
                                                                                                        MPC: Marathon Petroleum Corporation
                                                                                                        MPLX: MPLX is a diversified, large-cap master limited partnership formed by Marathon Petroleum
                                                                                                        Corporation (MPC) that owns and operates midstream energy infrastructure and logistics assets,
                                                                                                        and provides fuels distribution services
                                                                                                        NGL: Natural gas liquid — a light hydrocarbon liquid often produced with natural gas
                                                                                                        OEMS: MPC’s Operational Excellence Management System to manage environmental, health and
                                                                                                        safety risks
                                                                                                        Renewable diesel: a hydrocarbon diesel fuel produced by hydroprocessing of fats, vegetable oils,
                                                                                                        and waste cooking oils
                                                                                                        Renewable fuel: liquid fuel derived from biomass and waste feedstocks and include ethanol,
                                                                                                        biogasoline, sustainable aviation fuel, biodiesel and renewable diesel
                                                                                                        Scope 1 Emissions: All direct GHG emissions by a company, including fuel combustion, company
                                                                                                        vehicles and fugitive emissions
                                                                                                        Scope 2 Emissions: Indirect GHG emissions from consumption of purchased electricity, heat or
                                                                                                        steam
                                                                                                        Scope 3 Emissions: Other indirect GHG emissions that occur in a company's value chain that are
                                                                                                        not captured by Scope 2
On the cover: Sherwood natural gas processing plant in Doddridge County, West Virginia -- the largest   TCFD: Task Force on Climate-related Financial Disclosures, formed by the Financial Stability Board
gas processing plant in the U.S.                                                                        (an international body that monitors and makes recommendations about the global financial system)
From The President and Chief Executive Officer
At MPC and MPLX, we’re challenging ourselves           This year we have included an estimate of the        will require global reductions by all sectors. We
to be a leader in sustainable energy – to meet         Scope 3 emissions from the products we process       again retained HSB Solomon Associates LLC to
the needs of today while investing in an energy-       and market to the consuming public. We also plan     thoroughly evaluate our resiliency against these
diverse future. We are pleased to present our fifth    to provide such information in our report to the     scenarios, with attention to risks and opportunities
annual Perspectives on Climate-Related Scenarios       CDP so that investors and stakeholders have an       across key business components: refining and
report, an important part of our commitment            additional avenue to access our data.                marketing, midstream and renewables.
to transparency and our engagement toward              We have accelerated our pace toward lowering         Thank you for your interest in MPC and MPLX.
collaborative solutions.                               carbon intensity and strengthening resiliency.       I encourage you to read on to learn more about
As global, national and local initiatives to address   Over the last year we ceased crude processing        how we’re working to meet society’s needs today
climate change progress, we are engaging with          at three of our refineries, one of these has been    while investing in an energy-diverse future.
many stakeholders, including federal, state and        converted to a renewable diesel facility and
local governments, investors, business partners,       another is in the process of being converted.
and communities across our operational footprint.      We continue to expand our MPLX natural gas
Our world is dynamic, and the energy mix               gathering and processing operations helping
that enables human prosperity is evolving. The         to facilitate the transitional step of eliminating   Michael J. Hennigan

International Energy Agency (IEA) forecasts an         coal from the utility and industrial sectors while   President and CEO

important role for traditional energy sources for      also offering lower-carbon feedstocks into the
years to come; it also projects that inherently        petrochemical sector. In addition, we continue
lower-carbon natural gas and renewable fuels will      to focus on our efficiency, and for the second
comprise a growing portion of the global energy        straight year, we have been recognized by the
mix. MPC and MPLX are well positioned to meet          U.S. Environmental Protection Agency with the
the needs of this energy evolution.                    ENERGY STAR® Partner of the Year – Sustained
                                                       Excellence Award – the only company with fuels
As part of our challenge to be a leader in             manufacturing as its primary business to earn
sustainable energy, we have set various targets to     this recognition. These actions have lowered the
improve GHG performance. MPC and MPLX are              carbon intensity of our company operations and
aiming to reduce Scope 1 and 2 GHG emissions           the products we offer to the consumer.
intensity 30% below 2014 levels by 2030 – a
metric linked to compensation – and MPLX aims          Our progress is enabled by strong governance
to reduce gathering and processing methane             and dynamic enterprise risk management.
emissions intensity 50% below 2016 levels by           MPC’s board is engaged on climate issues and
2025. This is just the beginning, and we commit to     qualified to steer our evolution to meet the needs
update and expand targets as new opportunities         of a changing market. We adjust our climate
and technologies unfold.                               scenarios annually to maintain consistency
                                                       with the latest IEA projections, including the
                                                       Sustainable Development Scenario and the IEA’s
                                                       new Net Zero Emissions by 2050 case, which

                                                                                                                                  2021 Perspectives on Climate-Related Scenarios | 01
MPC AND MPLX OPERATIONS
2.9
million
barrels per
calendar day of
crude oil refining
capacity
0.8
®
barrels per calendar day
of Natural Gas Liquids
(NGLs) fractionation
million capacity
11.8 standard cubic feet
per day of natural gas
billion processing capacity MPC Refinery
MPC Owned Light
Product Terminal
MPC Owned Asphalt/
Heavy Oil Terminal
MPC Owned and Part-
Owned Marine Facility
42
MPC/MPLX Pipeline (a)
Cavern
million MPC Domestic Marketing Area
barrels of storage
MPC International Marketing Area
capacity at our
light product Illustrative representation of
Ethanol Facility
and asphalt asset map as of 5/12/21 MPC Biodiesel Facility
terminals
Virent (c)
8,100 MPC Renewable Diesel Facility
Martinez Renewable Fuels Project
North American branded and
direct dealer locations
MPLX Owned and Part-Owned
Light Product Terminal
MPLX Owned Asphalt/Heavy Oil
2.1
Terminal
MPLX Natural Gas Processing
Complex (b)
billion MPLX Refining Logistics Asset
gallons of MPLX Gathering System
renewable MPLX Owned Marine Facility
fuels delivered
to consumers in (a) Includes MPC/MPLX owned and operated lines, MPC/MPLX interest lines operated by others and MPC/MPLX operated lines owned by others. Louisiana Offshore Oil Port, a joint
venture in which MPC and MPLX
2020 (b) Includes MPLX owned and operated natural gas processing complexes.
hold interests.
(c) Wholly owned subsidiary of MPC working to commercialize the conversion of biobased feedstocks into renewable fuels and chemicals.
02
INTRODUCTION

Acting today is crucial to unlocking tomorrow’s                                        To reach a net-zero state, global emissions must be
potential.                                                                             reduced and balanced with GHG emissions sinks
The primary ambition of the Paris Agreement is to limit global warming to well
below 2 degrees Celsius compared to pre-industrial levels. Access to clean,                                                              Strategies to reduce annual
reliable and affordable energy is critically important to meeting this challenge.                                                        GHG emissions include:

Reliable and affordable energy will provide the resources and prosperity that                                                            • Replacing coal generation with
                                                                                                                                           natural gas and renewables
can drive innovation of next-generation energy technologies.                                                                             • Energy efficiency and
                                                                                                                                           electrification
The Intergovernmental Panel on Climate Change (IPCC) indicates that to                                      Annual global
                                                                                                            GHG emissions                • Carbon capture, utilization and
achieve the temperature ambition of the Paris Agreement, global GHG                                                                        sequestration (CCUS)
emissions will need to reach a “net-zero” state sometime around mid-century,                                        Remaining            • Biofuels and other alternative
                                                                                                                    GHG budget
followed by a subsequent drawdown of ambient GHG concentrations. Net-                                                                      fuels
                                                                                                                                         • Lifestyle changes (e.g., heating
zero does not mean zero emissions, instead it refers to a balance between                                                                  and cooling, commuting)
                                                                                                              GHG already
the amount of greenhouse gas emitted and the amount removed from the                                          accumulated in             • Innovation
                                                                                                              atmosphere
atmosphere in order to prevent ambient concentrations from rising. Like a
bathtub with the taps on, an approach to achieving this balance can be either
to turn down the taps (reduce emissions) or to drain an equal or greater
amount (e.g., remove CO2 through photosynthesis, direct air capture). Both
                                                                                       Strategies to increase annual
will be needed.                                                                        GHG emissions sinks include:
                                                                                       • Regenerative/sustainable agriculture
The IPCC timing of the net-zero goal is based on a “carbon-budget,” which              • Protecting and restoring ecosystems
estimates the remaining emissions that can enter the atmosphere without                • Direct air capture                                              GHG removal sinks
raising the temperature above 1.5 to 2 degrees Celsius. Thus, it is equally            • Innovation
important for society to reduce near-term global emissions to preserve the
carbon budget while working toward the longer-term aspirations of reaching
net-zero.                                                                           The importance of near-term action means it is critical to bank those
Global emissions have continued to increase despite bright spots where              savings as soon as possible using the technological tools currently at our
nations or regions have achieved reductions – mainly the U.S. and the               disposal. Continued investment in the next generation of innovative energy
European Union, where emissions from fossil fuel combustion have fallen by          technologies is a long-term solution that should continue on a parallel path.
more than 15% below 2005 levels. To reverse the global trend, it is imperative
for society to deploy existing strategies and technologies that can decrease        We should not allow the global ambition to be net-zero
GHG emissions in the near term. Every sustained tonne of GHG emissions              to inhibit the deployment of existing technologies that
avoided today counts for 30 tonnes of total GHG emissions avoided in the
three decades between now and 2050, thereby helping to preserve the
                                                                                    can reduce greenhouse gas emissions today.
carbon budget.

                                                                                                                                  2021 Perspectives on Climate-Related Scenarios | 03
INTRODUCTION

     A variety of innovative technologies are being developed
     to supplement the enormous role that traditional energy
                                                                     Climate mitigation technologies and strategies ready today
     sources play in fueling modern life, however, they are not
     readily deployable as replacements today and potentially
     not for many decades. Deploying existing technologies,
     on the other hand, can have an immediate impact on GHG
     reductions.
     Incentivizing deployment of existing technologies and
     strategies that we know can provide near-term GHG
     emission reductions – replacing coal with natural gas and       Electrification      Energy          Coal-to-gas     Non-baseload
     renewables, energy efficiency, biofuels, nature-based                               efficiency      switching for     renewable
     solutions and carbon capture – will allow the next generation                                       baseload and      power (e.g.
                                                                                                          peak power     solar and wind)
     of advanced energy technologies to be developed and
     deployed in the decades to come.
     For instance, a global switch from coal to
     natural gas and renewables to generate                               CO2e
                                                                                                                              H2
     power could reduce GHG emissions by over
     5 billion tonnes per year.
                                                                     Carbon capture,    Biofuels (e.g.   Nature-based        Blue
     Throughout this report we provide disclosures that follow        utilization and    renewable       sequestration     hydrogen
     the recommendations from the Task Force on Climate-              sequestration        diesel)       and land use
     Related Financial Disclosures (TCFD), including a review of           (CCUS)
     our business against a “less than 2-degree” or “low-carbon”
     scenario, using scenarios developed by the International
     Energy Agency (IEA).                                            Next-generation technologies for potential future deployment
     We believe our investors and other interested stakeholders
     will find that the extensive disclosures in this report, our
     most recent Annual Report on Form 10-K, Sustainability
     Report and website align with the TCFD’s principles                                                                      H2
     and demonstrate MPC’s and MPLX’s financial strength,
     adaptiveness and resilience to climate-related risks.
                                                                        Grid-scale        Direct air       Advanced         Green
                                                                      battery storage      capture         cellulosic      hydrogen
                                                                                        technologies        biofuels

04
INTRODUCTION

Business Planning and Capital Allocation
MPC’s and MPLX’s Investments Toward a Lower-Carbon Future
Over the past decade, our investments in lower-carbon businesses have                             2014
                                                                                  Evolution of MPC and MPLX Processed Volume Portfolio       2020
                                                                                  Based on energy content of products
diversified our portfolio, increased our resilience and advanced a business
model that supports reducing our overall carbon intensity and the energy
transition. The energy company we are today is much different than the
petroleum refining company we were in 2014. In 2014, nearly 90% of our
production was attributed to petroleum-based fuels. Today we are much more
diversified, with nearly 50% of our production attributed to lower-carbon
natural gas, renewable fuels and petrochemical feedstocks.                                     2014                                        2020
Our investment strategy has already significantly reduced the greenhouse
gas intensity of our company. But we continue to push for more. In
March 2020, we became the first independent U.S. refiner to establish a
companywide GHG emissions intensity reduction target, and we have taken
the additional step of linking the achievement of the goal to our executive and
                                                                                  Petroleum based fuel                     2014    2020
employee compensation programs. We now calculate how each major capital                                                   Petroleum based fuel
project would affect our company GHG goal as part of capital allocation.                   Petroleum based fuel             88%     52%
In addition to our GHG goal, we continue to employ a risk-based capital           Non-energy   petroleum
                                                                                          Non-energy       products
                                                                                                      petroleum  Non-energy petroleum
                                                                                                                products    11%       products
                                                                                                                                     5%
allocation process that assigns higher return-on-investment (ROI) thresholds
                                                                                  BiofuelsRenewables
INTRODUCTION

     Market-Based Carbon Programs Can Incentivize GHG Emission Reductions
     We support market-based approaches to reduce                 North American Carbon Pricing Programs ($USD)
     emissions, and we are currently participating in several
                                                                         Existing programs
     programs based on this approach. For example, the
     California Low Carbon Fuel Standard (LCFS) program                  Legislation adopted and
                                                                         program under development
     established a goal to reduce the carbon intensity of
     the motor fuel sold in California by 20% through 2030.
     Fuel producers and marketers can comply by marketing
     fuels that have a lower carbon intensity or by purchasing
     credits that are currently priced near $200 per tonne of
     CO2. In response to this incentive, we deployed capital
     to convert our Dickinson, North Dakota, and Martinez,
     California, petroleum refineries into renewable diesel
     facilities that will generate LCFS credits. This is an                                                                  $24
     example of a narrow market-based policy that is driving
     investment in lower carbon-intensity fuels.                                                                                                            $24
     Because the climate impact of one tonne of carbon
     emitted to the atmosphere is the same regardless of                                                           $36
     location or source, we believe an economy-wide market-
                                                                                                                                           $32   $18
     based policy that places a uniform, predictable cost on
                                                                  Clean Fuel Credits
     carbon will drive emission reductions at the lowest cost
                                                                        $135
     to society. Such a program would also support continued                                                                                                  $20
     technology innovation and deployment.
     There are many opportunities with abatement costs                   LCFS Credits                                                                  $9
     far below the $200 per tonne of CO2 costs associated                    $200
     with the California LCFS. For example, an appropriately
     designed and implemented national economy-wide
     program with a gradual price escalation would assure
     the lowest-cost abatements are completed first.             Cap and Trade Credits
     Some opportunities that require an incentive to make                 $18
     widespread deployment cost effective include:
                                                                                                                                      $3
     •   Carbon capture, utilization and sequestration (CCUS)                                       $8
     •   Many energy efficiency projects
     •   Building retrofits - insulation, HVAC, windows, etc.
     •   Electrification
     •   Regenerative farming
     •   Nature-based sequestration                               Sources: The World Bank, State and Trends of Carbon Pricing 2021.

06
INTRODUCTION
Scope 3 Emissions Explained
We have focused considerable effort and capital toward reducing Scope 1 For instance, as we discuss in detail starting on Page 11, the growth of the
and Scope 2 emissions, and we have provided transparent reports detailing U.S. natural gas industry significantly increased the Scope 3 emissions of
our efforts and our progress. We focus on Scope 1 and Scope 2 emissions many individual natural gas companies, including MPC and MPLX. This growth
because we have direct control over these emissions and there are well- also enabled a significant net emissions decrease from natural gas replacing
established and consistent criteria for reporting them across different coal for power generation. This perspective is lost when Scope 3 emissions
industries. Scope 1 and Scope 2 emissions are also an indication of how are not presented in context.
efficiently a company produces a product. Scope 3 emissions reporting also leads to significant double-counting because
This year we are providing an estimate of our Scope 3 emissions from the use it identifies emissions within the energy value chain that touch many different
of sold products. These are the GHG emissions released when the fuels we companies. The following table provides a simplified explanation of double-
produce and market are combusted. Emissions from the use of sold products counting across the energy value chain of our MPLX G&P business segment.
are, by their very nature, not within our control. Scope 3 emissions on an As demonstrated below, 192 million tonnes of CO2e would be reported by
individual company basis are also not an indicator whether global emissions four separate companies, leading to the perception that 768 million tonnes of
are being reduced and do not provide context of how emissions fit within the CO2e has been emitted. Please note we have not included Scope 2 emissions
global energy system. for simplicity.
Life Cycle Stage of Natural Gas
Total Total Total
Item Gas Combusting Scope 1 Scope 3 Scope 1 & 3
Gas Gas Gathering
Transmission, Gas for Power (million tonnes CO2) (million tonnes CO2) (million tonnes CO2)
Production & Processing
Storage & Dist. Generation
Life Cycle GHG from natural gas used for
5 5 6 176 192 N/A 192
electricity generation (million tonnes CO2)
How above GHGs could be classified and reported by companies across the value chain:
Gas Producer Scope 1 Scope 3 Scope 3 Scope 3 5 187 192
MPLX Gathering & Processing Scope 3 Scope 1 Scope 3 Scope 3 5 187 192
Gas Distributor Scope 3 Scope 3 Scope 1 Scope 3 6 186 192
Power Generator Scope 3 Scope 3 Scope 3 Scope 1 176 16 192
Reported 192 576 768
Emissions:
2021 Perspectives on Climate-Related Scenarios | 07INTRODUCTION
Annual global emissions trends of the entire oil and gas industry compared Throughout this report, we highlight examples of customer (end user) GHG
to Paris-aligned scenario projections like the IEA’s SDS and NZE2050 are a emission reductions from our participation in several value chains as reflected
much better measure of meeting the world’s climate goals than an individual below:
company’s Scope 3 emissions. For instance, the IEA indicates that in 2040 oil • Approximately 250 million metric tons per year of GHG emission reductions
and gas could still provide roughly 50% of energy demand worldwide, albeit at associated with the coal-to-natural gas switching in the power sector based
lower volumes than today. This means there will still be successful companies upon our current natural gas processing rates – Page 13
producing oil and gas products for societal use well into the future.
• Production and blending of ~2.1 billion gallons per year of biofuels has
Currently, Scope 3 reporting protocols do not recognize the societal GHG enabled nearly 9 million metric tons per year of GHG emission reductions –
reductions that correspond with reported Scope 3 emissions. An example is Page 27
GHG emission reductions associated with fuel switching or CCUS employed
by a customer. Protocols currently do not recognize these benefits as a • Carbon capture and use of Scope 1 GHG emissions from our assets has
corresponding reduction in the Scope 3 emissions of the energy supplier resulted in ~0.4 million metric tons per year of GHG emissions being
even though they are realized by society. We feel this inequity should be displaced from the food and beverage industry – Page 24
rectified by the standard-setting bodies to enable GHG emission reductions These substantial GHG emission reductions are not solely attributable to
to be accounted for in the same fashion as the emissions associated with our MPC, MPLX or other companies, but rather, they represent the collective
energy products. societal benefits from significant investment and involvement throughout the
value chain.
Refining and Marketing (including biofuels) Unit of Measure 2019 2020
Scope 3 Emissionsi
million tonnes CO2e 426 352
Category 11 - Refinery Yield Method
Scope 3 Emissionsi
million tonnes CO2e 485 415
Category 11 - Marketed Volume Method
MPLX G&P Unit of Measure 2019 2020
Scope 3 Emissionsi,ii
million tonnes CO2e 188 191
Category 11 - Processed Volume Owned by Third Parties
Scope 3 Emissionsi,ii
million tonnes CO2e 2 2
Category 11 - Processed Volume Owned by MPLX
i
MPC calculates emissions from third-party use of sold products in alignment with methods in Category 11 of IPIECA’s Estimating Petroleum Industry Value Chain (Scope 3) Greenhouse Gas Emissions (2016). MPC applied emission
factors obtained from EPA or derived from API calculations. Non-fuels products are not combusted by the end user and therefore are not included in these Scope 3 estimates. IPIECA’s Scope 3 methodology includes 15 categories
of activities along each product’s value chain. Due to lack of third-party data, Scope 3 emissions for categories other than Category 11 could not be estimated. Greenhouse gas estimates using the yield method are based on MPC’s
sales of products manufactured by our assets and emissions from the marketed volume method represent energy products sold to customers by MPC and include energy products purchased by MPC from other suppliers and
resold.
ii
Over 99% of the natural gas and 97% of the NGLs processed through our MPLX assets are not owned or marketed by MPLX.
The external assurance statement from Lloyds Register Quality Assurance, Inc. relating to our GHG data is available at
https://www.marathonpetroleum.com/htmlEmails/LRQA/LR_Independent_Assurance_Statement.pdf
08BUSINESS STRATEGY AND CLIMATE- The IEA’s scenarios forecast possible future energy
landscapes with the aim of providing governments,
RELATED SCENARIO PLANNING
companies and other stakeholders with a range of
potential outcomes to consider. These scenarios provide
our company with several versions of the future to
Today’s energy landscape consider so we can plan ahead and adjust appropriately
is constantly evolving, and as the future unfolds. In this year’s report, we apply the
following three hypothetical scenarios:
the topic of climate change • Stated Policies Scenario (STEPS) — previously
is at the forefront. known as the New Policies Scenario, the central
scenario from IEA provides a detailed look at where
today’s policy ambitions would take the energy sector.
Whether it is the significant investment in It incorporates policies and measures that governments
research and development of low-carbon around the world have already put in place, as well as
energy technologies that may disrupt our the effects of announced policies, most notably those
current energy systems, the advances in in climate pledges submitted for the Paris Climate
scientific understanding of the global carbon Agreement (COP21).
cycle, or the many competing policies and • Sustainable Development Scenario (SDS) — a
strategies put forth at all levels of government, hypothetical construct that starts with the outcomes
we continually evaluate these and other to be achieved and then assesses a pathway of actions
climate-related risks and opportunities as part that could achieve them. The specific outcomes
of our governance. This includes evaluating are modeled after the United Nations Sustainable
both long-term and short-term scenarios. Development Goals: 1) ensuring universal access to
Throughout this section we provide detailed affordable, reliable, sustainable and modern energy
analyses of our business strategies against services by 2030 (SDG 7.1); 2) substantially reducing
future scenarios from the International Energy air pollution (SDG 3.9); and 3) limiting worldwide
Agency (IEA) and data from HSB Solomon temperature increases to well below 2 degrees Celsius
Associates LLC (Solomon). (SDG 13).
• Net Zero Emissions by 2050 case (NZE2050)— a
supplement to the SDS analysis. The SDS sees many
advanced economies reaching net-zero emissions by
2050 at the latest, and puts the world on track for net-
zero emissions by 2070. The NZE2050 accelerates this
further by modeling a pathway to reach net-zero CO2e
emissions globally by 2050.
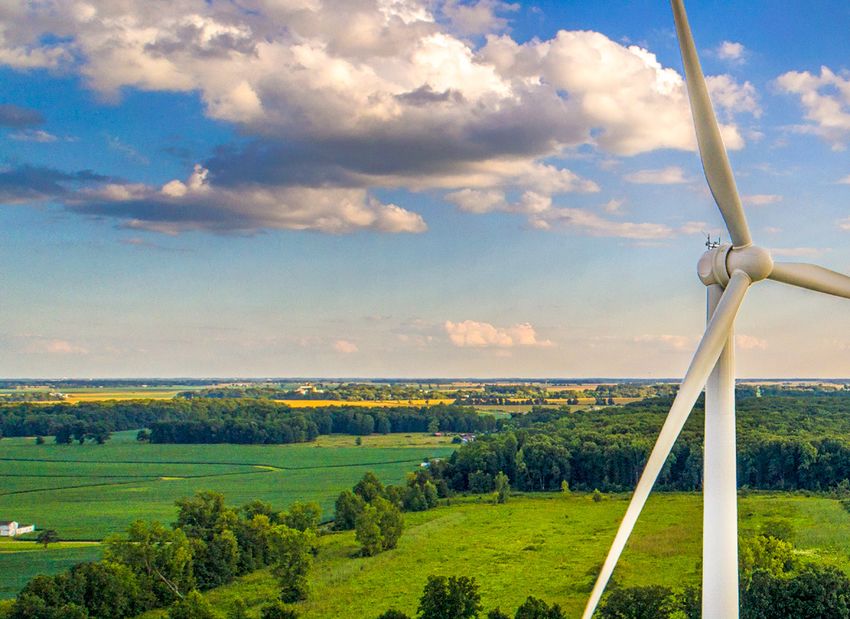
Pictured: A wind turbine provides electricity for a pipeline
pump station owned and operated by Marathon Pipe Line
LLC, an MPLX subsidiary.
2021 Perspectives on Climate-Related Scenarios | 09BUSINESS STRATEGY AND CLIMATE-RELATED SCENARIO PLANNING
Energy Outlook Through 2040
For the world to meet Basic services that many of us take
the challenge of the Paris for granted, like clean water and IEA Energy Projections for 2040 at a Glance
sanitation, all depend on energy.
Agreement, there needs to 2040 2040 2040
Virtually every product we purchase 2019*
be a shift in the type and depends on energy for its raw STEPS SDS NZE2050***
volumes of energy the global materials, manufacture, and transport
community uses today and in to retail outlets and our homes. Crude Oil 31% Crude Oil 28% Crude Oil 23%
Other Renewables
32%
the future. Ensuring that energy remains reliable
and affordable is essential to gaining
There are short-term solutions like
and keeping public support for our
replacing coal with natural gas and Coal 26% Gas 25% Gas 23% Bioenergy 18%
common goal of reducing GHG
renewables, and carbon capture,
emissions.
utilization and sequestration (CCUS)
that can provide immediate carbon While developed nations enjoy Other Renewables
Gas 23% Coal 19% Crude Oil 15%
reductions. There are also longer- nearly universal access to affordable, 18%
term solutions such as grid-scale reliable energy, not everyone is so
battery storage and/or compact fortunate. There are still nearly 800
nuclear reactors that are still under million people worldwide without Bioenergy 9% Bioenergy 11% Bioenergy 13% Gas 14%
development. Key to the success electricity and another 2.6 billion
of the sustainable energy evolution people without access to clean
is affordable and reliable energy. cooking resources. We support Other Renewables
Nuclear 5% Coal 10% Nuclear 10%
Ensuring that energy remains the United Nations Sustainable 8%
affordable and reliable, as lower- Development Goal of providing
carbon technologies are deployed, energy access to close this gap so
will help build societal support and that everyone has a chance at greater Hydro 3% Nuclear 5% Nuclear 9% Coal 6%
lead to more decarbonization. If prosperity. The IEA’s scenarios take
energy costs rise rapidly, energy these factors into consideration; all
becomes less reliable and is not three scenarios include diversified Other Renewables
Hydro 3% Hydro 4% Hydro 5%
available when expected, prosperity energy portfolios that vary the speed 2%
suffers, with those least able to of innovation, technology adoption
afford such shocks impacted most. and decarbonization. The SDS, for
Total Energy Total Energy Total Energy Total Energy
example indicates that fossil fuels
Prosperity and energy are inextricably Demand** Demand Demand Demand
would still be expected to provide 287 340 259 239
tied together. The more people pay
over 50% of energy demand into
for energy, the less income they have
2040, albeit at lower volumes than
for other things. People need energy * Latest year available
today. ** In million boe per day
to get to work; to light, heat and cool *** Adapted from IEA (2021), Net Zero by 2050, IEA, Paris
their homes; to power their phones
and computers; and to cook their Source: IEA, World Energy Outlook 2020
meals.
10BUSINESS STRATEGY AND CLIMATE-RELATED SCENARIO PLANNING
Scenario Analysis of Midstream
Under each of IEA’s scenarios, demand for natural gas is expected to stay strong
through 2040. This is because, as the cleanest burning fossil fuel, natural gas Natural Gas Demand Projections Through 2040 (billion cubic meters)
provides a pathway toward significant near-term GHG emissions reduction
ambitions. Every sustained tonne of GHG emissions avoided today counts for 30 2010 Actual
tonnes of total GHG emissions avoided in three decades, preserving the planet’s
carbon budget and allowing for technology development in furtherance of net- 2019 Actual
zero goals.
The importance of near-term actions means it is critical to bank any GHG 2030E
reductions as soon as possible and to use the technological tools currently at
our disposal. That is where natural gas can deliver. The greatest potential for
GHG reductions is in replacing coal used for electricity generation and thermal 2040E
heating. The best option for replacing coal – in the short term – is natural gas in
combination with new renewable power generating capacity.1 This is because
natural gas produces half the emissions for the same amount of energy as coal,
0 1000 2000 3000 4000 5000 6000
is abundant, burns cleanly and can provide efficient heat production on demand.
Natural gas can also be supplemented with renewable power generation, such as STEPS SDS NZE2050
wind and solar, to further reduce GHGs, with natural gas providing the baseload
Source: IEA, World Energy Outlook 2020
and peak energy.
The U.S. has already demonstrated the benefits of this strategy. Specifically, as
shown to the right, the U.S. has reduced CO2 emissions from fuel combustion
Regional Carbon Dioxide Emissions from Fuel Combustion (2000-2019)
by over 930 million tonnes per year below 2005 levels, a 16% decrease. Much
of this reduction occurred within the electricity generation sector through coal 10 205%
displacement in favor of natural gas and, to a lesser extent, renewable sources
Carbon Dioxide Emissions (billion tonnes per year)
increase
9
such as wind and solar. This is in stark contrast to much of the rest of the world,
8
where emissions continue to increase. Much of the increase can be attributed
7
to expanding coal power. For instance, China and India, collectively, still produce
more than 65% of their electricity from coal. Both countries continue to build 6
17%
new coal plants, signaling both China and India intend to continue coal use for 5 decrease
many years, further reducing the remaining global carbon budget.2 4 15%
decrease
3
159%
2 increase
“A record-tying 37.8 gigawatts (GW) of coal plants were 1 101%
increase
retired in 2020, led by the U.S. with 11.3 GW and EU27 0
with 10.1 GW, but these retirements were eclipsed by 2000 2002 2004 2006 2008 2010 2012 2014 2016 2018 2020
China’s 38.4 GW [and India’s 2 GW] of new coal plants.” China United States OECD Europe India Middle East
Global Energy Monitor, et. al., Boom and Bust 2021 (April 2021). Source: IEA, CO2 Emissions from Fuel Combustion (2020)
2021 Perspectives on Climate-Related Scenarios | 11BUSINESS STRATEGY AND CLIMATE-RELATED SCENARIO PLANNING
In 2005, nearly 50% of the electricity produced in the U.S. was generated from coal. This dropped
below 20% for the first time in 2020 and is expected to continue declining. This shift from coal United States Power Generation by Source
to natural gas significantly increased demand for natural gas by nearly 20 billion standard cubic
feet per day (scfd), a 30% increase. This natural gas boom has been the primary driver behind
2005
the 930 million tonnes per year of CO2 reductions realized in the U.S. This was accomplished
through significant private investment across all key segments of the natural gas system, including
production, gathering and processing, distribution and storage, and transmission. Natural gas
power generation has also kept the electric grid stable, allowing for more renewable power 2010
to come online without disrupting electricity supplies. This is a model that can be replicated
throughout much of the world to further help reduce GHG emissions.
2015
If a similar coal displacement strategy were applied worldwide, an additional 5 billion tonnes of
CO2 per year reduction could be realized in the near term while expanding access to electricity
in the developing world.3 This can be done now with existing technology and without risking grid
2020
instability; U.S.-produced natural gas could help spawn decarbonization in other parts of the world,
including China and India, where coal use continues to expand.
0 20% 40% 60% 80% 100%
Coal Natural Gas Nuclear
MPLX Contributions to U.S. GHG Reductions Renewable Fuels Other
We have invested approximately $20 billion to acquire and expand natural gas gathering and Source: U.S. Energy Information Administration
processing capacity through our master limited partnership, MPLX. Since first acquiring natural
gas assets in December 2015, we have steadily grown MPLX into the largest natural gas
Natural Gas Processed by MPLX Assets (2010-2020)
processing company in the U.S.4 These significant investments helped to significantly reduce
the carbon intensity of the energy supply chain over the last decade, benefiting the economy and
2010
the environment. As shown to the right, our asset base has steadily grown over the past decade
and corresponds to the increase in natural gas electricity generation shown above. During this 2012
time period, demand for electricity remained relatively flat. Evaluating the gross Scope 1, 2 and
3 emissions from these investments would show a steady increase in MPLX’s GHG emissions 2014
year over year. However, this one-dimensional analysis ignores the substantial net societal GHG
reductions that MPLX has helped to facilitate. 2016
2018
2020
0 2 4 6 8 10
Billion standard cubic feet per day
12BUSINESS STRATEGY AND CLIMATE-RELATED SCENARIO PLANNING
For climate-risk reporting and
analysis to be meaningful, net The annual volume of natural gas processed by MPLX has helped avoid
societal benefits and impacts approximately 250 million tonnes CO2e from the U.S. energy supply chain
per year when compared to coal for electricity generation.
must be considered.
This illustrative example compares the life cycle GHG emissions that would result from the
An illustrative example of the substantial 8.4 Bcf/d of natural gas processed by MPLX in 2020 being used for electricity generation versus
net societal GHG benefits MPLX has helped that of coal. Based on U.S. Energy Information Administration data:
facilitate is shown to the right. Over the next • 8.4 Bcf/d of natural gas would produce 417 billion kWh of electricity
decade we expect further displacement of
• 233 million tons of coal would be needed to produce 417 billion kWh of electricity
U.S. coal-fired generating capacity as more
natural gas, wind and solar generation come
online. An additional 700 million tonnes of
CO2 could be reduced in the U.S. as a result. + + + ~176 MT ≈ 192 MT CO2e
Natural gas, wind and solar generation are ~5 MT CO2e ~5 MT CO2e1 ~6 MT CO2e
CO2e
very complementary. Because natural gas
generation can be produced on demand, it
provides baseload energy and grid stability for 8.4 MPLX 8.4 8.4
Gas Bcf/d Gathering and Bcf/d Gas Bcf/d Electricity 417 billion kWh
wind and solar. Unlike natural gas generation, Production Distribution Production
Processing
wind and solar are inherently intermittent,
capturing wind energy and solar energy only
when they are present. An estimated 192 million tonnes CO2e is emitted across the energy value
chain to produce 417 billion kWh of electricity natural gas.
Nearly 10% of the natural
gas produced in the United + small, not + ≈ 447 MT CO2e
~16 MT CO2e ~431 MT CO2e
available
States passes through our
integrated gas gathering and
processing networks, which Coal 233 million tons Coal 233 million tons Electricity 417 billion kWh
Production Distribution Production
are strategically located
within some of the most
An estimated 447 million tonnes CO2e is emitted across the energy value
prolific natural gas basins chain to produce 417 billion kWh of electricity using coal.
in the U.S. — the Marcellus,
Utica and Permian. Source: Adapted from U.S. EPA, Inventory of U.S. Greenhouse Gas Emissions and Sinks: 1990-2019 (2021)
2021 Perspectives on Climate-Related Scenarios | 13BUSINESS STRATEGY AND CLIMATE-RELATED SCENARIO PLANNING
Additional Carbon Reductions Natural Gas Can Deliver
Natural gas is a versatile, clean-burning and efficient fuel that can be used in a wide variety of applications.
Natural gas and Replacing lower-efficiency boilers and deploying CHP systems reduces the emissions intensity of the
industrial sector, even as natural gas continues to grow as a proportion of total fuel consumption in the sector.
combined heat
MPC operates several CHP systems at our refineries, which have avoided millions of tonnes of GHGs when
and power (CHP) compared to separately generating electricity and steam.
Natural gas Natural gas power plants can be retrofitted for carbon capture, utilization and sequestration (CCUS), leading
CO2e power generation to further GHG reductions. Natural gas generation will be critical to providing grid stability as electrification
with CCUS strategies for buildings, industry and transportation increase electricity demand.
Natural gas and natural gas liquids (NGLs) are important feedstocks to make products such as chemicals
Natural gas as and plastics, which do not emit greenhouse gases in end use. Methane is also the primary feedstock used
to produce hydrogen. The proliferation of blue hydrogen made through stream methane reformation with
H2 feedstock CCUS or methane pyrolysis is a future low-carbon use for natural gas that is expected to drive substantial CO2
reductions.
Compressed natural gas (CNG) and liquefied natural gas (LNG) can be deployed directly as a transportation
Natural gas as fuel. Most natural gas-fueled vehicles in the United States today are buses and trucks. CNG and LNG can
transportation reduce GHG emissions as compared to gasoline and diesel and are energy-dense fuels that can be used in
fuel heavy-duty engines and cargo ships where electrification is currently not viable. Limited availability of fueling
infrastructure is one of the hurdles to deploying more natural gas-fueled vehicles.
14BUSINESS STRATEGY AND CLIMATE-RELATED SCENARIO PLANNING
Focus on Methane
To fully realize the potential climate benefits of natural gas, it is important MPLX Focus Areas for Methane Reductions
to minimize leaks, venting and flaring of methane. Unmitigated methane
emissions can undermine some of the climate benefits of natural gas we Pneumatic Control Valves
have highlighted throughout this report. MPLX and others within the natural
Over 80% of our more than 25,000 pneumatic controllers are
gas industry are implementing measures to reduce methane emissions from
powered by compressed air, meaning they are not a source of
leaks, venting and flaring. We continue to work with regulators to identify and
methane. For the remaining gas-driven controllers we plan to
implement measures that help to minimize methane emissions and promote
replace the remaining ~300 high-bleed controllers by the end of
efficiency within the natural gas industry.
2022 and begin implementing a program to either convert ~3,000
intermittent bleed controllers to low bleed or compressed air or
MPLX Commitments implement an LDAR program to assure performance.
To further our commitment to reduce methane emissions, in 2020 MPLX Pipeline Launchers and Receivers
adopted a target to decrease our methane emissions intensity by 50% below
2016 levels by 2030. As part of an agreement with U.S. EPA, we developed proprietary
technology to minimize emissions from pipeline launchers and
The first step we took was to inventory where methane emissions originate receivers. MPLX shared its solutions with nearly 1,000 people via
from within our system and identify programs to reduce emissions. We in-person trainings, and our royalty-free patents are available on
expect to reduce methane emissions from existing assets by around 5,000 the MPLX website.
tonnes per year to meet our 2025 goal. For new construction, we plan to
design systems with lower potential for methane emissions. LDAR Fugitive Leak Detection and Repair (LDAR)
Currently, approximately 25% of our 180 compressor stations
Methane Intensity (CH4 emissions/CH4 throughput) are being monitored under existing LDAR programs. We plan to
implement LDAR programs at the remaining compressor stations
by 2023.
Production Gathering Processing Transmission Distribution
Compressor Rod Packing
U.S. 2010 (included in We have completed trials to reduce emissions from compressor
1.40% 0.30% 0.47% 0.34%
Estimate production)
rod packing using a low-emission packing material and installing
vent flow measurement. Over the next three years we will
U.S. 2019 expand the use of this design across the business as part of
0.33% 0.25% 0.12% 0.22% 0.11% routine rod packing replacements.
Estimate
MPLX
Maintenance Venting
Not Not Not
2020 0.07% 0.01% We are optimizing necessary maintenance venting and
Applicable Applicable Applicable
Estimate
blowdowns to reduce emissions going to the atmosphere,
REDUCE including using vapor recovery units and/or portable flares.
Source: Adapted from EPA, Inventory of U.S. Greenhouse Gas Emissions and Sinks (2021).
2021 Perspectives on Climate-Related Scenarios | 15BUSINESS STRATEGY AND CLIMATE-RELATED SCENARIO PLANNING
Midstream — Potential Risks and Opportunities
Our Midstream segment, which includes MPLX, faces the following key climate-related risks and opportunities:
Gathering and Processing Logistics and Storage Opportunities
Risks Risks • The integration of our transportation and storage
• Potential regulations and policies could • Reduced demand for transportation fuels that assets with our refining, gas processing and
reduce demand for natural gas and related are transported through or stored in our logistics branded retail locations provides opportunities
services. assets, including our pipelines, terminals and to quickly and cost-effectively take advantage of
marine fleet. market opportunities, such as being located in
• While we do not conduct hydraulic fracturing areas accessible to existing and planned gas and
operations, we do provide gathering, • Increased climate-related regulations and petroleum product export facilities.
processing and fractionation services with litigation surrounding pipeline construction, siting
respect to natural gas and NGLs produced by and operation could have a negative impact on • The increased difficulty of building new
our customers as a result of such operations. business. pipelines increases the value of MPLX’s
As a result, any prohibitions on hydraulic existing infrastructure. This existing logistics
fracturing or increased regulation of the infrastructure could be converted to transport
upstream oil and gas industry could affect our renewable fuels, green or blue hydrogen, or CO2
Midstream business. for sequestration as emerging markets mature.
Opportunities
• Continued coal-to-gas switching would
support or increase demand for natural gas
and provide a “quick win” by reducing local air
pollutants and near-term GHG emissions.
• Production of blue hydrogen as a low carbon
fuel source could increase demand for natural
gas. The United States has ample saline
aquifer storage capacity that can be used to
store CO2 generated from converting natural
gas into blue hydrogen.
• Increased petrochemical feedstock demand
and demand for clean cooking fuel could
further strengthen demand for NGLs from
our deethanization and fractionation facilities
located in the Marcellus, Utica and Permian
basins.
16BUSINESS STRATEGY AND CLIMATE-RELATED SCENARIO PLANNING
Midstream Scenario Analysis
Throughout this report we have highlighted the • Transportation: The use of natural gas in • U.S. Product Exports: The continued strong
great potential of natural gas to help further the international shipping is projected to reach 50 outlook for U.S. crude, natural gas and NGL
ambitions of the Paris Agreement to reduce bcm by 2040 from less than 1 bcm today and production will require additional infrastructure to
GHG emissions. As the cleanest burning fossil could account for 13% of the shipping fuel mix. link supply to global demand markets. Pipelines
fuel, natural gas emits about half the amount The International Maritime Organization has and processing, fractionation and LNG export
of carbon dioxide as coal and is highly versatile. adopted an initial strategy to cut GHG emissions facilities will be needed to allow U.S. producers
Natural gas can also coexist with wind and solar by 50% through 2050. Natural gas fuel is to realize full product value. The IEA projects that
generation to deliver electricity with a much lower considered to be a viable option to help meet almost all the growth in U.S. gas production will
carbon footprint while providing the reliability and this goal. be destined for export.
affordability that is expected.
Given these significant advantages, the IEA
continues to project strong demand for natural gas Natural Gas - Potential for Hydrogen Production
and NGLs through 2040. Natural gas also has great potential to produce blue hydrogen as a zero-carbon fuel and feedstock. In the SDS,
• Natural Gas: The IEA projects worldwide around 50 million tonnes of oil equivalent (Mtoe) of low-carbon hydrogen would be produced globally in 2030,
natural gas demand will increase by 30% and this rises to 470 Mtoe in 2050. Blue hydrogen is produced through a reaction that separates methane into
under its Stated Policies Scenario. Under the hydrogen and CO2 and then captures and sequesters the CO2. It is lower cost than green hydrogen produced
SDS, demand increases initially, then falls by through the electrolysis of water. Much of the 470 Mtoe of hydrogen production would need to be produced
10% below today’s levels. The Stated Policies through CCUS-equipped natural gas reformers unless there are significant advancements in electrolysis and
Scenario also projects that U.S. natural gas pyrolysis.
production will increase by approximately
12% through 2040 and is expected to be Description Key Advantages Key Challenges
concentrated in the Utica, Marcellus and
Steam methane reforming (SMR) is a thermal The only technology currently Complex storage
with CCUS
Permian basins. The U.S. is expected to supply process that reacts methane (CH4) with steam operating at scale. As such, it is of CO2 gas. Political
SMR
between 20% to 25% of the world’s natural gas to produce hydrogen and CO2. In order to be the most cost-effective form of opposition to CCUS in
through 2040. carbon neutral, it needs to be combined with hydrogen production, even with the many countries.
CCUS. addition of CCUS.
• Nonmethane Fractions of Natural Gas:
Demand remains strong through 2040 for the
nonmethane fractions of natural gas called Electrolysis is an existing technology (small- No direct carbon emissions and no Higher cost and
Electrolysis
scale use) that splits water (H2O) into hydrogen other by products that need to be questions about
NGLs, which are important feedstocks for the and oxygen using electricity. Hydrogen stored. scalability. Requires
petrochemical industry (e.g., steam cracking). produced can only be considered carbon large amounts of water.
The IEA projects petrochemical feedstock neutral if the electricity used is itself carbon
demand could increase by over 40% through neutral.
2040. The IEA and United Nations also project a
significant market increase is needed for clean Pyrolysis is the decomposition of methane into No complex CO2 storage in Early stages
Pyrolysis
hydrogen and solid carbon (c). Residual carbon underground caverns, as is the of technology
cooking fuel in the developing world to combat is in solid rather than in gaseous form. case with CCUS. Solid carbon can development.
indoor air pollution. be used as a feedstock in existing
industries.
2021 Perspectives on Climate-Related Scenarios | 17BUSINESS STRATEGY AND CLIMATE-RELATED SCENARIO PLANNING
Our Midstream Resiliency
Natural Gas Gathering and Processing
Natural Gas Liquids Have Many Uses
• The IEA projects the natural gas sector could experience worldwide
investments from $6 trillion to $8 trillion through 2040. Our strategic NGLs are naturally occurring hydrocarbons that are present in raw
goals align with this investment trend. Since 2015, we have invested natural gas and include ethane, propane, butane, isobutane and natural
approximately $20 billion in MPLX to acquire, steadily grow and optimize gasoline. They have a wide variety of applications, from specialized clean
our integrated natural gas gathering and processing network. This cooking fuels (e.g., propane, butane) to petrochemical feedstocks for
investment trend has lowered our overall carbon intensity substantially and making products like plastic and fertilizers. Many of these uses either
benefited the environment, to the extent that natural gas is displacing coal do not result in end-use GHG emissions or replace higher emitting
for electricity generation. As shown on Page 13, the volume of natural gas fuels. The United States is by far the largest producer of NGLs in the
processed by MPLX plays an important role in the U.S. energy supply chain world, accounting for more than one-third of global production and
that had a net societal benefit of reducing GHGs. is the world’s largest exporter. U.S. NGL production from natural gas
processing has more than doubled since 2010. The output of NGLs from
• The IEA projects the United States will continue to be the largest producer the Marcellus and Utica formations, where MPLX is the largest natural
of natural gas in the world through 2040, spawning significant exports gas processor, rose by over 2,000% since 2010.
of natural gas through pipelines to Canada and Mexico and LNG to other
regions of the world. MPC and MPLX are strategically located to take
NGLs Primary Uses
advantage of this opportunity. The location of our assets allows us to tie
Ethane petrochemical feedstock, plastics, clothing, antifreeze, detergent
into other existing and planned infrastructure, such as long-haul pipelines,
Propane home heating and clean cooking fuel, petrochemical feedstock
to deliver feedstock and product to refineries, petrochemical facilities and
export terminals on the East Coast and the Gulf Coast. Butane synthetic rubber, lighter fluid
Isobutane refrigeration, gasoline, aerosol
Logistics and Storage Pentane refrigeration, polystyrene, gasoline
• Given the projected viability of our natural gas processing plants, and the Natural Gasoline denaturant, flex-fuel, gasoline
U.S. refining industry, our logistics assets, including storage terminals,
export terminals, pipelines, marine fleet and trucking fleet will continue to U.S. Natural Gas Liquids Production U.S. Exports of Natural Gas Liquids
transport feedstocks and products to and from our production facilities. by Source
Our nationwide logistics network also provides us with a greater ability
2019 2020
to procure and deliver advantaged feedstocks to our production facilities 2018 2019
and transport finished products from our facilities to demand centers. 2017 2018
2017
Our existing nationwide logistics infrastructure could also be converted 2016
2016
2015
to transport renewable fuels, renewable hydrogen and/or CO2 for 2014
2015
2014
sequestration as those emerging markets mature. 2013 2013
2012 2012
2011 2011
MPLX processes over 570,000 bpd of NGLs and has plans to process up 2010 2010
to 650,000 bpd by 2025, equivalent to the largest refinery in the U.S. NGLs
continue to be a growing market for petrochemical feedstocks, where there 0 2 4 6 0 1 2 3
million bpd million bpd
are few viable replacements, and as clean cooking fuels to replace dirtier
Petroleum Refining
alternatives, such as traditional use of biomass and coal. Natural Gas Processing Source: U.S. Energy Information Administration
18BUSINESS STRATEGY AND CLIMATE-RELATED SCENARIO PLANNING
Climate Scenario Analysis of Refining and Marketing
Scenario Projections for Petroleum-Based Liquids
The IEA projects worldwide demand for petroleum-based liquids will remain strong through 2040,
indicating an increase under its STEPS. On the other hand, to meet the carbon constrained SDS,
demand would need to decline by 12% through 2030 and 33% by 2040. Under the NZE2050,
demand would need to decline by 28% over the next decade and 58% by 2040. Thus, unless there
is a technology breakthrough to capture and sequester CO2 emissions from mobile sources, demand Worldwide Petroleum-based Liquids Demand through 2040
(million bpd)
for petroleum-based liquids will need to decline to align with the IEA’s less than 2 degree scenarios.
Such a decline would prompt additional rationalization of the refining industry. Some key areas where
petroleum-based fuels could be impacted include: 2010
Actual
• Road Transport: Road transport has the largest impact on oil demand, and by 2040 there could
be another 1 billion passenger vehicles on the road worldwide. As a result, without significant 2019
advances in fuel economy, renewable fuel production, and penetration of electric and hydrogen Actual
vehicles, demand for petroleum-based fuel will increase. To meet the projections in the SDS and
NZE2050, 40% to 60% of all new passenger cars sold worldwide would need to be powered by
low-carbon electricity or hydrogen by 2030, along with 30% of new light- and medium-duty trucks.
A revolution to the vehicle fleet like this will require significant government coordination to be 2030
successful. First, significant decarbonization of electric grids must occur for electric vehicles to
provide the modeled GHG reductions. Second, electric grid infrastructure must be expanded and
improved to ensure stability from the increased demand for electricity. Finally, a robust charging
network would need to be built out before consumers will purchase vehicles at the levels being
modeled. These hurdles, and the reality that it takes 15 to 20 years to change over an existing
vehicle fleet, indicate that a significant base volume of petroleum fuels will be needed through
2040. Under the SDS, this is roughly 40% less than today. 2040
• Aviation and Shipping: There are few viable options currently available to replace petroleum-
based fuels in aviation and shipping beyond the small volumes of sustainable aviation fuel being
produced today. As a result, improvements must be made through engine and vehicle design,
0 20 40 60 80 100 120
logistics optimization and research and development of alternative fuels (e.g., ammonia, biofuels
and hydrogen) to have a significant impact on volumes of jet fuel, diesel and bunkers. STEPS SDS NZE2050
• Industry and Petrochemicals: Light-weighting of the transport sector to increase fuel efficiency
will be accomplished in part by increasing the use of petroleum-based plastics and composite Source: IEA, World Energy Outlook 2020 ; IEA (2021), Net Zero by 2050, IEA, Paris
materials in vehicles, planes and ships. As a result, petrochemicals demand is expected to grow.
• Buildings and Other: Other areas for demand reduction include making buildings more efficient
and replacing oil-fired boilers and heaters with natural gas, electric or renewable sources.
2021 Perspectives on Climate-Related Scenarios | 19You can also read