BMO Commercial Property Trust Limited - (formerly F&C Commercial Property Trust Limited) - BMO Global Asset Management
←
→
Page content transcription
If your browser does not render page correctly, please read the page content below

BMO Commercial
Property Trust Limited
(formerly F&C Commercial Property
Trust Limited)

ENVIRONMENTAL, SOCIAL AND
GOVERNANCE REPORT 2019

Common acronyms                                                                      4
               Foreword from the Chairman                                                           5
               1. About this ESG report                                                             6
               2. About the Company                                                                 7
                 • Management                                                                       7
               		 - Key to terms used in this report                                                7
                 • Portfolio                                                                        8
               3. ESG strategy and priorities                                                       9
                 • Developing our ESG strategy                                                      9
               		 - The BMO Real Estate Partners approach to responsible property investment        9
                 • Progress against our ESG commitments                                            10

    Contents   Spotlight on Ness & Nevis Houses 11-12 Lochside Place, Edinburgh
               4. ESG performance data for 2019
                                                                                                   14
                                                                                                   15
                 • Environmental                                                                   15
               		 - Energy                                                                         15
               		 - Emissions                                                                      16
               		 - Water                                                                          16
               		 - Waste                                                                          16
                 • Social                                                                          18
               		 - Scope                                                                          18
               		 - Gender equality                                                                18
               		 - Health & Safety                                                                18
               		 - Community engagement                                                           18
                 • Governance                                                                      18

2                                                                BMO Commercial Property Trust Limited
5. ESG risk profile                                                20
                     • Asset classifications                                         20
                     • Flood risk                                                    21
                  Spotlight on 17a Curzon Street, London                             23
                     • EPC ratings                                                   24
                     • Other RPI risk metrics                                        27
                  		 - Current contamination risk                                    27
                  		 - HCFC coolants                                                 27
                  		 - Groundwater source protection zones                           29
                  		 - Statutory wildlife designations                               29
                  		 - Building manager ESG training                                 29
                  		 - Green building certification                                  29
                  		 - Building user guides                                          29
                  		 - Environmental management system                               29
                  Appendix 1: EPRA sBPR performance data to 31 December 2019         30
                  Appendix 2: Notes on environmental data                            38
                  Appendix 3: TCFD Disclosures                                       43
                  Appendix 4: Independent Assurance in accordance with ISO 14064-3   47

BCPT ESG Report                                                                           3
Common acronyms

    BCPT      BMO Commercial Property Trust                        GAV       Gross Asset Value
    BMO REP BMO Real Estate Partners                               GRI       Global Reporting Initiative
    BREEAM    Building Research Establishment Environmental        MEES      Minimum Energy Efficiency Standards, as enforced
              Assessment Method                                              by The Energy Efficiency (Private Rented Property)
                                                                             (England and Wales) Regulations 2015 (Principal
    CDP       Carbon Disclosure Project
                                                                             Regulations) as amended by The Energy Efficiency
    DEFRA     Department for Environment, Food and Rural Affairs             (Private Rented Property) (England and Wales)
                                                                             (Amendment) Regulations 2016.
    EPC       Energy Performance Certificate
                                                                   NLA       Net lettable area
    EPRA      European Public Real Estate Association
                                                                   RPI       Responsible Property Investment
    ESG       Environment, Social, Governance
                                                                   sBPR      Sustainability Best Practices Recommendations
    FCCPH     F&C Commercial Property Holdings Limited
              (a subsidiary of BCPT)                               SCP       SCP Estate Limited (the holding entity for St
                                                                             Christopher’s Place Estate and subsidiary of BCPT)
    FRI       Full repairing and insuring (lease type)

    Corporate information

    Directors (all non-executive)                                  Alternative Investment Fund Manager (‘AIFM’)
    Martin Moore (Chairman)                                        and Investment Manager
    Trudi Clark                                                    BMO Investment Business Limited
    John Wythe                                                     6th Floor Quartermile 4
    Paul Marcuse                                                   7a Nightingale Way
    Linda Wilding (appointed 3 June 2019)                          Edinburgh EH3 9EG

                                                                   Tel: 0207 628 8000
    Secretary
    Northern Trust International Fund Administration
                                                                   Property Managers
    Services (Guernsey) Limited
                                                                   BMO REP Asset Management plc
    PO Box 255
                                                                   7 Seymour Street
    Trafalgar Court
                                                                   London W1H 7JW
    Les Banques
    St. Peter Port
                                                                   Registered Office
    Guernsey
                                                                   PO Box 255
    Channel Islands GY1 3QL
                                                                   Trafalgar Court
    Tel: 01481 745001                                              Les Banques
                                                                   St. Peter Port
                                                                   Guernsey
                                                                   Channel Islands GY1 3QL

                                                                   Tel: 01481 745001

4                                                                                                BMO Commercial Property Trust Limited
Foreword from the Chairman
Welcome to our latest Environmental, Social & Governance (ESG) Report for BMO Commercial
Property Trust which covers the 2019 financial period, and provides continuing insight into the
Company’s sustainability ambitions, processes and performance.

                                    The integration of Environmental, Social and Governance (ESG)
                                    matters remains a core feature of the Company’s property investment
                                    activities. We recognise that investors are becoming more ethically
                                    and environmentally conscious, and that they take a far more
                                    holistic approach to their investments. Purpose and social value are
                                    characteristics that are being increasingly considered, as are the
                                    strengths of an entity’s governance processes. Moreover, national
                                    environmental targets and legislation are pushing the boundaries
                                    making the integration of such matters a business imperative.
                                    We therefore take our ESG responsibilities very seriously. Our
                                    continuing attendance to such matters remains constant. Together
                                    with our Property Manager, BMO Real Estate Partners, we are clear
                                    that proper attention to material ESG factors is consistent with our
                                    fiduciary obligations, and we recognise the material impact these
                                    factors can have on protecting the Company’s assets from depreciation
                                    and on enhancing portfolio value.
                                    I am delighted with the progress the Company has continued to
                                    make in advancing its ESG strategy and I’m particularly pleased
                                    to see this progress realised in the form of improved standings
                                    in a number of key industry indicators. The Company is well positioned
                                    to further its efforts in this continually evolving area.
                                    The details of our progress are presented in this Report. We trust
                                    they are found to be informative and transparent. My fellow Board
                                    members and I would be very pleased to discuss our approach and
                                    performance with any of our key stakeholders and we look forward
                                    to receiving further feedback.

                                    Martin Moore Chairman

BCPT ESG Report                                                                                              5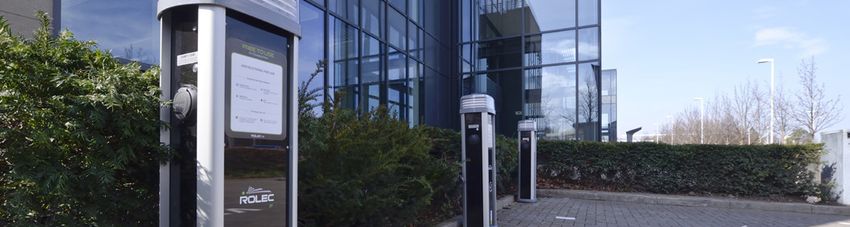
1. About this ESG report

    This ESG Report:
    • Describes the Company’s Environment, Social & Governance       The ESG data section, and corresponding appendices, are
      (ESG) strategy and related priorities, including the process   written in accordance with the latest European Public Real
      for determining these and the progress against them so far.    Estate Association’s (EPRA) sustainability Best Practices
                                                                     Recommendations (sBPR), which in turn are aligned principally
    • Presents key ESG performance data for the reporting year,
                                                                     with the Global Reporting Initiative (GRI) standards.
      as well as our targets for future performance.
                                                                     This ESG Report has been prepared on behalf of the Company
    • Provides an overview of key ESG risks facing the property
                                                                     by BMO Real Estate Partners Asset Management plc, working
      portfolio and outlines our approach to managing these.
                                                                     closely with our strategic advisor on responsible investment
    This Report is being published alongside the 2019 Annual         matters, Hillbreak. Any reference to “we”, “us”, “the Company”
    Report & Accounts of the Company. The description of progress    and “our” throughout the report refers to BMO Commercial
    against the ESG commitments of the Company in Section 3          Property Trust (BCPT). BMO Real Estate Partners Asset
    together with the ESG performance data set out in Section 4      Management plc is referred to throughout as BMO REP or
    are presented as information in parallel with the 2019 Annual    ‘the Property Manager’.
    and Consolidated Accounts of BMO Commercial Property
    Trust Limited.

6                                                                                                  BMO Commercial Property Trust Limited
2. About the Company

                            Objective                                                  The Company

    The investment objective of BMO Commercial Property           BMO Commercial Property Trust Limited is an Authorised
    Trust Limited is to provide ordinary shareholders with an     Closed-Ended Guernsey incorporated investment company.
    attractive level of income together with the potential for    Its shares have a premium listing on the Official List of the
    capital and income growth from investing in a diversified     UK Listing Authority and are traded on the Main Market of
    UK commercial property portfolio.                             the London Stock Exchange. Stock Code: BCPT.

Management
The BCPT Board has appointed BMO Investment Business             Key to terms used in this report
Limited (BIBL) as the Company’s investment managers and
BMO Real Estate Partners Asset Management plc (BMO REP)          The Company: BMO Commercial Property Trust Limited (BCPT)
as the Company’s property managers. BIBL and BMO REP
                                                                 The Property Managers: BMO Real Estate Partners Asset
are both part of the BMO Asset Management (Holdings) PLC
                                                                 Management plc (BMO REP)
(BAMH). BAMH is owned by Bank of Montreal (BMO) and is
part of the BMO Global Asset Management group                    The Investment Managers: BMO Investment Business
of companies.                                                    Limited (BIBL)
BMO Global Asset Management is a founding signatory of
the United Nations Principles for Responsible Investment
(UN PRI), and is committed to exercising responsible
investment practices throughout the BMO Global Asset
Management group, including through BMO REP. This is
reflected in the high ratings it achieved for its UN PRI
Transparency Report, including an A+ rating for Strategy &
Governance.
The approach to ESG, which is described in more detail in
the following section of this Report, is reflective of these
arrangements, whereby:
• The Board of Directors has engaged closely with BMO REP,
  with the support of specialist consultant, Hillbreak, to
  satisfy itself that the approach to integrating ESG factors
  into the investment and property management process is
  rigorous and appropriate to the investment strategy of the
  Company; and
• The Board of Directors has determined a suite of ESG
  pillars, commitments and targets that are bespoke to the
  Company and its portfolio of property assets.

BCPT RPI Report                                                                                                                   7
Portfolio
BCPT is an investment trust for investors who wish to gain Measured by number of assets, just under three quarters of the
exposure to prime UK commercial property. As at the 31st portfolio is directly managed, meaning that there is a degree
December 2019, the BCPT property portfolio had a total value of landlord control in most assets. The extent of the landlord
of £1,342,610,255. services provided varies and this has a bearing on the extent
to which our Property Manager is able to influence or control
The portfolio is comprised predominantly of the mixed-use
certain activities, such as waste management, for example.
St Christopher’s Place leisure destination, a number retail
More tellingly, when measured by total floor area, directly
assets (both high street and warehouse), offices and industrial
managed properties account for less than a third of the portfolio.
premises (both logistics and light manufacturing), along with
This means that, as landlord, and when measured by the most
one student housing asset. St Christopher’s Place includes
meaningful intensity metric for key environmental performance
several residential properties, although is mainly comprised of
measures such as energy consumption and greenhouse gas
retail and office uses. This report aligns with the Annual Report
emissions, we have no direct control over the way in which the
& Consolidated Accounts in reporting St Christopher’s Place
majority of the portfolio is managed.
assets within the high street retail category.
The assets of the Company are held by a number of subsidiary
The portfolio is dominated by core assets, which we hold
companies, the results of which are consolidated within the
for the long-term. More than 80% of the portfolio has an
Group financial statements (separately published). Similarly, this
anticipated hold period (the amount of time an asset is held by
ESG Report relates to the consolidated portfolio for the Company
an investment owner before being sold) of five years or more,
as a whole. However, much of the environmental performance
with over 50% likely to be held for over 10 years. This means
data within Section 4, particularly those relating to utilities and
that the integration of ESG factors into our asset management
related greenhouse gas emissions, are limited to those assets
activities is concerned primarily with the safeguarding of
on which we have operational control. As such, these exclude all
rental income and the preservation of strong, long-term capital
the assets held by Prime Four Limited, Winchester Burma Limited
values. With expectations in the commercial real estate market
and Leonardo Crawley Limited, and some of those held by SCP
evolving in relation to ESG factors (from investors, lenders,
Estate Limited and F&C Commercial Property Holdings Limited.
occupiers and regulators, for example), we need to ensure that
This is explained in more detail in Appendix 1.
the assets we buy and hold are resilient and capable of being
adapted in response to changing demands.
Figure 1: Portfolio composition
Percentage of portfolio capital value Property type (number of assets)
Office Office
2
8.11 Retail – High Street Retail – High Street
12
Retail Warehouse 15 Retail Warehouse
17.62 Industrial Industrial
37.71
5
Alternatives Alternatives
12.33
41
24.23
Management status (absolute) Management status (percentage)
Capital Value Number of Capital Value Assets NLA
NLA (sq ft)
(£) Assets % % %
Directly managed 855,100,000 54 1,361,849 Directly managed 63.69% 72.00% 31.67%
Indirectly managed 497,510,255 21 2,938,299 Indirectly managed 36.31% 28.00% 68.33%
8 BMO Commercial Property Trust Limited3. ESG strategy and priorities
Developing our ESG strategy
In 2019, the Company continued to focus on the effective implementation of its ESG strategy, established in 2017.
A full explanation of this strategy can be referenced in last year’s report summarised by the four key pillars below.
1 Leadership & effectiveness – demonstration of effective governance in relation to ESG criteria.
2 Investment process – procedures to ensure material ESG factors are central to investment
decision-making.
3 Portfolio – continual monitoring, analysis, attendance to and optimisation of material ESG
performance and risk factors.
4 Transparency – comprehensive reporting on relevant ESG factors.
The BMO Real Estate Partners approach to Responsible Property Investment
As Property Managers for BCPT, the BMO REP approach to • Applying the ESG framework across all core business
ESG issues was used as the foundation for the development functions, supporting full integration, including by its
of BCPT’s own Strategy. professional staff having a clear understanding of the
interactions between different business functions on
The BMO REP ESG approach was developed in response to
relevant ESG matters.
a recognition of the increasing level of risk presented to
financial markets and real estate assets by ESG issues, such • Routinely considering and integrating ESG factors
as climate change, and the growing interest and attention within regular asset business planning activities.
paid to ESG issues by investors, occupiers and governments
• Implementing ESG interventions in a co-ordinated manner.
– including through evolving regulatory frameworks.
The BMO REP ESG Committee – with reference to the
BMO REP applies a consistent approach to integrating
BMO Global Asset Management Responsible Investment
ESG matters into fund management, asset management,
Team and its reference to the BMO GAM Responsible
property management, and development, with a particular
Investment Advisory Council – monitors and reviews the
emphasis on:
ESG approach and performance.
• Having a clear understanding of the material issues and
Further information on the BMO REP approach to Responsible
priorities for commercial real estate presented by the
Property Investment can be found here:
evolving ESG landscape.
• Identifying and responding to the investment risks and
https://www.bmorep.com/wp-content/uploads/2018/10/
value enhancing opportunities presented by ESG criteria.
cm16109-bmo-rep-responsible-property-investment.pdf
• Setting asset-specific targets within an overall context
of fund policy, direction and vision.
BCPT ESG Report 9Progress against our ESG commitments
The BCPT commitments and targets set out below Our progress against these pillars to the end of December
address each of the four pillars of our ESG approach. 2019 is described, along with an explanation of notable
outcomes, in later sections of this ESG Report.
These commitments and targets were originally set out in
2017. Some have required immediate action, many impose The Company will continue to drive ahead with its ESG
ongoing requirements, whilst others set a longer-term strategy during the remainder of 2020 and beyond, and
direction of travel and remain as forward actions. will provide shareholders with regular updates of progress.
ESG commitment Status Review of progress
Leadership & effectiveness – measures through which BCPT will demonstrate effective governance in relation to ESG criteria.
Meet the Hampton-Alexander The Hampton-Alexander recommendations have been met. The Board now
recommendation of having at least 33% comprises five members with 40% female representation.
female representation on our Board
by 2020.
Participate in the Global Real Estate We submitted to the 2019 GRESB survey and achieved a score of 68 out of 100.
Sustainability Benchmark (GRESB) from This resulted in a two green star rating and placed us fourth in our peer group
2018, with the objective thereafter of of nine diversified UK participants.
realising year-on-year improvements in
The 21 point improvement represents a 44.7% increase over the previous year’s
score and peer group ranking.
score. This is a significant increase, reflecting to some degree some earlier
measures coming to fruition. This provides a solid platform from which to
continue making more modest year-on-year improvements.
Fulfilled (including those that are ongoing) In progress and on track ! Not on track or at risk Not achieved
10 BMO Commercial Property Trust LimitedESG commitment Status Review of progress
Investment process – procedures through which BCPT integrates ESG into the investment process.
Confirm classification of all assets within the manager’s Following the completion of the asset classification process
Asset Classification System by procuring EPC assessments in 2017, we have continued to keep records up-to-date and
for those assets for which an EPC is not in place. Implement under review. Some assets have been reclassified as a result
routine of Asset & Property Management actions according with 23 now falling into upper (higher materiality) tier of the
to the classification of each asset and the manager’s classification system (2018: 29). The number of assets in the
corresponding RPI Requirements for Asset Managers and second tier has increased to 28 (2018: 27), whilst those in
Property Managers. the lower tier have increased to 24 (2018: 21). These changes
are principally as a result of disposal of some higher energy
consuming assets in early 2019.
One of the driving criteria in the Asset Classification System
is the EPC rating of the properties. The distribution of EPC
ratings relative to income value and floor area has remained
fairly consistent with 2018.
This is an ongoing commitment which has been fulfilled
for 2019.
Where assets have been classified, undertake RPI Appraisals RPI Appraisals have been reviewed and updated for all
of all Tier 1 assets by end of 2017, Tier 2 assets by end of Q2 properties in 2019, with a continued focus on the ESG factors
2018 and Tier 3 assets by end of Q4 2018. Asset Business that are considered material to investment performance,
Plans to be updated to reflect the findings of the RPI either because they could suppress rental growth and/or
Appraisals. Appraisals to be kept updated on an annual basis. capital appreciation during the hold period, or because they
might impact on future liquidity and the realisation of value
at the point of exit.
The effect of these updated RPI Appraisals on the profile of
ESG characteristics are presented in this 2019 Responsible
Property Investment Report.
Undertake RPI Appraisals on 100% of new acquisitions prior The Company made no new acquisitions in the reporting year.
to transaction closure, with investment critical findings
reported to the Property Investment Committee and relevant
findings and improvement recommendations incorporated
into the Asset Business Plan.
BCPT ESG Report 11ESG commitment Status Review of progress
Portfolio – attendance to material ESG performance and risk factors across the portfolio.
Using aggregated data from asset level RPI Appraisals, This 2019 ESG Report presents data and information as per
prepare an annual report to shareholders on the exposure the previous years’ Responsible Property Investment Reports.
of the portfolio to key ESG risks including those pertaining
The Company will continue to present annual ESG Reports
to energy (including MEES), water, waste, flooding
and will look to publish these alongside the Annual Reports,
contamination, accessibility and building certification.
subject to the availability of Q4 utility data becoming
available and the time frame required to have select non-
financial data independently assured.
Establish year-on-year intensity-based energy, carbon, water Early in 2018, we set asset-specific energy reduction targets
and waste reduction targets for landlord services against an for the portfolio and these were confirmed in the 2018
appropriate baseline. Interim Report, together with our annual water use reduction
target of 1% for directly managed assets. Since then, we
have improved our data collection processes for waste, and
have set a target for eliminating landlord-managed waste to
landfill by the end of 2020.
Eliminate landlord-controlled waste being directed to landfill Ahead of the Company’s target of zero waste to landfill by the
to any extent by the end of 2020. end of 2020, all waste under landlord control collected from
sites from August 2019 was successfully diverted from landfill.
Reduce water consumption in directly managed assets by 2019 water consumption across the fund increased by
1.0% year on year on a like for like basis. 20% on a like for like basis. A significant proportion of this
increase was attributed to Cathedral Square in Bristol where
tenant’s occupational densities continued to increase. Higher
consumption was also notable at a number of residential
apartments at St Christopher’s Place also reflecting
increasing occupation. The volumes of water usage for which
the landlord has direct control is relatively small such that
marginal variances will have a notable impact on percentage
fluctuations.
Set a long-term (2030 or beyond) target for energy (and Our long-term target of reducing the energy intensity of the
carbon) reduction according to a recognised science-based portfolio was confirmed in the 2018 Interim Report. This new
targets methodology. target, identified separately below, has been developed in
line with the Sectoral Decarbonisation Approach, with the
advice of energy and carbon management specialist, Verco
Advisory Services. We have produced an investor briefing
note that confirms our approach is in line with recognised
science-based methodologies.
Reduce the energy intensity of the portfolio by 20% Energy intensity reduction in the BCPT portfolio since 2016
per square meter by 2031, against a 2016 baseline, for was 31% on an absolute basis, or 9% on a like-for-like basis.
landlord-procured energy.
Establish a basis for measuring occupier wellbeing and We undertook a pilot occupier satisfaction survey with the
satisfaction across the portfolio and set targets by 2020 for support of customer experience consultancy, Real Service. The
improved performance in this regard. outcomes of the pilot were broadly positive with local manager
responsiveness being a notable success, but with attention
to wider communication channels being the principal area for
improvement. A Net Promoter Score of -8.6 was determined
from the small sample size taken and provides a baseline
against which to measure improvement. The indicator provides
a reflection of the likelihood that our occupiers will recommend
the Company as a landlord and compares well against Real
Service’s benchmark score of -5.5 for a blended portfolio
covering retail, office and industrial assets.
12 BMO Commercial Property Trust LimitedESG commitment Status Review of progress
Have in place 100% renewable electricity supplies for all We renewed landlord electricity supply contracts in October
landlord procured power by the end of 2018. 2019 for the vast majority of the portfolio, resulting in >98% of
supplies by consumption being from certified renewable energy
sources. There remains a small number of supply contracts at
St Christopher’s Place, procured by a third-party intermediary,
which have yet to be renewed and which account for ~1.8% of
all supplies by consumption for the portfolio. These were not
captured in the contract renewal due to the cost of early break
penalties, but the Company continues to establish the optimum
time to renew such contracts and we will continue to provide
updates on status going forward.
Prohibit new lease contracts with organisations connected We continue to monitor our tenant mix as part of our
to the production, storage, distribution or use of Controversial commitment to minimising our leasing exposure to
Weapons. Monitor the tenant mix of the Company on a organisations connected to the production, storage,
regular basis and exercise discretion when considering distribution or use of Controversial Weapons. 0% (zero
leasing to organisations involved in other controversial percent) of rental income was attributed to organisations
activities and engage regularly with investors on their that appear on the exclusions list managed by BMO Global
expectations in this regard. Asset Management for the duration of 2019.
Transparency – approach to investor reporting and public disclosure on relevant ESG factors.
Submit the Minimum tier questionnaire of the CDP General The Property Manager completed the minimum tier of the
Climate module in 2019 and the Full tier from 2020 onwards, CDP General Climate module in 2018, and followed this with
whilst investigating the potential to submit across the Water submission to the full tier in 2019. A rating of C was achieved,
and Supply Chain modules. indicating a knowledge of the impacts of climate related
issues. This result is comparable to the average performance
of Europe and within the financial services activity group.
From 2020 onwards the fund will be classified within the REIT
sub-category of the financial services group, which will be
available from this year’s submission.
Align Non-Financial Reporting to the 3rd Edition of the EPRA This 2019 Responsible Investment Report and the disclosures
Sustainability Best Practice Recommendations. Include a within it are aligned with the 3rd Edition of the EPRA
summary of performance measures in the 2019 Annual Sustainability Best Practice Recommendations. Furthermore
Report, linked to full ESG disclosure on the BCPT website. the absolute energy and emissions data was subject to
independent assurance by Lucideon in accordance with
ISO 14064-3.
Produce in the 2018 Annual Report a ‘routemap’ towards We have continued to advance our approach to addressing
financial reporting in line with the recommendations of the climate risk across our portfolio and through our investment
Financial Stability Board (FSB) Task Force on Climate-Related processes during 2019.
Financial Disclosures (TCFD).
Disclosures aligned to the TCFD recommendations are set
out in Appendix 3 of this Report, along with a statement of
intended actions for 2020 and beyond which are intended to
further develop the precision of our analysis of, and response
to, climate risks and opportunities.
Provide six-monthly dashboard and commentary updates to Our 2017 Responsible Property Investment Report established
shareholders on key ESG attributes for the portfolio. a baseline against which we will report to shareholders on
the evolving profile of ESG characteristics that will occur
as a result of portfolio churn, management action and
changing external circumstances. This ESG Report provides
shareholders with an update across the full range of ESG
metrics. Thereafter, a summary of notable changes will
be presented to shareholders alongside the 2020 Interim
Report.
BCPT ESG Report 13Spotlight on
Ness & Nevis Houses
11-12 Lochside Place,
Edinburgh
A multi-million pound shell and core plus refurbishment of a
1990’s office building extending to circa 44,000 square feet of net
lettable area formed over three levels.
Background design New showers added to each floor of the building’s two
cores to help encourage and facilitate physical activity
On expiry of the previous tenant’s lease, terms were agreed
amongst occupants, including accessible facilities and
with Diageo for them to relocate their Headquarters under a new
locker storage.
16-year lease of the building. A key priority was to investigate
a range of measures to optimise the energy efficiency of the Water saving devices such as flow controls to showers
building as well as enhance occupier health, wellbeing and and dual flush toilets have been fitted in the communal
overall user experience. Key interventions included the toilets.
installation of highly efficient building services, thermal upgrades
Four electric vehicle charging stations have been
and maximising natural light.
installed adjacent to the building entrance.
The project included replacement of the roof cladding, provision
Car park lighting has been upgraded to include highly
of new curtain walling, new entrance annexes and the
efficient LED lighting and associated controls.
replacement of the mechanical and electrical services, two
new lifts and new raised access floors within the office areas. Future proofing
The following key features were realised:
Sustainability and wellbeing
The mechanical and electrical infrastructure has been
Sustainability and wellbeing aspects were central design
designed to maximise the flexibility of the development’s
considerations during the shell and core and refurbishment stages
internal space.
of the project. Key features included:
The electrical distribution is also designed to allow
Introduction of high levels of fresh air to increase amount of
floor by floor metering in the event of operation as
natural ventilation, delivered through new roof-mounted air
two individual buildings.
handling units and new ventilation ductwork throughout the
scheme; critical to providing suitable environments from The mains electrical infrastructure, ventilation and
which to support the health and wellbeing of occupiers. heating and cooling systems have been designed to
allow the building to be occupied as two separate
Roof-mounted photovoltaic panels feeding renewable
buildings if required in the future.
electricity to the building’s electrical infrastructure.
Tenant service duct risers within each of the two
Heat recovery within the air handling units together with a
cores connect to dedicated tenant roof plant spaces
system of air source heat pumps providing heating and cooling
at roof level.
each contributing to the building’s high energy efficiency rating.
The refurbishment of the building, complete with its new
The building’s energy efficiency rating has improved significantly
high-quality facades has not only dramatically improved
as evidenced by the change in Energy Performance Certificate
the appearance of the building, but it has also brought
rating from the original E to B+, whilst the BREEAM Very Good
much needed regeneration to Edinburgh Park whilst
rating underlines the scheme’s sustainability credentials.
securing a high-profile tenant.
14 BMO Commercial Property Trust Limited4. ESG performance data for 2019
A high-level summary of ESG performance for the period These intensities compare well against industry benchmarks.
ending 31 December 2019 is provided below. A more The UK Green Buildings Council, for example, published a
detailed analysis of the data is included in Appendix 1 and table of suggested interim targets towards a 2035-2050
is presented in accordance with the European Public Real energy intensity aligned with the UNFCCC Paris agreement.
Estate Association’s (EPRA) sustainability Best Practice Its suggested target intensity for 2020-2025 was 90 kWhe/m²
Recommendations (sBPR). NLA for base building. Where the landlord procures energy
for base building the energy intensity is below this value
Environmental
and progressing towards the next interim target. For whole
Scope building consumption, the Company will be engaging and
collaborating with occupiers to reduce the energy intensity
The Company had an overall investment in real estate of
in line with current scientific understanding.
£1.342 billion as at 31 December 2019. Whilst approximately
two thirds of this capital value is considered to be in directly During the reporting year both gas and electricity consumption
managed property, the extent of landlord operational control in the managed portfolio increased on a like-for-like basis,
varies significantly, impacting on the extent of data that can be however, absolute energy and energy intensity reductions
established. The Company intends to expand on data coverage were observed. The following changes in the year led to the
to include increasing coverage of occupier data in future years. like-for-like increase:
The extent of data coverage this year is detailed in Appendix 1.
• Up to October 2018 the offices at Cathedral Square in Bristol
Energy had not reached full occupation which meant lower energy
requirements in 2018 compared to 2019;
Since October 2018 the Company has purchased renewable
electricity for all properties where the landlord is responsible • From July 2019 the occupier at Alhambra House in Glasgow
for energy procurement, with the exception of residential units requested longer plant run times to maintain a cool office
at St Christopher’s Place, where an external managing agent environment for those working later into the evening during
procures some but not all electricity from renewable tariffs. a hot summer. The second and fourth quarters of 2019
also saw higher demand on the building heating system
The Property Manager continues to engage the services of
compared to the previous year equivalents due to a higher
Carbon Intelligence (formerly Carbon Credentials), a third-
number of heating degree days; and
party environmental data services provider, to collect energy
data on those assets in the fund where there is a permanent • Two vacant floors at the multi-let offices on Birchin Lane in
landlord-controlled energy supply. The figures presented below London became occupied from mid-2019, creating a higher
show the outcome of BMO REP’s analysis of this data, and demand on electricity requirements.
include properties for which there has been some landlord
responsibility during the reporting period from transient
supplies, typically those associated with vacant premises.
Absolute energy figures were independently verified by
Lucideon, for which the Verification Statement can be found
in Appendix 4.
Table 1: Summary of energy data
Current year 2019 Prior year 2018 % change
Like-for-like electricity usage (kWh) 4,459,669 4,018,441 11%
Like-for-like natural gas usage (kWh) 3,273,299 2,797,936 17%
Energy intensity (kWhe/m²) 76.1 86.2 -12%
BCPT RPI Report 15Emissions
Whilst the Company has committed to procuring 100% of The greenhouse gas (GHG) emissions are reported here as
landlord electricity supplies from renewable sources (that is, kilograms of carbon dioxide equivalent (kg CO2e). The following
not derived from greenhouse-gas-emitting fossil fuels), it was table reports on:
considered more appropriate, for better comparison purposes,
• S cope 1 emissions – resulting from the burning of natural gas
to adopt location-based conversion factors provided by the UK
in a boiler on-site
Government to calculate the respective emissions as opposed
to market-based, which would take into account this purchase • S cope 2 emissions – resulting from the procurement and use
of renewable energy. of electricity from the National Grid
Table 2: Summary of emissions data
Current year 2019 Prior year 2018
Total carbon emissions (kg CO₂e) 2,133,908 2,516,176
Emissions intensity for Scope 1 and 2 (kg CO₂e/m²) 23.2 27.9
Water
The following table reports on water consumption and
intensity, and covers the limited extent of landlord control
within the portfolio.
Table 3: Summary of water data
Current year 2019 Prior year 2018
Like-for-like water usage (m )
3
26,561 22,160
Water intensity (m3/m2) 0.7 0.5
The increase in like-for-like water consumption can be attributed the offices in Cathedral Square in Bristol where full occupation
to 82 King Street in Manchester, Alhambra House in Glasgow and was established from October 2018.
Waste
The Property Manager began collecting detailed waste data following table in terms of proportion recycled, incinerated for
in 2018. Waste produced in properties under the landlord’s energy and sent to landfill.
responsibility for two consecutive years is reported in the
Table 4: Summary of waste data
Current year 2019 Prior year 2018
Like-for-like waste by Recycling 7% 7%
disposal route
Materials Recycling Facility (MRF) 55% 52%
Incineration with energy recovery 37% 40%
Landfill (see comment below) 0% 0%
Ahead of the Company’s target of zero waste to landfill by the At present, all properties which generate waste streams under
end of 2020, all waste under landlord control collected from the landlord’s jurisdiction are controlled through site management
sites since August 2019 was successfully diverted from landfill. procedures which are aligned to ISO14001 standards. This
The Company seeks to maintain this standard going forward accreditation ensures proper management and removal of both
through close engagement with waste carriers. hazardous and non-hazardous waste from site.
16 BMO Commercial Property Trust LimitedkWh
kWhe/m2
2018 5,886,362
0
20
40
60
80
100
2019 5,325,904
Elec-Abs
BCPT ESG Report
Energy Intensity
2018 0.575
86 2018 4,018,441
4,459,669
Energy Consumption
2019
Elec-LfL
Energy-Int
2019 0.704
76
2018 4,620,156
2019 4,202,375
Fuel-Abs
2018 2,797,936
2019 3,273,299
Fuel-LfL
0.575
86
kgCO2e/m2 0.704
83
kgCO2e
0
5
10
15
20
25
30
Figure 2: Absolute and like-for-like portfolio trends
2018 849,924
GHG Intensity
0.575
GHG Emissions
2018 28
2019 772,607
GHG-Dir-Abs
GHG-Int
2019 0.704
23
2018 1,666,252
2019 1,361,301
GHG-Indir-Abs
0.575
86
3 2
m /m m3
0.704
83
0.0
0.1
0.2
0.3
0.4
0.5
0.6
0.7
0.8
2018 22,016
Water Intensity
2018 0.575
0.53 2019 28,681
Water-Abs
Water Consumption
Water-Int
2019 0.704
0.69
2018 22,160
26,561
Water-LfL
2019
0.575
17
86Social
Scope Community engagement
Through its Property Manager, the Company takes a Much of the Property Manager’s supply chain management is
responsible approach to corporate citizenship, both through delivered through the properties’ ISO 14001 accreditation (see
engagement with industry and corporate stakeholders, page 29). This is applicable to all managed assets. Property
and through the positive impact it seeks to generate in the managers at these sites are given the responsibility to select
communities around its managed assets. and manage contractors servicing the sites. They follow the
BMO REP supply chain strategy to hire locally and ensure all
The Company has no direct employees, however, a number
Health and Safety and ISO 14001 standards are adopted.
of Building Managers are employed directly by BMO REP and
are required to achieve a minimum 50 hours of Continuing Where the Company has an opportunity to do so, it organises
Professional Development (CPD) each year. community engagement initiatives at its directly managed
properties. Details of these can be found in Appendix 1
Gender equality
and on the next page (page 19).
The Company has no direct employees, and therefore the table
disclosing gender equality data (Table 6, Appendix 1) pertains
Governance
solely to the Company’s board.
The Property Manager has a strong governance structure that
Health & Safety
ensure its activities are undertaken in the best interests of
The Property Manager ensures that all legislative requirements the Company. Its robust operating procedures and policies
connected with maintaining safety and security at premises ensure the risks associated with illegal practices such as
are met where it has operational control. This includes, but is bribery and corruption are in line with local legislation and
not necessarily restricted to, undertaking regular reviews of expectation. The Property Manager’s parent organisations,
Health and Safety status and performance, undertaking fire BMO Global Asset Management and the Bank of Montreal,
risk assessments, and maintaining robust procedures for the provide detailed oversight of the arrangements, which
control of water hygiene. includes the requirement for mandatory annual training and
declaration for all employees. More detailed explanations
of governance structures can be found in the Annual Report
and Accounts.
18 BMO Commercial Property Trust LimitedCommunity & supply chain engagement at St. Christopher’s Place
St Christopher’s Place Estate (SCP), with its charming In 2019 SCP has continued to liaise with Westminster
collection of shops and restaurants set back from London’s Council on solutions to rough sleeping in the West End.
Oxford Street, continues to inspire its management team to This included supporting the Council to raise awareness
build a more socially impactful destination. on World Homelessness Day with a marquee in the main
square of the estate.
In the last year, SCP has guaranteed all cleaning and security
staff are paid the London Real Living Wage. For cleaning SCP has also partnered with the New West End Company
staff, this came as part of a new contract tender, with the and AccessAble® to bring SCP into the online sphere
successful company being selected for their environmentally of destinations that are accessible to everyone. The
and socially conscious agenda that includes use of AccessAble® webpage and app allow those with disabilities
environmentally friendly cleaning products and electric to find places, including shops and restaurants, that
vehicles, and an English learning programme for employees are accessible for them. In 2019, 12 audits took place at
for whom it is not a first language. premises within SCP to approve them as accessible places
that people can now find through the AccessAble® platform.
BCPT ESG Report 195. ESG risk profile
The ESG Risk Profile described in this section presents key Figure 3: Asset classification
data collated by BMO REP as part of its ongoing process of
Capital value (£) 2018 v 2019
appraising all held assets using its RPI Appraisal system. It
provides a picture of the key ESG characteristics of the BCPT 800
portfolio at 31 December 2019 with respect to issues such as
700 2018
environmental management, flood risk, energy performance
and contamination. 2019
600
Asset classifications 500
We have devised a classification system that enables resources 400
to be directed at those assets for which the risks and potential
enhancement opportunities are likely to be greatest. 300
681,836,556
327,679,657
448,717,498
294,194,251
454,159,193
556,213,101
Importantly, the classification of an asset determines the 200
frequency and extent to which its ESG characteristics and
0.704
0.575
100
performance are monitored within the asset and property
management process. For example, the relevant Asset 0
Manager should review Property Manager reports on
environmental performance against targets, as well as Level 1 Level 2 Level 3
progress against Asset Action Plans, for Level 1 assets on a
quarterly basis. For Level 2 assets, the frequency of the review Number of Assets 2018 vs 2019
is reduced to six months, whereas for Level 3 assets, where
there is no landlord energy spend, there is no requirement 30
to review consumption on a regular basis. 2018
25
BMO REP has in place clear procedural guidelines to assist 2019
asset and property managers in this regard.
20
The classification of individual assets has changed: firstly
reflecting differences in energy ratings, and secondly reflecting 15
complete landlord energy spend data.
The charts to the right and overleaf show the distribution of 10
asset classifications across the portfolio, with reference to
number of assets, capital value and by property type. 5
0.704
0.575
29
28
24
23
27
21
0
Level 1 Level 2 Level 3
Asset classifications
Level 1 – where EPC rating is F or G and/or annual landlord
energy spend is >£50,000
Level 2 – where EPC rating is E and/or annual landlord energy
spend is between £0 and £50,000
Level 3 – where EPC rating is A+ to D and there is no landlord
energy spend
20 BMO Commercial Property Trust LimitedFigure 3 (continued): Asset classifications by property type
Office Retail – High Street Retail Warehouse Industrial
6 1
6 6 14 2 2
3
21 9
3
Alternatives
Asset classifications
Level 1 – where EPC rating is F or G and/or annual landlord energy spend is >£50,000
2 Level 2 – where EPC rating is A+ to D and there is no landlord energy spend
Level 3 – where EPC rating is E and/or annual landlord energy spend is between £0 and £50,000
Flood risk
The exposure of the portfolio to the principal sources of • Analysis of future changes in flood risk exposure under
flood risk is shown in the Flood Risk Dashboard (figure 4). different climate change scenarios, as described in more
This shows that, taking account of flood defences, the vast detail in Appendix 3.
majority of the portfolio is at negligible or low risk of flooding
• Ensuring that we have adequate insurance cover in place.
from rivers or seas, with just over 5% of capital value at high
risk of flooding from this source. Groundwater flood risk is • In areas of higher risk, maintain a watching brief on insurance
similarly limited, with just over 2% of capital value deemed premiums and planning decisions for development work,
to be at high risk. The higher levels of risk are confined to a including in relation to change of use decisions which may be
small number of office, logistics and retail warehouse assets. pertinent to future asset strategy.
Surface water flood risk is more significant, commensurate • For assets subject to higher levels of direct risk, review asset
with the urban context of the majority of the assets that we files, including purchase reports, to ensure that detailed flood
hold. Nevertheless, over 75% of capital value is found to be risk information is held by the fund.
at negligible or low risk.
• For directly managed assets in areas of high and moderate
Any changes to flood risk ratings, first recorded in 2017, are as indirect risk, prepare operational contingency plans so that
a consequence of updated data sets used to determine this anticipatory and responsive measures can be put in place
risk. For further information on the flood risk methodology, effectively to deal with local disruption, and ensure that
see Appendix 1. tenants are engaged in this process.
The principal elements of our approach to managing flood • Engage with our tenants in those assets that are not directly
risk include: managed but to which higher levels of risk apply, to ensure
that they can be prepared for a possible future flood event.
• Undertaking regular flood risk assessments of all held
assets to keep our overview of portfolio risk exposure • Ensuring that flood resilience is a feature of our approach to
under regular review. sustainable development and refurbishment.
• Undertaking flood risk assessments, including an
assessment of repairing obligations within lease terms,
at the pre-acquisition stage for all assets in which we
consider investing and taking account of any material
issues in investment decisions and subsequent asset
business planning.
BCPT ESG Report 21Figure 4: 2019 Flood risk comparison
Fluvial flood risk Surface water flood risk Groundwater flood risk Historic flooding
Distribution of risk ratings as a Distribution of risk ratings as a Distribution of risk ratings as a Distribution of historic flood
proportion of total Capital Value proportion of total Capital Value proportion of total Capital Value incidents in relation to total
Capital Value
5.17% 11.09% 2.09% 3.97%
3.16% 6.95% 4.82%
4.61% 5.05%
12.67%
59.09% 17.15%
87.06% 85.91% 91.21%
Fluvial flood risk by sector Surface water risk by sector Groundwater risk by sector Historic flooding by sector
Distribution of risk ratings by Distribution of risk ratings by Distribution of risk ratings by Distribution of risk ratings by
number of assets number of assets number of assets number of assets
Legend Legend Legend Legend
Risk of fluvial Level of surface Level of Level of
or storm-surge water flood risk groundwater groundwater
flooding accounting flood risk flood risk
for existing flood Negligible
defences. Negligible No
Low
Negligible Low No record
Moderate
Low Moderate Yes (Unknown
High
High & Main River)
Moderate
33
40
Yes (Main River)
41
41
High
41
15
5
12
12
6
13
13
8
10
5
4
Retail warehouse 1 1 1 2
4
2 11
Retail warehouse 1 4
Retail warehouse 1 4
Retail warehouse 1 4
2 1
Office 1 2
Alternatives 1 1
3
Office 1 1
Office 1 1
2
2
2
Industrial 2
Alternatives 2
Retail – High St 1
Retail – High St
Retail – High St
Alternatives
Industrial
Office
Industrial
Retail – High St
Alternatives
Industrial
Risk definitions Risk definitions Risk definitions
Fluvial & tidal (defended) flood Pluvial (surface water) flood Groundwater flood extent
extents extent • High
• High [>3.3% event] • High [>1% event, where flood • Moderate
• Moderate [between 3.3% & 1%] depths >1m]
• Low [>1% likelihood]
• Low [between 1% and 0.1%] • Moderate [>1% event, where
flood depths between 40cm • Negligible [1% event, where
flood depthsSpotlight on
17a Curzon Street, London
A refurbishment of the common parts and vacant floors
of a compact mid-sixties constructed office building
situated in the heart of London’s West End, conveniently
located within a short distance of Hyde Park Corner and Green
Park underground stations, and extending to circa 11,000 square feet
arranged over basement, ground and six upper floors.
Background design New low-energy LED light fittings have been utilised
throughout the refurbished areas with lighting
The scheme encompassed the full refurbishment of the vacant
efficiencies in excess of 100 lumen/Watt exceeding
first and second floors, the communal entrance reception,
current Building Regulations standards
common circulation areas and basement facilities. The key
objective was to revitalise the building by providing exceptional Automatic lighting controls were added to all areas in
workspace commensurate with a sought-after Mayfair setting. order to minimise energy wastage and ensure appropriate
This has been achieved by employing a palette of classic and lighting levels throughout the course of the day.
sophisticated materials that are subtly carried throughout the
Low water consuming fittings have been adopted within
building. The new materials take inspiration from original features
the newly formed first floor toilet accommodation.
which have been exposed and restored.
The rear flat roof area has been enhanced by relocating
Original walnut parquet flooring has been restored to its former
existing ductwork and external condenser units from
glory and has influenced the bespoke walnut panelling to the
immediate sight lines, and planting the entire area
reception. The new brushed brass to the reception desk and
with sedum, providing a natural outlook from the office
pendant light fittings are mirrored by brushed brass fittings in
and encouraging biodiversity on the site to contribute
the newly created ablutions facilities at first floor level whilst
towards the wellbeing of building occupiers.
new tea-point facilities have been added on each floor. The
existing Crittall windows have been overhauled and refurbished To encourage cycling, the refurbishment included the
throughout and the existing terrazzo basement stair has been provision of new secure bicycle storage, a new bicycle
repaired and restored. repair station and two new shower units with associated
changing facilities located in the basement.
The project also included replacement and upgrading of the
existing heating and cooling systems to the office floors, with One electric vehicle charging point with smart phone
these services being housed into minimal plasterboard bulkheads payment app has also been installed to the basement
wrapped around the core. This strategy enabled the ceiling car park.
heights to the main office spaces to be maximised to increase
the sense of space and natural daylighting. The reliability and Future proofing
efficiency of the existing passenger lift has been improved
The following key features were introduced:
through overhaul and modernisation.
Careful consideration was given to the positioning of
Sustainability and wellbeing air conditioning fan coil units and electrical services to
ensure that future tenants have maximum capability
The design team were challenged to bring forward a scheme
to reconfigure their space to suit their individual needs.
that would not only make the commercial space more appealing
to occupiers, but would take the opportunity to improve the The lighting installation to first and second floor office
building’s sustainability credentials and bring key characteristics suites are arranged through ‘plug in’ control boxes to
into line with modern day standards and expectations: enable simpler alteration or reconfiguration to the space
in future. This principle is expanded with a continuous
The office floors remain naturally ventilated via the large
linear grill being incorporated into the ceiling bulkhead
Crittall windows, but a heat pump system with heat recovery
to facilitate simpler direction of air into partitioned
was also introduced to the first and second floors to provide
spaces to suit a tenant’s current and future operational
highly efficient heating and cooling to these spaces.
layouts.
BCPT ESG Report 23EPC ratings
The dashboard below provides a summary of the profile of When viewed specifically within the context of our properties
Energy Performance Certificate (EPC) ratings for the portfolio. located in England & Wales, the jurisdiction within which
The majority of the whole UK portfolio - from both a rental value regulations pertaining to Minimum Energy Efficiency Standards
and floor area perspective - achieves higher EPC ratings of A (MEES) apply, the proportion of rental value that is associated
to C, indicating a good level of modeled energy performance with F- and G-ratings is marginally higher than the UK-wide
for the portfolio. Indeed, the two lowest ratings F and G apply portfolio, at a little over 9.98%. By number, this is 10%, compared
in combination to only 8.58% of rental value and 4.55% of to an average of just over 14% of commercial EPCs lodged on the
the total lettable floor area respectively. When benchmarked register for England and Wales. The Company is well positioned to
within individual property types, high street retail assets and further its efforts in this continually evolving area and recognises
alternatives have the greatest proportion of income and floor that the MEES regulations are currently the subject of Government
area ascribed to these lower ratings. This is fairly consistent with consultation. Through its Property Manager’s involvement with
the wider market, where retail tenant fit-outs are renowned for the Better Buildings Partnership, the Company will keep the
having a detrimental effect on energy ratings. implications of this consultation under close scrutiny.
Figure 5: 2018 and 2019 profile of EPC ratings
Distribution of EPC ratings by rental value
Assets in England & Wales only
6.56% 4.86% 8.97% 6.24% EPC rating: CO2 emissions
1.58%
2.06%
6.76% A (0-25) E (101-125)
4.52%
B (26-50) F (126-150)
16.44% C (51-75) G (over 150)
24.58%
16.95% 20.03% D (76-100)
38.70% 41.75%
2018 2019
Distribution of EPC ratings by NLA
Assets in England & Wales only
EPC rating: CO2 emissions
0.90% 3.08% 8.07% 0.86% 5.61% 8.76%
9.63% 3.17%
A (0-25) E (101-125)
B (26-50) F (126-150)
C (51-75) G (over 150)
17.84% 15.96% 17.00%
16.67% D (76-100)
43.80% 48.64%
2018 2019
24 BMO Commercial Property Trust LimitedEPC ratings by rental value
Whole portfolio – including assets in Scotland
A B C D E F G Unknown
40.11%
40%
35.15%
35%
29.48%
% of Total CRV
30%
25% 24.37%
20% 17.01%
14.73%
15%
10% 8.28% 7.62%
5.70%
5% 4.23% 5.30% 3.84%
1.38% 1.75% 1.05% 0.00%
0%
2018 2019 2018 2019 2018 2019 2018 2019 2018 2019 2018 2019 2018 2019 2018 2019
EPC ratings by net lettable area
Whole portfolio – including assets in Scotland
A B C D E F G Unknown
50% 47.05%
45% 40.72%
40%
35%
% of NLA
30%
25% 22.60% 23.12%
20%
14.58% 13.85%
15% 10.60%
10% 7.06% 7.61%
4.87%
5% 2.75% 2.69%
0.79% 0.75% 0.97% 0.00%
0%
2018 2019 2018 2019 2018 2019 2018 2019 2018 2019 2018 2019 2018 2019 2018 2019
Over the reporting period, 30 replacement EPCs were obtained. assessment, however some saw a rating deterioration given the
Four of these were successful refurbishments that brought F or inability to undertake physical improvement in the context of
G rated demises at St Christopher’s Place to B or C ratings. The hardening standards. Where new EPCs were obtained after works
majority (20) were replacements of EPCs that expired during the carried out by the Company, the ratings improved, or remained
year, most of which maintained the same rating as the previous the same in the case of three C-rated EPCs.
BCPT ESG Report 25You can also read