2020 Western Australia Gas Statement of Opportunities - December 2020
←
→
Page content transcription
If your browser does not render page correctly, please read the page content below

2020 Western
Australia Gas
Statement of
Opportunities
December 2020
Important notice

PURPOSE
The purpose of this publication is to provide information about the natural gas industry in Western Australia.
AEMO publishes this Western Australia Gas Statement of Opportunities (GSOO) in accordance with rule 103
of the Gas Services Information Rules (GSI Rules). This publication has been prepared by AEMO using data
available at October 2020. Information made available after this date may have been included in this
publication, where practicable.

DISCLAIMER
This document or the information in it may be subsequently updated or amended. This document does not
constitute legal or business advice, and should not be relied on as a substitute for obtaining detailed advice
about the GSI Rules, or any other applicable laws, procedures or policies. AEMO has made every effort to
ensure the quality of the information in this document but cannot guarantee its accuracy or completeness.
Accordingly, to the maximum extent permitted by law, AEMO and its officers, employees and consultants
involved in the preparation of this document:
• make no representation or warranty, express or implied, as to the currency, accuracy, reliability or
  completeness of the information in this document; and
• are not liable (whether by reason of negligence or otherwise) for any statements or representations in this
  document, or any omissions from it, or for any use or reliance on the information in it.

VERSION CONTROL

Version        Release date             Changes

1.0            10/12/2020

© 2020 Australian Energy Market Operator Limited. The material in this publication may be used in
accordance with the copyright permissions on AEMO’s website.
Executive summary

The 2020 Western Australia (WA) Gas Statement of Opportunities (GSOO) presents AEMO’s assessment of
WA’s domestic gas market for the 10-year outlook period from 2021 to 2030. The WA GSOO presents
forecasts of WA’s domestic gas demand and potential gas supply for the low, base and high scenarios 1, and
an overview of gas infrastructure and emerging issues affecting the gas industry.
AEMO would like to acknowledge the support of industry and government in providing data and information
for the 2020 WA GSOO.

    Key findings
    • The WA domestic gas market is expected to be well-supplied until 2026, and finely balanced until
      2028. A potential gap is forecast for the final years of the outlook period; however, options are
      available to alleviate this.
    • Overall, potential gas supply is forecast to decline at an average                                           Potential gas supply is gas
      annual rate of 2.8% between 2021 and 2030.                                                                   that could be economically
         – This decline is in line with reserve depletion at existing production                                   offered to the domestic market
                                                                                                                   given forecast prices and
           facilities and comes as large liquefied natural gas (LNG) projects,
                                                                                                                   production costs, capped by
           Browse and Scarborough projects, have been delayed due to                                               the availability of processing
           market dynamics, exacerbated by economic conditions resulting                                           capacity and gas reserves. It
           from the COVID-19 pandemic.                                                                             does not project how much gas
         – In contrast to the delays in LNG projects, domestic-only projects2,                                     will be produced, but how
                                                                                                                   much could be produced if
           including backfill for existing production facilities, have progressed
                                                                                                                   there was demand at the
           further since the publication of the 2019 WA GSOO.
                                                                                                                   forecast price.
    • Gas demand is forecast to grow at an average annual rate of 0.7%,
      largely due to growth in the mining and minerals processing sectors 3.
      Five committed4 resources projects are expected to add around 40 TJ/day to gas demand from 2023.
         – The COVID-19 pandemic has led to an increase in demand for WA’s commodities, particularly gold.
           This increase is expected to support domestic gas demand in the short term to 2022. Overall, gas
           demand in the mining sector is expected to grow at an average annual rate of 1.6% over the
           outlook period.
         – On average over the outlook period, gas demand from South West interconnected system (SWIS)
           gas-powered generation (GPG) is expected to fall at an average annual rate of 0.4% in the base
           scenario, following a decline of 41 terajoules (TJ)/day between 2020 and 2021 due to the entry of
           large-scale renewable energy generation capacity in 2020. The commencement of two 5 new

1
    In this executive summary, all references to forecasts are to the base scenario, unless otherwise specified.
2
    These projects are not exposed to the international LNG market and have different development drivers.
3
    AEMO has incorporated the impacts of the closure of the BP refinery (https://www.mediastatements.wa.gov.au/Pages/McGowan/2020/10/BP-must-
    honour-commitment-to-workers-following-Kwinana-closure.aspx) that is serviced by the Kwinana cogeneration plant in its gas demand forecasts.
4
    Committed projects have attained a positive final investment decision or are under construction and are included in all three gas demand scenarios.
5
    The Phoenix Kwinana waste-to-energy (36 MW) and East Rockingham waste-to-energy (28 MW) generators are expected to operate as baseload and
    therefore displace SWIS GPG.

© AEMO 2020 | 2020 Western Australia Gas Statement of Opportunities                                                                                       3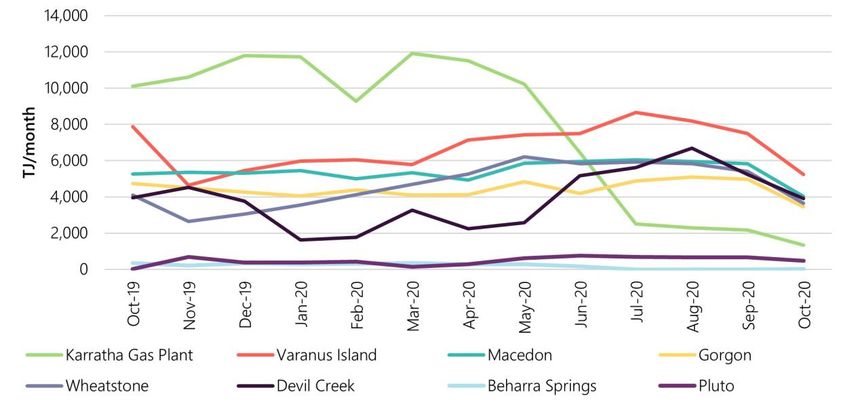
waste-to-energy generators by the end of 2022 and declining electricity consumption forecasts,
             partly offset by the retirement of the Muja C power station by 2024, contribute to the forecast
             decline in SWIS GPG gas consumption over the outlook period.
    • In the high scenario, potential gas supply is forecast to be sufficient to meet gas demand over the
      outlook period, except for a small potential gap in 2025 (14 TJ/day) and 2026 (64 TJ/day) with options
      such as storage to alleviate this. Prospective demand projects6 could consume up to an additional
      145 TJ/day, increasing WA’s gas demand by 11% in 2025 compared to the base scenario.

Potential gas supply and domestic gas demand expected to be finely balanced from 2028
The WA domestic gas market is expected to be well-supplied in the short to medium term until 2026 and
finely balanced in 2027 and 2028, as shown in Figure 1 and Table 1. In 2029, gas demand is expected to
exceed potential gas supply by around 4% (47 TJ/day), increasing to around 9% (97 TJ/day) in 2030. In
contrast, the 2019 WA GSOO forecast that potential gas supply would be sufficient to meet gas demand for
the 2020 to 2029 outlook period.

Figure 1          Base scenario gas market balance (TJ/day), 2021 to 2030

Table 1           Base scenario WA potential gas supply and demand forecasts (TJ/day), 2021 to 2030

                                                                                                                              5-year           10-year
                                                                                                                              average          average
                  2021       2022       2023       2024       2025       2026      2027       2028       2029       2030      annual           annual
                                                                                                                              growth           growth
                                                                                                                              (%)              (%)

    Potential
                   1,334      1,418      1,372      1,331     1,294      1,260      1,230      1,130      1,085      1,038             -0.8             -2.8
    supply

    Demand         1,068      1,080      1,081      1,099      1,116      1,126      1,128     1,128      1,132      1,135               1.1             0.7

6
    Prospective demand projects are only included in the high scenario and must meet set criteria. These include projects that may switch from diesel to gas
    electricity generation.

© AEMO 2020 | 2020 Western Australia Gas Statement of Opportunities                                                                                            4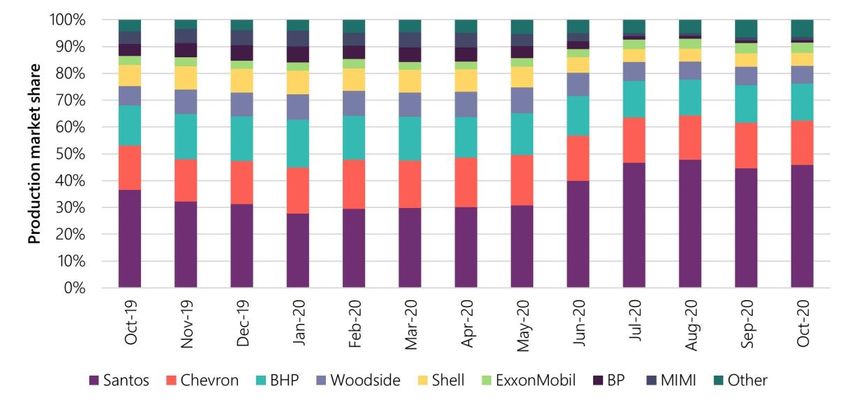
Domestic gas demand is forecast to exceed potential gas supply only from 2029. However, there are options
that could reduce or eliminate any potential gaps in these outer years of the outlook period, including:
• Excess reserves from 2021 to 2026 at existing production facilities could become available to meet
  demand after 2028.
• Gas could be withdrawn from storage at a rate of up to 210 TJ/day, eliminating short-term supply gaps7.
• Undeveloped gas fields that may be connected to existing gas production facilities could be developed
  over the outlook period and may meet the projected demand.
• Additional supply projects that are not currently included in the potential gas supply forecasts may enter
  the market.

Large LNG projects delayed while domestic-only supply sources and backfill gain momentum
In 2020, WA’s domestic gas supply capacity increased by 8.5 TJ/day with the commencement of an expansion
at the Xyris production facility to 20 TJ/day 8. From 2021, Gorgon’s second tranche of supply (118 TJ/day) is
expected to become available to the market.
Since the 2019 WA GSOO publication:
• Large LNG projects have been delayed due to weak oil and LNG prices, combined with LNG oversupply,
  which has been exacerbated by restrictions introduced because of the COVID-19 pandemic that have
  reduced LNG demand9.
• Other projects have either changed development path or increased in volume.
These changes are summarised in Table 2.

Table 2            Prospective supply sources, 2019 WA GSOO compared to 2020 WA GSOOA

    Project                  Operator           2019 WA GSOO assumption                        2020 WA GSOO assumption

                                                Available at 230 TJ/day from 2026,
                             Woodside                                                          Not available during the outlook period due to timing
    Browse (LNG)B                               developed via the Karratha Gas
                             Energy                                                            uncertainty.
                                                Plant (KGP).

                                                Available at 150 TJ/day from 2024,
    Scarborough              Woodside
                                                developed via an expansion                     Available at 250 TJ/day from 2027.
    (LNG)B                   Energy
                                                (second train) to Pluto LNG.

                                                                                               Developed initially for LNG export as backfill for the KGP
    Waitsia stage 2          Mitsui E&P         Excluded due to uncertainty about              at a capacity of up to 250 TJ/day from 2023, then
    (LNG)                    Australia          the development path.                          supplies the domestic market at a reduced capacity after
                                                                                               2028.

    West Erregulla           Strike
                                                Available at 25 TJ/day from 2022.              Available at 80 TJ/day from 2022.
    (domestic-only)          Energy

A. The projects listed in this table have been included in the gas supply modelling to determine if they are likely to be developed over the
outlook period. For further information about the prospective supply projects included in the potential gas supply forecasts, see
Section 3.3.
B. WA’s domestic gas policy requires LNG project proponents to reserve and actively market 15% of LNG production for the domestic
market. See https://www.jtsi.wa.gov.au/economic-development/economy/domestic-gas-policy.

7
    This is subject to the duration of time for which gas is required and the initial volume of gas available in the storage facility.
8
    Beach Energy. FY21 First Quarter Activities Report, 23 October 2020. Available at https://yourir.info/resources/0c5a441cf54ff229/announcements/bpt.asx/
    2A1258293/BPT_Quarterly_report_for_the_period_ended_30_September_2020.pdf.
9
    Office of the Chief Economist – Department of Industry, Science, Energy, and Resources. Resources and Energy Quarterly, September 2020. Available at
    https://publications.industry.gov.au/publications/resourcesandenergyquarterlyseptember2020/documents/Resources-and-Energy-Quarterly-Sept-
    2020.pdf.

© AEMO 2020 | 2020 Western Australia Gas Statement of Opportunities                                                                                           5
In addition to the prospective projects in Table 2, two gas fields are currently being progressed as backfill 10
for existing gas production facilities:
1. Beharra Springs Deep – Beach Energy expects to connect this field to the existing Beharra Springs
   production facility in the first quarter of 202111.
2. Spartan – Santos intends to connect this field to the Varanus Island production facility and is targeting a
   final investment decision for 202112.
While these projects are not expected to increase domestic gas production capacity, they will maintain
potential gas supply from existing production facilities (Beharra Springs and Varanus Island). Assuming they
proceed, the connection of these reserves will result in a slower decline rate of potential supply from existing
gas production facilities over the outlook period, compared to the forecast in the 2019 WA GSOO.
The potential gas supply forecasts are shown in Table 3. In summary:
• Volumes are identical in the base and high scenarios 13 between 2021 and 2023, reflecting the same
  production facilities being available during this period.
• The low scenario excludes prospective projects and backfill and therefore shows a situation where only
  existing and committed production facilities are available throughout the outlook period.
• The high scenario includes an additional backfill source and two additional prospective projects compared
  to the base scenario.

Table 3            Potential gas supply forecasts (TJ/day), 2021 to 2030

                                                                                                                5-year average           10-year average
              2021      2022     2023      2024      2025      2026     2027      2028      2029      2030      annual growth            annual growth
                                                                                                                (%)                      (%)

     Low       1,216    1,169     1,128     1,091    1,058     1,029     1,002      795       777       762                      -3.4                      -5.1

     Base     1,334     1,418     1,372     1,331    1,294     1,260     1,230     1,130    1,085     1,038                      -0.8                      -2.8

     High     1,334     1,418     1,372    1,353      1,316    1,282     1,502     1,613     1,561    1,515                    -0.3%                      1.4%

AEMO notes that there is a large volume of undeveloped gas that could supply the WA domestic market
during the outlook period, but this volume is currently too speculative to include in the potential supply
forecasts. These sources include Clio-Acme and Equus14. AEMO will continue to monitor these projects for
potential inclusion in future WA GSOOs.

Gas consumption to be supported by strong demand for WA’s commodities
Over the outlook period, gas demand is forecast to increase at an average annual rate of 0.7%, from
1,068 TJ/day in 2021 to 1,135 TJ/day in 2030.
Growth in the first five years of the outlook period is stronger (1.1%) than in the second half of the outlook
period (0.2%), largely as a result of new projects commencing operation.

10
     Connecting additional gas fields or reserves to an existing domestic gas production facility, instead of building new processing infrastructure (sometimes
     referred to as a tie-back).
11
     Beach Energy. FY21 First Quarter Activities Report, 23 October 2020. Available at https://yourir.info/resources/0c5a441cf54ff229/announcements/bpt.asx/
     2A1258293/BPT_Quarterly_report_for_the_period_ended_30_September_2020.pdf.
12
     Santos. Third Quarter Activities Report for period ending 30 September 2020, 22 October 2020. Available at https://www.santos.com/wp-content/uploads/
     2020/10/2020_Third_Quarter_Activities_Report-FINAL.pdf.
13
     Assumptions about domestic gas and Asian LNG prices vary between scenarios.
14
     Corvus was included in this list in the 2019 WA GSOO, but has been added to the high scenario as backfill for Devil Creek in this report.

© AEMO 2020 | 2020 Western Australia Gas Statement of Opportunities                                                                                               6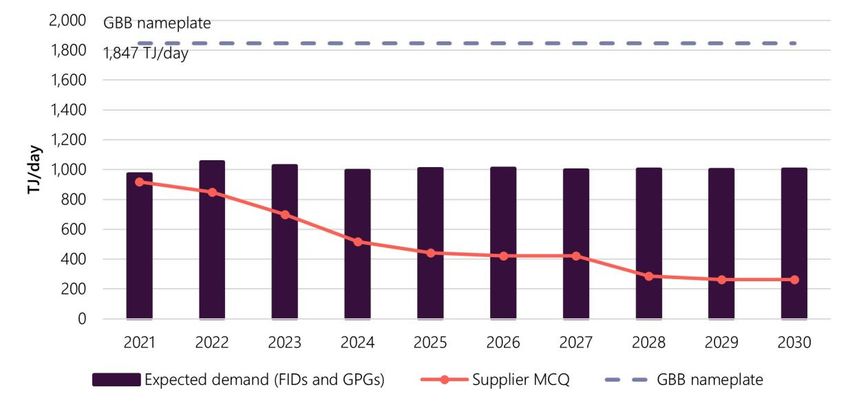
Forecast growth in domestic demand, as shown in Table 4, is underpinned by the following:
• Five15 committed resources projects are expected to add around 40 TJ/day to gas demand from 2023.
• Gas demand in the mining sector is forecast to increase at an average annual rate of 1.6% over the
  outlook period, supported by trends in specific commodities, including:
       – The COVID-19 pandemic has increased demand for WA’s commodities, particularly gold. As a result,
         gas demand in the gold mining sector is forecast to increase by 7.6% between 2020 and 2022. Over
         the outlook period, however, gas demand for gold mining is forecast to decline at an average annual
         rate of 1.6%, as gold production declines due to an expected reduction in international gold prices
         from 2023.
       – Gas demand for iron ore mining is forecast to increase at an average annual rate of 1.2% over the next
         five years to 2025. Global iron ore supply, particularly from Brazil, has dropped due to mine closures as
         a result of the COVID-19 pandemic and other technical issues. Demand for WA iron ore is strong, since
         mines have continued to operate and make product available for export.
• On average over the outlook period, gas demand from SWIS GPG 16 is expected to fall at an average
  annual rate of 0.4% in the base scenario, from 91 TJ/day in 2021 to 87 TJ/day in 2030. This follows a
  decline of 41 TJ/day between 2020 and 2021 due to the entry of large-scale renewable energy generation
  capacity in 2020. The commencement of two new waste-to-energy generators by the end of 2022 and
  declining electricity consumption forecasts, partly offset by the retirement of the Muja C power station by
  2024, contribute to the decline in SWIS GPG gas consumption over the outlook period.
• In the high scenario, five prospective demand projects could add up to 145 TJ/day from 2025.

Table 4            Domestic gas demand forecasts (TJ/day), 2021 to 2030

                                                                                                                                  5-year           10-year
                                                                                                                                  average          average
                2021        2022       2023        2024       2025        2026       2027        2028       2029       2030       annual           annual
                                                                                                                                  growth           growth
                                                                                                                                  (%)              (%)

     Low         1,035       1,048      1,046       1,051       1,061      1,065      1,061      1,054       1,053      1,048               0.6               0.1

     Base        1,068       1,080       1,081      1,099       1,116      1,126      1,128       1,128      1,132       1,135               1.1              0.7

     High         1,127      1,154       1,159      1,243      1,330       1,346      1,354      1,358       1,367      1,374               4.2               2.2

15
     Fortescue Metals Group’s Iron Bridge iron ore project, Rio Tinto’s Gudai-Darri iron ore project, Capricorn Metals’ Karlawinda gold project, Kalium Lakes’
     Beyondie sulphate of potash project, and Albemarle Corporation’s Kemerton lithium refinery. For changes in the committed projects list since the 2019 WA
     GSOO, see Section 2.2.2.
16
     Some GPG that participates in the Wholesale Electricity Market (for example, Alinta’s Pinjarra cogeneration) is classified as minerals processing, mining, or
     industrial and is excluded from SWIS GPG gas demand in the WA GSOO. For a full description of how AEMO classifies facilities, see Appendix A5.

© AEMO 2020 | 2020 Western Australia Gas Statement of Opportunities                                                                                                  7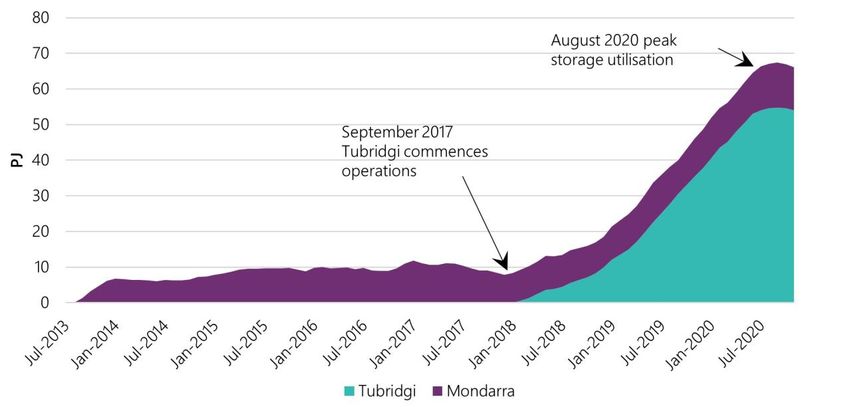
Contents
Executive summary                                                              3

1.        Year in review                                                       12
1.1       Supply                                                               12
1.2       Infrastructure                                                       13
1.3       Demand                                                               13
1.4       Regulatory                                                           15

2.        Gas demand                                                           16
2.1       Historical WA domestic gas demand                                    16
2.2       Domestic gas demand forecasts                                        20
2.3       Gas demand forecasts compared to 2019 WA GSOO                        25
2.4       Historical peak WA domestic gas demand days                          26
2.5       Reconciliation of WA GSOO domestic gas demand forecasts vs actuals   29
2.6       Total gas demand forecasts                                           29

3.        Gas supply                                                           32
3.1       Profile of upstream and gas production                               32
3.2       Potential gas supply model assumptions                               36
3.3       Prospective supply sources assessment                                37
3.4       Potential gas supply forecasts                                       41
3.5       Comparison of 2019 and 2020 WA GSOO potential gas supply forecasts   42

4.        Supply-demand balance                                                44
4.1       Summary of gas demand and potential gas supply forecasts             44
4.2       Supply-demand balance                                                45

5.        2020 formal information request data analysis                        48
5.1       Gas demand and supply data                                           49
5.2       Reserves                                                             54
5.3       Gas prices that would influence consumption                          55

6.        Implications of government and industry initiatives                  56
6.1       Government initiatives and regulation                                56
6.2       Industry initiatives                                                 57
6.3       Hydrogen                                                             57

A1.       References for year in review                                        59

© AEMO 2020 | 2020 Western Australia Gas Statement of Opportunities             8
A2.        Historical domestic gas prices and forward reference prices                             64
A2.1       Historical domestic gas prices                                                          64
A2.2       Production costs for the WA domestic gas market                                         65

A3.        Input assumptions and methodologies                                                     67
A3.1       Commodity forecasts                                                                     67
A3.2       Gas demand forecast methodology                                                         68
A3.3       Potential gas supply forecast methodology                                               74

A4.        Total gas demand forecasts                                                              76

A5.        Sector classifications                                                                  78

A6.        WA gas infrastructure                                                                   79
A6.1       Gas transmission pipelines                                                              79
A6.2       Multi-user gas storage facilities                                                       80
A6.3       Spot and short-term trading                                                             80
A6.4       LNG export production facilities                                                        81

A7.        Conversion tables                                                                       82

Abbreviations and units of measure                                                                 83

Glossary                                                                                           86

Tables
Table 1      Base scenario WA potential gas supply and demand forecasts (TJ/day), 2021 to 2030     4
Table 2      Prospective supply sources, 2019 WA GSOO compared to 2020 WA GSOO                      5
Table 3      Potential gas supply forecasts (TJ/day), 2021 to 2030                                  6
Table 4      Domestic gas demand forecasts (TJ/day), 2021 to 2030                                   7
Table 5      Residential and non-residential retail customer numbers, 2014-15 to 2019-20           19
Table 6      Domestic gas demand forecasts (TJ/day), 2021 to 2030                                  22
Table 7      Forecast annual gas demand by sector (TJ/day), base scenario, 2021 to 2030            23
Table 8      Forecast annual gas demand by area (TJ/day), base scenario, 2021 to 2030              24
Table 9      Forecast annual gas demand by region (TJ/day), base scenario, 2021 to 2030            25
Table 10     2019 and 2020 base scenario domestic gas demand forecasts (TJ/day), 2021 to 2029      26
Table 11     20 largest gas usage days per year (total WA), distributed by season, 2013 to 2020    27
Table 12     The 20 largest gas usage days in each GSI Zone, 2017 to 2019, distributed by season   28
Table 13     Reconciliation of previous WA GSOO domestic gas demand forecasts with current
             forecasts (% deviance of forecast from actual), 2016 to 2020                          29
Table 14     Total gas demand forecasts (PJ/annum), 2021 to 2030                                   30

© AEMO 2020 | 2020 Western Australia Gas Statement of Opportunities                                 9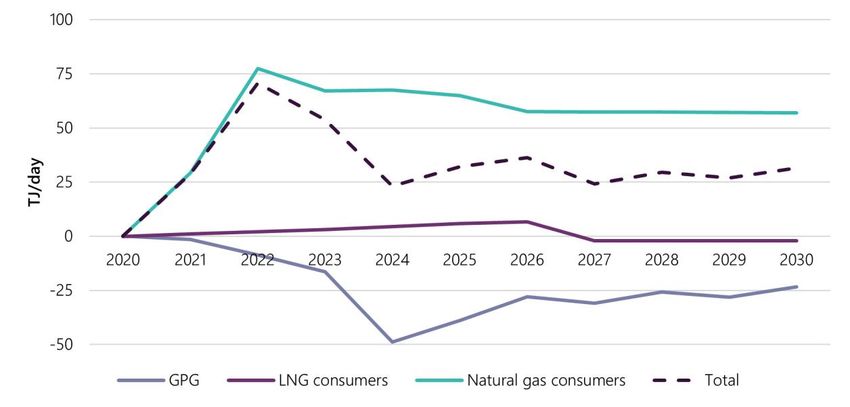
Table 15     WA conventional and unconventional gas resources and reserves (PJ), as at
             September 2020                                                                          33
Table 16     Domestic gas production facility average production and capacity utilisation, 2019-20   34
Table 17     Criteria for assessing prospective supply sources                                       38
Table 18     Prospective supply sources, 2019 WA GSOO compared to 2020 WA GSOO                       39
Table 19     Potential gas supply forecasts (TJ/day), 2021 to 2030                                   42
Table 20     Potential gas supply and demand forecasts, base scenario (TJ/day), 2021 to 2030         46
Table 21     Potential gas supply and demand forecasts, low scenario (TJ/day), 2021 to 2030          47
Table 22     Potential gas supply and demand forecasts, high scenario (TJ/day), 2021 to 2030         47
Table 23     2019 and 2020 FIR response rate overview                                                49
Table 24     Total 2P gas reserves from 2017 through 2020 FIRs (PJ)                                  54
Table 25     Scenario mapping for GPG modelling                                                      71
Table 26     Total gas demand forecast scenarios                                                     74
Table 27     Potential gas supply model operation                                                    75
Table 28     Domestic gas demand forecasts (PJ/annum), 2021 to 2030                                  76
Table 29     LNG feedstock forecasts (PJ/annum), 2021 to 2030                                        76
Table 30     LNG processing forecasts (8% of feedstock) (PJ/annum), 2021 to 2030                     77
Table 31     Total gas demand forecasts (PJ/annum), 2021 to 2030                                     77
Table 32     Classification of gas consumers into sectors (GBB delivery points)                      78
Table 33     WA multi-user gas storage facilities, 2020                                              80
Table 34     Conversion factors                                                                      82

Figures
Figure 1     Base scenario gas market balance (TJ/day), 2021 to 2030                                 4
Figure 2     Gas consumption by state (PJ/annum), 2010-11 to 2018-19                                 17
Figure 3     Major category gas consumption by state (% share of total) (PJ/annum), 2018-19          18
Figure 4     Domestic gas demand forecasts (TJ/day), 2021 to 2030                                    21
Figure 5     Domestic gas demand forecasts by sector (TJ/day), base scenario, 2021 to 2030           23
Figure 6     Domestic gas demand forecasts by region (TJ/day), base scenario, 2021 to 2030           25
Figure 7     Highest gas demand days (TJ/day) by region, 2013 to 2020                                27
Figure 8     Differences between highest and twentieth highest demand days in each GSI Zone          28
Figure 9     Total gas demand forecasts (PJ/annum), base scenario, 2021 to 2030                      31
Figure 10    Exploration and development wells drilled, 1990 to 2020 (year to date)                  33
Figure 11    Gas production by facility, October 2019 to October 2020                                35

© AEMO 2020 | 2020 Western Australia Gas Statement of Opportunities                                  10
Figure 12 Gas production market share by company, October 2019 to October 2020 36
Figure 13 Potential gas supply and production capacity forecasts (TJ/day), 2021 to 2030 42
Figure 14 2019 and 2020 base scenario potential gas supply forecasts (TJ/day), 2021 to 2030 43
Figure 15 Domestic gas market balance, base scenario, 2021 to 2030 45
Figure 16 Potential gas supply compared to gas demand, high scenario, 2021 to 2030 47
Figure 17 Consumer expected gas demand compared to contracted levels (MCQ), 2021 to
2030 49
Figure 18 Consumer contract duration 50
Figure 19 Consumer expected gas demand compared to supplier contracted levels (MCQ) and
GBB total nameplate capacity, 2021 to 2030 51
Figure 20 Comparison of contracted levels (MCQ) as submitted by consumers and suppliers,
2021 to 2030 51
Figure 21 Comparison of consumer expected demand, 2018 to 2020 FIRs 52
Figure 22 Change in expected demand relative to 2020 53
Figure 23 Comparison of supplier contracted levels (MCQ), 2018 to 2020 FIRs 53
Figure 24 Comparison of prospective demand, 2019 and 2020 FIR 54
Figure 25 Gas price estimates that could result in changes in gas consumption (A$/GJ) 55
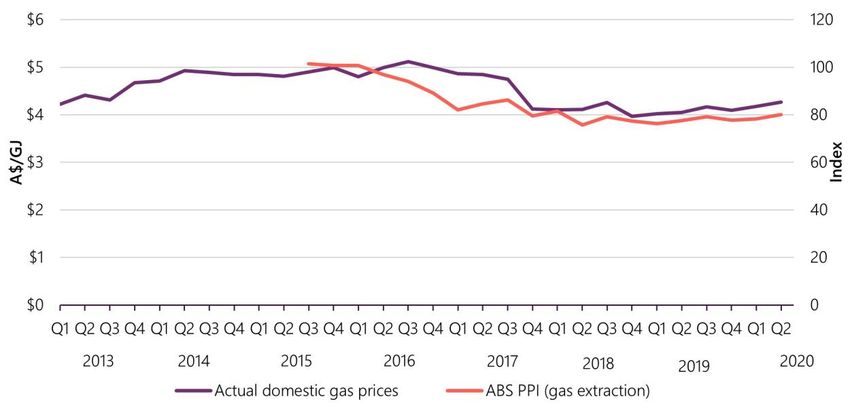
Figure 26 Historical domestic gas contract prices (A$/GJ, nominal) and ABS PPI – WA (gas
extraction, index), Q1 2013 to Q2 2020 64
Figure 27 WA spot gas prices from gasTrading (A$/GJ, nominal), January 2015 to September
2020 65
Figure 28 Gas demand forecasting for the non-SWIS GPG sector 72
Figure 29 Total gas demand forecasts 73
Figure 30 Gas transmission pipelines in WA 79
Figure 31 Cumulative stored gas, 2013 to 2020 80
© AEMO 2020 | 2020 Western Australia Gas Statement of Opportunities 111. Year in review
This chapter provides a snapshot of events in the Western Australia (WA) gas market since
the 2019 WA Gas Statement of Opportunities (GSOO) publication. References for this
chapter are provided in Appendix A1.
1.1 Supply
• The Beharra Springs Deep well is expected to be connected to the Beharra Springs production facility in
the March 2021 quarter.
• Bennett Resources, a subsidiary of Black Mountain Energy, submitted plans to WA’s Environmental
Protection Authority (EPA) to undertake unconventional exploration drilling and hydraulic fracturing in
the Kimberley’s Canning Basin, with the potential undiscovered resource estimated at 25 trillion cubic
feet (tcf).
• BP began drilling the Ironbark exploration well, which, if successful, may be a candidate for future tie-back
to the North West Shelf (NWS) infrastructure.
• Chevron implemented the following gas sales agreements (GSAs):
– Alcoa for an additional 37 petajoules (PJ) of natural gas (totalling 198 PJ including existing GSAs),
commencing in 2024.
– BHP Nickel West for 22 PJ of natural gas over a 3.5-year period, which commenced in July 2020.
– Newcrest Operations for 16 PJ of equity domestic gas, which commenced in late 2019, for a 3.5-year
period.
• Kalium Lakes secured a GSA with Shell to supply 1 terajoule (TJ)/day for its Beyondie sulphate of potash
(SOP) project. The Beyondie SOP project is expected to commence production in the third quarter of 2021.
• Mitsui E&P Australia (Mitsui) and Beach Energy’s Waitsia gas project advanced further:
– The WA EPA recommended the second stage of the Waitsia gas project (up to 250 TJ/day) for
environmental approval to the Minister. A final investment decision (FID) is expected by the end of
2020.
– The WA Government exempted the second stage of the Waitsia gas project from the updated
Domestic Gas Policy, allowing the project to export gas through the Karratha Gas Plant (KGP).
– Xyris expanded from 11.5 TJ/day to 20 TJ/day in August 2020.
• Santos undertook the following activities:
– Began supplying Alcoa with 120 TJ/day from mid-2020, and Gold Fields with 5.5 PJ of natural gas over
three years from 1 July 2020.
– Executed a GSA with Kleenheat to supply more than 16 PJ of domestic gas over a three-year period
from 2021.
– Commenced front-end engineering design works to connect the Spartan gas field to the Varanus
Island production facility, with FID targeted for 2021.
© AEMO 2020 | 2020 Western Australia Gas Statement of Opportunities 12• Shell discovered gas in the Bratwurst-1 exploration well, which is a potential tie-back to the Prelude
floating liquefied natural gas (LNG) facility.
• Warrego Energy and Strike Energy signed a binding Heads of Agreement to jointly develop the West
Erregulla gas field, with the capacity revised to 80 TJ/day. Warrego Energy executed a GSA with Alcoa to
supply 255 PJ of natural gas over 10 years, starting in early 2024. FID is expected by the end of the first
quarter of 2021 and first gas by mid-2022.
• Woodside Energy (Woodside) undertook the following activities:
– Made a FID on Greater Western Flank Phase 3 (including Lambert Deep).
– Announced delays to FID for Scarborough and Pluto train two until the second half of 2021, and for
Browse to at least 2023.
– Accepted petroleum production licences for Scarborough from the Commonwealth and Western
Australian Joint Authority.
– Executed a long-term sale and purchase agreement with Uniper Global Commodities to supply LNG
for a term of 13 years commencing from 2021, subject to a positive FID on Scarborough.
1.2 Infrastructure
• APA Group announced it would construct the new 580 km Northern Goldfields Interconnect pipeline to
connect gas fields in the Perth basin (for example, West Erregulla) to Goldfields gas consumers. The
pipeline is expected to be operational by mid-2022.
• Fortescue Metals Group (FMG) proposed the Pilbara Transmission Project, which consists of 275 km of
220 kilovolt (kV) transmission lines connecting FMG’s mine sites, which may allow increased gas
consumption at its mine sites.
• The WA Government called for global expressions of interest for a 1.5 gigawatts (GW) renewable energy
hydrogen hub at the Oakajee Strategic Industrial Area to enable domestic hydrogen production and
possible export.
1.3 Demand
• ATCO Australia is undertaking a study to harvest natural gas from the North Bannister Waste Facility,
south of Perth, and transport it by road to Albany. If successful, this would make Albany the first Australian
city to be completely supplied by renewable natural gas.
• Clean Energy Fuels Australia (CEFA) secured a long-term site lease for a plant near the town of Mount
Magnet, which will form part of the Mid-West LNG Hub. Mount Magnet was chosen due to its good
transport links, its proximity to remote power customers, and existing gas pipeline infrastructure. The hub
will include the first LNG liquefaction train, LNG transport tankers, customer storage, and regasification
facilities, and is expected to reach a maximum demand of around 4.1 TJ/day of gas. CEFA estimates that
over 25 years of operation, the first LNG train at the Mid-West LNG Hub could displace around three
billion litres of imported diesel with domestically-sourced natural gas and reduce customers’ carbon
dioxide emissions by over two million tonnes.
• FMG announced investment into the Pilbara Generation project as part of the Pilbara Energy Connect
program. The project will include 150 megawatts (MW) of gas-powered generation (GPG) and 150 MW of
solar generation, supplemented by large-scale battery storage with the construction and operation of the
gas-fired station approved by the WA EPA. The project also includes the conversion of Solomon Power
Station from diesel to gas generation.
• Hazer Group made a FID on the Hazer Commercial Demonstration Plant, which will convert biogas from
sewage treatment into hydrogen and graphite, with operations to commence mid-2021.
© AEMO 2020 | 2020 Western Australia Gas Statement of Opportunities 13• Metals X suspended operation of its Nifty Copper Mine in November 2019 and announced a sale process
for the mine in September 2020.
• Perdaman signed a binding Heads of Agreement with a Clough and Saipem joint venture for the
engineering, procurement, and construction work for its urea project in Karratha. The WA Government
announced support for the project, conditional on reaching FID, obtaining all statutory approvals, and
securing an offtake agreement.
• Following the increase in global demand for gold, several gold mining projects are making progress:
– AngloGold Ashanti’s Boston Shaker underground mine at Tropicana achieved commercial production,
reaching an annualised production rate of 0.7 million tonnes per annum (mtpa), with additional power
requirements met by increasing the GPG capacity to 50 MW.
– Blackham Resources’ Wiluna mine is expected to almost double production by late 2021.
– Calidus Resources secured debt financing for development of the Warrawoona gold project, with plant
construction planned for first quarter of 2021.
– Capricorn Minerals made a FID on the Karlawinda project in late 2019, with first gold production
expected in June 2021.
– The Gruyere Gold Mine (joint venture of Gold Road Resources Limited and Gold Fields Limited)
officially opened in December 2019, including 45 MW of GPG.
• Short-term demand for lithium remains weak as the lithium price continued to fall in 2020, resulting in the
following activities:
– Covalent Lithium delayed FID on the Mt Holland lithium project by a year to the first quarter of 2021.
– Galaxy Resources’ Mount Cattlin lithium mine and Pilbara Minerals’ Pilgangoora lithium-tantalum
projects both reduced production by about 50%.
– Altura Mining went into voluntary administration in October 2020, following a reduction in production
to around 80% capacity.
– Mineral Resources Australia’s Wodgina lithium mine was placed under care and maintenance, while
Alita Resources’ Bald Hill lithium mine first suspended operations and subsequently entered voluntary
administration.
– The WA Government announced that it will provide a 50% royalty rebate on spodumene concentrate
for up to a year to Galaxy Resources’ Mount Cattlin and Pilbara Minerals’ Pilgangoora projects.
• Developments in hydrogen gas projects are expected to impact gas demand:
– BP are carrying out the Geraldton Export-Scale Renewable Investment Feasibility Study to explore the
potential for developing a green hydrogen and ammonia production supply chain.
– Horizon Power’s Denham hydrogen demonstration project, which consists of a 500 kilowatt (kW) solar
farm to generate electricity to power an electrolyser for the hydrogen production, is expected to be
commissioned in December 2021.
– Infinite Blue Energy’s Arrowsmith Hydrogen Project secured an agreement to partner with Western
Power to undertake initial planning work for an additional 330 kV transmission network link to its
proposed green hydrogen facility. The hydrogen project is expected to reach FID in 2021 and
commence production in 2022.
– The WA EPA has approved the first stage of NW Interconnected Power Pty Ltd’s Asian Renewable
Energy Hub. This project proposes building up to 15,000 MW of new wind and solar power in the
Pilbara region, with the bulk of the energy to be used for large-scale hydrogen production for
domestic and export markets. The first stage of the project received WA Government environmental
approval in October 2020.
© AEMO 2020 | 2020 Western Australia Gas Statement of Opportunities 14– The WA Government is funding seven renewable hydrogen feasibility studies as part of the Renewable
Hydrogen Strategy. The studies include examining solar hydrogen for waste collection and light vehicle
fleets in Cockburn, a hydrogen refuelling hub in Mandurah, and the potential for an electrolysis
hydrogen production plant in the Great Southern or Wheatbelt regions.
– Woodside and APA Group’s Badgingarra Renewable Hydrogen Project is expected to use 100%
renewable power to produce hydrogen for use in power generation, transport and industrial
applications.
– The Yara Pilbara Renewable Ammonia Feasibility Study is expected to produce renewable hydrogen to
supply its ammonia production process (currently operated using natural gas) at the Burrup Peninsula
facility. The project is expected to produce 30,000 tonnes of hydrogen per year.
• Gas demand is expected to reduce as renewable energy projects come online as follows:
– BHP executed a 15-year contract extension to its power purchase agreement (PPA) with Southern Cross
Energy for electricity supply to its Nickel West operation, extending the current arrangement to 2038.
The PPA includes an investigation into an 18.5 MW solar photovoltaic (PV) farm at Nickel West’s
Leinster and Mount Keith operations, supported by a battery energy storage system, and a 17 MW
waste heat steam turbine system at the Kalgoorlie smelter.
– Gold Fields Group’s (Gold Fields) 56 MW Agnew Hybrid Renewable Project (stage 1 and 2) – which
consists of an 18 MW wind farm, 4 MW solar farm, 13 MW of battery storage, and a 21 MW gas/diesel
power plant – commenced operation.
– Horizon Power commissioned the Onslow microgrid project, which consists of a solar farm and battery
storage integrated with GPG.
– Horizon Power’s Esperance Power Project – which will deliver a hybrid generation solution including a
4 MW solar farm, 5.5 MW of battery storage, two wind turbines with a combined capacity of 9 MW,
and 22 MW of GPG – commenced construction in September 2020 and is expected to be complete in
November 2021.
– Rio Tinto approved investment in a new 34 MW solar plant with 12 megawatt hours (MWh) of battery
storage at the Gudai-Darri17 mine. Construction is expected to commence at the end of 2020 and due
to be completed in 2021.
– Strandline Resource executed a non-binding proposal with Woodside and Energy Developments
Limited (EDL) to develop a 27 MW hybrid gas and renewable power solution over 15 years to power
the Coburn mineral sands project.
1.4 Regulatory
• DBNGP (WA) Transmission Pty Ltd (DBP) submitted proposed revisions to the access arrangement for the
Dampier to Bunbury Natural Gas Pipeline (DBNGP) for the period 2021 to 2025 to the Economic
Regulation Authority (ERA). The ERA requested a number of changes to the access agreement and the
revised version is under consideration at the time of publication.
• The WA Government clarified the WA Domestic Gas Policy to state that it would not agree to exports of
gas through the WA pipeline network, and that supply of gas to the east coast would be treated as an
export for the purposes of the policy.
17
Spelling change from Koodaideri at the request of the Banjima Native Title Aboriginal Corporation. For further information, see https://cdn-
api.markitdigital.com/apiman-gateway/ASX/asx-research/1.0/file/2924-02294524-3A552729?access_token=83ff96335c2d45a094df02a206a39ff4.
© AEMO 2020 | 2020 Western Australia Gas Statement of Opportunities 152. Gas demand
In the base scenario, the Australian Energy Market Operator (AEMO) forecasts domestic
gas demand to grow at an average annual rate of 0.7%, underpinned by growth in the
mining and minerals processing sectors. This includes five committed projects that are
expected to add approximately 40 TJ/day to domestic demand by 2023. The COVID-19
pandemic has increased demand for WA’s commodities, particularly gold, in the short term
to 2022. Over the long term, gas demand for iron ore mining is forecast to continue to
grow, driven by sustained strong global demand for iron ore.
All data in this chapter is presented in calendar years unless otherwise stated.
2.1 Historical WA domestic gas demand
2.1.1 Overview, historical characteristics, and comparisons
WA’s unique combination of geographic isolation and very large gas resources provides a backdrop for
remotely located LNG developments.
WA Government policy promoted the development of gas fields in the NWS area during the 1980s. The State
Energy Commission of WA signed a large gas supply contract with the NWS partners and constructed the
DBNGP.
The WA domestic gas market is characterised by:
• Large gas reserves that are generally located offshore and developed mainly to supply the global LNG
market.
• A limited number of large suppliers/producers and consumers.
• Bilateral, confidential, long-term take-or-pay gas sales contracts.
• Residential, commercial, and small industrial consumers comprising a small proportion of total demand.
• Small volumes of short-term and spot gas sales18.
• A small number of pipelines, interconnectors, and limited surplus pipeline capacity.
• Information about supply that is available to be contracted, potential buyers, and gas contract pricing is
not readily available.
• 78 PJ of storage capacity.
The east coast market, which includes New South Wales, Queensland, South Australia, Victoria, and Tasmania,
is characterised by:
• Active short-term gas hubs which provide greater price discovery and trading flexibility.
• Smaller gas reserves which are predominantly located onshore.
18
Short-term and spot gas sales are expected to increase as more consumers seek shorter-term contracts.
© AEMO 2020 | 2020 Western Australia Gas Statement of Opportunities 16• Over 200 PJ of gas storage capacity19.
Despite its relatively small population, WA has the highest natural gas consumption of all Australian states.
WA consumed 669 PJ of gas in 2018-19, approximately 42% of Australia’s total gas consumption (as shown in
Figure 2).
Figure 2 Gas consumption by state (PJ/annum), 2010-11 to 2018-19
Source: Department of Industry, Science, Energy, and Resources.
Note: Data is presented in financial years. The figures for New South Wales include the Australian Capital Territory.
Notably, WA has a relatively low proportion of residential and commercial gas consumption (2%) compared
to South Australia (14%), New South Wales (30%), and Victoria (53%).
WA’s consumption of gas in 2018-1920 was from:
• GPG – 43.2%21.
• Mining – 31.1%.
• Industrial and minerals processing sector – 22.2%.
• Residential and commercial – 2.4%.
• Other – 1.1%.
Figure 3 presents a comparison of gas consumption by category across Australian states22 and the Northern
Territory.
19
Based on data from the national Gas Bulletin Board (GBB), available at: https://aemo.com.au/energy-systems/gas/gas-bulletin-board-gbb/data-portal.
20
Direct comparison with WA GBB consumption is not possible due to differences in classifications.
21
Includes generation for mining and minerals processing.
22
The Australian Capital Territory has been included in the figures for New South Wales.
© AEMO 2020 | 2020 Western Australia Gas Statement of Opportunities 17Figure 3 Major category gas consumption by state (% share of total), 2018-19
Source: Department of Industry, Science, Energy, and Resources.
Note: Data is presented in financial years.
2.1.2 Large customers supplied through the transmission network
The majority of large customers23 are supplied directly through the transmission network (such as the DBNGP
and the Goldfields Gas Pipeline). The remaining large customers are supplied by domestic LNG facilities,
which convert natural gas to LNG which is then transported by road.
Large customers include:
• Mine sites such as iron ore, gold, and nickel mines.
• Mineral processing facilities such as alumina refineries and nickel smelters.
• Electricity generation from GPG, mainly located in the North West Interconnected System (NWIS) and the
South West interconnected system (SWIS).
• Industrial large users such as brickworks, cement manufacturers, and chemicals plants.
• Producers of domestic LNG, compressed natural gas, and liquefied petroleum gas (LPG).
• Petroleum processors.
Based on WA Gas Bulletin Board (GBB) 24 data, large customers accounted for 85% of gas consumed in WA in
2019 and 84% in 2020 (year to date to 31 October), in line with historical usage. The majority was consumed
in the minerals processing (32% of large customer use), mining (26%), and electricity generation (27%)
sectors.
2.1.3 Customers supplied through the distribution network
Customers supplied through the retail distribution network account for 6% of WA’s total domestic gas
consumption. Table 525 shows the total number of residential and non-residential customers supplied
through the distribution network, and customer transfers between retailers between the 2014-15 and 2018-19
financial years.
23
Gas consumers using 10 TJ/day or more.
24
This public website (at https://gbbwa.aemo.com.au) publishes forecast and historical data on the domestic production, transmission, storage, and usage of
natural gas in WA.
25
AEMO. Gas Retail Markets Monthly Statistics – June 2020. Available at https://www.aemo.com.au/-
/media/files/gas/retail_markets_and_metering/data/2020/gas-monthly-retail-transfer-statistics-june-2020.pdf?la=en.
© AEMO 2020 | 2020 Western Australia Gas Statement of Opportunities 18Annual growth in customer numbers has fallen since 2015-16, despite the population continuing to grow 26. In
2019-20, particularly slow growth (0.3%) is mainly attributed to the lowest number of new dwellings being
completed since 1984-8527.
Average usage per connection has fallen due to increasingly efficient gas appliances, smaller household sizes,
and increasing competitive substitutes from alternative energy sources such as electricity28.
Customer churn continued to increase in 2019-20; it has risen from 5% in 2014-15 to 14% in 2019-2029. Before
2013-14, Alinta was the only small residential and business retailer. The retail gas market has since expanded
to include a total of nine retail licenses30 including AGL, Amanda, Simply Energy, Origin, Perth Energy and
Kleenheat.
Table 5 Residential and non-residential retail customer numbers, 2014-15 to 2019-20
Total number of customers Existing customer transfers
Financial year
Number Growth Number ChurnA
2014-15 717,439 N/A 37,196 5%
2015-16 738,835 3% 54,103 7%
2016-17 752,454 2% 95,845 13%
2017-18 761,734 1% 112,089 15%
2018-19 771,415 1% 119,884 16%
2019-20 773,778 0.3% 110,564 14%
A. Calculated by dividing the number of customers changing retailer by the total number of customers for a given financial year.
Note: Data is presented in financial years.
The annual gas retail market for large business customers (business customers on ATCO’s distribution
network who consume more than 0.18 TJ of gas per year and are covered by the gas market moratorium)
experienced a shift. Alinta’s customer share declined from 85% in 2013-14 to 46% in 2018-1931. Most of these
customers were captured by Kleenheat, whose market share jumped from 10% in 2013-14 to 32% in 2015-16,
then to 40% in 2018-19. As of 2019, Synergy is the third largest retailer with 6% of the market share, followed
by Perth Energy with 3%, Esperance Gas Distribution Company with 2%, and AGL with 2%.
A similar pattern was noticed in the small residential market (residential customers on ATCO’s distribution
network who consume less than 0.18 TJ of gas per year and are covered by the gas market moratorium).
Alinta’s share steadily declined from monopoly status in 2013-14 to 65% in 2018-19. A total of 28% of the
market has been captured by Kleenheat, and AGL and Origin Energy make up the balance with 6% and 2%
market share respectively32.
26
Australian Bureau of Statistics (ABS). National, state, and territory population, 24 September 2020. Available at:
https://www.abs.gov.au/statistics/people/population/national-state-and-territory-population/mar-2020.
27
ABS. Building Activity, Australia, 14 October 2020. Available at: https://www.abs.gov.au/statistics/industry/building-and-construction/building-activity-
australia/jun-2020#data-download.
28
ATCO. 2020-24 Plan: Access Arrangement Information for ATCO’s Mid-West and South-West Gas Distribution System, 31 August 2018, pp. 57-8. Available at:
https://yourgas.com.au/wp-content/uploads/2018/09/ATCO-2020-2024-Plan-1.pdf?utm_source=plan_downloads&utm_medium=2020-24_Plan_page.
29
A comparison of churn rates between states across the 2018-19 financial year is available at: https://www.aemo.com.au/-/media/files/gas/
retail_markets_and_metering/data/2020/gas-monthly-retail-transfer-statistics-september-2020.pdf?la=en.
30
ERA. Annual Data – Energy Retailers 2018/19, 26 March 2020. Available at: https://www.erawa.com.au/gas/gas-licensing/energy-reports.
31
Data for 2019-20 was not available at the time of publication.
32
ERA. Annual Data – Energy Retailers 2018/19, 26 March 2020. Available at: https://www.erawa.com.au/gas/gas-licensing/energy-reports.
© AEMO 2020 | 2020 Western Australia Gas Statement of Opportunities 192.2 Domestic gas demand forecasts
2.2.1 Forecasting scenarios
The annual domestic gas demand forecasts are provided for the 10-year outlook period (2021 to 2030). The
forecasts have been developed for three scenarios – low, base, and high. Broadly, these scenarios reflect
varying views regarding the economic outlook, commodity production, gas prices, and population growth.
The forecasting methodology in the base scenario has been improved with access to more formal
information request (FIR) data.
AEMO has not incorporated the effects of hydrogen in the domestic gas demand forecasts, with the
exception of Hazer Group Limited’s biogas to hydrogen project. AEMO will continue to monitor the progress
of hydrogen for potential inclusion in future WA GSOOs.
All scenarios assume that the following five committed 33 mining and mineral processing projects34 will
contribute approximately 40 TJ/day of gas demand over the outlook period:
• Albemarle Corporation’s Kemerton lithium processing plant is scheduled to commence operation in 202135
after initial delays.
• Rio Tinto’s Gudai-Darri iron ore project, with first production planned for early 202236. A 34 MW PV solar
farm set to be installed in 2021 is expected to offset part of this project’s gas demand37.
• The joint venture project between FMG Magnetite and Formosa Steel IB, the Iron Bridge magnetite
processing project (stage 2), is due to commence in mid-202238, with a ramp up to full production within
12 months.
• Capricorn Metal’s Karlawinda Mine is set to become operational in 202139.
• Kalium Lakes Beyondie Sulphate of Potash (SOP) project is on target to begin production in 202140.
Partially offsetting the demand from the above projects, all scenarios assume that the following two projects
will reduce existing gas demand by approximately 2.4 TJ/day over the outlook period:
• Gold Field’s Agnew Gold mine renewable power project, which commenced operation in May 202041.
• Hazer Group Limited’s biogas to hydrogen and graphite project beginning in 202142.
BHP’s South Flank project is set to commence production from mid-202143. It will fully replace production
from the 80 mtpa Yandi mine and have no impact on net gas demand in any scenario.
33
Committed gas demand projects have attained FID or are already under construction as defined in Appendix A3.2.1.
34
Since the 2019 WA GSOO, one project has been removed, one project added, and one project’s gas demand has been reduced due to the addition of
renewable generation.
35
Albemarle Corporation. “Albemarle Reports Third Quarter Results”, 4 November 2020. Available at: https://investors.albemarle.com/node/22451/pdf.
36
Rio Tinto Limited. “Rio Tinto releases third quarter production results”, 16 October 2020. Available at: https://cdn-api.markitdigital.com/apiman-
gateway/ASX/asx-research/1.0/file/2924-02294524-3A552729?access_token=83ff96335c2d45a094df02a206a39ff4.
37
Rio Tinto Limited. “Rio Tinto to build first solar plant in Western Australia to power iron ore mine”, 16 February 2020. Available at:
https://www.riotinto.com/news/releases/2020/Rio-Tinto-to-build-first-solar-plant-in-Western-Australia-to-power-iron-ore-mine.
38
Fortescue Metals Group Limited. “Strong start to FY21 with record first quarter operating performance”, 29 October 2020. Available at:
https://www.fmgl.com.au/docs/default-source/announcements/2134058.pdf.
39
Capricorn Metals Limited. “Debt Financing Completed and Project Update Karlawinda Gold Project”, 18 December 2019. Available at:
http://capmetals.com.au/wp-content/uploads/2019/12/191218-Financing-finalised.pdf.
40
Kalium Lakes Limited. “Beyondie SOP Project – Update”, 27 October 2020. Available at: https://asx.api.markitdigital.com/asx-research/1.0/file/2924-
02299323-6A1003385?access_token=83ff96335c2d45a094df02a206a39ff4.
41
EDL. “Agnew”. Available at https://edlenergy.com/project/agnew/. Viewed 5 November 2020.
42
Hazer Group Limited. “Hazer Commercial Demonstration Project Final Investment Decision Approval”, 31 July 2020. Available at:
https://hazergroup.com.au/wp-content/uploads/2020/09/200731-FID-Approval-FINAL.pdf.
43
BHP. “BHP Operational Review for the Quarter Ended 30 September 2020”, 20 October 2020. Available at https://www.bhp.com/-/media/documents/
media/reports-and-presentations/2020/201020_bhpoperationalreviewforthequarterended30september2020.pdf?la=en.
© AEMO 2020 | 2020 Western Australia Gas Statement of Opportunities 20The high gas demand scenario also includes five prospective demand projects44, totalling 145 TJ/day of gas
demand by 2025.
Scenario assumptions specific to SWIS GPG gas demand are dependent on the electricity demand forecasts
presented in the 2020 Wholesale Electricity Market (WEM) Electricity Statement of Opportunities (ESOO) 45, as
well as the expected generation mix in the SWIS over the outlook period. In all scenarios, non-SWIS GPG
(including towns like Port Hedland, Karratha, Carnarvon, and Exmouth but excluding mining GPG) represents
roughly 30% of total GPG gas usage (4% of total domestic gas demand). However, limited growth has been
identified in this area, since electricity consumption in these towns is expected to remain relatively stable.
Further discussion on the projected outlooks for individual gas use sectors is provided in Section 2.2.3.
Further information relating to the methodology and assumptions underpinning the GPG and gas demand
scenarios is provided in Appendix A3 and in the commodity forecast46 and SWIS GPG forecast modelling
reports47.
2.2.2 Gas demand forecasts by scenario, 2021 to 2030
AEMO forecasts domestic gas demand to grow at a 10-year average annual rate of 0.7% in the base scenario,
primarily driven by general demand growth in the mining and mineral processing sectors and new committed
major resource projects.
The gas demand forecasts under the low, base, and high scenarios are presented in Figure 4 and Table 6.
Figure 4 Domestic gas demand forecasts (TJ/day), 2021 to 2030
44
Prospective gas demand projects may be developed over the outlook period or may switch fuel type from diesel to gas. To be included in the high
scenario, they must meet set criteria, as defined in Appendix A3.2.1.
45
For further information about the electricity forecasts, see https://aemo.com.au/Electricity/Wholesale-Electricity-Market-WEM/Planning-and-forecasting/
WEM-Electricity-Statement-of-Opportunities.
46
NIEIR. Commodity forecasts for Western Australia to 2030, August 2020. Available at: https://aemo.com.au/energy-systems/gas/gas-forecasting-and-
planning/wa-gas-statement-of-opportunities-wa-gsoo.
47
RBP. Gas powered generation forecast modelling – final report. December 2020. Available at: https://aemo.com.au/energy-systems/gas/gas-forecasting-
and-planning/wa-gas-statement-of-opportunities-wa-gsoo.
© AEMO 2020 | 2020 Western Australia Gas Statement of Opportunities 21Table 6 Domestic gas demand forecasts (TJ/day), 2021 to 2030
Scenario 2021 2022 2023 2024 2025 2026 2027 2028 2029 2030 5-year 10-year
average average
annual annual
growth growth
(%) (%)
Low 1,035 1,048 1,046 1,051 1,061 1,065 1,061 1,054 1,053 1,048 0.6 0.1
Base 1,068 1,080 1,081 1,099 1,116 1,126 1,128 1,128 1,132 1,135 1.1 0.7
High 1,127 1,154 1,159 1,243 1,330 1,346 1,354 1,358 1,367 1,374 4.2 2.2
The impacts of varying assumptions embedded in the gas demand growth scenarios are:
• In the low scenario, due to different commodity outlooks, minerals processing, mining and industrial gas
consumption are lower compared to the base and high scenarios.
• In the base scenario, growth in overall demand is largely driven by an increase in gas consumption in
mining and minerals processing over the outlook period. SWIS GPG gas demand is forecast to fall at an
average annual rate of 0.4%. The entry of two new waste-to-energy generators 48 and declining electricity
consumption forecasts as published in the 2020 WEM ESOO, partly offset by increased GPG generation
due to the retirement of the Muja C power station by 2024, contribute to the decline in SWIS GPG gas
consumption over the outlook period. GPG demand is forecast to grow in both the base and low
scenarios after 2024 due to increased ramping requirements49 associated with behind-the-meter PV and
large-scale intermittent renewable generation.
• In the high scenario, the commencement of five prospective projects50 is forecast to add approximately
145 TJ/day of demand by 2025. The inclusion of prospective projects is the key factor contributing to
higher gas use in the high scenario compared with the base scenario. Despite fewer prospective projects
in the high scenario compared to the 2019 WA GSOO51, the forecasts are higher this year due to a more
favourable commodity outlook.
2.2.3 Gas demand forecasts by usage category
The gas demand forecasts are disaggregated into the following usage categories52:
• Mineral processing.
• Mining.
• GPG (SWIS and non-SWIS).
• Industry (major users such as ammonia, fertiliser, and LPG production).
• Distribution.
This breakdown is shown in Figure 5 and Table 7.
48
Two waste-to-energy facilities are currently under construction in the SWIS; the Phoenix Kwinana Facility and the East Rockingham Resource Recovery
Facility are due to be completed in 2021 and 2022 respectively. For further information see Appendix 3.
49
The difference between minimum and peak demand in the SWIS is widening with increasing uptake of behind-the-meter solar PV and large-scale solar.
This requires generation (usually GPG) that is capable of rapidly increasing output (“ramping”) over a short period of time to meet evening peak demand.
50
Prospective gas demand projects must meet set criteria and are only included in the high scenario. They may either be developed over the outlook period
or switch from diesel to gas.
51
Prospective demand in the 2019 WA GSOO was forecast to add up to 168 TJ/day by 2025.
52
Usage categories were defined in this way because each category is affected by different external and internal influences. Appendix A5 provided a
complete breakdown of how gas consumers were categorised. The mining and minerals processing sectors include GPG located at remote mine sites or
minerals processing facilities.
© AEMO 2020 | 2020 Western Australia Gas Statement of Opportunities 22You can also read