A novel representation of biological nitrogen fixation and competitive dynamics between nitrogen-fixing and non-fixing plants in a land model GFDL ...
←
→
Page content transcription
If your browser does not render page correctly, please read the page content below
Biogeosciences, 18, 4143–4183, 2021
https://doi.org/10.5194/bg-18-4143-2021
© Author(s) 2021. This work is distributed under
the Creative Commons Attribution 4.0 License.

A novel representation of biological nitrogen fixation and
competitive dynamics between nitrogen-fixing and non-fixing plants
in a land model (GFDL LM4.1-BNF)
Sian Kou-Giesbrecht1 , Sergey Malyshev2 , Isabel Martínez Cano3 , Stephen W. Pacala3 , Elena Shevliakova2 ,
Thomas A. Bytnerowicz4 , and Duncan N. L. Menge1
1 Department of Ecology, Evolution and Environmental Biology, Columbia University, New York, 10027, USA
2 Geophysical Fluid Dynamics Laboratory (GFDL), National Oceanic and Atmospheric Administration (NOAA),
Princeton, 08540, USA
3 Department of Ecology and Evolutionary Biology, Princeton University, Princeton, 08544, USA
4 Department of Integrative Biology, The University of Texas, Austin, 78712, USA

Correspondence: Sian Kou-Giesbrecht (sk4220@columbia.edu)

Received: 21 December 2020 – Discussion started: 24 February 2021
Revised: 21 May 2021 – Accepted: 17 June 2021 – Published: 13 July 2021

Abstract. Representing biological nitrogen fixation (BNF)      asymbiotic BNF rate (13 kg N ha−1 yr−1 ) in comparison to
is an important challenge for coupled carbon (C) and nitro-    observations (11 kg N ha−1 yr−1 ). LM4.1-BNF effectively re-
gen (N) land models. Initial representations of BNF in land    produces the temporal dynamics of symbiotic BNF rate:
models applied simplified phenomenological relationships.      LM4.1-BNF simulates a symbiotic BNF pulse in early suc-
More recent representations of BNF are mechanistic and in-     cession that reaches 73 kg N ha−1 yr−1 at 15 years and then
clude the dynamic response of symbiotic BNF to N limita-       declines to ∼ 0 kg N ha−1 yr−1 at 300 years, similarly to ob-
tion of plant growth. However, they generally do not include   served symbiotic BNF, which reaches 75 kg N ha−1 yr−1 at
the competitive dynamics between N-fixing and non-fixing       17 years and then declines to ∼ 0 kg N ha−1 yr−1 in late suc-
plants, which is a key ecological mechanism that determines    cessional forests. As such, LM4.1-BNF can be applied to
ecosystem-scale symbiotic BNF. Furthermore, asymbiotic         project the dynamic response of vegetation to N limitation
BNF is generally not included in land models. Here, we         of plant growth and the degree to which this will constrain
present LM4.1-BNF, a novel representation of BNF (asym-        the terrestrial C sink under elevated atmospheric CO2 con-
biotic and symbiotic) and an updated representation of N cy-   centration and other global change factors.
cling in the Geophysical Fluid Dynamics Laboratory Land
Model 4.1 (LM4.1). LM4.1-BNF incorporates a mechanistic
representation of asymbiotic BNF by soil microbes, a rep-
resentation of the competitive dynamics between N-fixing       1   Introduction
and non-fixing plants, and distinct asymbiotic and symbi-
otic BNF temperature responses derived from corresponding      The terrestrial carbon (C) sink is controlled by the avail-
observations. LM4.1-BNF makes reasonable estimations of        ability of nitrogen (N) for plant growth (Elser et al., 2007;
major carbon (C) and N pools and fluxes and their temporal     LeBauer and Treseder, 2008; Wright et al., 2018). Land mod-
dynamics, in comparison to the previous version of LM4.1       els are applied to project the terrestrial C sink (Arora et
with N cycling (LM3-SNAP) and to previous representations      al., 2020) and are progressively incorporating representations
of BNF in land models generally (phenomenological repre-       of N cycling and N limitation of plant growth (Goll et al.,
sentations and those without competitive dynamics between      2017; Lawrence et al., 2019; Medvigy et al., 2009; Smith et
N-fixing and non-fixing plants and/or asymbiotic BNF) at       al., 2014; Wang et al., 2010; Yang et al., 2009; Zaehle and
a temperate forest site. LM4.1-BNF effectively reproduces      Friend, 2010). However, the degree to which N limitation of

Published by Copernicus Publications on behalf of the European Geosciences Union.
4144                                         S. Kou-Giesbrecht et al.: A novel representation of biological nitrogen fixation

plant growth will constrain the terrestrial C sink under ele-      biotic BNF responds dynamically to N limitation of plant
vated atmospheric CO2 concentration is unresolved (Terrer          growth at both the population scale (via individual-scale
et al., 2019), as there is substantial variation between differ-   regulation of symbiotic BNF rate; Menge et al., 2015) and
ent land models (Wieder et al., 2015b).                            at the community scale (via competitive dynamics between
   The representation of biological N fixation (BNF), the pri-     N-fixing and non-fixing plants; Boring and Swank, 1984;
mary natural input of N to terrestrial ecosystems (Fowler          Chapin III et al., 1994; Menge and Hedin, 2009). Under
et al., 2013; Vitousek et al., 2013), is a key challenge to        strong N limitation, N-fixing plants up-regulate symbiotic
incorporating N cycling into land models because of its            BNF rate and have a competitive advantage over non-fixing
complexity (Davies-Barnard et al., 2020; Meyerholt et al.,         plants, but, under weak N limitation, N-fixing plants down-
2020; Stocker et al., 2016; Thomas et al., 2015; Wieder et         regulate symbiotic BNF rate and are competitively excluded
al., 2015a). BNF occurs in multiple niches across terres-          by non-fixing plants because of the high C cost of symbi-
trial ecosystems: by symbioses between N-fixing bacteria           otic BNF (Gutschick, 1981; Sheffer et al., 2015). As such,
living in root nodules of plants (hereafter, symbiotic BNF)        the competitive dynamics between N-fixing and non-fixing
and by a host of other organisms such as soil microbes,            plants is a key ecological mechanism that could determine
bryophytes, and lichens (hereafter, asymbiotic BNF for sim-        ecosystem-scale symbiotic BNF. Finally, the abundance of
plicity although some of these organisms are symbiotic asso-       N-fixing trees is spatially variable (Menge et al., 2019; Stac-
ciations; see Reed et al., 2011). Symbiotic BNF and asym-          cone et al., 2020), but its representation is not possible in land
biotic BNF are regulated by a myriad of abiotic and biotic         models that represent a single general plant C pool capable of
controls, which vary temporally, spatially, and among differ-      BNF, although it is necessary to accurately estimate regional
ent niches (Zheng et al., 2019). In particular, symbiotic BNF      symbiotic BNF.
responds dynamically to N limitation of plant growth: it is           Asymbiotic BNF is generally not included in coupled C–
up-regulated under N limitation of plant growth and down-          N land models. However, asymbiotic BNF is an important
regulated under non-N limitation of plant growth (Vitousek         natural input of N to terrestrial ecosystems: in some ter-
et al., 2013). BNF could, as such, be pivotal to overcoming        restrial ecosystems, asymbiotic BNF is on par with symbi-
N limitation of plant growth under elevated atmospheric CO2        otic BNF, and asymbiotic BNF has been suggested to ac-
concentration (Liang et al., 2016; Terrer et al., 2016, 2018).     count for a substantial proportion of global BNF (Reed et
   Many coupled C–N land models use the empirical rela-            al., 2011). Phenomenological representations of BNF merge
tionship of BNF with either net primary production (NPP;           asymbiotic and symbiotic BNF, although they are regulated
Goll et al., 2017) or evapotranspiration (ET; B. Smith et al.,     by different controls (Zheng et al., 2019). Mechanistic rep-
2014; Yang et al., 2009; Zaehle and Friend, 2010) to repre-        resentations of BNF merge asymbiotic and symbiotic BNF
sent BNF. However, these are simplified phenomenological           (e.g., LM3-SNAP; Sulman et al., 2019), represent asymbi-
relationships that are not based on the ecological mechanisms      otic BNF as a constant from averaged observations (e.g.,
underlying BNF (Cleveland et al., 1999). Furthermore, im-          CABLE; Wang and Houlton, 2009), or represent asymbiotic
plementing and comparing a NPP-based and ET-based rep-             BNF phenomenologically as a function of ET (e.g., CLM5;
resentation of BNF within a land model (CLM5) resulted             Lawrence et al., 2019). Importantly, although asymbiotic and
in projections of the terrestrial C sink that differed by 50 Pg    symbiotic BNF exhibit different temperature responses (Byt-
C in 2100 under the Representative Concentration Pathway           nerowicz et al., 2021), the symbiotic BNF temperature re-
8.5 (RCP8.5; Wieder et al., 2015a). Finally, a recent meta-        sponse is, when included, derived primarily from asymbiotic
analysis of BNF found no evidence for the empirical rela-          BNF observations (Houlton et al., 2008), and the asymbiotic
tionship of BNF with either NPP or ET (Davies-Barnard and          BNF temperature response is omitted.
Friedlingstein, 2020).                                                Here, we present LM4.1-BNF, a novel representation of
   Recent coupled C–N land models have simulated sym-              BNF and an updated representation of N cycling in the GFDL
biotic BNF mechanistically rather than phenomenologically          land model 4.1 (LM4.1; Shevliakova et al., 2021). LM4.1 in-
as responding dynamically to N limitation of plant growth.         cludes height-structured competition for light and water be-
The Geophysical Fluid Dynamics Laboratory (GFDL) Land              tween plant cohorts using the perfect plasticity approxima-
Model 3 (LM3) can include the Symbiotic Nitrogen Acqui-            tion (Martinez Cano et al., 2020; Purves et al., 2008; Strigul
sition by Plants (SNAP) model (Sulman et al., 2019), in            et al., 2008; Weng et al., 2015). LM4.1-BNF builds on the
which plant C allocation to N-fixing bacteria is optimized         framework of LM4.1, including competition for light, wa-
to maximize plant growth. However, LM3-SNAP and other              ter, and N between plant cohorts that associate with N-fixing
land models that have implemented a mechanistic represen-          bacteria and non-fixer plant cohorts. LM4.1-BNF introduces
tation of symbiotic BNF, such as CLM5 (Lawrence et al.,            several improvements to the representation of N cycling in
2019), CABLE (Haverd et al., 2018; Peng et al., 2020; Wang         LM3-SNAP by incorporating novel representations of the
et al., 2010), and E3SM (Zhu et al., 2019), represent a sin-       following ecological mechanisms.
gle general plant C pool capable of BNF and cannot rep-
resent community dynamics. In observed ecosystems, sym-

Biogeosciences, 18, 4143–4183, 2021                                                   https://doi.org/10.5194/bg-18-4143-2021
S. Kou-Giesbrecht et al.: A novel representation of biological nitrogen fixation                                          4145

 1. Symbiotic BNF and competitive dynamics between N-            and non-fixing plants. We compare LM4.1-BNF simulations
    fixing and non-fixing plants. Plant cohorts with a N-fixer   with both Robinia and Acer to LM4.1-BNF simulations with
    vegetation type conduct symbiotic BNF and compete            only Acer and LM4.1-BNF simulations with only Acer that
    with plant cohorts with a non-fixer vegetation type.         can associate with N-fixing bacteria, which are representative
                                                                 of land models that represent a single general plant C pool ca-
 2. Asymbiotic BNF. Soil microbes conduct asymbiotic             pable of BNF and cannot represent community dynamics. In
    BNF, as well as decomposition, nitrification, and den-       the third analysis, we examine the role of asymbiotic BNF.
    itrification.                                                We compare LM4.1-BNF simulations with asymbiotic BNF
 3. BNF temperature response. Asymbiotic and symbiotic           to LM4.1-BNF simulations without asymbiotic BNF, which
    BNF have different temperature responses derived from        is representative of land models that do not include asymbi-
    asymbiotic BNF observations (Houlton et al., 2008) and       otic BNF.
    symbiotic BNF observations (Bytnerowicz et al., 2021)
    respectively.
                                                                 2     Model description
 4. N limitation. N limitation is determined by current
    stored non-structural N relative to the demand for non-      2.1    Overview of a land tile and vegetation types
    structural N. N limitation increases active root uptake of
    inorganic N and decreases root N exudation following         We provide an overview of LM4.1-BNF with a focus on the
    observations (Canarini et al., 2019; Nacry et al., 2013).    novel elements relative to LM4.1 (Shevliakova et al., 2021)
                                                                 and LM3-SNAP (Sulman et al., 2019). A complete descrip-
 5. Dynamic plant C allocation to growth and N uptake. N
                                                                 tion of LM4.1-BNF is available in Appendix A. Note that
    limitation decreases the growth of leaves, sapwood, and
                                                                 LM4.1 can be coupled with the GFDL atmosphere model to
    seeds, proportionally increasing the growth of fine roots
                                                                 serve as a base for the GFDL climate and Earth system mod-
    following observations (Poorter et al., 2012). N limita-
                                                                 els (Zhao et al., 2018a, b).
    tion stimulates C allocation to N uptake (including sym-
                                                                    LM4.1-BNF consists of a grid, in which grid cells are ap-
    biotic BNF) relative to growth. C limitation, which is
                                                                 proximately 100 km by 100 km. LM4.1-BNF represents the
    determined by current stored non-structural C relative
                                                                 heterogeneity of the land surface as a mosaic of land tiles
    to the demand for non-structural C, stimulates C allo-
                                                                 within a grid cell. Each land tile represents a fraction of the
    cation to growth relative to N uptake. Thereby, plant C
                                                                 grid cell area and does not have an associated location within
    allocation is optimized to maximize growth following
                                                                 the grid cell. A land tile may represent natural vegetation at
    observations (Rastetter and Shaver, 1992).
                                                                 a given stage of recovery post-disturbance, urban area, pas-
We focus our analysis on temperate forests which are gen-        tureland, rangeland, or cropland. Land tiles are created dy-
erally N-limited (Elser et al., 2007; LeBauer and Treseder,      namically due to a disturbance, such as human land use, fire,
2008). We parameterize a N-fixer vegetation type based           or natural mortality of vegetation.
on Robinia pseudoacacia (black locust), which is the most           A land tile contains multiple plant cohorts that compete for
abundant N-fixing tree species in the coterminous United         light and water following the perfect plasticity approxima-
States, accounting for 64 % of tree-associated BNF in the        tion (Martinez Cano et al., 2020; Purves et al., 2008; Strigul
coterminous United States (Staccone et al., 2020). We com-       et al., 2008; Weng et al., 2015) and compete for N (presented
pare Robinia to a non-fixer vegetation type based on Acer        below). Plant cohorts consist of identical individual trees be-
rubrum (red maple), which is the most abundant non-fixing        longing to a vegetation type that occupy a given canopy layer
tree species in the north region of the coterminous United       and that have a spatial density (determined by recruitment
States (Oswalt et al., 2019). We evaluate LM4.1-BNF at           and mortality). A vegetation type can be associated with ex-
Coweeta Hydrologic Laboratory in North Carolina, United          clusively arbuscular mycorrhizae (AM), exclusively ectomy-
States, which has observations on symbiotic BNF by Robinia       corrhizae (EM), both AM and N-fixing bacteria, or both EM
(Boring and Swank, 1984).                                        and N-fixing bacteria. A land tile can contain multiple plant
   We conduct three analyses to assess the performance of        cohorts of the same or of different vegetation types. As such,
LM4.1-BNF in estimating major C and N pools and fluxes           there is intraspecific competition (among plant cohorts of the
in comparison to previous representations of BNF in land         same vegetation type within a tile) and interspecific competi-
models generally. In the first analysis, we compare mech-        tion (among plant cohorts of different vegetation types within
anistic and phenomenological representations of BNF. We          a tile). Growth is based on allometric equations (Eqs. A40–
compare LM4.1-BNF (with BNF represented mechanisti-              A42) and is modulated by N availability. Recruitment and
cally as described above) to LM4.1-BNF with BNF repre-           mortality follow Weng et al. (2015) and Martinez Cano et al.
sented as a function of NPP and to LM4.1-BNF with BNF            (2020) and are not directly influenced by N availability but
represented as a function of ET. In the second analysis, we      are indirectly influenced by N availability via its effect on
examine the role of competitive dynamics between N-fixing        growth.

https://doi.org/10.5194/bg-18-4143-2021                                                 Biogeosciences, 18, 4143–4183, 2021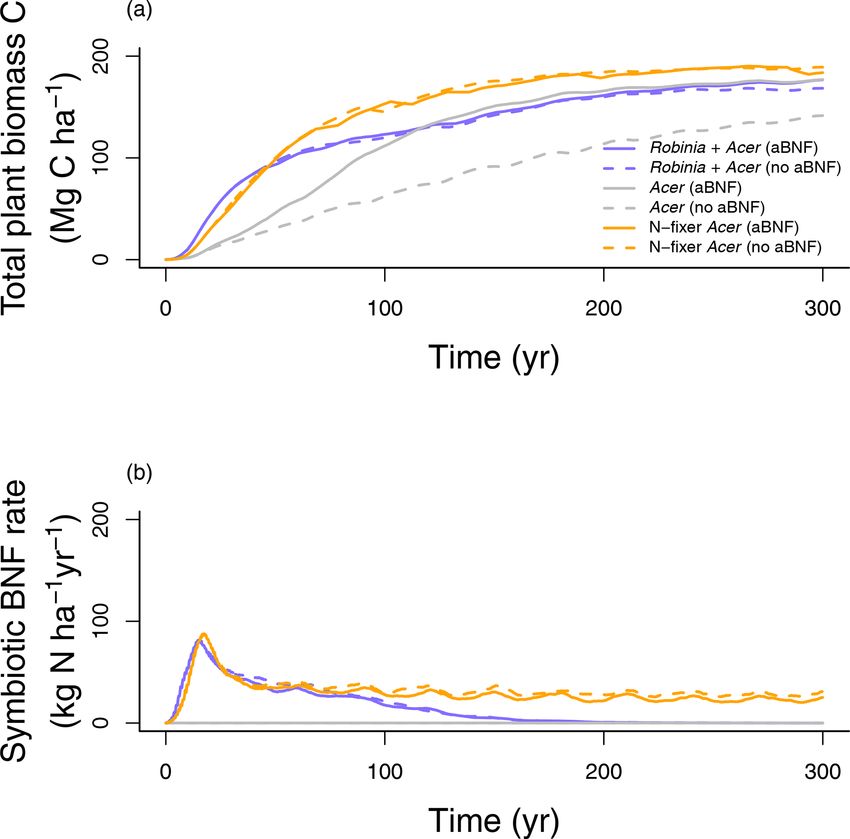
4146                                          S. Kou-Giesbrecht et al.: A novel representation of biological nitrogen fixation

Table 1. Key parameter differences between vegetation types. See Table D1 for remaining vegetation-type-specific parameters.

  Vegetation type          Leaf C : N ratio   Maximum rate of carboxylation (Vcmax ) at 15 ◦ C      Wood C density        Leaf mass per area
  Acer rubrum              30 kg C kg N−1                                    17 µmol m−2 s−1           340 kg C m−3         0.0482 kg C m−2
  Robinia pseudoacacia     14 kg C kg N−1                                    23 µmol m−2 s−1           280 kg C m−3         0.0380 kg C m−2

   There are six plant tissue C and N pools: leaf, fine root,            The symbiotic BNF rate by N-fixing bacteria (NNfix ;
sapwood, heartwood, seed, and non-structural C or N. The               [kg N indiv−1 yr−1 ]) is
C : N ratios of the leaf, fine root, sapwood, heartwood, and
seed tissue pools are fixed (for a given vegetation type) (Ta-         NNfix = rNfix BNfix fs (T ),                                        (1)
bles 1, D1, and D2). There are three soil organic C and N              where rNfix is a rate constant, BNfix is the biomass C of
pools (labile plant-derived, labile microbe-derived, and recal-        the nodule (includes both plant and N-fixing bacteria tissue)
citrant) and two soil inorganic N pools (ammonium (NH+        4)       [kg N indiv−1 ], and fs (T ) is the soil temperature dependence
and nitrate (NO− 3 )) in each soil layer. There are 20 soil lay-       function. For Robinia,
ers of varying thickness to a total depth of 10 m. Soil C and
N are transferred between soil layers via leaching. The soil                                 45.67 − (T − 273.15)
                                                                       fs (T ) =max 0.0,
C : N ratio is not fixed. Figure 1 displays a diagram of key C                                   45.67 − 31.89
and N pools and fluxes.                                                                                   31.89−1.43
   We define a N-fixer vegetation type with a parameteriza-                       (T − 273.15) − 1.43 45.67−31.89
                                                                                                                        ,          (2)
tion based on Robinia pseudoacacia and a non-fixer vege-                              31.89 − 1.43
tation type with a parameterization based on Acer rubrum.
                                                                       where T is the average soil temperature across soil layers
Both Acer and Robinia associate with AM. We used the
                                                                       [K]. This function reaches its maximum at 31.9 ◦ C (Fig. 2). It
US Forest Inventory and Analysis (FIA) database (US For-
                                                                       is a modified beta distribution function (Yan and Hunt, 1999)
est Service, 2020a), the US FIA Forest Health Monitoring
                                                                       and is derived from Bytnerowicz et al. (2021).
database (US Forest Service, 2020b), and the Biomass and
                                                                          Respiration associated with symbiotic BNF is
Allometry Database (BAAD; Falster et al., 2015) to param-
                                                                       costNfix NNfix , where costNfix is the C cost of symbiotic
eterize the allometries of these vegetation types (Eqs. A40–
                                                                       BNF per unit N (Eq. A52).
A42; Appendices B and C). The vegetation types also dif-
                                                                          Note that the description of EM is included although both
fered in other key traits (Table 1). In particular, the C : N
                                                                       Acer and Robinia associate with AM.
ratio of leaves differed between vegetation types that asso-
ciated with AM, EM, and N-fixing bacteria (Adams et al.,               2.3   Asymbiotic BNF
2016; Averill et al., 2019). See Table D1 for all vegetation-
type-specific parameters. Other model parameters are from              Soil microbes are represented as a single C pool that con-
Weng et al. (2015) or Sulman et al. (2019) or are derived              ducts decomposition, nitrification, denitrification, and asym-
from published observations (Appendix C). Some parame-                 biotic BNF. The rates of C and N decomposition, rates of C
ters were not well constrained by available observations and           and N decomposition during denitrification, rates of change
were tuned to fit to observed patterns of C and N cycling in           of biomass C and N, and maintenance respiration rate of soil
temperate forests (Appendix C). See Table D2 for general               microbes follow LM3-SNAP (Eqs. A11–A19). The N sur-
parameters.                                                            plus or deficit of soil microbes and C and N growth rates
                                                                       of soil microbes are modified to include asymbiotic BNF
2.2    Symbiotic BNF and N uptake by roots, AM, and                    (Eqs. A22–A24).
       EM                                                                 The asymbiotic BNF rate of soil microbes in soil layer k
                                                                       (NNfix asymb (k); [kg N m−2 yr−1 ]) is
All vegetation types take up inorganic N via passive and ac-
                                                                       NNfix asymb (k) = rNfix asymb CM (k)fa (T (k)) ,                    (3)
tive root uptake. Passive root uptake of inorganic N follows
LM3-SNAP (Eq. A1). Active root uptake of inorganic N fol-              where rNfix asymb is a rate constant, CM (k) is the biomass C
lows LM3-SNAP but is modified to increase with N stress                of soil microbes in soil layer k [kg C m−2 ], and fa (T (k)) is
following observations (Nacry et al., 2013) (described in fur-         the soil temperature dependence function.
ther detail below; Eq. 16). AM takes up inorganic N follow-
ing LM3-SNAP (Eq. A4). EM decomposes and takes up or-                                   −2.6+0.21(T (k)−273.15) 1− 0.5(T (k)−273.15)
                                                                                                                          24.4
                                                                       fa (T (k)) = e                                                      (4)
ganic C and N following LM3-SNAP but is modified to addi-
tionally take up inorganic N following observations (Phillips          This function reaches its maximum at 24.4 ◦ C (Fig. 2). It is
et al., 2013) (Eq. A8).                                                a modified normal distribution function and is derived from

Biogeosciences, 18, 4143–4183, 2021                                                          https://doi.org/10.5194/bg-18-4143-2021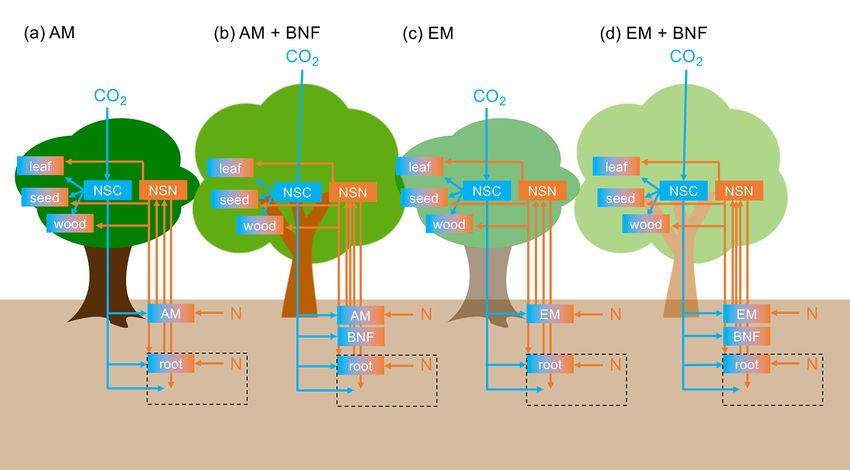
S. Kou-Giesbrecht et al.: A novel representation of biological nitrogen fixation                                                        4147

Figure 1. Diagram of key C and N pools (boxes) and fluxes (arrows). C pools and fluxes are indicated in blue. N pools and fluxes are
indicated in orange. NSC represents non-structural C and NSN represents non-structural N. Orange and blue boxes have a fixed C : N ratio.
Plant turnover, symbiont turnover, and soil C and N pools and fluxes are not displayed for visual clarity. The black dashed box represents the
rhizosphere. (a) Vegetation type that associates with arbuscular mycorrhizae (AM). (b) Vegetation type that associates with AM and N-fixing
bacteria. (c) Vegetation type that associates with ectomycorrhizae (EM). (d) Vegetation type that associates with EM and N-fixing bacteria.

                                                                         the observations compiled by Houlton et al. (2008) with the
                                                                         study of symbiotic BNF removed (Schomberg and Weaver,
                                                                         1992) and is normalized to a maximum of 1.

                                                                         2.4    N limitation, plant C allocation to growth, and
                                                                                plant C allocation to rhizosphere priming

                                                                         The non-structural C pool (NSC; [kg C indiv−1 ]) gains C
                                                                         from photosynthesis. NSC loses C to respiration and C allo-
                                                                         cation to growth, symbionts, and root C exudation. The rate
                                                                         of change of NSC ( dNSC
                                                                                              dt ; [kg C indiv
                                                                                                              −1 −1
                                                                                                                yr ]) is

                                                                          dNSC
                                                                               = P − R − GC,l + GC,r + GC,sw + GC,seed
                                                                           dt
                                                                                 − Calloc − LC,exudate ,                                  (5)

                                                                         where P is the photosynthesis rate [kg C indiv−1 yr−1 ],
                                                                         R is the respiration rate (maintenance and growth)
                                                                         [kg C indiv−1 yr−1 ], GC,l is the growth rate of the leaf C
                                                                         pool (Cl ; [kg C indiv−1 ]) [kg C indiv−1 yr−1 ], GC,r is the
                                                                         growth rate of the fine-root C pool (Cr ; [kg C indiv−1 ])
Figure 2. Soil temperature dependence function of asymbiotic BNF         [kg C indiv−1 yr−1 ], Csw is the growth rate of the sapwood
and symbiotic BNF by Robinia. Asymbiotic BNF reaches its max-            C pool (Csw ; [kg C indiv−1 ]) [kg C indiv−1 yr−1 ], GC,seed
imum at 24.4 ◦ C and is derived from Houlton et al. (2008). Symbi-       is growth rate of the seed C pool (Cseed ; [kg C indiv−1 ])
otic BNF by Robinia reaches its maximum at 31.9 ◦ C and is derived       [kg C indiv−1 yr−1 ], Calloc is the rate of C allocation to sym-
from Bytnerowicz et al. (2021).                                          bionts (Eqs. A43–A46), and LC,exudate is the rate of root
                                                                         C exudation (Eq. A38). Note that sapwood is converted to
                                                                         heartwood following Martinez Cano et al. (2020).

https://doi.org/10.5194/bg-18-4143-2021                                                           Biogeosciences, 18, 4143–4183, 2021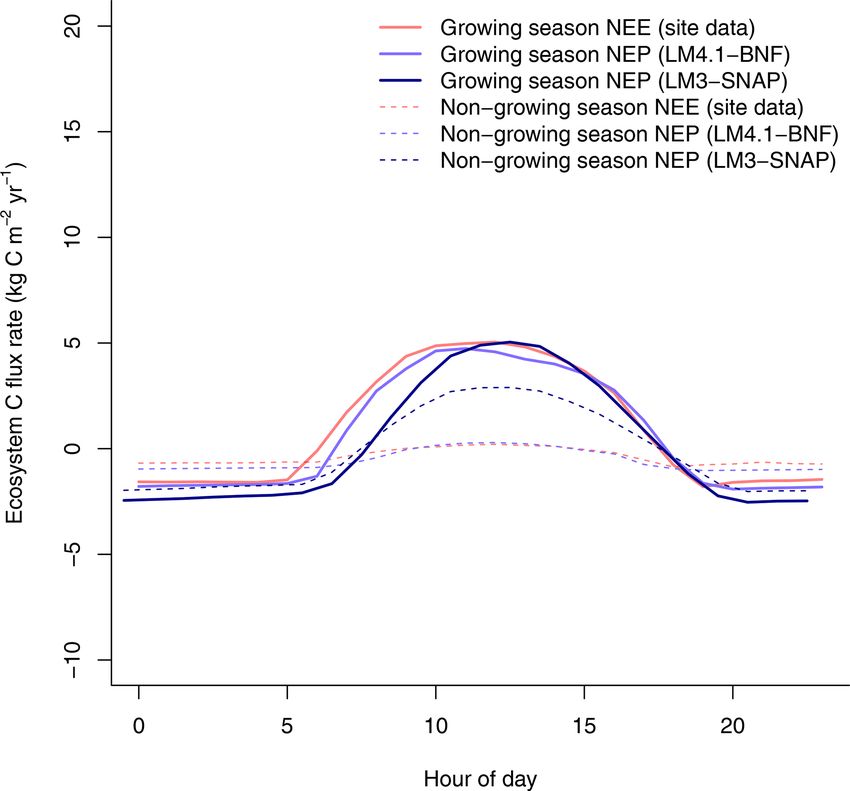
4148                                          S. Kou-Giesbrecht et al.: A novel representation of biological nitrogen fixation

   The non-structural N pool (NSN; [kg N indiv−1 ]) gains N          where NSNtarget is the target NSN [kg N indiv−1 ]. Nstress is
from N uptake via roots and symbionts. NSN loses N to N              smoothed with a low-pass filter over 30 d to reflect the per-
allocation to growth, symbionts, and root N exudation. The           sisting influence of N stress (Mooney et al., 1991). NSNtarget
rate of change of NSN ( dNSN
                         dt ; [kg N indiv
                                         −1 −1
                                           yr ]) is                  is calculated as
                                                                                 NSCtarget
dNSN          GC,l     GC,r     GC,sw   GC,seed                      NSNtarget =             .                                        (13)
     =U−           +          +       +                                             C : Nl
 dt          C : Nl C : Nr C : Nsw C : Nseed
      − Nalloc − LN,exudate ,                     (6)                This is similar to LM3-SNAP, which compared the target leaf
                                                                     and root N pools to NSN, but is modified to reflect the treat-
where U is the N uptake rate via roots and symbionts                 ment of NSCtarget in LM4.1 by including the target sapwood
(Eq. A55) [kg N indiv−1 yr−1 ], C : Nl is the fixed C : N ra-        and seed N pools.
tio of leaves, C : Nr is the fixed C : N ratio of fine roots,           Plant turnover decreases Cl , Cr , and Csw and from Nl , Nr ,
C : Nsw is the fixed C : N ratio of sapwood, C : Nseed is the        and Nsw at a constant tissue-specific rate. A fraction of the
fixed C : N ratio of seeds, Nalloc is the rate of N allocation       turnover of Cl and Nl is retranslocated into NSC and NSN
to symbionts (Eq. A47), and LN,exudate is the rate of root N         respectively.
exudation (Eq. A39).                                                    Under N limitation, plants increase root C exudation to
   Non-N-limited growth is calculated according to Weng et           stimulate N mineralization in the rhizosphere (rhizosphere
al. (2015) and Martinez Cano et al. (2020). The total allo-          priming; Cheng et al., 2014; Finzi et al., 2015). LC,exudate
cation of NSC to growth is determined by the target NSC              increases with Nstress and is calculated as
(NSCtarget ; [kg C indiv−1 ]) and minimizes the deviation be-
tween NSC and NSCtarget . NSCtarget is a multiple of the tar-        LC,exudate = rleakage,C NSC Nstress ,                            (14)
get Cl (Cl,target ; [kg C indiv−1 ]), which reflects the ability
of a plant to refoliate after defoliation (Hoch et al., 2003;        where rleakage,C is a rate constant.
Richardson et al., 2013), and is calculated as                         Under N limitation, plants decrease root N exudation (Ca-
                                                                     narini et al., 2019). LN,exudate decreases with Nstress and is
NSCtarget = qCl,target ,                                      (7)    calculated as

where q is a proportionality constant. The allocation of NSC         LN,exudate = rleakage,N NSN (1 − Nstress ) ,                     (15)
to the growth of each tissue depends on the total allocation
                                                                     where rleakage,N is a rate constant.
of NSC to growth and the target C pool of each tissue and
                                                                        Under N limitation, plants increase active root uptake
minimizes the deviation between the C pool of each tissue
                                                                     of inorganic N (Nacry et al., 2013). The rate of active
and the target C pool of each tissue. The target C pool of each
                                                                     root uptake of inorganic N in soil layer k (Nactive (k);
tissue is dynamic and is determined by allometry (Eqs. A40–
                                                                     [kg N indiv−1 yr−1 ]) increases with Nstress and is calculated
A42), canopy position, and phenology.
                                                                     as
   In LM4.1-BNF, GC,l , GC,r , GC,sw , and GC,seed are ad-
justed to include N limitation and are calculated as                 Nactive (k) = f (NO3 (k), NH4 (k), frhiz (k)) Nstress ,          (16)
GC,l = (1 − Nstress )1l ,                                     (8)    where f (NO3 (k), NH4 (k), frhiz (k)) is a function of the NH+ 4
GC,r = 1r ,                                                   (9)    pool in soil layer k (NH4 (k); [kg N m−2 ]), the NO−  3 pool in
GC,sw = (1 − Nstress )1sw ,                                  (10)    soil layer k (NO3 (k); [kg N m−2 ]), and the rhizosphere vol-
                                                                     ume fraction of soil layer k (frhiz (k); [m3 m−3 ]) and is given
GC,seed = (1 − Nstress )1seed ,                              (11)
                                                                     in Eq. (A3).
where Nstress is N stress [unitless] and 1l , 1r , 1sw , and 1seed   2.5   Plant C allocation to symbionts (AM, EM, and
are the non-N-limited growth rates of Cl , Cr , Csw , and Cseed            N-fixing bacteria)
respectively [kg C indiv−1 yr−1 ] following Weng et al. (2015)
and Martinez Cano et al. (2020). Because plants increase             The rate of C allocation                 to    AM         (Calloc,AM ;
C allocation to fine roots relative to other tissues when N-         [kg C indiv−1 yr−1 ]) is
limited (Poorter et al., 2012), GC,r is not adjusted to include
N limitation.                                                        Calloc,AM = falloc,AM NSC,                                       (17)
   In LM4.1-BNF, Nstress is the relative difference between
NSN and NSNtarget and is calculated as                               where falloc,AM is the fraction of NSC allocated to AM per
                                                                   unit time. Calloc,AM is not related to Nstress because, although
                 NSNtarget − NSN                                     AM increases N uptake, AM is maintained by the plant pri-
Nstress = max 0,                   ,                         (12)
                   NSNtarget                                         marily for phosphorus uptake (Smith and Smith, 2011).

Biogeosciences, 18, 4143–4183, 2021                                                      https://doi.org/10.5194/bg-18-4143-2021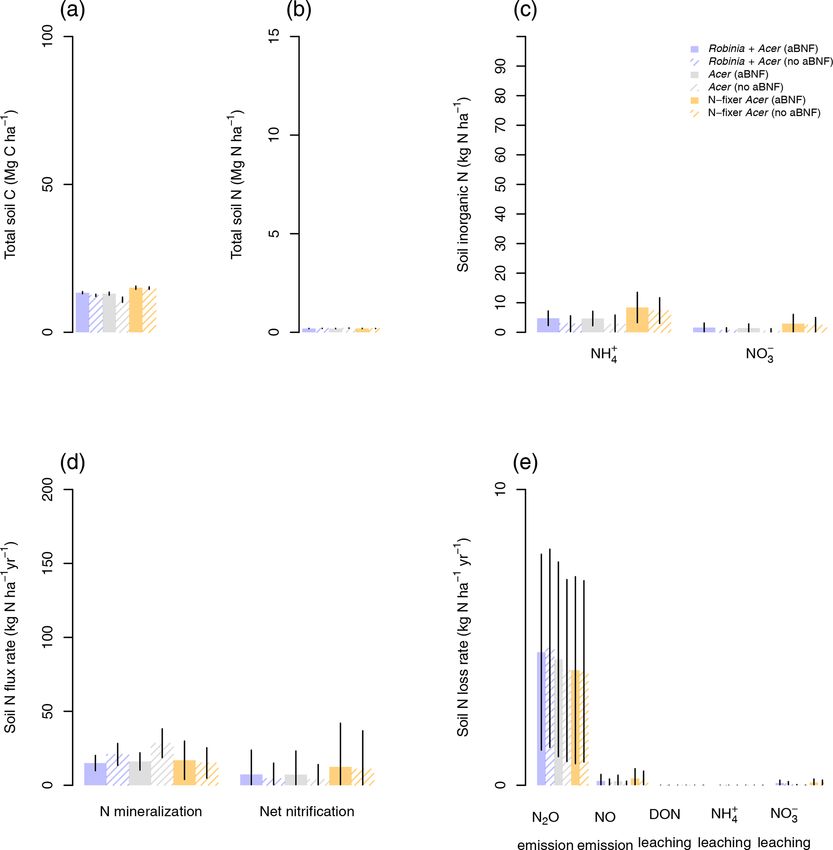
S. Kou-Giesbrecht et al.: A novel representation of biological nitrogen fixation 4149
The rate of C allocation to EM (Calloc,EM ; 2.7 Soil N2 O and NO emissions
[kg C indiv−1 yr−1 ]) is
Soil N2 O and NO emissions occur during nitrification (aer-
Calloc,EM = falloc,EM NSC Nstress , (18) obic oxidation of NH+ 4 with oxygen as an electron acceptor,
where falloc,EM is the maximum fraction of NSC allocated to which produces N2 O and NO as by-products) and denitri-
EM per unit time. Calloc,EM is a function of Nstress because fication (anaerobic oxidation of organic C with NO− 3 as an
biomass C of EM increases with N limitation (Phillips et al., electron acceptor, which produces N2 O as a by-product).
2013). Following LM3V-N (Huang and Gerber, 2015), soil N2 O
Plants that associate with N-fixing bacteria can regulate emission rate in soil layer k (N2 O(k); [kg N m−2 yr−1 ]) is
symbiotic BNF to different extents, termed their BNF strat- N2 O(k) = 0.004 nit(k)
egy (Menge et al., 2015). For plants with a perfectly facul-
tative BNF strategy, symbiotic BNF increases with N limita- NO3 (k)
+1 1 + max 3.52, 22 exp −0.8
tion. For plants with an incomplete BNF strategy, symbiotic HR(k)
BNF increases with N limitation but is maintained at a min-
θ (k)
imum. For plants with an obligate BNF strategy, symbiotic · max 0.1, 0.015 − 0.32 denit(k) , (22)
θsat
BNF is constant. For plants with either a facultative or an in-
complete BNF strategy, the rate of C allocation by the plant where nit(k) is nitrification rate in soil layer k
to N-fixing bacteria (Calloc,Nfix ; [kg C indiv−1 yr−1 ]) is [kg N m−2 yr−1 ] (Eq. A56), HR(k) is heterotrophic res-
piration in soil layer k [kg C m−2 yr−1 ], θ (k) is volumetric
Calloc,Nfix = max falloc,Nfix NSC Nstress , falloc,Nfix,min NSC , (19) soil water content of soil layer k [m3 m−3 ], θsat is saturation
where falloc,Nfix is the fraction of NSC allocated to N- volumetric soil water content, and denit(k) is denitrification
fixing bacteria per unit time, and falloc,Nfix,min is the mini- rate in soil layer k [kg N m−2 yr−1 ] (Eq. A57).
mum fraction of NSC allocated to N-fixing bacteria per unit Following LM3V-N (Huang and Gerber, 2015), soil NO
time. For plants with a perfectly facultative BNF strategy emission rate in soil layer k (NO(k); [kg N m−2 yr−1 ]) is
falloc,Nfix,min = 0, and for plants with an incomplete down-
θ (k)
4/3
35.5tan−1 0.68π 2.09 1 − θsat − 1.68
regulator BNF strategy falloc,Nfix,min > 0. Robinia has an in-
NO(k) = 0.004
15.2 +
complete down-regulator BNF strategy. π
For plants with an obligate BNF strategy, Calloc,Nfix is
· nit(k). (23)
Calloc,Nfix = falloc,Nfix NSC. (20)
2.8 Phenomenological representations of BNF
Additionally, plants allocate a small quantity of N to sym- (LM4.1-BNFNPP and LM4.1-BNFET )
bionts such that symbiont growth can be initiated. The rate
of N allocation by the plant to symbionts (Nalloc,j ; j = AM, To compare mechanistic and phenomenological representa-
EM, N-fixing bacteria; [kg N indiv−1 yr−1 ]) is tions of BNF in our first analysis, we developed LM4.1-
Calloc,j BNFNPP and LM4.1-BNFET which have phenomenological
Nalloc,j = , (21) representations of BNF. In LM4.1-BNFNPP , BNF is rep-
C : Nalloc
resented as a function of NPP in LM4.1-BNF. BNF rate
where C : Nalloc is the C : N ratio of C and N allocated to (BNFNPP ; [kg N m−2 ]) is
symbionts by the plant.
Plant C allocation to symbionts increases biomass C of BNFNPP = aNPP 1 − ebNPP NPP , (24)
symbionts, which increases plant N uptake via symbionts
(Appendices A1 and A6). where NPP is net primary production [kg C m−2 yr−1 ], and
aNPP and bNPP are constants from Meyerholt et al. (2016).
2.6 Dynamic plant C allocation to growth and N uptake In LM4.1-BNFET , BNF is represented as a function of ET
in LM4.1-BNF. BNF rate (BNFET ; [kg N m−2 ]) is
The order of plant C allocation to growth, symbionts, and
BNFET = aET ET + bET , (25)
rhizosphere priming is determined by C limitation relative to
N limitation (Cheng et al., 2014; Finzi et al., 2015; Poorter where ET is evapotranspiration [mm yr−1 ],
and aET and bET
et al., 2012; Treseder, 2004; Zheng et al., 2019). If a plant are constants from Meyerholt et al. (2016).
is more C-limited than N-limited, NSC < NSN·C : Nleaf , the BNFNPP and BNFET enter NH4 (k) (distributed across all
plant allocates C to growth, then to N-fixing bacteria (if asso- soil layers proportional to thickness). In LM4.1-BNFNPP and
ciated) and EM (if associated), and then to rhizosphere prim- LM4.1-BNFET , growth and turnover of symbionts and plant
ing, and finally to AM. If a plant is more N-limited than C- C allocation to symbionts do not occur, and asymbiotic BNF
limited, NSC > NSN · C : Nleaf , the plant allocates C to N- does not occur. All other components of C and N cycling in
fixing bacteria (if associated) and EM (if associated), then to LM4.1-BNFNPP and LM4.1-BNFET are the same as LM4.1-
rhizosphere priming, then to growth, and finally to AM. BNF.
https://doi.org/10.5194/bg-18-4143-2021 Biogeosciences, 18, 4143–4183, 2021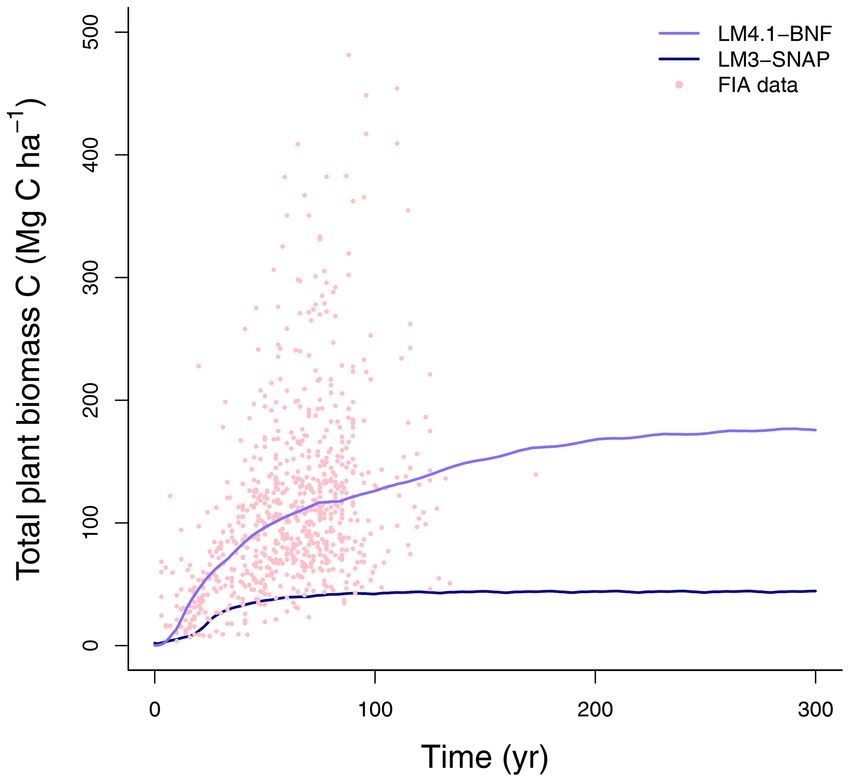
4150 S. Kou-Giesbrecht et al.: A novel representation of biological nitrogen fixation
3 Numerical experiments and evaluation description
3.1 Numerical experiments description
We ran numerical experiments for the grid cell containing
Coweeta Hydrological Laboratory (CHL) in North Carolina,
United States (35.05◦ N, 83.45◦ W), which is part of the
Long-Term Ecological Research Network and has observa-
tions on symbiotic BNF by Robinia (Boring and Swank,
1984).
We ran the LM4.1-BNF spin-up for 1000 years at pre-
industrial atmospheric CO2 concentration (284.26 ppm) to
allow the soil C and N pools to reach an approximate steady
state. Then, we initialized LM4.1-BNF, LM4.1-BNFNPP , and
LM4.1-BNFET numerical experiments with seedlings (re-
moved vegetation C and N pools from the LM4.1-BNF spin-
up) and the LM4.1-BNF spin-up soil C and N pools. We ran
numerical experiments for another 300 years at current atmo-
spheric CO2 concentration (324.53 ppm). See Table D3 for a
summary of atmospheric CO2 concentration (Dlugokencky
and Tans, 2020; Meinshausen et al., 2017), meteorological Figure 3. Simulated BNF rate by LM4.1-BNF and LM3-SNAP. (a)
forcings (Sheffield et al., 2006), and N deposition rates (Den- Simulated asymbiotic BNF rate compared to CHL site data. Sim-
tener, 2006) used in the spin-up and numerical experiments. ulated data are averaged over the last 100 years of the 300 years
of simulation to reflect the site data which are from mature forests.
We initialized the LM4.1-BNF spin-up with Acer seedlings,
Error bars indicate 2 standard deviations. (b) Simulated symbiotic
and we initialized LM4.1-BNF numerical experiments with BNF rate over time compared to CHL site data for a 4, 17, and
both Acer and Robinia seedlings. 38 years and mature forest (plotted at 300 years).
To compare mechanistic and phenomenological represen-
tations of BNF in our first analysis (Table 2), we initialized
LM4.1-BNFNPP and LM4.1-BNFET numerical experiments LM3-SNAP numerical experiments with a temperate decid-
with only Acer seedlings. To examine the role of competi- uous vegetation type.
tive dynamics between N-fixing and non-fixing plants in our
second analysis (Table 2), we initialized LM4.1-BNF nu- 3.2 Evaluation description
merical experiments with both Acer and Robinia seedlings,
only Acer seedlings, or only Acer seedlings that can associate To evaluate the performance of LM4.1-BNF in represent-
with N-fixing bacteria (N-fixer Acer). To examine the role of ing symbiotic BNF, we compared symbiotic BNF rate from
asymbiotic BNF in our third analysis (Table 2), we initial- the numerical experiments of LM4.1-BNF and LM3-SNAP
ized LM4.1-BNF numerical experiments with both Acer and to site observations from CHL (Fig. 3a; Boring and Swank,
Robinia seedlings, only Acer seedlings, or only N-fixer Acer 1984). To evaluate the performance of LM4.1-BNF in repre-
seedlings. LM4.1-BNF, LM4.1-BNFNPP , and LM4.1-BNFET senting asymbiotic BNF, we compared asymbiotic BNF rate
simulations are initialized such that all plant cohorts have the from the numerical experiments of LM4.1-BNF to site ob-
same height (0.5 m; Table D4), and dbh is determined from servations from CHL (Fig. 3b; Todd et al., 1978). To evalu-
height by allometry (Eq. A41; Table D4). See Table D4 for ate the performance of LM4.1-BNF in representing the com-
a summary of initial density, height, and dbh of seedlings in petitive dynamics between N-fixing and non-fixing plants,
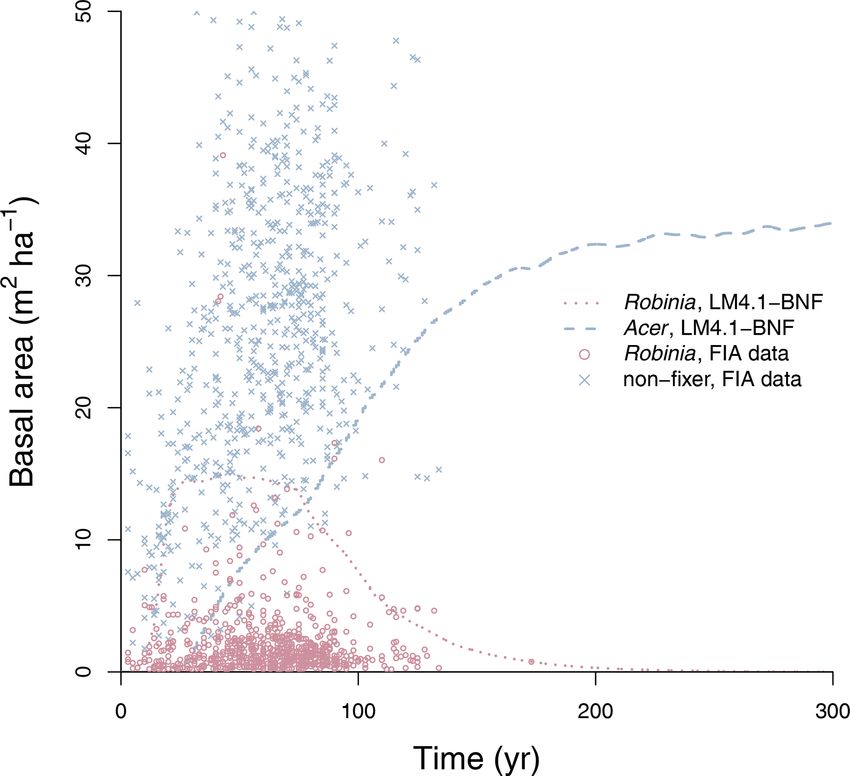
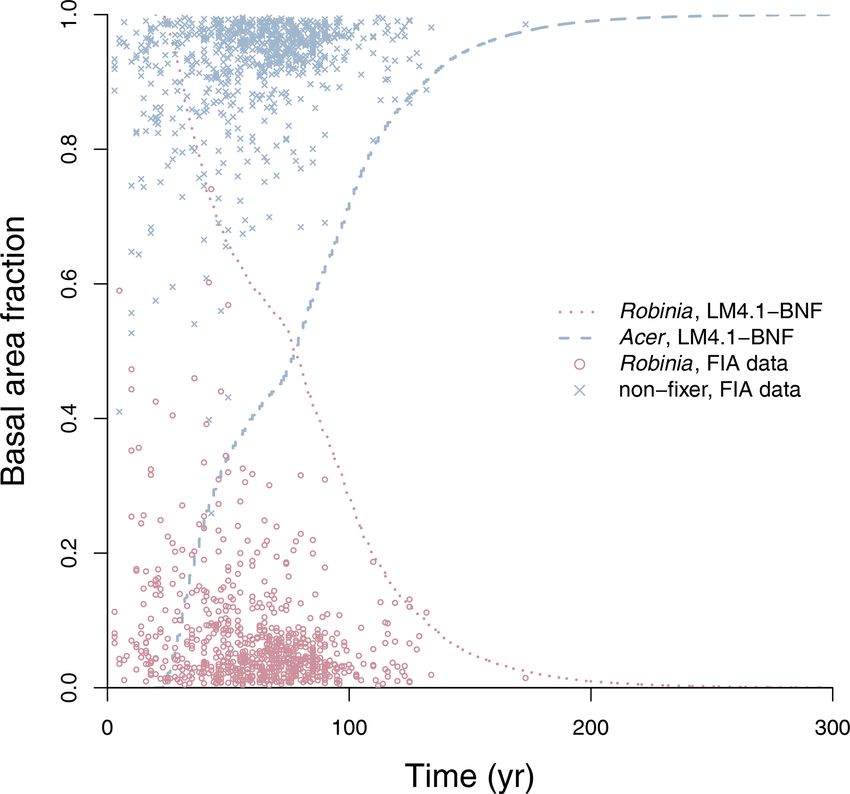
numerical experiments. we compared the basal area fraction of each vegetation type
We ran the LM3-SNAP spin-up for 1000 years at pre- (Acer and Robinia) over time from the numerical experi-
industrial atmospheric CO2 concentration to allow the soil C ments of LM4.1-BNF to US FIA database tree data (Fig. 4;
and N pools to reach an approximate steady state. Then, we US Forest Service, 2020a).
initialized LM3-SNAP numerical experiments with seedlings To evaluate the performance of LM4.1-BNF in represent-
and the LM3-SNAP spin-up soil C and N pools. We ran ing ecosystem C and N pools and fluxes, we (1) compared
numerical experiments for another 300 years at current at- total plant biomass C from the numerical experiments of
mospheric CO2 concentration. See Table D3 for a summary LM4.1-BNF and LM3-SNAP to US FIA database tree data
of atmospheric CO2 concentration, meteorological forcings, (Fig. 5; US Forest Service, 2020a); (2) compared soil C
and N deposition rates used in the spin-up and numerical and N pools and fluxes from the numerical experiments of
experiments. We initialized the LM3-SNAP spin-up and the LM4.1-BNF and LM3-SNAP to US FIA database soil data
Biogeosciences, 18, 4143–4183, 2021 https://doi.org/10.5194/bg-18-4143-2021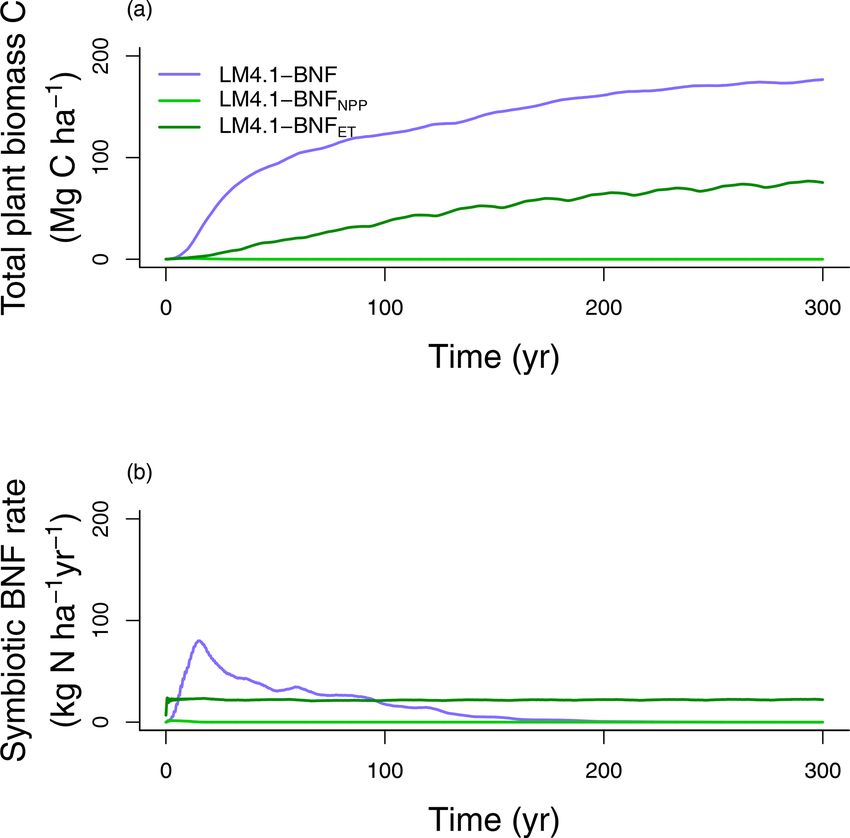
S. Kou-Giesbrecht et al.: A novel representation of biological nitrogen fixation                                                   4151

Table 2. Description of numerical experiments. In the first analysis, we compare mechanistic and phenomenological representations of BNF.
In the second analysis, we examine the role of competitive dynamics between N-fixing and non-fixing plants. In the third analysis, we
examine the role of asymbiotic BNF. Note that the same six numerical experiments were examined in both the second and third analyses.

     Analysis                                                           BNF representation    Species             Asymbiotic BNF
     1. Mechanistic and phenomenological representations of BNF         LM4.1-BNF             Robinia and Acer    represented
                                                                        LM4.1-BNFNPP          Robinia and Acer    –
                                                                        LM4.1-BNFET           Robinia and Acer    –
     2. Competitive dynamics between N-fixing and non-fixing plants     LM4.1-BNF             Robinia and Acer    represented
     3. Asymbiotic BNF                                                  LM4.1-BNF             Robinia and Acer    –
                                                                        LM4.1-BNF             Acer                represented
                                                                        LM4.1-BNF             Acer                –
                                                                        LM4.1-BNF             N-fixer Acer        represented
                                                                        LM4.1-BNF             N-fixer Acer        –

Figure 4. Simulated relative basal area of Acer and Robinia over       Figure 5. Simulated total plant biomass C over time by LM4.1-
time compared to FIA data (in North Carolina). Simulated data are      BNF and LM3-SNAP compared to FIA data (in North Carolina).
trees with dbh > 12.7 cm to reflect the dbh range of FIA data. FIA     Each point represents an FIA plot.
data of all non-fixing trees are aggregated to represent Acer. Each
point represents an FIA plot. See Fig. D9 for absolute basal area.
                                                                       data (Figs. D1 and D2; US Forest Service, 2020a). See Ap-
                                                                       pendix B for data availability and processing. See Table D5
                                                                       for a summary of the validated variables and data sources.
(Fig. 6; US Forest Service, 2020a), site observations from
CHL (Fig. 6; Knoepp, 2009a, b, 2018; Swank and Waide,
1988), and a meta-analysis of temperate forests (Fig. 6;               4     Evaluation: comparison of LM4.1-BNF to
Stehfest and Bouwman, 2006); (3) compared ecosystem C                        observations and to LM3-SNAP
fluxes from the numerical experiments of LM4.1-BNF and
LM3-SNAP to eddy covariance observations from CHL at                   4.1    Evaluation results
the hourly timescale (Fig. 7; Oishi, 2020); and (4) com-
pared ecosystem C fluxes from the numerical experiments of             Here we describe the evaluation of LM4.1-BNF, in which
LM4.1-BNF and LM3-SNAP to a meta-analysis of temperate                 we compare LM4.1-BNF simulations to observations and to
forests (Fig. 8; Anderson-Teixeira et al., 2018). We also com-         LM3-SNAP simulations (which represents a single general
pared dbh growth rates and the dbh distribution from the nu-           plant C pool capable of BNF and cannot represent commu-
merical experiments of LM4.1-BNF to US FIA database tree               nity dynamics (i.e., competitive dynamics between N-fixing

https://doi.org/10.5194/bg-18-4143-2021                                                        Biogeosciences, 18, 4143–4183, 2021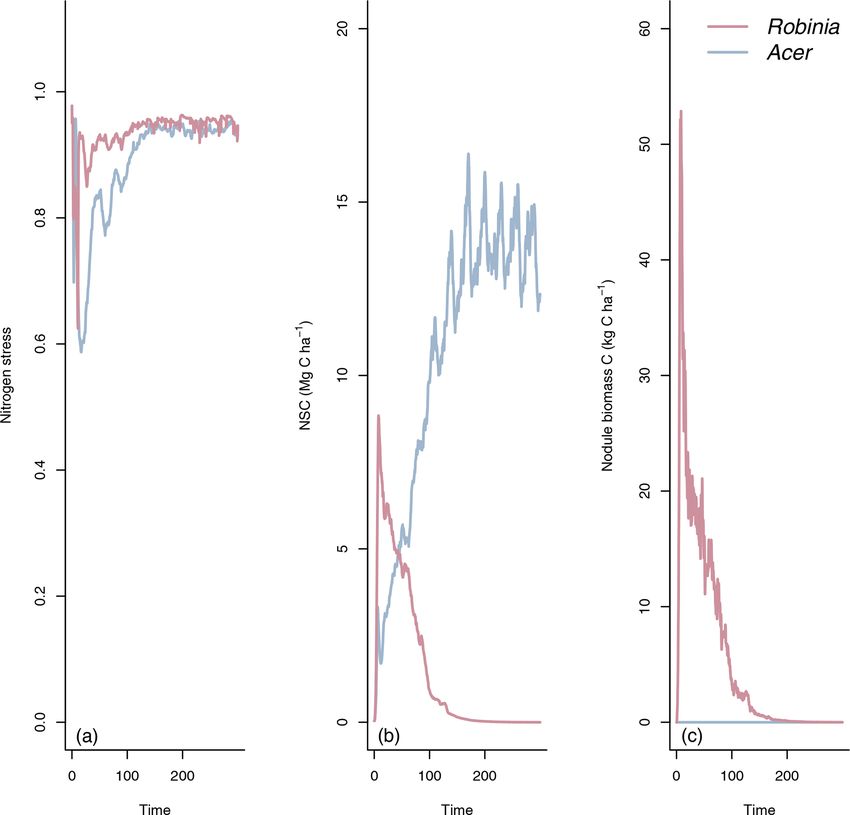
4152                                            S. Kou-Giesbrecht et al.: A novel representation of biological nitrogen fixation

Figure 6. Simulated soil C and N pools, soil N fluxes, and soil N loss rates by LM4.1-BNF and LM3-SNAP. (a) Simulated total soil C
(depth 0–10 cm) compared to FIA data (in North Carolina) and CHL site data. (b) Simulated total soil N (depth 0–10 cm) compared to FIA
data (in North Carolina) and CHL site data. (c) Simulated soil NH+            −
                                                                   4 and NO3 (depth 0–10 cm) compared to CHL site data. (d) Simulated N
mineralization rate and net nitrification rate (depth 0–10 cm) compared to CHL site data. (e) Simulated N2 O and NO emission rates compared
to a meta-analysis estimate for temperate forests and simulated dissolved organic N (DON), NH+                −
                                                                                                  4 , and NO3 leaching rate compared to CHL
site data. Simulated data are averaged over the last 100 of the 300 years of simulation to reflect the site data which are from mature forests.
Error bars indicate 2 standard deviations. NA indicates that LM3-SNAP cannot estimate N2 O or NO emissions.

and non-fixing plants) and does not represent asymbiotic                  cessional forests. Note that asymbiotic BNF is directly con-
BNF). LM4.1-BNF captures observed symbiotic BNF, asym-                    trolled by soil microbe biomass C (Eq. 3) and peripherally
biotic BNF, successional dynamics, and the major pools and                controlled by soil microbe biomass N, total soil C, and total
fluxes of C and N.                                                        soil N (Fig. D3), and symbiotic BNF is directly controlled
   LM4.1-BNF effectively reproduces asymbiotic BNF rate                   by nodule biomass C (Eq. 1) and peripherally controlled by
(mean 13 kg N ha−1 yr−1 over the final 100 years), which                  non-structural C and N stress (Fig. D4).
is not represented in LM3-SNAP (Fig. 3a), in compari-                        LM4.1-BNF effectively reproduces the successional dy-
son to observations from CHL (11 kg N ha−1 yr−1 ). LM4.1-                 namics of Robinia and Acer (Fig. 4): Robinia is competi-
BNF effectively reproduces the temporal dynamics of sym-                  tively excluded by Acer at approximately the same timescale
biotic BNF rate: LM4.1-BNF simulates a symbiotic BNF                      as observations (∼ 5 % basal area fraction at 150 years).
rate pulse in early succession that reaches 73 kg N ha−1 yr−1                At the ecosystem scale, LM4.1-BNF effectively repro-
at 15 years and then declines to ∼ 0 kg N ha−1 yr−1 at                    duces the temporal dynamics of total plant biomass C in
300 years (Fig. 3b). LM3-SNAP simulates high symbiotic                    comparison to observations (mean 173 vs. 160 Mg C ha−1
BNF rate in late succession (mean 8 kg N ha−1 yr−1 over                   over the final 100 years; Fig. 5), whereas LM3-SNAP sub-
the final 100 years; Fig. 3b). Observations from CHL sug-                 stantially underestimates total plant biomass C in compar-
gest that symbiotic BNF which reaches 75 kg N ha−1 yr−1                   ison to observations (mean 44 vs. 160 Mg C ha−1 over the
at 17 years then declines to ∼ 0 kg N ha−1 yr−1 in late suc-              final 100 years; Fig. 5). LM4.1-BNF makes reasonable es-

Biogeosciences, 18, 4143–4183, 2021                                                           https://doi.org/10.5194/bg-18-4143-2021
S. Kou-Giesbrecht et al.: A novel representation of biological nitrogen fixation 4153
Figure 8. Simulated gross primary production (GPP), net primary
Figure 7. Simulated net ecosystem production (NEP) by LM4.1- production (NPP), heterotrophic respiration (HR), and net ecosys-
BNF and LM3-SNAP compared to net ecosystem exchange (NEE) tem production (NEP) by LM4.1-BNF and LM3-SNAP compared
CHL site data at the hourly timescale. Simulated data are averaged to the ForC database. Simulated data are averaged over the last 100
over the last 100 of the 300 years of simulation to reflect the data of the 300 years of simulation to reflect the data which are from
which are from mature forests. mature forests. Error bars indicate 2 standard deviations.
season (Fig. 7). LM4.1-BNF effectively reproduces gross pri-
timates for soil C and N pools and fluxes, which are com- mary production (GPP) and NPP, especially in comparison
parable to those of LM3-SNAP. LM4.1-BNF underestimates to LM3-SNAP, which substantially overestimates both GPP
total soil C and N (mean 13.4 vs. 33.0 Mg C ha−1 and 0.2 and NPP (Fig. 8). LM4.1-BNF overestimates GPP and NPP
vs. 1.8 Mg N ha−1 respectively; Fig. 6a and b) and over- in comparison to observations (mean 15.4 vs. 13.1 and 8.1
estimates soil NH+ −
4 and NO3 (mean 4.7 vs. 1.0 and 1.6 vs. 7.5 Mg C ha−1 yr−1 respectively). LM4.1-BNF overesti-
−1
vs. 0.1 kg N ha respectively; Fig. 6c) in comparison to mates HR (mean 7.5 vs. 4.7 Mg C ha−1 yr−1 ) and consequen-
observations. LM4.1-BNF underestimates N mineralization tially underestimates net ecosystem production (NEP) (mean
rate and net nitrification rate in comparison to observa- 0.6 vs. 4.8 Mg C ha−1 yr−1 ) in comparison to observations.
tions (mean 14.9 vs. 39.5 and 7.2 vs. 12.8 kg N ha−1 yr−1 re-
spectively; Fig. 6d). LM4.1-BNF overestimates N2 O emis- 4.2 Evaluation discussion
sion rate (mean 5.1 vs. 0.9 kg N ha−1 yr−1 ) and underesti-
mates NO emission rate (mean 0.2 vs. 0.8 kg N ha−1 yr−1 ; LM4.1-BNF effectively reproduces asymbiotic BNF and
Fig. 6e) in comparison to observations. Note that LM3- symbiotic BNF, i.e., its peak in early succession followed
SNAP cannot simulate N2 O and NO emission rates. LM4.1- by its decline to zero in late succession (Fig. 3). In LM3-
BNF underestimates dissolved organic N (DON) leaching SNAP, asymbiotic BNF is not represented, and symbiotic
rate (mean ∼ 0 vs. 0.6 kg N ha−1 yr−1 ) and NH+ 4 leaching BNF is sustained in late succession (Fig. 3). This occurs be-
rate (mean ∼ 0 vs. 0.05 kg N ha−1 yr−1 ) in comparison to cause there is no competitive exclusion of N-fixing plants by
observations and reasonably estimates NO− 3 leaching rate non-fixing plants in LM3-SNAP, which represents a single
(mean 0.1 vs. 0.1 kg N ha−1 yr−1 ; Fig. 6e) in comparison to general plant C pool capable of BNF and cannot represent
observations. LM3-SNAP substantially overestimates NO− 3 community dynamics (Fig. 4). In observed ecosystems, N-
leaching rate in comparison to observations (mean 8.3 vs. fixing plants are competitively excluded by non-fixing plants
0.1 kg N ha−1 yr−1 ; Fig. 6e). due to weak N limitation of plant growth in late succession
Finally, LM4.1-BNF makes reasonable estimates for (Menge et al., 2010; Sheffer et al., 2015), and symbiotic BNF
ecosystem C fluxes, particularly in comparison to LM3- is effectively zero (Boring and Swank, 1984).
SNAP. LM4.1-BNF effectively reproduces net ecosystem This overestimation of symbiotic BNF in late succes-
production (NEP) in both the growing and non-growing sea- sion by LM3-SNAP causes several problems. First, LM3-
sons at the hourly timescale, especially in comparison to SNAP simulates lower total plant biomass C than LM4.1-
LM3-SNAP, which overestimates NEP in the non-growing BNF (mean 44 vs. 173 Mg C ha−1 over the final 100 years;
https://doi.org/10.5194/bg-18-4143-2021 Biogeosciences, 18, 4143–4183, 20214154 S. Kou-Giesbrecht et al.: A novel representation of biological nitrogen fixation
Fig. 5) because of the sustained high C cost of symbiotic
BNF. Second, LM3-SNAP overestimates N losses in com-
parison to LM4.1-BNF, especially NO− 3 leaching rate (mean
8.3 vs. 0.1 kg N ha−1 yr−1 over the final 100 years; Fig. 6).
Accurately estimating N leaching rates is important given its
downstream consequences such as eutrophication and acidi-
fication (Fowler et al., 2013; Tian and Niu, 2015).
5 LM4.1.-BNF performance relative to previous BNF
representations
Here we describe the three analyses we conducted to iden-
tify LM4.1-BNF improvements to estimating major C and N
pools and fluxes. First, we compare LM4.1-BNF to LM4.1-
BNF with BNF represented as a function of NPP (LM4.1-
BNFNPP ) and LM4.1-BNF with BNF represented as a func-
tion of ET (LM4.1-BNFET ) to compare mechanistic and phe-
nomenological representations of BNF. Second, we com-
pare LM4.1-BNF simulations with both Robinia and Acer
to LM4.1-BNF simulations with only Acer and LM4.1-BNF
simulations with only Acer that can associate with N-fixing Figure 9. Simulated (a) total plant biomass C and (b) symbi-
bacteria (hereafter, N-fixer Acer) to examine the role of com- otic BNF rate over time from LM4.1-BNF, LM4.1-BNFNPP , and
LM4.1-BNFET .
petitive dynamics between N-fixing and non-fixing plants.
Third, we compare LM4.1-BNF simulations with asymbiotic
BNF to LM4.1-BNF simulations without asymbiotic BNF to
examine the role of asymbiotic BNF. oneer species and can relieve strong N limitation of plant
growth in early succession (Chapin III et al., 1994; Cierjacks
5.1 Mechanistic and phenomenological representations et al., 2013; Menge et al., 2010). Consequently, symbiotic
of BNF BNF is highest in early succession (Batterman et al., 2013;
Boring and Swank, 1984; Menge and Hedin, 2009; Sullivan
In our first analysis (Table 2), we compare mechanistic et al., 2014). Simulated soil C and N pools, soil N fluxes, soil
and phenomenological representations of BNF, and their N loss rates, and ecosystem C fluxes are relatively similar
implications for C and N cycling. LM4.1-BNF, LM4.1- between simulations and are displayed in Figs. D5 and D6.
BNFNPP , and LM4.1-BNFET simulations estimate different A similar result was found by Meyerholt et al. (2020), who
total plant biomass C (Fig. 9a). LM4.1-BNF predicts the compared five alternative representations of BNF within the
largest total plant biomass C (mean 170 Mg C ha−1 over O–CN model, including a BNF representation based on NPP,
the final 100 years), followed by LM4.1-BNFET (mean a BNF representation based on ET, and a BNF representa-
70 Mg C ha−1 over the final 100 years) and LM4.1-BNFNPP tion responding dynamically to N limitation of plant growth.
(mean 0 Mg C ha−1 over the final 100 years). This is be- As with our results, they found that the BNF representa-
cause, in LM4.1-BNF, BNF responds dynamically to strong tion responding dynamically to N limitation of plant growth
N limitation of plant growth in early succession and BNF predicted the largest total plant biomass C. However, their
(mean 36 kg N ha−1 yr−1 over the initial 100 years) supports study did not compare these results to simulations that in-
total plant biomass C accumulation. Conversely, in LM4.1- clude competitive dynamics between N-fixing and non-fixing
BNFNPP and LM4.1-BNFET , BNF does not respond dy- plants because O–CN represents a single general plant C pool
namically to strong N limitation of plant growth in early capable of BNF and cannot represent community dynamics.
succession, and BNF is not sufficient (mean 22 and ∼
0 kg N ha−1 yr−1 over the initial 100 years for LM4.1-BNFET 5.2 Competitive dynamics between N-fixing and
and LM4.1-BNFNPP respectively) to support total plant non-fixing plants
biomass C accumulation (Fig. 9b). As such, LM4.1-BNF
effectively reproduces the temporal dynamics of symbiotic In our second analysis (Table 2), we examine the role of com-
BNF rate, whereas LM4.1-BNFET and LM4.1-BNFNPP pre- petitive dynamics between N-fixing and non-fixing plants
dicted relatively constant symbiotic BNF rates. In observed and its implication for C and N cycling. LM4.1-BNF simula-
ecosystems, strong N limitation of plant growth occurs in tions initialized with only Acer seedlings accumulate total
early succession. N-fixing trees are generally important pi- plant biomass C slower than LM4.1-BNF simulations ini-
Biogeosciences, 18, 4143–4183, 2021 https://doi.org/10.5194/bg-18-4143-2021S. Kou-Giesbrecht et al.: A novel representation of biological nitrogen fixation 4155
Levy-Varon et al. (2019) conducted a similar study, in
which a N-fixer vegetation type was included in the ED2
model. Similarly, they found that simulations without a N-
fixer vegetation type accumulate total plant biomass C slower
than simulations with a N-fixer vegetation type. However,
ED2 differs from LM4.1-BNF in a multitude of processes.
In particular, ED2 does not include representations of asym-
biotic BNF, mycorrhizae, or rhizosphere priming. Further-
more, the representation of BNF in ED2 assumes instanta-
neous down-regulation of symbiotic BNF rate in comparison
to the time lag in down-regulation of symbiotic BNF rate in
LM4.1-BNF (due to the time between plant C allocation to
symbiotic BNF, the growth of N-fixing bacteria, and symbi-
otic BNF) following observations (Bytnerowicz et al., 2021).
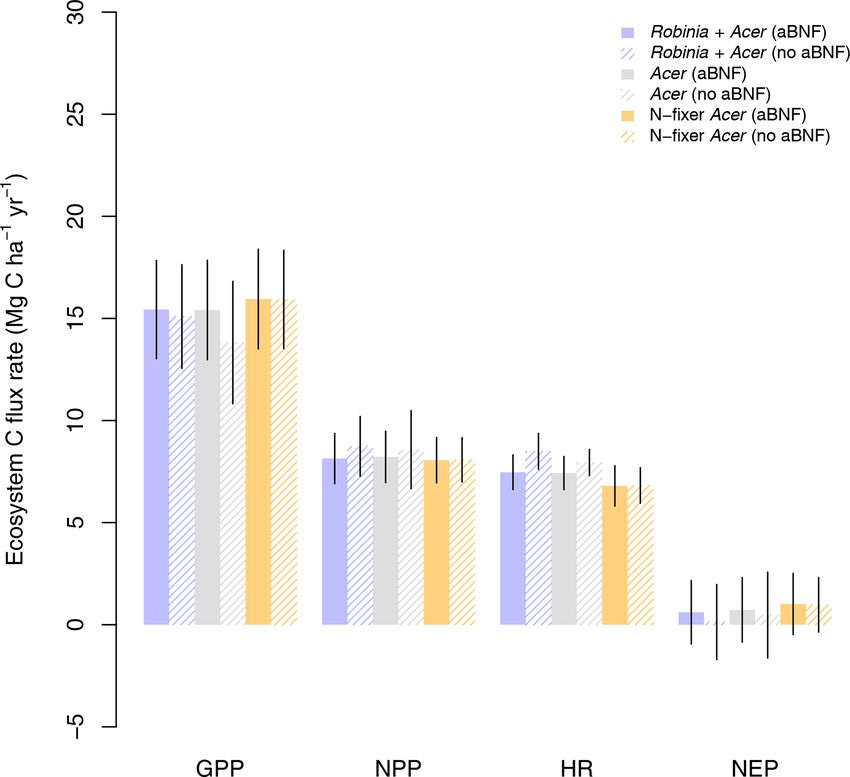
5.3 Asymbiotic BNF
In our third analysis (Table 2), we examine the role of asym-
biotic BNF and its implications for C and N cycling. LM4.1-
BNF simulations initialized with Acer without asymbiotic
BNF accumulate total plant biomass C slower than LM4.1-
Figure 10. Simulated (a) total plant biomass C and (b) symbiotic BNF simulations initialized with Acer with asymbiotic BNF
BNF rate over time from LM4.1-BNF initialized with both Robinia (30.4 vs. 48.6 Mg C ha−1 over the initial 100 years; Fig. 10a).
and Acer, only Acer, and only N-fixer Acer, with and without asym- In LM4.1-BNF simulations initialized with Acer without
biotic BNF. aBNF indicates asymbiotic BNF. asymbiotic BNF, stronger N limitation of plant growth in
early succession due to the absence of both asymbiotic BNF
and a N-fixer vegetation type (i.e., symbiotic BNF) substan-
tialized with both Robinia and Acer seedlings (mean 48.6 tially slows total plant biomass C accumulation. Neverthe-
vs. 80.9 Mg C ha−1 over the initial 100 years respectively; less, total plant biomass C accumulates due to high N depo-
Fig. 10a). In LM4.1-BNF simulations initialized with only sition at CHL (13.9 kg N ha−1 yr−1 ), reaching a similar level
Acer seedlings, stronger N limitation of plant growth in early to LM4.1-BNF simulations initialized with both Robinia and
succession due to the absence of a N-fixer vegetation type Acer seedlings and asymbiotic BNF after 300 years. Sim-
slows total plant biomass C accumulation. Nevertheless, to- ulated soil C and N pools, soil N fluxes, soil N loss rates,
tal plant biomass C accumulates due to asymbiotic BNF and and ecosystem C fluxes are relatively similar between simu-
high N deposition at CHL (13.9 kg N ha−1 yr−1 ), reaching a lations and are displayed in Figs. D7–8.
similar level to LM4.1-BNF simulations initialized with both
Robinia and Acer seedlings after 100 years.
LM4.1-BNF simulations initialized with only N-fixer 6 Discussion
Acer seedlings accumulate total plant biomass C similarly
to LM4.1-BNF simulations initialized with both Robinia 6.1 Limitations
and Acer seedlings (mean 86.2 vs. 80.9 Mg C ha−1 over
the initial 100 years respectively; Fig. 10a). However, in LM4.1-BNF captures the major pools and fluxes of C and
LM4.1-BNF simulations initialized with only N-fixer Acer N and their temporal dynamics. Importantly, LM4.1-BNF is
seedlings, a higher symbiotic BNF rate persists throughout novel in that it captures both the competitive dynamics be-
succession in comparison to LM4.1-BNF simulations ini- tween N-fixing and non-fixing plants and asymbiotic BNF.
tialized with both Robinia and Acer seedlings (mean 23.6 However, LM4.1-BNF has limitations.
vs. 0.2 kg N ha−1 yr−1 over the final 100 years respectively; LM4.1-BNF does not explicitly include asymbiotic BNF
Fig. 10b). This occurs because there is no competitive exclu- by bryophytes, lichens, and other organisms beyond soil mi-
sion of N-fixing plants by non-fixing plants due to weak N crobes. This is regulated differently from asymbiotic BNF by
limitation of plant growth in late succession, which occurs soil microbes, specifically by light (Reed et al., 2011). In par-
in LM4.1-BNF simulations initialized with both Robinia and ticular, in boreal forests and arctic tundra, asymbiotic BNF
Acer seedlings. Simulated soil C and N pools, soil N fluxes, by bryophytes is a significant N flux (DeLuca et al., 2002).
soil N loss rates, and ecosystem C fluxes are relatively sim- Additionally, herbaceous symbiotic BNF in the forest under-
ilar between simulations and are displayed in Figs. D7 and story could be significant, but few studies have quantified its
D8. magnitude and controls (Cleveland et al., 1999).
https://doi.org/10.5194/bg-18-4143-2021 Biogeosciences, 18, 4143–4183, 20214156 S. Kou-Giesbrecht et al.: A novel representation of biological nitrogen fixation
The asymbiotic BNF temperature response is heavily bi- 7 Conclusions
ased towards high latitudes; the studies we used in its deriva-
tion had a mean latitude of 60◦ (Chan, 1991; Chapin et al., Here we present LM4.1-BNF: an updated representation of
1991; Coxson and Kershaw, 1983; Liengen and Olsen, 1997; BNF and other aspects of N cycling in LM4.1, which is the
Roper, 1985). More studies on the asymbiotic BNF tempera- land component of the GFDL Earth System Model (Zhao et
ture response at lower latitudes are necessary. al., 2018a, b). LM4.1-BNF is the first land model to include
The symbiotic BNF temperature response could acclimate a representation of the competitive dynamics between N-
to changing temperature (Bytnerowicz et al., 2021). The C fixing and non-fixing plants, a mechanistic representation of
cost of symbiotic BNF, which we assumed to be constant per asymbiotic BNF, and distinct asymbiotic and symbiotic BNF
unit N, could depend on temperature or other factors. These temperature responses derived from corresponding observa-
issues could influence the simulated response of symbiotic tions. Comparisons of simulations with observations show
BNF and consequently total plant biomass C to increasing that LM4.1-BNF captures observed forest growth, succes-
temperatures due to climate change. Thus, further empirical sional dynamics, and major pools and fluxes of C and N
work on the effect of temperature on symbiotic BNF is nec- and their temporal dynamics at population, community, and
essary. ecosystem scales. Furthermore, LM4.1-BNF represents these
Finally, more observations of N cycling in general are nec- more accurately than previous representations of BNF in land
essary to validate N cycling representations in land models models. By incorporating both the competitive dynamics be-
(Stocker et al., 2016; Thomas et al., 2015; Vicca et al., 2018). tween N-fixing and non-fixing plants, which is a key eco-
Global observations on N limitation of plant growth, soil N, logical mechanism that determines ecosystem-scale symbi-
N gas emission rates, N leaching rates, and, in particular, otic BNF, and asymbiotic BNF, LM4.1-BNF yields accurate
asymbiotic and symbiotic BNF rates are limited. Constrain- ecosystem-scale estimates of BNF and its temporal dynam-
ing these N pools and fluxes is critical to rigorously validat- ics. Furthermore, the novel representation of soil NO and
ing novel N cycling representations in land models. N2 O emissions in LM4.1-BNF enables the estimation of the
magnitude of the terrestrial NO and N2 O source, which can
be driven by BNF (Kou-Giesbrecht and Menge, 2021).
The representation of BNF in LM4.1-BNF is general and
6.2 Extensions could be incorporated into other land models. Extending
LM4.1-BNF to other biomes and incorporating LM4.1-BNF
within the GFDL Earth System Model would allow a more
Robinia pseudoacacia is the most abundant N-fixing tree accurate assessment of the response of BNF and the ter-
species in the coterminous United States (Staccone et al., restrial C sink to elevated atmospheric CO2 concentration,
2020) and is also a common N-fixing tree across temperate which intensifies N limitation of plant growth (Terrer et al.,
forests; it is also found in Africa, Asia, Australia, Europe, 2019; Zheng et al., 2020), and elevated N deposition, which
and South America (Cierjacks et al., 2013). As such, Robinia relieves N limitation of plant growth (Reay et al., 2008;
pseudoacacia is representative of temperate N-fixing tree Schulte-Uebbing and de Vries, 2018; Zheng et al., 2020).
species. In particular, such an endeavour could address whether BNF
The LM4.1-BNF representation of BNF, while imple- and N deposition will provide sufficient N to sustain CO2
mented and validated in a temperate forest, can be expanded sequestration by terrestrial ecosystems under elevated atmo-
to other terrestrial ecosystems, such as tropical and boreal spheric CO2 concentration.
forests. This will require parameterization of representative
N-fixing and non-fixing tree species but will not require re-
structuring the model equations. Furthermore, the LM4.1-
BNF representation of BNF could be incorporated into other
land models.
Although N-fixing trees are generally important pioneer
species and can relieve strong N limitation of plant growth
in early succession (Chapin III et al., 1994), N-fixing trees
can also be strong competitors. As such, in addition to hav-
ing a facilitative effect on neighbouring plant growth (Hul-
vey et al., 2013), they can also have no effect on neighbour-
ing plant growth (Lai et al., 2018; Xu et al., 2020) or an in-
hibitory effect on neighbouring plant growth (Chapin III et
al., 2016; Taylor et al., 2017). This depends on abiotic and
biotic factors (Staccone et al., 2021) and could be explored
further with LM4.1-BNF.
Biogeosciences, 18, 4143–4183, 2021 https://doi.org/10.5194/bg-18-4143-2021You can also read