Valuation of Tesla Motors - Master Thesis by Andreas Roland Petersen Programme Submitted Academic advisor Pages - CBS Research Portal
←
→
Page content transcription
If your browser does not render page correctly, please read the page content below
Valuation of Tesla Motors
Master Thesis by Andreas Roland Petersen

Programme Cand.Merc. International Business
Submitted 15. september 2016
Academic advisor Björn Preuss
Pages 72
Characters (with spaces) 130,464
Abstract
The objective of this paper is to examine if the increase in the stock price of Tesla Motors (Tesla)
is justified in the fundamentals of the company. The various ways of valuating a company is
explored with a focus on the discounted cash flow and economic value added method. The
application of these two valuation methods require estimation of cost of capital. There are various
components to account for when calculating cost of capital and therefore a review of the subject
is deemed relevant. The paper is divided into five parts. The first part is an introduction to the
valuation theories and a reasoning for choosing DCF and EVA. The second part is a thorough
walkthrough of the discount rate and a calculation of it. The third part is an analysis of the industry
to estimate future growth and a financial analysis to understand the fundamentals of Tesla Motors.
Subsequently, this leads to the valuation of Tesla Motors, and the findings of the valuation are
evaluated and discusses in the fifth part of the paper.

In the first part of the paper, valuation approaches are examined as well as the methodology behind
them. From this examination the discounted cash flow and economic value added method are
considered appropriate. The second part of the paper follows up on the valuation methods and
focuses on the determinants of the correct cost of capital. This part finds that the cost of capital for
Tesla is 5.84% which is lower than the average of the industry of 6.22% (Stern Business School,
2016). The third part evaluates the potential future growth for Tesla, and find it to be promising.
The future launch of medium segmented cars and a reduction in production cost with the
Gigafactory provides Tesla with the opportunity to entrench itself in the automotive industry. With
a historical compounded average growth rate of 103% for the last five years it is estimated that
Tesla will grow to a significant size within the next decade. Based on these estimates, a valuation
is carried out, and it is estimated that the valuation of Tesla is 0.82% over market price when
discounted cash flow method is used and valued over market price with ~2.55% when economic
value added model is used. The last part of the paper tests the sensitivity of the valuation for
changes in essential components the discount rate. It is demonstrated that the models are very
sensible to assumptions of the discount rate.

 1
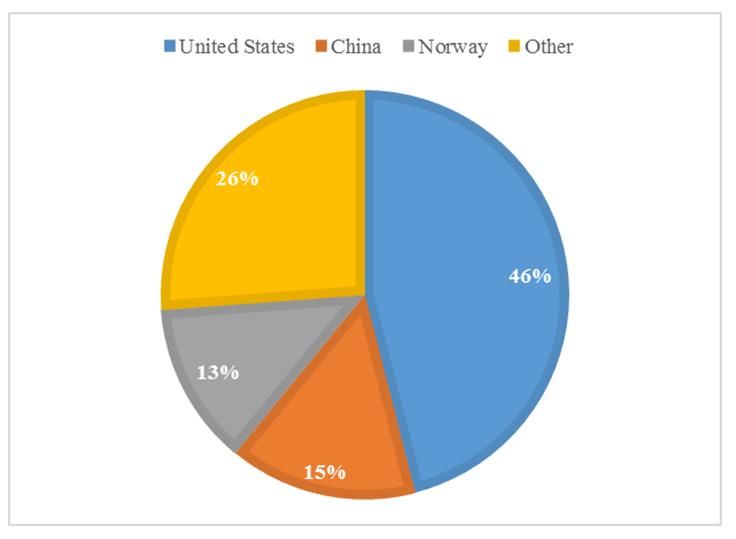
Table of Content

Abstract ........................................................................................................................................... 1
1 Introduction ............................................................................................................................. 5
 1.1 Problem statement ............................................................................................................ 6
 1.2 Delimitations .................................................................................................................... 7
 1.3 The process ....................................................................................................................... 8
2 Valuation theory ...................................................................................................................... 9
 2.1 Valuations types ............................................................................................................... 9
 2.2 Value of equity or value of the entire firm ..................................................................... 10
 2.3 Tesla Motors - A cyclical firm ....................................................................................... 11
 2.4 Relative valuation vs absolute valuation ........................................................................ 11
 2.4.1 Relative valuation.................................................................................................... 11
 2.4.2 Absolute valuation methods .................................................................................... 12
 2.5 Terminology and definitions .......................................................................................... 12
 2.6 Discount rate ................................................................................................................... 13
 2.7 Valuation models ............................................................................................................ 14
 2.7.1 Discounted cash flow model ................................................................................... 14
 2.7.2 Economic value added ............................................................................................ 16
 2.8 Terminal value ................................................................................................................ 17
 2.8.1 The liquidation value............................................................................................... 17
 2.8.2 The exit multiple method ........................................................................................ 17
 2.8.3 The perpetuity growth model (stable growth model) .............................................. 18
 2.8.4 The extended value driver formula ......................................................................... 18
 2.9 Limitations ...................................................................................................................... 20
 2.10 Competitive advantage period ........................................................................................ 21
 2.11 Conclusion to the theory ................................................................................................. 22
 2.11.1 Occam’s razor ......................................................................................................... 22
 2.11.2 Economic value added and discounted cash flow ................................................... 22
3 Weighted average cost of capital .......................................................................................... 24
 3.1 Tax rate ........................................................................................................................... 24
 3.2 Return on equity ............................................................................................................. 25
 3.2.1 The risk free rate, rf ................................................................................................. 26
 3.2.2 Systematic risk, β (beta) .......................................................................................... 26
 3.2.2.4 Beta calculations .................................................................................................. 28

 2
3.2.3 Limitations .............................................................................................................. 30
 3.3 Alternative method to calculate beta .............................................................................. 31
 3.3.1 Financial leverage ................................................................................................... 31
 3.3.2 Type of business ...................................................................................................... 31
 3.3.3 Degree of operating leverage .................................................................................. 32
 3.4 Limitations ...................................................................................................................... 32
 3.5 Equity risk premium ....................................................................................................... 33
 3.5.1 Arithmetic vs geometric return ............................................................................... 35
 3.5.2 Equity risk premium value ...................................................................................... 36
 3.6 Calculation of CAPM ..................................................................................................... 37
4 Tesla Motors.......................................................................................................................... 39
 4.1 Tesla’s share price development .................................................................................... 39
 4.2 Their products ................................................................................................................. 40
 4.2.1 Energy storage applications .................................................................................... 40
 4.2.2 Cars ......................................................................................................................... 40
 4.2.3 Battery pack ............................................................................................................ 41
 4.2.4 Factories .................................................................................................................. 42
 4.3 Organizational structure ................................................................................................. 42
 4.3.1 Ownership structure ................................................................................................ 42
 4.4 Tesla as disruptive company .......................................................................................... 42
 4.4.1 Emission credits ...................................................................................................... 43
5 Strategy section ..................................................................................................................... 44
 5.1 Introduction to automotive industry ............................................................................... 44
 5.2 Electric vehicle segment ................................................................................................. 45
 5.2.1 Batteries................................................................................................................... 45
 5.3 Oil prices and GDP ......................................................................................................... 46
 5.4 Peers ............................................................................................................................... 47
 5.5 Strategic analyses ........................................................................................................... 48
 5.5.1 United States ........................................................................................................... 49
 5.5.2 Other – Mexico, European Union, Emerging Nations ............................................ 49
 5.5.3 Size of peers ............................................................................................................ 50
 5.6 The future car ................................................................................................................. 51
 5.7 Growth for tesla .............................................................................................................. 52
 5.7.1 Estimation of future growth .................................................................................... 52
 5.7.2 Forecasting period ................................................................................................... 53

 3
5.7.3 Terminal growth ...................................................................................................... 54
6 Financial statement analysis .................................................................................................. 55
 6.1 The income statement ..................................................................................................... 56
 6.1.1 Changes to the income statement ............................................................................ 56
 6.1.2 DuPont model.......................................................................................................... 56
 6.1.3 Benchmark and predictions ..................................................................................... 59
 6.2 Sub conclusion................................................................................................................ 59
7 SWOT ................................................................................................................................... 59
 7.1 Conclusion to future growth for Tesla ............................................................................ 60
8 The valuation ......................................................................................................................... 61
 8.1 Discounted cash flow model .......................................................................................... 62
9 Sensitivity analysis ................................................................................................................ 65
 9.1 Equity risk premium, beta and risk free return ............................................................... 66
 9.2 The importance of future growth prediction .................................................................. 68
10 Future research & valuation .................................................................................................. 69
 10.1 FEVA – the new valuation approach .............................................................................. 69
 10.2 SolarCity ......................................................................................................................... 70
 10.3 Revenue growth – more important than discount rate? .................................................. 70
11 Conclusion............................................................................................................................. 71
12 Literature ............................................................................................................................... 73
Appendix a – Financial Statement ................................................................................................ 77
Appendix b – Sensitivity discounted cash flow ............................................................................ 79
Appendix c - Sensitivity economic value added .......................................................................... 80
Appendix d - Impact on cost of equity .......................................................................................... 81
Appendix e – Share price difference between DCF and EVA ...................................................... 82

 4
1 Introduction
For many years, creditors and debtors have been using discounted cash flow models for calculating
value of loans. After the stock crash in 1929, Irving Fisher and John Burr William’s in their books
The Theory of Interest (Irving, 1930) and The Theory of Investment Value (Edwards & Williams,
1939) formulated what is today known as Discounted Cash Flow Model. The model is widely used
for valuation of companies. Since the creation of the model, other valuation theories such as
Economic Value Added and multiple valuation, to name a few have surfaced. The models are
comprehensive tools to evaluate the value of a company. However, these are dependent on
predictions of the future results and the predictions are subjected to assumptions made by the
analyst/user of the model. The usefulness/precision of the models is therefore correlated with the
correctness of the assumptions made by the analysts. Most of the valuation theories uses some
kind of discount rate, which is used to compare cash flows over. In this paper there is a focus on
the weighted average cost of capital as discount factor. As part of or the entire denominator in
several of the valuation models, the determination of the discount factor is an important part of the
valuation process. It is therefore interesting to look at how this factor is calculated and how
sensitive it is to the assumptions used.

The purpose of this paper is to look at valuation methods with focus on the discounted cash flow
model. For this application the paper will use Tesla Motors as case. The paper will elaborate on
the general application of discounted cash flow, the pitfalls of using this method and the usefulness
of it.

The motivation for the paper stems from an interest in company valuation, an interest that has been
nurtured doing my semester in Australia and my interest in innovative technology. My interest is
further backed up by the increasing focus on climate change and the shift in the energy sector
towards renewable energy and renewable technologies. The book Clean Disruption by Tony Seba,
introduced the notion that electric vehicles will dominate the car industry within the foreseeable
future (Seba, 2014). With their mission to provide the world with zero emission cars Tesla Motors
lives up to this. Tesla is a company that strives on the high-end market and the increasing
development in sustainable energy primarily lead by increasing in computer power.

 5
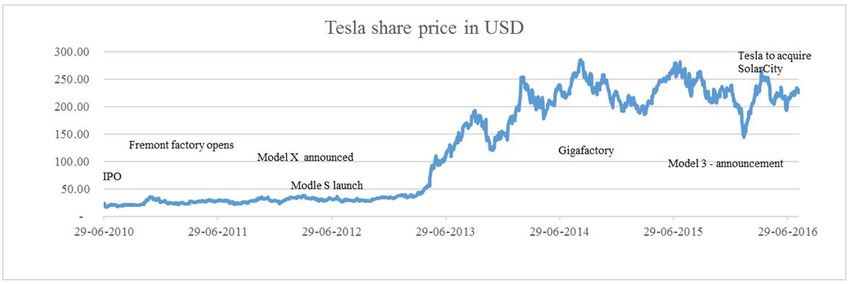
Without taking any sides in the debate, I am curious as to whether the rocketing stock price of
Tesla increasing from 34 USD in January 2013 to 230 USD as of August 1st 2016 is warranted in
the fundamentals of the company.

1.1 Problem statement
The paper sets out to explore the share price of Tesla Motors with the known valuation theory
Discounted Cash flow and Economic Value Added. The weighted average cost of capital (WACC)
is a key component in the models and has according to The WACC Fallacy a large impact on the
valuation (Krüger et al. 2015). This paper will look at the components of the WACC, with
emphasize on the price of equity calculated by the capital asset pricing model as developed by
William Sharpe (1964) and John Lintner (1965).

The paper will try to answer the following questions:
 - Is Tesla’s stock price warranted in the fundamentals of the company?
 - What are the consequences of calculating the wrong cost of capital?
 - How sensitive is the discounted cash flow model and economic value added model to the
 discount factor inputs?

This will be accomplished by answering the following sub questions:

 - What is the cost of capital for Tesla Motors?
 - What is the impact on the discount rate if the equity risk premium, beta or risk free rate is
 estimated incorrect?
 - What is the impact on the predicted share price if the equity risk premium or the beta is
 wrongly estimated?
 - What is the expected revenue growth rate for Tesla Motors?
 - What is the impact of estimating the wrong revenue growth?
 - How has the financial performance of Tesla been since its IPO?
 - What is the forecasted free cash flow?

To answer the problem statement and sub questions, an analysis of Tesla will be performed. The
theory concerning calculation of WACC and using the discounted cash flow will be reviewed, and
a sensitivity analysis will be performed on the component, with regards to its effect on the discount

 6
rate and on the share price. Lastly the paper will look at the current share price of Tesla and
compared it to value as estimated by the author.

1.2 Delimitations
This sections defines the boundaries of the assignment and tries to limit the scope of the paper.

Tesla Motors have operations all over the world, as of their latest annual report (2015), they have
defined their own revenue streams stemming from four different segments: North America,
Norway, China and “Other.” Throughout the financial and strategic analysis, these segments will
be applied if possible.

Tesla Motors has made an offer on SolarCity, which SolarCity has until September 14th to
accept/decline. SolarCity is a solar energy provider, and a comprehensive analysis of their business
segment is beyond the scope of this project. For the scope of this project, it will then be assumed
that Tesla is paying fair value for SolarCity, and therefore SolarCity is not incorporated for in
Tesla’s revenue stream.

The information available and used in this paper is limited to publicly available information.
Financial information up until the newest quarter report which account up till the 30th June 2016
will be used. As the quarter report was in hand August 5th 2016, the date will be used as share price
benchmark.

Through the paper, the follow companies will be used as peer groups as basis of comparison:
Bayerische Motoren Werke AG (BMW), Audi AG (Audi), Ford Motor Company (Ford) and
General Motors Company (GM). The justification for these companies will be provided in the
Strategy Section.

Usually when WACC is used in discounted cash flow models, a constant WACC is used over time.
The problem with this is that (usually) the capital structure changes over the years. As will be
shown in the WACC analysis, the cost of debt and the cost of equity is not the same. Therefore, a
change in WACC over the forecasting period result in a different value than if a constant WACC
was applied. However, in this paper the WACC is considered to be constant throughout the
valuation period.

 7
1.3 The process
In order to answer the problem statement, there is need for several steps. Firstly, the theory
regarding valuation theories and discount rate will be review and an appropriate valuation method
will be selected. From the understanding of this theory, the inputs necessary to perform the
valuation will be collected. This data collection will focus on the financial statements of Tesla
Motors, and their future strategy. To forecast the future cash flows and revenues, a strategic
analysis will be provided and the results will be applied. As the scope of this paper is to examine
if the growth in Tesla Motor’s stock is warranted in the fundamentals, a valuation will be
performed. Further to investigate the impact the discount rate has on the share price, a sensitivity
analyses will be performed. Amongst other things the paper aims to provide the reader with a
theoretical understanding of the importance on selecting the correct discount rate. Further it will
provide the reader with an understanding of the sensitivity of the components in the discount rate.

 8
2 Valuation theory
This section sets out to introduce the reader for some of the different kind of valuation processes
there is. As the problem statement is focused around the discounted cash flow model and the
economic value added model, the relative valuation models will be introduced but not carried out.
Through the chapter, the forces and short comings of the different theories will be explained.

The valuation tools available today includes absolute value models, liquidation models, and
relative valuations. All these methods will be explained in the valuation section. However, as the
scope of this paper is to examine the valuation method discounted cash flow and economic value
added, focus will be put on absolute value models. For a valuation to be accurate, there are four
categories the theory must account for. These categories in random order are: realistic assumptions,
usability, understandable results and precision (unbiased results) (Petersen & Plenborg, 2012).
These categories will be evaluated and compared to the models.

The discounted cash flow method will be thoroughly discussed, and compared to the economic
value added. As the weighted average cost of capital is applied to all the models, the calculation
of this will be thoroughly discussed in its own chapter.

2.1 Valuations types
There are several different ways and methods for valuating companies. These methods all have
merits in different scenarios. The following section will introduce the different methods and argue
for the method implemented in this paper.

There are five different types of valuations: Book value, breakup value, liquidation value,
fundamental value and market value (Petitt & Ferris, 2013).

 - Book value
 o The value from the balance sheet, that is the company’s net worth, calculated by:
 Total assets – total liabilities.
 - Break – up value
 o The break – up value is the value that can be achieved if the company is split up
 into saleable units and then sold off separately. This is usually relevant for large
 companies that composes of many different individual business units, divisions or
 segments.

 9
- Liquidation value
 o If the company is to be liquidated in a distress sale. The value is usually lower than
 the book value, because it is different components is sold quickly and therefore at
 a discount.
 - Fundamental value (intrinsic value)
 o The goal with this approach is to find the unbiased, and real value, that is the value
 you get if you apply the correct cash flow and the correct discounting rate
 (Damodaran, 2002). The values rely on the future after tax cash flows of the
 company, discounted to present value with a factor that takes into account the risk
 of the business. As both EVA and DCF falls into this category, the emphasize
 within this chapter will be on this type of valuation. The relative valuation method
 falls into this category as the fundamental values are compared to peers.
 - Market value
 o This value is equal to the value established in a marketplace, such as a security
 market. An example of this could be the market value of equity (market
 capitalization) which is equal to share price multiplied by number of shares.

This paper focuses on the fundamental valuation method. While the above mention valuation
methods all have their merits, for the scope of this paper, the interesting part is the fundamental
valuation.

2.2 Value of equity or value of the entire firm
When the valuation method has been selected, there are two types of targets of the valuation, either
the value of equity of the firm or the value of the entire firm.

 - Equity – Only values the equity stake in the business
 o In this method, cash flow is considered from assets but only after debt and
 reinvestment – the discount rate is only for the cost of equity.
 - Firm – Values the entire business, that include other claimholders (Damodaran, 2002).
 o Cash flows is considered before debt but after reinvestment. Discount rate is both
 equity and debt in proportion to their use (WACC).

 10
Tesla has an equity/debt ratio of around 9:1, so it would be erroneous to value equity only. To
understand the full scope of the enterprise, valuation of the firm is chosen. For this purpose, the
discount rate will be calculated.

2.3 Tesla Motors - A cyclical firm
A cyclical firm is defined by a company or industry that has cyclicality in revenue and earnings.
Cyclical companies tend to suffer in times of recession and prosper in periods of economic growth.
Precisely where in the cycle they tend to have peak earnings depends on the industry. Tesla, being
a sole automotive company (before the acquisition of SolarCity) fits the criteria of a cyclical firm.
Before Tesla introduced their “Model 3” car which is to available at the end of 2017 (Tesla Motors,
2016d), their product is a premium/luxury commodity. Being a producer of a luxury commodity,
they are less prone to cyclical ups and downs. When they launch their model 3 car at the end of
2017, they move towards being a more cyclical company.

It can be a difficult job to valuate earnings and cash flows of cyclical firms because of their close
relationship to the economy. To estimate the cash flow, thorough knowledge of the economy and
future trends is necessary. While it is impossible to predict the future, some movements are more
likely to happen than others are and therefore there is need for limitations in the valuation model.
This effects the evaluation when estimating the future income of the firm. Because of uncertainty
of the future, it is normal that valuations estimate future financial elements based on assumptions
from the past or trends from the past. Section 6.4 will explain these limitations, and assumptions.

2.4 Relative valuation vs absolute valuation
While there are different types of valuations, there is only two types of valuation results and the
following section will introduce the reader them. The aim with the section is to give the reader an
understanding of them, and what they are used for.

2.4.1 Relative valuation
Relative valuation gives a price relative to the market or to another asset. The idea is to give a
“quick and dirty” way to estimate the value of the company (Petitt & Ferris, 2013). The method
uses multiples as tools for valuating. A multiple is a ratio between to financial variables. An
example of a multiple could be price to earnings or price to book value. The multiples available is
practically endless, however there are some multiples that reveals and tell more than others. When
using a multiple one can compare the company to an industry average or industry peers. For

 11
instance, General Motors would be compared to Chrysler, or Ford. One of the inherent flaws in
doing comparable multiple analysis is that one assumes the pricing of the peer company is correctly
valued.

The relative valuation methods can be a quick way for an analyst to estimate whether a company
is valued correctly or if there is a potential upside. However, as the scope of this paper is to examine
the discount rate’s impact on the valuation of DCF and EVA models, this type of valuation will
not be carried out.

2.4.2 Absolute valuation methods
The absolute valuation methods give, instead of a relative value an absolute value of the firm, the
equity or whatever assets is valuated. There are different variations of absolute valuation methods,
the ones that will be introduced in this paper are the following:

- Discounted Cash Flow Model
 o Free Cash Flow to the Firm
 o Free Cash Flow to Equity
- The Extended Value Driver Formula
- Economic Value Added

There are other models for direct valuation which will not be look at within this paper:

- Non Discounted Cash Flow Models
 o Real option analysis
 o Economic income models (Residual income models)

2.5 Terminology and definitions
Before introducing the different models, a section will be dedicated to explaining the
terminologies.

There are different ways to calculate or determine the cash flow. How you determine it plays a
large part of the end valuation (Mian & Velez-Pareja, 2007).

The free cash flow (FCF) is arguably the most used term within valuation. The free cash flow is
the amount of cash that is back after operations and reinvestments. Throughout this paper the
following definition will be used:

 12
Free cash flow = cash flow from operations + interest expense * (1- effective tax rate) – net
reinvestment (Petitt & Ferris, 2013).

As seen in the equation the free cash flow represents the residual amount of cash after the necessary
operations and capital investments but before potential distribution to the providers of capital. Free
Cash Flow also takes the tax shield into account.

The equity cash flow (ECF) includes disbursement of interest and principal debt. The debt cash
flows are deducted from the total cash flows, and as a discount rate the cost of equity is used
instead of the weighted average cost of capital.

Cash flow to debt holders (CFD) this is the proceeds and interest that goes to the debt holders on
the outstanding debt.

Capital cash flow (CCF) is the cash flow available to both equity and debt holders. This cash
flow only incorporates the tax benefits of deductible interest. As discount rate, the before-tax
WACC is used. This is the sum of the CFD and ECF.

When calculating the present value, the two important factors are the discount rate and the cash
flow. It is therefore important to use the correct cash flow and the correct discount rate.

2.6 Discount rate
A discount rate is the return in percentage the investor requires for his investment. The following
definition is given by (Larrabee, David T. & Voss, 2012) “A discount rate is defined as the rate of
return an investor would require to be induced to invest in the cash-flow stream being discounted”.
The external factors that affect the discount rate is named below. These factors are captured in the
components within CAPM (Sharpe, 1964) with beta, equity risk premium and risk free rate.

- General economic conditions
- Yields available on alternative investment
- Industry conditions and outlook.

During the analysis of the discount rate, these factors will be considered, and an estimate of the
discount rate will be produced.

The weighted average cost of capital (WACC) is used as the discount rate to find the present value
of the cash flows. The WACC is the weighted average of the overall capital structure of the firm.

 13
That is the cost of equity (KE) and the cost of debt (KD). The cost of equity is often calculated by
using capital asset pricing model (Sharpe, 1964) and the cost of debt is the effective rate the
company pays on its debt. The cost of capital can be calculated either before or after tax. Because
interest expense is deductible in most countries, the after tax rate is usually applied. The after tax
weighted average cost of capital is equal to the weight of equity * the cost of equity + the weight
of debt * the cost of debt * the deductible tax shield. It is assumed that the W E + WD = 1.
 WACCAT =WE * KE + WD * KD (1- TC )

Before-tax WACC

 WACCBT =WE * KE + WD * KD

The weighted average cost of capital will be thoroughly discussed in its own chapter as it plays a
key part in all of the valuation method mentioned and a part of the research question this paper
sets out to answer.

2.7 Valuation models
This chapter sets out to introduce the components of the two valuation models, discounted cash
flow and economic value added.

2.7.1 Discounted cash flow model
The term Discounted Cash Flow Model, is an umbrella which fits more than one model, and the
most commonly used is Free Cash Flow to the Firm model. Free Cash Flow to Firm, is an
extrapolation of the Cash Flow to Firm which is explained below.

The model works on the premise that the value of the company is equal to that of the present value
of all future cash flows. The idea with the model is to use compounded interest rate to discount the
cash flows (Damodaran, 2002).

The original formula:
 ∞
 CF1 CF2 CF∞ CFn
 Value= + +…+ = ∑
 (1+i)1 (1+i)2 (1+i)∞ (1+i)n
 n=i

Where

 14
CF = cash flow
i = discount rate
n = time periods from one to infinity

This formula above, assumes a continuing cash flow in perpetuity. This is not impossible, but very
few companies live “forever” and it is rather impractical to assume that. For that reason, the model
is expanded to include a terminal value.

 t
 CFn TVt
 Value = ∑ n
 +
 (1+i) (1+i)t
 n=i

n = time periods, time = 1 to t
TV = terminal value.

The formula can be redesigned to include a terminal value, that is the value of the firm where it to
be valuated at a given time. If the cash flows go to period t, the terminal value is the value if the
company where to be valuated at time t. When calculating the future cash flow, it is optimal to
calculate each year individually. However, since this is very difficult to estimate the precise
revenue growth for each year in the future, assumptions are made about the phases. The conclusion
of the strategy section illustrates the need for three phases, the growth phase, the declining growth
and the steady state phase. The terminal value is calculated as the value just before entering the
steady stage phase. These phases will fit that of Tesla Motors future revenue.

When calculating the cash flow, it is important to specify which type of cash flow is calculated,
whether it is free cash flow or simply the cash flow. Since Tesla Motors is still growing reinvesting
is necessary for them, and a lot of their revenue goes to reinvestment, see figure 6-2. For this
reason, the cash flow after reinvestment is used. The reason for this is simply using the cash flow
generated is not taking into account the capital expenditures that is required to stay in business.

The cash flow model can be restructured into free cash flow.

 t
 FCFn TVt
 Value = ∑ n +
 WACC WACCt
 n=i

Where FCF is free cash flow to the firm.

 15
The accuracy of the discounted cash flow model dependent of a correct estimation of future cash
flows. A younger company like Tesla Motors, having a negative operating cash flow as seen from
figure 5-4 in the financial section, is common. As a result of this, a large part if not the entire part
of the total value of the company lies in the terminal. This was evident in the valuation made by
Deutche Bank (Bank, Lache, Nolan, & Levin, 2016) where 95% of Tesla’s value was captured in
the terminal value. This is the case with the valuation of Tesla performed in this paper, where the
terminal value accounts for 144 % of company value, see figure 8-1,8-2,8-3 in the valuation
chapter. As such the valuation is very sensible to impacts on the discount rate, which is
compounded when discounting the terminal value.

2.7.2 Economic value added
The model called Economic Value Added (EVA), is another way to valuate a company. The
premise of the model is that it analysis the key component of firm value. The basic principle of
EVA analysis is that the key driver of firm value is the spread between the return on existing
investments and the cost of capital of the investments. Compared to DCF models it accounts for
the initial capital cost, whereas the DCF calculates the future cash flows (Adserà et al., 2003). The
Economic Value Added model calculates the economical profit. The economical profit is defined
as Total revenues – cost of capital. The models valuate the difference between revenue and
economical cost (book cost + opportunity cost) (Kislingerov, 2000). The formula of EVA is as
follows:

EVAt = NOPATt -Ct *WACCt .

Where NOPAT is Net Operating Profit After Tax

Ct is long term capital.

This formula can be rewritten to account for not just the EVA, but the value of the company:

 n EVAn
 EVAt WACCn
 Value of a company =Ct + ∑ + n
 (1+WACCt )t (1+WACCn )
 t=1

Where n is the length of the forecasting period.

 16
The EVA model and DCF model should provide the same firm valuation, if they are both applied
using correct assumptions (Adserà et al., 2003). That is, if the forecasted revenues or the market
analysis is incorrect, the models will not provide the same results.

2.8 Terminal value
Since growth companies can’t keep up their high growth rates indefinitely it can be difficult to
calculate the present value with discounted cash flows. If the momentarily growth rate is
extrapolated into perpetuity the result will be an overpriced company. The terminal value is used
as a point where the growth of the company has matured. For growth companies a lot of the value
of the company is captured in the terminal value. Consequently, the terminal value will play a
much more defining part in the valuation in a growth.

The terminal value can be calculated in the follow three ways (Damodaran, 2002).

2.8.1 The liquidation value
This method assumes that the firm will cease to exist at some point. At that point it will sell all of
its assets to the highest price possible. The liquidation value is the value of all the assets at this
given point in time. There are two different ways to calculate the liquidation value:

Book value of assets – adjusted for inflation: This method does not account for the future earning
potentials of all the assets because it only takes book value into account. The formula for deriving
this value is:

 = ∗ (1 +
 )

Another way to calculate the value is by estimating the earnings power of the assets. It is important
to remember to deduct the debt from the equation because a buyer would not buy this.

2.8.2 The exit multiple method
The model calculates the value an acquirer could reasonably expect to pay if the target is sold at
the end the forecasting period. The exit value is computed by using a variety of multiples, as
mentioned in the introduction to valuation there are various different ratios for this. The price is
then discounted back to achieve a present value. The problem with using this model is that you are
combining a relative valuation method with a discounted cash flow method which is an absolute
valuation.

 17
2.8.3 The perpetuity growth model (stable growth model)
This model assume that the company’s cash flow will continue to grow at a constant rate in
perpetuity. The point is to extrapolate the cash flows into the future by using a constant growth
rate. This can be done either by using the existing growth of the firm or by choosing your own
rate. It is however rare that a very high growth rate as seen in growth companies can be maintained
and therefore do the analyst tend to pick a rate that is more in line with the long-term inflation rate
plus 1 – 2 percentage. The continuing value is calculated as follows:

 FCFt+1 FCFt *( 1+g)
 CVt = =
 WACC-g WACC-g

The perpetuity growth model is the most appropriate to use for a company that is in the same
development phase as Tesla. And it will therefore be used to calculate the terminal value of Tesla
Motors.

2.8.4 The extended value driver formula
The perpetuity model introduced above in the text is not the only model which calculates
discounted cash flow with an infinite time horizon. From Jennergrens (Jennergren, 2012) study of
the application of perpetuity model, he discovered that there were some situations in which the
formula did not capture the correct value, namely when the cash operating expense as a fraction
of revenue is different between growth projects and existing operations.

A team from McKinsey have developed a formula which is called “ Value driver formula”
(Jennergren, 2012). The formula is another way of determining value for infinite cash flows. The
article set out to explain under which circumstances the perpetuity model or the value driver
formula is applicable. The article divides the valuation formula up in to two groups, the first group
is existing operations and which is operations that are initiated at the start of the post-horizon
period, and which value is not captured by the terminal value. The other group is the growing
project which is initiated in the post-horizon period and is captured in the terminal value. The
premise of the article is that the return on growth projects can be less than that of existing
operations. The underlying assumption behind this is that as the company matures the market
matures with it and abnormal returns are rarer to come by (Jennergren, 2012). The study shows
that the perpetuity model and the value driver formula is equivalent under the assumption that the
working capital requirement between existing operations and growth projects is different. The

 18
result of the research of Jennergren (Jennergren, 2012)is a much more elaborate formula for
calculating firm value.

The extended value driver formula:

 +1 (1− ) 1 +2 (1− )

 = + − ∗ ( − +1 ) ,
 − −

Where:

NOPLAT is Net Operating Profit Less Adjusted Tax after-tax sales revenue minus operating
expense, minus accounting depreciation of PPE plus tax savings from tax-deducible depreciation.
ROIC is return on invested capital
i is the inflation
c is the nominal growth rate

PROJNOPLAT is project NOPLAT at the end of year T + 2 = g(1+i) [ST+1 (1- ẑ)(1- τ)-
1
 aFnc (1-τ) ]
n

PROJINVCAP is project invested capital at the end of year T + 1 = g(1+i)[aFN N
 C (1- HC )+ w
 ̂ ST+1 ]
 PROJNOPLATT+2
PROJERONIC is project Return on Invest New Capital = PROJINVCAPT+1

ST+1 is the forecasted sales revenue at the end of period T+1

 is the gross PPE at the end of year T, and is calculated as:

a = the last expenditure of PPE cohort at the end of year T and

 is the backwards summation factor under the steady-state nominal growth rate c for PPE
cohorts, that have not yet reached the end of their economic life n,

 n-1 v -(n-1)
 1 1+c-(1+c)
 FnC = ∑ ( ) =
 V=0 1+c c

 is the steady-state accumulated depreciation as a fraction of nominal gross PPE, as earlier c is
the nominal growth rate of the depreciation is linear over n years:

 1 v v
 ∑n-1
 v=0 [( 1+c ) * n] 1 1
 HnC = = -
 n
 FC cn (1+c)n -1

 19
ẑ is the cash operating expense for growth projects as a fraction of sales revenue

w
̂ is the working capital for growth project as a fraction of sales revenue.

While this method could be a good way to value the terminal value of a company. The simplicity
of the perpetuity model leaves less assumptions to be made by the author and therefore increases
the validity of the valuation.

2.9 Limitations
The above models are prone to the same limitation. They assume that elements such as risk and
WACC and capital structure are constant. This is not always the case, and in order to get a more
realistic view of these numbers one have to know more about the macro environment. Another
problem with this valuation method is the determination of stable growth.

When the results of the estimation of a firm is higher than the market growth, the result is implicit
saying that their return rate is higher than the required return rate for that period of time. If the
market is efficient, it is not possible to maintain an above market return for a longer period. In
competitive markets this is not possible and therefore will the excess return move towards the
required return.

Damodaran (Damodaran, 2002) mentions three critical points/assumptions when determining the
cash flow. While these will be expanded on later in the paper, the following is a quick summarizing
of the critical points and how they are addressed.

- When will the firm become a stable growth firm?
 o In the conclusion to the growth chapter, the Tesla is estimated to enter stable growth in
 year 10 of the forecast period.
- Cost of equity and capital.
 o In the WACC section the cost of equity is calculated to 6.12% and the cost of capital
 is 5.86%.
- How to evaluate the transition from high growth to stable growth.
 o In the strategy section is it found that after the growth period of five years, Tesla will
 move toward the stable growth of the economy.

Factors to determine for how long a firm will be able to maintain high growth (Damodaran, 2002).

 20
1. The size of the firm. Small firms have much less market share than larger firms and it is
 reasonable to expect that they will be able to maintain higher growth rates for longer
 periods of time. Furthermore, it is important to analyses the market potential, if the market
 keeps growing, the company can keep up the growth rate for a longer time.
 2. Existing growth rate and excess returns. As seen in the strategy section, Tesla have had a
 CAGR of 103% over the last five years, a growth it not be able to continue. While the
 growth has been high, the returns hasn’t been strong due to investment requirements.
 3. Magnitude and sustainability of competitive advantages. This is a very important part of
 the analysis and it will be explored in the strategic analysis. The importance of competitors,
 barriers to enter the market plays a vital role in determining the length and sustainability
 of the future growth rate. This will be elaborated in the strategy section.

When applying these perspective to Tesla, it shows that Tesla has a large growth potential. As
shown in figure 5-3 of peers in the strategy section, Tesla Motors’ revenue is much smaller than
that of its peers. They provide a fraction of the average revenue, with Tesla creating revenue at
less than 5% of its peers. From this small market share, it is assumed that there is potential room
for revenue growth.

2.10 Competitive advantage period
Competitive advantage period, as coined by Michael Mauboussin (Mauboussin & Johnson, 1997)
is the period in which a company can be expected to earn excess returns. According to economic
theory of the efficient market it is not possible in the long run to run a business whose earnings
excess that of the market. If a company earns above market returns, it will consequently attract
other competitors to the same market and thereby compete with the existing company. This will
eventually drive the price to a point in which the marginal cost = marginal revenue or when the
returns of the company only equal the required returns. Because the environment is a large part of
the competitive advantage period, theories such as those developed by Michael Porter (1980) can
be useful (Mauboussin & Johnson, 1997). Through the article of Mauboussin & Johnson (1997)
drivers for CAP is explained to be:

- Company’s current return on invest capital
 o Higher ROIC within industries are best positioned, this factor in e.g. economies of
 scale, entry barriers and management execution.

 21
- Rate of industry change
 o It is difficult to maintain advantages in rapid changing sectors and therefore is it harder
 to keep high return rates in these sectors than in more steady sectors.
- Barriers to entry
 o The difficulty in which new players can enter the market. For instance, in the
 automotive industry, it takes a lot of capital to develop and start producing cars, where
 an app on the other side can be made with virtually no expense.

Tesla’s return on invested capital is very low, and have been negative the past five years. This can
be seen in figure 6-1 – Return on invested capital in the financial analysis section. However, Tesla
is still in their high growth phase, so negative ROIC is to be expected. While the barriers to entry
for new automotive companies is large, the risk of existing competitors to expand their production
to contain electric vehicles is relatively simple for established manufactures. Based on the above
it is estimated that Tesla Motors’ competitive advantage period to be the present, however with
the risk of other automakers turning their focus on electric vehicles, the period could be short.

2.11 Conclusion to the theory
All the different models have their merits, and using one particular is a challenging and difficult
task for the analyst. In theory, the models should provide the same result, however as the analyst
has to make assumptions as what input to give to the model, the result is rarely consistent.

2.11.1 Occam’s razor
When selecting a theory to uses for valuation, the method of Occam’s Razor become relevant.
Occam’s Razor is used as a heuristic technique to guide scientist through developing theoretical
models (Gauch Jr., 2003). The method states that when choosing among different methods then
the one with the least assumptions should be chosen (Gauch Jr., 2003). While the selection of
valuation theory is not the same as discovering a new theory, the notion that the simpler theory
should be selected is relevant in this case. The reason being, the less assumptions the analyst has
to make, the less risk of error is there. This arguably reduces the risk of getting two of the four
criteria mentioned in the introduction (realistic assumptions, and precision) wrong.

2.11.2 Economic value added and discounted cash flow
As mentioned in the introduction DCF and EVA should produce the same result, because EVA is
mathematically derived from the DCF model. In the EVA model, there is a need for the starting

 22
capital base. This is crucial part of the valuation, but it is prone to biased since the term tries to
summarize the capital adjustments over time to one parameter. For instance, if there is a very low
start capital, it become “easier” to generate high value. This is in contrast to the DCF model which
can show if the company return is less that the cost of capital.

To get a better understanding of the discount rate and valuation, both methods will be applied to
valuate Tesla Motors.

 23
3 Weighted average cost of capital
The following chapter will introduce the reader to the weighted average cost of capital. The
purpose with the chapter is to give the theoretical arguments for the choice of discount rate. The
theory will then be applied to Tesla, and the weighted average cost of capital will be calculated
and used as discount rate. The rate will then be applied to the valuation, and with the results, a
sensitivity analysis will be performed in the sensitivity chapter.

The Weighted Average Cost of Capital (WACC) is used as the discount rate to find the present
value of future cash flows. The numeral value of WACC reflect the investors’ expected
return/compensation taking time and risk into account. As the name suggest the WACC is the
weighted average of the overall capital structure of the firm. That is the cost of equity (KE) and the
cost of debt (KD). The cost of equity is often calculated by using capital asset pricing model
(Sharpe, 1964) and the cost of debt is the effective rate the company pays on its debt. The cost of
capital can be either before or after tax. Because interest expense is deductible in most countries,
after tax rate is usually used. The weighted average cost of capital is a representation of the
expected return from all the company’s securities (Mian & Velez-Pareja, 2007).
The after tax weighted average cost of capital with tax shield is calculated as follows:

 WACCAT =WE * KE + WD * KD (1- TC )

Without the tax shield WACC is calculated as follows:

 WACCBT =WE * KE + WD * KD

3.1 Tax rate
When Modigliani and Miller (1958) introduced their theory on the irrelevance of capital structure,
they assume that there are no taxes. The reality is that taxes are present, and the capital structure
is not irrelevant. The firm can benefit from debt since interest rates can be deductible. This is
known as a tax shield. Vélez-pareja (2016) argues in his article that the tax shield of a company
which has no positive EBIT has the value 0. It is assumed that the corporate tax rate is constant
throughout the valuation period. The formula implies that interest will be paid every year
throughout the life of the project. It is assumed that the tax shields are always realized in the year
in which they occur meaning that earnings before interest and taxes are greater than or equal to the
expected interest charges and that the tax is paid the same year as accrued. Whereas this is not the

 24
case for Tesla, the accounting regulations of Tesla (PricewaterhouseCoopers, 2015), allows them
to carry forward losses and therefore utilize the tax shield at a later date (Mian & Velez-Pareja,
2007).

Based on the reasoning above, the weighted average cost of capital with tax shield is applied in
the valuation. The free cash flows which is required in the forecasting, are applied after deduction
of tax. Therefore, there must be accounted for tax. As Tesla is not operating only in America, but
in a lot of different countries with equal amount of different tax structures, the average tax rate of
the world 23.63% is applied (KPMG). Since Tesla have yet to produce positive EBIT, and thereby
paying tax, Tesla’s effective tax rate is unknown. It is assumed that their effective tax rate will
adjust to the average rate when (if) they produce profit and have used their tax-shield.

3.2 Return on equity
The expected return on equity, re is in the literature calculated by the capital asset pricing model
(CAPM) (Sharpe, 1964). The expected return on equity is the required return on a security which
is used to explain what the opportunity cost of investing in another portfolio.

The capital asset pricing model (CAPM) was first developed by (Sharpe, 1964) and (Litner, 1965).
The model is widely used in finance and assumes that the cost of equity is a linear function of
market risk. The cost of equity is often used as the investors’ required return on a security, equal
to the opportunity cost of investing in an alternative portfolio. Consensus within the literature
points to the capital asset pricing model for calculating the opportunity cost. As with many theories
there are limitations and assumptions to be made when using capital asset pricing model (Pratt &
Grabowski, 2014). The model requires several inputs, and is calculating a single-period, the data
however can be the sum of several periods.

 ( ) = + ∗ ( )

E(Ri) = expected return for an individual security
Rf = Rate of return available on a risk-free security
β = market beta
RPm = Equity risk premium (ERP) for the market as whole.

The following sections will break down the components for the capital asset pricing model.

 25
3.2.1 The risk free rate, rf
The risk free rate is denominated as the return of a security that the market generally regards as
free of the risk of default (Pratt & Grabowski, 2014). No security is of course completely free from
risk, but the model assumes such a position is available. In developed and financial stable
countries, the government is viewed as default free. For this reason, the long-term government
bond rate has been used as the risk free rate. This stems from the government has the option to
either raise taxes or print money. The risk free rate incorporates the expected inflation because the
risk-free rate increases or decreases as inflation estimates change (Pratt & Grabowski, 2014). If
the inflation increases the risk-free rate also increases and if it decreases the risk-free rate
decreases. Studies performed (Mikherji, 2011) however concluded that the market risk and
inflation only explains 13 % of variation in real treasury bill return, 20% in intermediate
government bond return and 23% of long government bond return. This discrepancy is mainly
because the unanticipated inflation affects the real return on securities with fixed cash flows. Since
longer-term securities have fixed cash flows for longer periods than the short term securities the
effect on these is larger than on the short term securities. It is concluded (Mikherji, 2011) that the
best proxy for risk free rate is the American treasury bills.
When estimating the risk-free rate, it is important to take the period of the cash flow into account.
That is, if the cash flow is only valued for three years in the future, the risk-free rate should reflect
that. To be consistent, the time period for the risk-free rate should reflect the same considerations
as the beta. The values are taken from June 30th, because Tesla’s newest quarter report is dated
there. The five –year treasury bill was as of June 30th 1.01 % (U.S Department of Treasury, 2016).
Consequently, the five – years beta calculation is applied.

3.2.2 Systematic risk, β (beta)
The beta is known as the systematic risk. Systematic risk is known as un-diversifiable risk, and
the risk affects the entire market. The risk cannot be mitigated and cannot be avoided through
diversification. In the capital asset pricing model (Sharpe, 1964) beta is used with equity risk
premium (ERP) and risk free rate to estimate the equity price. The beta is calculated using the
following formula:

 ( , )
 =
 ( )

 26
You can also read