CCC S.A. Equity valuation: Repositório Institucional da ...
←
→
Page content transcription
If your browser does not render page correctly, please read the page content below
Equity valuation:
 CCC S.A.

 Marcin Rękawiczny

 Dissertation written under the supervision of
 Prof. José Carlos Tudela Martins

Dissertation submitted in partial fulfilment of requirements for the MSc in
 Finance, at the Universidade Católica Portuguesa, June 7th 2019
Company name: CCC S.A. Recommendation: BUY
 Stock Exchange: Warsaw Stock Exchange Current price as of 15th March 2019: 203,20 PLN
 Ticker symbol: CCC Target price: 306,07 PLN (+50,63% upside)
 Operating Industry: Clothes Retail Valuation range: PLN 283,01 to 333,08
 Subindustry: Footwear & accessories Free Float: 64,28%

 INVESTMENT SUMMARY
 Market Profile BUY: A buy recommendation was issued with a target price of 306,07 PLN
Closing Price 203,20
52 week high 305,88 per common share and a valuation range of PLN 283,01 to 333,08, which
52 week low 167,00 represents a strong upside potential (+50,63%). This recommendation is based
Market Cap (m PLN) 7 958
Cost of equity 13,89%
 on the combination of favourable macroeconomic environment and company-
Beta 1,52 specific factors that place the company in a particularly strong and competitive
Perpetuity Growth Rate 2,92%
5-year revenue CAGR 25,20%
 position in the footwear retail sector in Central-Eastern Europe.
Tax rate (Poland) 19%
 FAVOURABLE MACROECNOMIC ENVIRONMENT: countries of
 Financial Data (m PLN)
 Year 2017 2018 CEE are currently growing at above-average rate, gradually catching up with
Revenue 4 194 4 944
 developed economies. High real GDP growth and increasing disposable
Gross Profit 2 150 2 498
EBITDA 497 338 income facilitate growing consumption, which in turn favour retail sales.
IFRS16 EBITDA 497 815
Net Profit 302 57
EPS 7,34 1,37
 GROWTH TREND: With annual growth over last 5 years at of 25% and
Dividend paid 2,30 n/a expected growth for the upcoming 7 years equal to 17,1% (CAGR terms), the
 Margins company is expected to develop faster than the underlying economy. However,
 Year 2017 2018
Gross Profit 51,3% 50,5% this growth should gradually slow down and eventually converge with the
EBITDA 11,9% 6,8%
IFRS16 EBITDA 11,9% 16,5%
 economy by 2025, when CCC is expected to reach its mature state.
Net Profit 7,2% 1,1%
 KEY OPERATING FACTORS: Looking-forward, CCC plans to focus on
 Stock Performance (last 2Y)
3,000.00 350.00
 further development of their e-commerce platform (eobouwie) as well
2,500.00
 300.00 continuing to expand in CEE markets by opening stores in the new format
 250.00
2,000.00
 200.00 (enlarged area, modern interior design). Furthermore, several acquisitions
1,500.00
 150.00
 have been made and their implementation is expected to yield synergies,
1,000.00 100.00
 03/01/2017 03/01/2018
 mainly through broader product offer and widening of the customer base.
 WIG20 (left) CCC (right)

 RISK FACTORS: Key risk for the business performance is potential
 Valuation Metrics
 Year 2019 2020 contraction in the economy, resulting in lower GDP growth, followed by a
EV/EBITDA 11,14 9,50
EV/Sales 1,50 1,32 slowdown in retail sales. Furthermore, possible entrance of e-commerce giants
P/E 20,89 17,37
 (e.g. Amazon) on the markets of CEE might result in greater customer attrition.
 Operating metrics (2018)
Days Sales Outstanding 10,72 PROFILE: Poland-headquartered CCC S.A. is a major footwear retailer in
Days Payables Outstanding 147,72
Days Inventory on Hand 308,71 the region of Central-Eastern Europe. Their main revenue stream comes from
Cash Conversion Cycle 171,71
Current Ratio 1,08
 sales of shoes (88,4%), while the remaining part is generated through sales of
Cash Ratio 0,15 bags and accessories.
Abstract
The aim of this dissertation is to determine the target share price of CCC S.A. as of 15th March
2019 (publication date of financial data for FY2018) and to issue an appropriate investment
recommendation (buy, hold, sell) relative to the market price on that day. The target company
is listed on the Warsaw Stock Exchange (Poland), operates in the footwear retail industry and
is the key player on the Central-Eastern Europe market. As such, the underlying research
question is: “What is CCC S.A. fair value per share as of 15th March 2019 and how does it differ
from the price on the market?”. The valuation process is built upon a thorough analysis of the
company, its competitive environment, current macroeconomic conditions and expected market
trends in the clothing retail industry. The primary valuation method used was the Discounted
Cash-Flows model, aiming to reflect the intrinsic value of the company. This valuation was
complemented with a relative valuation method, that utilizes forward-looking trading multiples
for Comparable Companies. The valuation methods determined a target price range of PLN
283,01 to 333,08 per share. Given a closing price of 203,20 PLN per share on Friday, the 15th
March 2019 (publication of end-of-year financial statements) a BUY recommendation has been
issued. The recommendation is in line with equity research report issued by J.P. Morgan on 25th
April 2019 (buy recommendation with target price of 274 PLN).
Key words: CCC, footwear retail industry, valuation, DCF, Poland

Resumo

O objetivo desta dissertação é determinar o preço das ações da CCC S.A. a partir de 15 de
março de 2019 (data de publicação dos dados financeiros para FY2018) e emitir uma
recomendação de investimento adequada (comprar, segurar, vender) em relação ao preço de
mercado nesse dia. A empresa-alvo está listada na bolsa de valores de Varsóvia (Polônia), atua
no setor de calçados e é considerada a principal empresa no mercado da Europa central-oriental.
Como tal, a questão subjacente da pesquisa é: "Qual o valor justo da CCC S.A. por ação a partir
de 15 de março de 2019 e como este difere do preço no mercado?". O processo de avaliação
baseia-se numa análise aprofundada da empresa, do seu ambiente competitivo, actuais
condições macroeconómicas e das tendências de mercado esperadas no sector. O método de
avaliação principal utilizado foi o modelo de fluxos de caixa com desconto, visando refletir o
valor intrínseco da empresa. Esta avaliação foi complementada pelo método de valorização
relativa para empresas comparáveis. Os métodos de avaliação determinaram uma variação do
preço-alvo de PLN 283,01 a 333,08 por ação. Dado o preço de fecho de 203,20 PLN por ação
no dia 15 de março de 2019 uma recomendação COMPRA foi emitida. A recomendação está
em consonância com o relatório de pesquisa de capital emitido pelo J.P. Morgan a 25 de abril
de 2019 (recomendação de compra com preço-alvo de 274 PLN).
Palavras-chave: CCC, indústria de varejo de calçados, valuation, DCF, Polônia

 I
Acknowledgments
This thesis is the final step in my university education. Throughout last few years, I had the
opportunity to study in several countries, meet dozens of people of different nationalities and
create a group of people, who I am lucky to call my friends. None of this would have ever
happened without the unconditional support of my parents. I dedicate this thesis to them.

Furthermore, I would like to thank my friends: Denis, Martin and Lorenzo for a great company
during the thesis semester. I highly appreciate our discussions about finance, valuation and time
spent together while working on our models. Moreover, many thanks go to all my fellow
students from Master Degree, who made this time at Católica special and unforgettable.

I also would like to thank my former colleague from work, Paulina, for her help to obtain the
equity research report from an investment bank.

Last, but not least, I would like to thank my advisor, Professor Tudela Martins, for his guidance
and valuable inputs, as well as for all the knowledge learned during the Firm Valuation class.

 II
Table of contents
 Abstract ................................................................................................................................................................ I
 Acknowledgments .............................................................................................................................................. II
 Table of contents .............................................................................................................................................. III
 List of Figures .....................................................................................................................................................V
 List of Formulas................................................................................................................................................ VI
 List of Appendices ............................................................................................................................................ VI
 List of Abbreviations ....................................................................................................................................... VII
1. Introduction ...................................................................................................................................................1
 1.1 Aim of this dissertation .......................................................................................................................... 1
 1.2 Fundamental problem: why do we value an asset that already has a price? .......................................... 1
2. Literature Review ..........................................................................................................................................3
 2.1 Overview of valuation methods ............................................................................................................. 3
 2.2 Absolute (intrinsic) valuation ................................................................................................................ 3
 2.2.1 Discounted Dividend Model ............................................................................................................. 3
 2.2.2 Discounted Cash Flows Models ........................................................................................................ 5
 2.2.3 Discount rates .................................................................................................................................... 6
 2.3 Relative valuation .................................................................................................................................. 8
 2.4 Other valuation methods ...................................................................................................................... 11
 2.4.1 Economic Value Added (EVA) ....................................................................................................... 11
 2.4.2 Net Asset Value (NAV) .................................................................................................................. 11
 2.4.3 Contingent claims (real options) ..................................................................................................... 12
3. Company overview ...................................................................................................................................... 13
 3.1 General information ............................................................................................................................. 13
 3.2 Business model and product mix ......................................................................................................... 13
 3.3 Value and supply chain........................................................................................................................ 14
 3.4 Geographical footprint ......................................................................................................................... 15
 3.5 Competitive environment .................................................................................................................... 15
 3.6 Share price performance ...................................................................................................................... 16
 3.7 Strategy for the future .......................................................................................................................... 17
 3.8 Past financial performance .................................................................................................................. 19
 3.8.1 Revenue and gross profit dynamic .................................................................................................. 19
 3.8.2 Operating profit (EBIT) dynamic .................................................................................................... 20
 3.8.3 Net profit dynamic .......................................................................................................................... 20
 3.8.4 Past changes in Working Capital ..................................................................................................... 21
 3.8.5 Changes in debt structure and cost of debt ...................................................................................... 21
4. Macroeconomic environment and market overview ................................................................................ 23
 4.1 Macroeconomic environment ..................................................................................................................... 23

 III
4.1.1 Macro: Central-Eastern Europe ....................................................................................................... 24
 4.1.2 Macro: Poland ................................................................................................................................. 26
 4.2 Footwear: worldwide market overview ............................................................................................... 27
 4.2.1 European footwear market .............................................................................................................. 28
 4.2.2 Polish footwear market .................................................................................................................... 28
 4.2.3 Fashion market ................................................................................................................................ 29
5. Valuation of CCC S.A. ................................................................................................................................ 31
 5.1 Discounted Cash Flow Valuation ........................................................................................................ 31
 5.1.1 Revenue projection.......................................................................................................................... 32
 5.1.2 Operating expenses: COGS and SG&A .......................................................................................... 34
 5.1.3 Other costs and revenue .................................................................................................................. 35
 5.1.4 Tax liability: taxes paid and tax rate ................................................................................................ 35
 5.1.5 Depreciation and Amortization (D&A) ........................................................................................... 36
 5.1.6 IFRS16 (leases) ............................................................................................................................... 36
 5.1.7 FCFF Projection: CAPEX ............................................................................................................... 37
 5.1.8 Changes in Net Working Capital ..................................................................................................... 38
 5.1.9 Cost of capital ................................................................................................................................. 39
 5.1.10 Terminal Value ........................................................................................................................... 42
 5.1.11 DCF Value .................................................................................................................................. 42
 5.1.12 Sensitivity analysis ..................................................................................................................... 43
 5.2 Relative valuation: comparable companies ......................................................................................... 44
 5.2.1 Selected Peer Group ........................................................................................................................ 44
 5.2.2 Multiples chosen ............................................................................................................................. 45
 5.2.3 Valuation ......................................................................................................................................... 46
6. Comparison with Investment Bank ........................................................................................................... 47
7. Conclusion .................................................................................................................................................... 49
8. Appendix ...................................................................................................................................................... 50
9. References .................................................................................................................................................... 55
 9.1 Articles, Books and Research Papers .................................................................................................. 55
 9.2 Databases, Reports and Websites ........................................................................................................ 57
 9.3 Company’s own information ............................................................................................................... 58

 IV
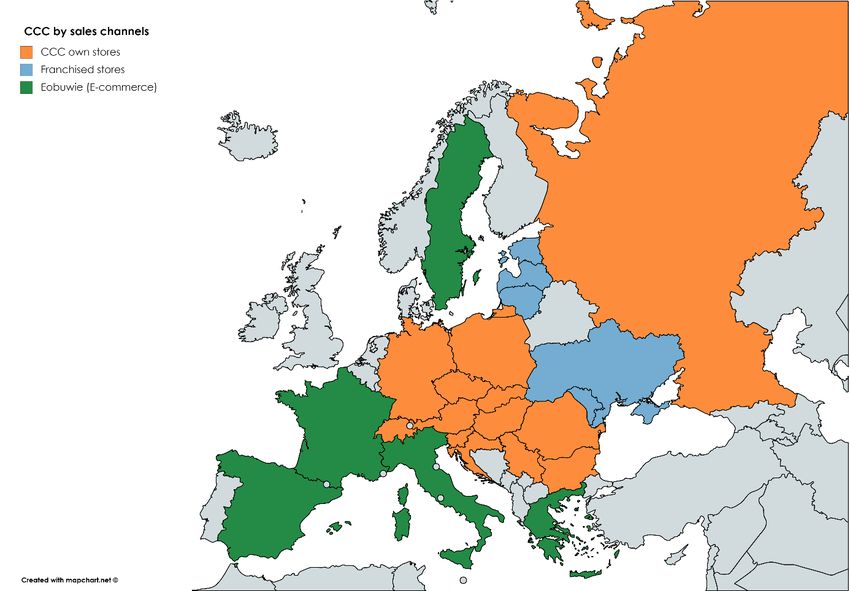
List of Figures
Figure 1: CCC S.A. sales structure by product (Annual report for FY2018) ........................................................ 13
Figure 2: CCC S.A. sales structure by channel (Annual reports for FY 2014-2018) ............................................ 14
Figure 3: CCC S.A. structure of suppliers (Annual report for FY2018 ................................................................ 14
Figure 4: CCC S.A. structure of sales by geographical region (Annual reports for FY 2015-2018) .................... 15
Figure 5: Main footwear retailers in Poland by number of stores (various sources, 2018) ................................... 16
Figure 6: Closing price of WIG20 Index and CCC stock (bankier.pl, 2019) ........................................................ 16
Figure 7: Relationship between dividends paid and EPS for CCC S.A. (Annual report for FY2018) .................. 17
Figure 8: Shareholders structure by percentage share in capital and votes number (Annual report for FY2018). 17
Figure 9: Potential of new clients: by price (left side) and by age (right side), CCC Investor Day Presentation.. 19
Figure 10: CCC S.A. – Revenue dynamic (Annual reports for FY2014-2018) .................................................... 19
Figure 11: CCC S.A. – operating profit margin (Annual reports for FY2014-2018) ............................................ 20
Figure 12: CCC S.A. – net profit margin (Annual reports for FY2014-2018) ...................................................... 20
Figure 13: CCC S.A. – Working Capital structure (Annual reports for FY2014-18) ........................................... 21
Figure 14: CCC S.A. – debt structure (Annual reports for FY2014-18) ............................................................... 21
Figure 15: CCC S.A. – cost of debt financing (Annual reports for FY2014-18) .................................................. 22
Figure 16: Consumption expenditure, annual percentage growth (World Bank, 2019) ........................................ 23
Figure 17: Retail trade volume in the EU, 28 countries rebased as of 2010 (Eurostat, 2019) ............................... 23
Figure 18: Market capitalization of domestic companies in percentage of GDP (World Bank, 2019). ................ 24
Figure 19: Annual GDP growth in percentage (World Bank, 2019) ..................................................................... 25
Figure 20: Unemployment, total percentage of labour force (World Bank, 2019) ............................................... 25
Figure 21: Inflation rate in major CEE countries (in percentage; World Bank, 2019) .......................................... 25
Figure 22: Macroeconomic data for Polish households (OECD database, 2019) ................................................. 26
Figure 23: FX Exchange rate for PLN, USD and EUR for 2014-2019 (Thomson Reuters EIKON) .................... 27
Figure 24 & 25: Footwear worldwide, sales in B EUR (left) and footwear worldwide: biggest markets (right) .. 27
Figure 25 & 27: footwear export worldwide (m EUR, left) and main world footwear exporters (right) .............. 28
Figure 26: European footwear market by segment, sales in B EUR (Statista, 2018) ............................................ 28
Figure 27: Footwear market in Poland, sales in m EUR (Statista, 2018) .............................................................. 29
Figure 28: Revenue forecast for CCC S.A. by business segment ......................................................................... 32
Figure 29: Projection of new stores openings ....................................................................................................... 33
Figure 30: Projection for revenue generated per 1 square meter of commercial space ......................................... 34
Figure 31: Correlation between growth in the Retail Sales Trade Volume and Real GDP (Eurostat, 2019) ........ 34
Figure 32: Projection of Cost of sales (COGS) ..................................................................................................... 35
Figure 33: Projection of SG&A expenses ............................................................................................................. 35
Figure 34: Weighted average income tax rate – past data and projections ........................................................... 36
Figure 35: Forecast for D&A expense .................................................................................................................. 36
Figure 36: Structure of D&A expenses by category of fixed assets ...................................................................... 36
Figure 37: IFRS16 implications and projections of lease liability (related to stores) ........................................... 37
Figure 38: CAPEX projections ............................................................................................................................. 38
Figure 39: Projection of changes in Net Working Capital .................................................................................... 38
Figure 40: NWC – supplementary information ..................................................................................................... 39
Figure 41: Cost of debt by category ...................................................................................................................... 41
Figure 42: Detailed derivation of WACC ............................................................................................................. 42
Figure 43: Terminal Value calculation .................................................................................................................. 42
Figure 44: Enterprise Value – Equity bridge ........................................................................................................ 43
Figure 45: FCFF historical values and projections for CCC S.A. ......................................................................... 43
Figure 46: Sensitivity analysis for changes in WACC and long-term growth rate (g) .......................................... 44
Figure 47: Broad list of comparable companies before final selection ................................................................. 45
Figure 48: Relative valuation: multiples for selected peer group .......................................................................... 46
Figure 49: Relative valuation: implied EV value .................................................................................................. 46
Figure 50: Price per share derived based on relative valuation ............................................................................. 46
Figure 51: Comparison of assumptions with J.P. Morgan equity research report for CCC S.A. .......................... 47
Figure 52: J.P. Morgan equity research report: projections for CCC .................................................................... 47
Figure 53: FCFF components for CCC from performed analysis (for comparison purpose) ................................ 48
Figure 54: J.P. Morgan continuous coverage of CCC stock ................................................................................. 48

 V
Figure 55: Valuation range for CCC S.A. based on method used (red line – share price as of 15th March 2019) 49

List of Formulas
Formula 1: Gordon Growth Model with constant growth rate ................................................................................ 4
Formula 2: Multi-stage DDM ................................................................................................................................. 5
Formula 3: Discounted Cash Flows Model ............................................................................................................. 5
Formula 4: FCFE .................................................................................................................................................... 6
Formula 5: FCFF ..................................................................................................................................................... 6
Formula 6: CAPM ................................................................................................................................................... 7
Formula 7: Fama-French 3-factor model ................................................................................................................ 8
Formula 8: WACC .................................................................................................................................................. 8
Formula 9: EVA .................................................................................................................................................... 11

List of Appendices
Appendix 1: CCC S.A. SWOT analysis (author’s own elaboration) .................................................................... 50
Appendix 2: Geographical footprint of CCC Group S.A. by sales channels (Annual report for FY2018) ........... 50
Appendix 3: Leverage metrics for CCC S.A. (data in million PLN; Annual reports for FY2014-2018) .............. 51
Appendix 4: Solvency metrics for CCC S.A. (Annual reports for FY2014-2018) ............................................... 51
Appendix 5: Main operating and liquidity metrics for CCC S.A. (Annual reports for FY2014-2018) ................. 51
Appendix 6: Porter 5-Forces analysis of the shoe retail market in Poland (author’s own elaboration) ................ 51
Appendix 7: CCC S.A. - recent acquisitions (CCC Q4 2018 Presentation) .......................................................... 52
Appendix 8: Growth in the CCC commercial floor area (Annual reports for FY2014-2018) .............................. 52
Appendix 9: Daily returns on CCC S.A. stock (stooq.pl) ..................................................................................... 53
Appendix 10: Daily returns on WIG Index (stooq.pl) ........................................................................................... 53
Appendix 11: Relative Valuation, Tier 1 peer group (author's own elaboration) ................................................. 53
Appendix 12: Relative Valuation, Tier 2 peer group (author's own elaboration) ................................................. 54
Appendix 13: Relative Valuation, broad group of Comparable Companies (author's own elaboration) .............. 54

 VI
List of Abbreviations
APV Adjusted Present Value
CAGR Compounded Annual Growth Rate
CAPM Capital Asset Pricing Model
CAPEX Capital Expenditure
CEE Central-Eastern Europe
COGS Cost of Goods Sold
CSR Corporate Social Responsibility
D&A Depreciation and Amortization
DCF Discounted Cash-Flows
DDM Discounted Dividend Model
DIH Days Inventory on Hand
DPO Days Payable Outstanding
DSO Days Sales Outstanding
DTA Deferred Tax Asset
DTL Deferred Tax Liability
EBIT Earnings before Interest and Taxes
EBITDA Earnings before Interest, Taxes, Depreciation and Amortization
EPS Earnings per share
EUR Euro
EV Enterprise Value
EVA Economic Value Added
FCF Free Cash-Flows
FCFE Free Cash Flow to Equity
FCFF Free Cash Flow to Firm
FX rate Foreign Exchange rate
FY Financial Year
GDP Gross Domestic Product
IFRS International Financial Reporting Standards
M&A Mergers and Acquisitions
MRP Market Risk Premium
MV Market Value
NAV Net Asset Value
NOPAT Net Operating Profit After Taxes
NWC Net Working Capital
P/E Price-to-Earnings
PEG Price-to-Earnings adjusted for Growth
PLN Polski Nowy Zloty
PV Present Value
ROE Return on equity
SG&A Selling, General and Administrative Expenses
SWOT Strengths, Weaknesses, Opportunities, Threats
TV Terminal Value
USD U.S. Dollar
WACC Weighted Average Cost of Capital
WIG Warszawski Index Gieldowy (Warsaw Stock Exchange Index)
WIG20 Warszawski Index Gieldowy 20 (Warsaw Stock Exchange main Index)
WSE Warsaw Stock Exchange
YTM Yield-to-Maturity

 VII
1. Introduction
 1.1 Aim of this dissertation
The aim of this report is to provide investment recommendation for CCC S.A., a Polish retailer
of shoes and apparel listed on the Warsaw Stock Exchange, as of 15th March 2019 (company’s
FY ends on the 31st of December, however the Financial Statements have been published on
that day). This valuation has been performed for academic purpose and as such cannot be
perceived as professional and binding investment advice.

This dissertation will have following structure: in the next chapter the most common valuation
methods and the legitimacy of their use will be presented. This theoretical consideration will
be followed by the analysis of target company’s operating and financial performance, as well
as the analysis of the industry it operates in and current macroeconomic environment. Upon
this foundation, selected valuation methods will be used to derive the share price, which will
be concluded with an appropriate investment recommendation. The computed valuation and
subsequent recommendation will be compared with the equity research report from the
investment bank (J.P. Morgan) and any discrepancies will be discussed.

 1.2 Fundamental problem: why do we value an asset that already has a price?
This question is the foundation for valuation theory: why would people incur costs, spend time
and make effort to build complicated valuation models, given that the company has an
observable price in the market? This issue is even more justified when one assumes that the
financial markets are believed to be (to some extent) efficient, and hence, the price should, in
theory, reflect all the public information (semi-strong efficiency) or even non-public
information (strong efficiency), thus making any technical and fundamental analysis redundant
(Fama, 1970).

This conundrum has been also defined as the Grossman-Stiglitz paradox (Grossman & Stiglitz,
1980), which states, that if the markets were efficient, no rational investor would incur cost of
valuation. The reasoning behind this theory is based on the assumption that as information is
costly, prices cannot perfectly reflect the available information because there would be no
compensation for the investors spending resources to obtain it.

The implication of this paradox is that investors believe in existing mispricing and thus are
motivated to engage in the valuation process. While seeking the true value of the stock, they
hope to be rewarded for their effort, that is defined as the abnormal risk-adjusted return (also

 1
known as alpha). As this process is based on deep research and competitiveness, individual
mistakes of the investors will eventually cancel out, brining efficiency to the market.

Therefore, the assumption of temporary mispricing, resulting in the possibility to achieve
abnormal returns means that the observable price in the market can reflect the true value but
does not necessarily have to.

Besides the underlying assumption that the mispricing exists and the observable market price
is not equal the true intrinsic value of the asset, investors also have to assume that the
convergence between them will occur in the foreseeable future. Even completely correct
valuation can result in the incurrence of losses, if the convergence does not occur within the
given investment horizon. This is particularly apparent in the history of investment funds and
portfolio managers, who happened to observe the mispricing but were not able to hold their
positions until the market eventually corrected itself.

Further, we should remember that the valuation is “a craft that combines art and science”
(Damodaran, 2016). While some inputs require deep understanding of economics as well as
financial and accounting knowledge, a substantial part of the valuation relies on the individual
assumptions of the investor. Making predictions about the future is highly subjective and
dependent on people’s perception of the world, their personality and professional knowledge
as well as the situation they are currently in. Many valuations will tend to be biased as the
people performing them are influenced by the principal that has entrusted them with this task.
The divergence in valuation between sell- and buy-side analysts and the prevalence of “buy”
over “sell” recommendations in equity reports are best evidences of bias’s occurrence (Jannati
et al., 2016).

 2
2. Literature Review
 2.1 Overview of valuation methods
Any valuation process requires the analyst to select an appropriate valuation method. These can
vary, depending on the characteristics of the asset. In this chapter I will briefly introduce the
most commonly used methods for the purpose of firm valuation, their applications as well as
their strengths and weaknesses. The underlying assumption here will be “going concern”, which
means, that the firm being appraised will continue to operate in the foreseeable future and is
not subject to liquidation.

 2.2 Absolute (intrinsic) valuation
Absolute valuation derives the value of the asset based on its individual characteristics
(Graham, 1962) and the Present Value of cash-flows it will generate in the future (Damodaran,
2002). For the purpose of equity valuation, this finds application for stable, mature companies
with predictable growth rates and profit margins. This method however, is not appropriate for
small, dynamically growing businesses (especially start-ups) where Cash-Flows cannot be
predicted accurately (Rosenbaum & Pearl, 2009).

By far the biggest advantage of absolute valuation methods is their reliance on the company’s
ability to generate cash-flows for investors, which are discounted with the required rate of return
for the capital they have provided.

However, this method requires a wide range of assumptions about company’s future
performance and any predictions by definition will tend to contain an error. No analyst is able
to completely forecast the future course of events, and hence many valuations will be flawed.

There are several valuation models that use cash-flows for investors. To use them correctly, the
analyst should be able to distinguish between cash-flows available for shareholders and those
that belong to all capital providers in the company (including debtholders).

 2.2.1 Discounted Dividend Model
Dividends are fractions of net income generated by the company and paid out to its
shareholders. As such, they are after-tax cash-flow that also excludes external sources of
financing and should be discounted with the cost of equity.

Based on the pecking order theory (Myers et al., 1984), the company would use retained
earnings first to finance new projects, as they are perceived to have lower cost of capital,
compared to debt financing or new equity issuance. However, the company should pursue new

 3
projects only if they are NPV positive and hence able to create value for shareholders (Berk &
DeMarzo, 2014). If there is a lack of value-creating investment opportunities, the company
should pay out earnings to the investors.

Based on the framework described above, we can assume that the Dividend Models will be
appropriate for mature, stable companies that do not have many new investment opportunities.
They should have a dividend policy that bears a consistent relationship to the company’s
profitability (Miller & Modigliani, 1961).

Companies tend to keep dividends at a certain level and are reluctant to cut it, as this would
send a negative signal to the market, implying that the company is expecting lower profitability
in the future (Ping & Ruland, 2006). Thus, dividends tend to be less volatile than earnings,
which also implies that Dividend Models should be less sensitive to short-term fluctuations in
underlying value as compared to other DCF models (Damodaran, 2009).

The relevance of Dividend Models has been decreasing over the last years as more companies
choose to return capital to their shareholders in the form of share buy-backs rather than
dividends due to tax efficiency (Fama & French, 2001). However, the dividend payout ratio for
companies that are already paying dividends has increased, making DDM a useful tool for their
valuation. Also, as stated in the Catering Theory (Baker & Wurgler, 2004), companies adapt
their dividend policy over time to changing investors tastes. Assuming income and capital gain
tax rate convergence, it is possible that Dividend Models will revive in the future.

The key input for the Dividends Models is the expected growth rate (g). Depending on our
expectations regarding future, we can use two approaches: constant growth or growth pattern.

 2.2.1.1 DDM with constant growth
If we expect dividends to grow at a stable rate indefinitely, then the appropriate valuation tool
is Gordon Growth Model (Gordon & Shapiro, 1956). Both discount (r) and growth (g) rate
should reflect long-term expectations. However, the usefulness of this model is compromised,
when cost of equity and growth rate are approaching numbers.

 Formula 1: Gordon Growth Model with constant growth rate

 ( + )
 = =
 − −

 ℎ : 0 = ℎ , 0 = ;
 = ; = ℎ ; 1 = ℎ ;

 4
2.2.1.2 Multi-stage DDM with growth pattern
Since the assumption of stable growth rate is not realistic for most companies, one can
overcome this problem with multi-stage model. Here, the valuation is divided into explicit
forecast period (where the growth rate can vary) and terminal value (where the GGM or
expected multiple of earnings can be used).

 Formula 2: Multi-stage DDM

 ( + )
 = ∑
 +
 ( + ) ( + )
 =

 ℎ : = ℎ ; ℎ 1

 2.2.2 Discounted Cash Flows Models
When the company is non-dividend paying or the dividend policy does not have relation with
generated earnings or capacity to pay (e.g. constant dividends) we can apply Free Cash Flow
Models. They are based on the actual cash-flows generated for the investors, but not necessarily
paid out. Since future cash-flows are not as readily available as dividends, they must be
predicted and require a range of assumptions (Rosenbaum & Pearl, 2009).

Valuation based on the FCFs is divided into projection period and terminal value. The
projection period usually covers upcoming five years or the time until the company reaches the
stable state (Koller et al., 2010). For this purpose, the assumptions regarding sales growth, costs
structure, necessary capital expenditures and amortization as well as changes in the Net
Working Capital have to be made. Terminal value assumes that the company is in its mature
state and is growing at the constant rate. Therefore, it is a common practice to use Gordon
Growth Model (described above) for its calculation.

 Formula 3: Discounted Cash Flows Model
 =

 = ∑ +
 ( + )
 =
 ℎ : = ℎ − ; = ; =

 2.2.2.1 Free Cash-Flows to Equity (FCFE)
While the dividends are calculated on the base of an accounting measure (net income), FCFE
is the real cash-flow available for common shareholders after all operating, investing and
financing expenses have been paid. This implies, that while computing them, any costs and

 5
benefits of external financing should be excluded. Thus, they should be discounted with the
cost of equity.

 Formula 4: FCFE

 FCFE = Net Income + Non-cash Charges - ∆Fixed Capital - ∆Working Capital + Net Borrowing

 2.2.2.2 Free Cash-Flow to the Firm (FCFF)
Probably more commonly used method is FCFF, as it reflects cash-flows for all capital
providers of the company (Pinto et al., 2007). As such, it should be discounted with Weighted
Average Cost of Capital (WACC) that includes costs and benefits of debt financing. To derive
the value of equity, the value of debt and preferred shares should be subtracted from obtained
value of the firm.

 Formula 5: FCFF

 FCFF = EBIT (1 – tax rate) + Non-cash Charges - ∆Fixed Capital - ∆Working Capital

 2.2.2.3 Adjusted Present Value (APV)
While the FCFF method is based on the target (optimal) capital structure and as such uses
constant WACC to discount company’s cash-flow, this might not be an appropriate valuation
tool for highly levered companies (Farber et al., 2006). As proven by Modigliani-Miller (1958)
at some point the benefits of debt financing are compromised by the expected bankruptcy costs.
To control for this problem, the APV method is an appropriate valuation tool, as it is composed
of unlevered firm value and net effect of debt (Booth, 2007).

The first component (unlevered firm value) is obtained through discounting of FCFF with the
cost of unlevered equity. Net effect of debt aligns the benefits of the Interest Tax Shield with
the expected bankruptcy costs (Mitra, 2010).

Although some of the inputs are highly subjective (particularly bankruptcy costs), the APV
method finds its application in the valuation industry, especially for levered buyouts
transactions (Luehrmann, 1997).

 2.2.3 Discount rates
Projected FCFs have to be discounted with an appropriate rate in order to return the value of
the company. Depending on the type of cash-flows, they should reflect the rate that the
particular capital providers require for their stake of capital.

 6
2.2.3.1 Cost of equity
DDM and FCFE reflect cash-flows to common shareholders and as such should be discounted
with cost of equity. There are several models that serve to estimate it and they will be further
discussed in the next paragraph.

 2.2.3.1.1 CAPM
By far the most popular model is Capital Asset Pricing Model (CAPM), developed in the 1960’s
by several academics (Treynor, 1961; Sharpe, 1964; Lintner, 1965), based on the former work
of H. Markowitz on modern portfolio theory (Markowitz, 1952).

 Formula 6: CAPM

 = + ∗
 ℎ : = ; = − ; −

The first component of the model, the risk-free rate, should reflect yield on the long-term
government securities, matching the predicted cash-flows of the company (Fernandez, 2004).
To truly reflect the risk-free investment, these should be issued by developed countries with
high quality rating (e.g. German Bunds for the Eurozone).

Beta is measure of one’s company stock risk in reference to the market (Koller et al., 2010).
For publicly traded companies, it can be obtained through regression of the stock returns on
market returns. When the company is not listed, beta can be obtained from its publicly peers by
adjusting their average unlevered capital structure to the target capital structure of the company
in focus (Bernardo et al, 2012; Pereiro, 2010).

The Equity Risk Premium is the incremental return over risk-free rate required for holding risky
equities. The most common method of ERP computation is the average difference between
historical return on the market index and the risk-free rate. However, as valuation is forward-
looking, macroeconomic models or survey estimates can be applied to adjust it for future
expectations (Damodaran, 2008).

 2.2.3.1.2 Multifactor models: Fama-French 3 factor model
Based on the premise that the CAPM explains about 70% of the diversified portfolio returns,
E. Fama and K. French developed 3-factor model that has a stronger (90%) predictive power
(Fama & French, 1993).

 7
Formula 7: Fama-French 3-factor model

 = + ∗ + ∗ + ∗
 ℎ : = ; = − ;
 = ; = ; =

The first factor is return on the market portfolio over the risk-free rate (one-month T-Bill rate).
The second factor is return on the portfolio composed of small market capitalization stocks
minus return on the portfolio of large capitalization stock (implying that small companies are
riskier). The third factor reflects return on the portfolio of stocks characterized by high book-
to-market ratio minus return on portfolio of stocks featuring low book-to-market ratio (implying
that value stocks are riskier than growth stocks).

 2.2.3.1.3 Weighted Average Cost of Capital (CAPM)
Since FCFF reflect cash-flows available to all capital providers (both equity and debt
financing), these cash-flows are discounted with WACC (Farber et al., 2006).

 Formula 8: WACC

 = ( − ) +
 + +
 ℎ : = ; = ;
 = ; = ; =

The share of equity and debt is weighted by their market value. Since the value of equity is
observable in the market and the calculation of its cost has already been covered, next paragraph
will focus on the debt component.

Market value of debt can be calculated based on the book value adjusted for current market cost
of debt. For public debt, current yield on all company’s outstanding debt securities can be used
(Koller et al., 2010). In case the company has only private debt, implied rating method or cost
of debt for comparable companies (with similar capital structure) can be used. Debt component
of WACC is multiplied by term (1 – effective tax rate), which reflects benefits of the tax shield.
(Graham, 2008).

 2.3 Relative valuation
Relative valuation, sometimes also defined as pricing, is derivation of the asset’s value based
on the current market price of similar assets. The underlying assumption here is the law of one
price, stating that two assets with the same risk and cash-flows should trade at the same price
in order to exclude the arbitrage opportunity. Since there are no two identical companies in the

 8
world, this theoretical law can only be applied in the restricted form for the purpose of equity
valuation. However, we assume that companies sharing the same business and financial profile
should trade at roughly the same price. In order to control for the business size, the value of the
target can be derived based on weighted multiples of key financial metrics and value drivers for
its peer group (Eberhart, 2004).

While the calculation of the multiples is a straightforward task, identification of an appropriate
peer group tends to be challenging (Bhojraj & Lee, 2002). In order to identify the best
comparable, an analyst should obtain precise understanding of the company being valued, the
characterises of its business model and key value drivers, as well as inherent risks and economic
forces shaping the industry it is operating in (Rosenbaum & Pearl, 2009).

An ideal peer should offer the same product (service) as the company being in the focus, address
the same customer group, use the same distribution channels, operate in the same geography
and share the same capital structure. Nevertheless, this task is usually impossible, as the
companies tend to differ significantly among each other, mainly in the characteristics of the
product offered, size and capital structure and the markets they operate in. However, while
using the multiples, an analyst should make effort to identify companies as similar to its target
as possible (Damodaran, 2002).

We can divide relative valuation methods into two groups: precedent transactions and market
multiples. In the first case, we can identify multiples paid for similar companies in the past
transactions. However, the challenge here is to identify transactions that happened in the
relatively recent period, thus reflecting current market conditions. What is more, the price paid
will usually contain control premium, biasing the valuation upwards. This is particularly
apparent for strategic investors, who are willing to pay for the takeover target above current
market price, hoping to realize synergies. Conversely, market multiples are forward-looking,
and they are believed to reflect the current market value of the company. They focus on the
expectations regarding key value drivers, such as earnings or sales.

A certain advantage of relative valuation is the ease of use of multiples and their reflection of
actual price paid (precedent transactions) or current market value (market multiples). However,
as mentioned before, it might be difficult to find a reasonable peer group, especially for
companies operating in a niche or industry composed of privately held companies (then the
market price simply does not exist). Also, the multiples are subject to market moods and
momentum and only give us the relative value of an asset as compared to the current market

 9
price of similar assets. Hence, the equity valuation obtained from the relative methods can be
in isolation from its intrinsic value and lead to wrong recommendations in times of the market
turmoil (e.g. Tech Bubble).

Multiples can be divided into two groups (Fernandez, 2001): those referring to the equity value
(price per share) and enterprise value (value of the entire company). The most common
multiples are:

 • Price-to-Earnings (P/E).

This multiple reflects how much investors are willing to pay for a company’s current or future
earnings. Since the ability to convert revenue into earnings is the key investment driver, this is
one of the most often used multiples. Companies superior to their peers will tend to trade at
higher P/E multiple, reflecting higher expected growth rate. However, usefulness of this
multiple can be compromised if the earnings are negative or close to zero. Moreover, earnings
are subject to managerial influence and accounting differences.

 • PEG ratio

This ratio is an extension of the P/E multiple, that controls for the expected growth rate of
earnings. Although it overcomes problem of negative earnings, it is just a simplification that
ignores risk, does not account for differences in duration of growth and assumes it (growth)
will be linearly aligned with the P/E ratio.

 • Price-to-Sales

This multiple reflects how much the market values every dollar of the company’s sales. Since
the revenue cannot be negative and is subject to defined recognition policy, it is less prone to
manipulation than earnings. Although it can serve as a reliable indicator of company’s growth
and can be applied to companies that are not profitable yet (e.g. start-ups), its relevance is
limited. Not only it ignores the ultimate aim of the business, which is to generate income, but
also it compares the stream available to the entire firm (revenue) with the price of equity.

 • Price-to-Book Value

While not as popular as P/E or P/Sales, the P/BV ratio finds its use especially for companies
that are not perceived as going concern or that are mostly composed of liquid assets (such as
banks or insurance companies). However, the usefulness of this multiple is compromised for

 10
companies with significant non-balance sheet items (e.g. human capital) or asset-light
companies, that are mainly service-oriented.

 • EV/EBITDA

This multiple is probably the most widely used one in the investment banking industry. It
overcomes the problem of different capital structures, as it aligns the metric available to all
capital providers with the value of the entire company. EBITDA is a rough approximation of
the operating cash flow and eliminates any distortions resulting from different depreciation
policies, interest charges and tax rates. When the D&A expense is not available or the target
company has high investment outlays, this multiple can be modified into EV/EBIT. Such
adjustment should also be applied when comparing companies operating in different industries
to control for different capital expenditure requirements.

 • Sector specific multiples

As shown above, we can create a multiple for nearly all value drivers of the company. Those
described in detail refer to the most commonly used ones. However, for almost each sector we
can identify specific multiples that reflect its unique financial or operating statistic in the
denominator.

Just to briefly illustrate their application I decided to mention a few of them: EV/EBITDAR for
retail sector (R stands for rent expense), EV/Reserves for natural resources companies,
Price/Net Asset Value for Financial Institutions and Real Estate (Rosenbaum & Pearl, 2009).

 2.4 Other valuation methods
 2.4.1 Economic Value Added (EVA)
EVA is a method using company’s profitability and derives its value based on the Residual
Income. Defined as the return over the product of cost of capital and capital invested it reflects
the value generated by the company (Pinto et al., 2010).

 Formula 9: EVA

 = − ( ∗ )

 2.4.2 Net Asset Value (NAV)
For industries, that use mark-to-market value of their assets and liabilities (e.g. financial
industry), FCF models are irrelevant. One of the appropriate valuation models for them is NAV
that simply finds the difference between the market value of company’s assets and liabilities.

 11
2.4.3 Contingent claims (real options)
Some companies have a right to make a particular business decision in the future instead of
making the immediate capital budgeting decision. This can be described as a real option,
resulting from timing, sizing or flexibility (Copeland & Keenan, 1998). As such, it can be
valued by the use of options pricing techniques, such as Black-Scholes model or binomial tree
(Hull, 2012).

 12
3. Company overview
In order to select an appropriate valuation method as well as to develop rational forecasts, an
analyst is required to obtain a deep understanding of operational and financial performance of
the company in focus. The aim of this chapter is to present the key characteristics of CCC S.A.
In addition to the information presented below, supplementary material (e.g. SWOT analysis
and specific financial metrics) are exhibited in appendix 1.

 3.1 General information
CCC S.A. (thereinafter referred to as “the company”, “the Group” or “CCC”) is a Polish retailer
of shoes and accessories. The company was incorporated in 1996 in Polkowice (south-western
part of Poland) and went public in 2004 on the Warsaw Stock Exchange. As of 2018, CCC is
the biggest footwear retailer in Poland and a major player in the European market (CCC Annual
report, 2018).

 3.2 Business model and product mix
The basic merchandise of the company is footwear. The assortment in their product portfolio is
aimed at addressing the customer needs of any gender, age and income. As such, CCC sells
shoes for women, men and kids, ranging from casual and sport to elegant leather footwear. The
company sells products both under its own and licensed brands. Besides the shoes, CCC also
offers the opportunity to purchase handbags, shoe care products and other accessories.
However, they contribute minimally to the total sales of the company.

 Figure 1: CCC S.A. sales structure by product (Annual report for FY2018)

 1.4% 4.3%
 5.9%

 11.7%

 55.0%

 21.7%

 Women´s shoes Men´s shoes Kids´shoes Bags Shoe and care products Other

A majority of sales are generated in their stationary shops, most of which operate as CCC’s
own stores. The remaining portion consists of franchised stores that represent the wholesale
channel of the company. However, this segment is of minor importance as it generates almost

 13
You can also read