WATER 2020 MARKET INTELLIGENCE REPORT - GREENCAPE

Page created by Franklin Figueroa
 
CONTINUE READING
WATER 2020 MARKET INTELLIGENCE REPORT - GREENCAPE
Water

  2020
  Market Intelligence Report

Water: Market Intelligence Report 2020   i
WATER 2020 MARKET INTELLIGENCE REPORT - GREENCAPE
GreenCape
                                              GreenCape is a non-profit organisation that works at the interface of business,
                                              government, and academia to identify and remove barriers to economically
                                              viable green economy infrastructure solutions. Working in developing countries,
                                              GreenCape catalyses the replication and large-scale uptake of these solutions
                                              to enable each country and its citizens to prosper.

                                              Acknowledgements
                                              We thank Ashton Mpofu, Raldo Kruger and Jane Reddick for the time and effort
                                              that they have put into compiling this market intelligence report. We also thank
                                              Chantal Ramcharan-Kotze from the Water Research Commission (WRC) for her
                                              feedback on draft versions of the report.

                                              Disclaimer
                                              While every attempt has been made to ensure that the information published in
                                              this report is accurate, no responsibility is accepted for any loss or damage to
                                              any person or entity relying on any of the information contained in this report.

                                              Copyright © GreenCape 2020

                                              This document may be downloaded at no charge from www.greencape.co.za.
                                              All rights reserved.

                                              Subscribe to receive e-mail alerts or GreenCape news, events and publications
                                              by registering as a member on our website: www.greencape.co.za.

                                              Cover image courtesy of: Bruce Sutherland (City of Cape Town)

                                              18 Roeland Street, Cape Town, 8001, South Africa

                                              Authors:                Ashton Busani Mpofu, Raldo Kruger, and Jane Reddick
                                              Editorial and review:   Cilnette Pienaar, Lauren Basson, Claire Pengelly
                                                                      and Nicholas Fordyce
                                              Images:                 GreenCape, Markus Spiske, Unsplash and Bruce
                                                                      Sutherland (City of Cape Town)
                                              Layout and design:      Tamlin Lockhart Art Direction

ii   Water: Market Intelligence Report 2020   Water: Market Intelligence Report 2020                                             iii
WATER 2020 MARKET INTELLIGENCE REPORT - GREENCAPE
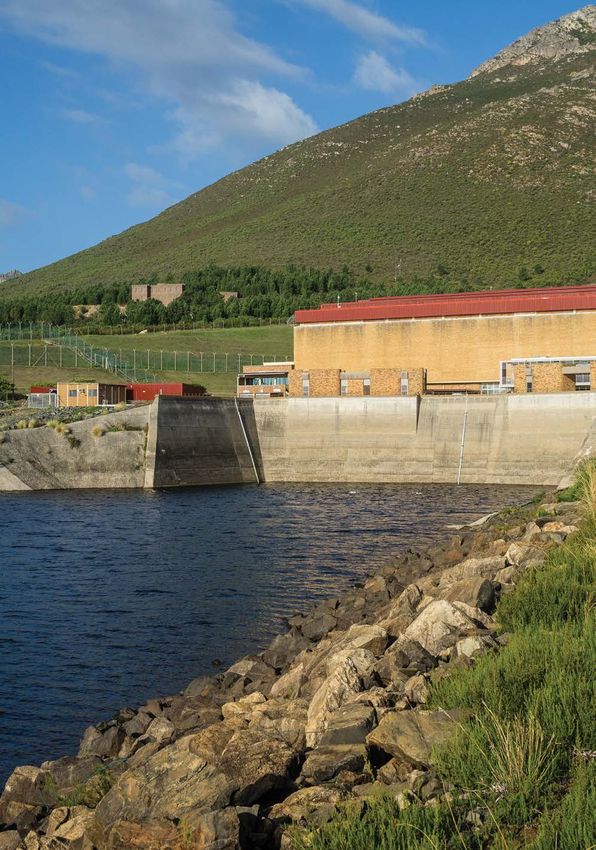
Contents                                                                                                  List of figures

Executive summary                                                                                          1    Figure 1:
What’s new?		                                                                                              3    Water sources in South Africa                                                                    7
1. Introduction and purpose                                                                                5    Figure 2:
2. Sector overview                                                                                         7    Water use in South Africa                                                                        7
   2.1. South African context                                                                              7    Figure 3:
   2.2. Western Cape context                                                                             10     The gap between water supply and projected water demand under two scenarios by
		       2.2.1. Western Cape water supply system                                                          11    2035 in South Africa                                                                             8
		       2.2.2. Long-term planning                                                                       13     Figure 4:
		       2.2.3. State of municipalities in South Africa                                                  16     Predicted water supply vulnerability in 2050, under medium population growth and
3. Policies and regulations                                                                              19     climate change exposure scenarios                                                               9
   3.1. National legislation                                                                             19     Figure 5:
		       3.1.1. The National Water Act                                                                   19     Water Management Areas in South Africa (Western Cape outlined in black)                         10
		       3.1.2. Categories of legal water use                                                            19     Figure 6:
		       3.1.3. The National Building Regulations and Building Standards Act                             20     Overview of WCWSS allocations by type                                                           11
		       3.1.4. National Environmental Management: Waste Act (59 of 2008)                                20     Figure 7:
		       3.1.5. Other key national legislation and standards                                             20     Historical water stored and projected future storage in the six
   3.2. Municipal by-laws and tariffs                                                                     21    largest dams in the WCWSS, assuming pre-2015 demand and 2016/17 rainfall                        12
		       3.2.1. Water restrictions                                                                       22     Figure 8:
		       3.2.2. Water tariffs                                                                            23     WCWSS annual runoff from 1928 to 2018 hydrological years                                        13
		       3.2.3. Alternative water use                                                                    26     Figure 9:
   3.3. Municipal procurement                                                                            26     WCWSS planning scenario reconciliation of supply and demand                                     15
		       3.3.1. City of Cape Town procurement                                                            27     Figure 10:
4. Opportunities and barriers                                                                            29     Planned increases in yield extracted from all published large-scale
   4.1. Industrial market: Water efficiency and reuse in the SA agri-processing sector                   31     reconciliation strategies                                                                       15
		       4.1.1. Market overview                                                                          31     Figure 11:
		 4.1.2. Opportunities                                                                                  32     Geographical distribution (A) and number of municipalities (B) in South Africa according
		 4.1.3. Drivers                                                                                        34     to the Municipal Grading Index, indicating Good, Intermediate and Poor scores based
		       4.1.4. Barriers and risks                                                                       35     on capacity criteria                                                                            17
   4.2. Municipal market                                                                                 37     Figure 12:
		       4.2.1. Market overview                                                                          37     Determination of water restriction levels based on dam levels at end of hydrological year for
		 4.2.2. Opportunities                                                                                  39     the City of Cape Town                                                                           22
			              4.2.2.1. Wastewater Reuse                                                               39     Figure 13:
			              4.2.2.2. Biogas production at WWTWs                                                     42     Comparison of water tariffs for commercial and industrial businesses
			              4.2.2.3. Energy efficiency opportunities in municipal water services                    45     across various metros                                                                           25
		 4.2.3. Drivers                                                                                        46     Figure 14:
		       4.2.4. Barriers and risks                                                                       47     Commercial and industrial water tariffs when minimum restrictions (no restrictions)
5. Funding and incentives                                                                                49     are in place, for selected metros 2012-2020                                                     25
   5.1. General database web page                                                                        49     Figure 15:
		       5.1.1. Green Finance Database                                                                   49     Gross Fixed Capital Formation of selected sectors in SA                                         31
		       5.1.2. Government funding and incentives database                                               49     Figure 16:
		       5.1.3. Finfind database                                                                         49     Estimated water use in the agri-processing sector in South Africa: (A) comparing total
		       5.1.4. AlliedCrowds database                                                                    49     water use in pulp and paper sub-sector with food and beverages, and (B) total water use for
6. The Western Cape: Africa’s growing greentech hub                                                       51    subsectors within food and beverage sector                                                      32
7. GreenCape’s support to businesses and investors                                                       55     Figure 17:
8. References                                                                                            59     Estimated realisable water savings over the next four to six years, by intervention type
                                                                                                                and sub-sector                                                                                  33

iv                                                                     Water: Market Intelligence Report 2020   Water: Market Intelligence Report 2020                                                           v
WATER 2020 MARKET INTELLIGENCE REPORT - GREENCAPE
List of tables

Figure 18:                                                                                                    Table 1:
Estimated realisable water savings for key agri-processing sub-sectors over the next                          Required, budgeted and projected public sector funding for water & sanitation services
four to six years and required investment                                                              34     & infrastructure                                                                                   10
Figure 19:                                                                                                    Table 2:
Expenditure trends for the Water Trading Entity from 2015/16 to 2018/19 (actual) and                          Water tariffs for selected metros (minimum restriction levels in place) for FY 2019/20             24
from 2019/20 to 2021/22 (estimated medium-term)                                                        38     Table 3:
Figure 20:                                                                                                    Sanitation tariffs for selected metros (minimum restriction levels in place) for FY 2019/20        24
Capital expenditure on water and sanitation projects undertaken by metropolitan                               Table 4:
municipalities between 2014/15 and 2017/18                                                             38     Summary of market opportunities                                                                    30
Figure 21:                                                                                                    Table 5:
Theoretical investment potential for water reuse projects (at 2019 costs)                                     Summary of current municipal scale projects (reuse, biogas/CHP) at various stages of development   41
summed by province                                                                                     39
Figure 22:
Planned water reuse augmentation projects and estimated capital investment
potential in Western Cape (WC) district municipalities                                                 40
Figure 23:
Total investment cost of financially viable CHP projects at wastewater treatment
plants aggregated by province                                                                           42
Figure 24:
Indicative potential energy and cost savings from energy efficiency retrofits
(efficient pumps and VSDs) in wastewater treatment plants in South African metros                      45
Figure 25:
GreenCape’s focus areas                                                                                56

vi                                                                   Water: Market Intelligence Report 2020   Water: Market Intelligence Report 2020                                                             vii
WATER 2020 MARKET INTELLIGENCE REPORT - GREENCAPE
List of abbreviations                                                                                                      Conversions
             and acronyms                                                                              1 Megalitre = 1 million litres = 1 000 000 litres = 1 000 kl = 1 000 m3

AADD		    Annual Average Daily Demand
AD			     Anaerobic digestion
B-BBEE    Broad-based Black Economic Empowerment
BOT		     Build-Operate-Transfer
C&I		     Commercial and Industrial
CCCI		    Cape Chamber of Commerce and Industry
CCT		     City of Cape Town
CHP		     Combined Heat and Power
CSAG		    Climate System Analysis Group
DEADP		   Department of Environmental Affairs and Development Planning
DFI		     Direct Foreign Investment
DHSWS     Department of Human Settlements, Water and Sanitation
DLG		     Department of Local Government (Western Cape Government)
dti			    Department of Trade and Industry
dtic		    Department of Trade, Industry and Competition
DWA		     Department of Water Affairs (now DHSWS)
DWAF		    Department of Water Affairs and Forestry (now DHSWS)
DWS		     Department of Water and Sanitation (now DHSWS)
EME		     Exempted Micro Enterprise
GA			     General Authorisation
GDP		     Gross Domestic Product
GFCF		    Gross Fixed Capital Formation
GTAC		    Government Technical Advisory Centre
GVA		     Gross Value Add
ILI			    Infrastructure Leakage Index
MFMA		    Municipal Finance Management Act No. 56 of 2003
MIR		     Market Intelligence Report
MLD		     Megalitres (million litres) per day
NBI 		    National Business Initiative
NBR		     National Building Regulations
NRW		     Non-Revenue Water
NWA		     National Water Act
PPP		     Public Private Partnership
QSE		     Qualifying Small Business Enterprise
RFQ		     Request for Quotation
SABIA		   Southern African Biogas Industry Association
SANS		    South African National Standard
SIV		     System input volume
VAT		     Value Added Tax
WCWDM     Water Conservation and Water Demand Management
WCWSS     Western Cape Water Supply System
WC		      Western Cape
WCG		     Western Cape Government
WEF		     World Economic Forum
WMA		     Water Management Area
WRC		     Water Research Commission
WSI		     Water Services Intermediary
WUL		     Water Use Licence
WWF		     World Wide Fund for Nature
WWTW		    Wastewater Treatment Works

viii                                                          Water: Market Intelligence Report 2020   Water: Market Intelligence Report 2020                                    ix
WATER 2020 MARKET INTELLIGENCE REPORT - GREENCAPE
Executive summary
                                                       This market intelligence report (MIR) is aimed at investors interested
                                                                     in the South African urban water sector.

                                             Water scarcity has been a key driver for              ■   cost-reflective water tariffs: enhancing the
                                             investment in the Western Cape water sector due           investment case for municipal water projects
                                             to severe drought conditions and expected                 (as costs can be recovered through water
                                             longer-term water constraints in the region.              sales), and for private companies (as the
                                             Based on population and economic growth                   business case for water projects is improved);
                                             projections, South Africa could have a 17% gap
                                             between supply and demand by 2030. However, a         ■   regulatory compliance: water restrictions in
                                             more recent analysis indicates that if water use is       drought areas, and wastewater discharge limits;
                                             reduced by just 7.5%, and planned additional
                                             water supply projects are implemented, this gap       ■   policies and government support/incentives:
                                             can be narrowed significantly by 2035. This year’s        the National Water and Sanitation Masterplan
                                             report draws on market trends and emerging                Volume 1 (2019) encourages cost-reflective
                                             longer-term investment opportunities to improve           tariffs, alternative water source development,
                                             water security and resilience, as key enablers of         and private sector financing for municipal
                                             economic development. Specifically, the report            infrastructure, while the agri-processing
                                             focuses on insights and opportunities relating to         sector is targeted for growth via incentives
                                             two key urban water markets in South Africa:              (including incentives for resource efficiency).

                                             ■   industrial market (opportunities in               While the municipal sector represents the largest
                                                 agri-processing sector); and                      opportunity for investors, there are a few barriers
                                             ■   municipal market (opportunities in water          specific to this market. They are related to the
                                                 works and wastewater treatment works).            ability to access funding, capacity constraints,
                                                                                                   procurement processes, and revenue
                                             Key drivers in these markets are:                     collection. Barriers specific to the uptake of water
                                                                                                   technologies in the agri-processing sector include
                                             ■   water security: both private companies            poor business cases in municipalities where water
                                                 and municipalities are motivated to invest        tariffs are low, regulatory challenges related to
                                                 in water projects to secure sufficient water      management of brine, and complex and lengthy
                                                 supply for their operations;                      licensing and authorisation for water projects.

                    © Bruce Sutherland
                    (City of Cape Town)

x   Water: Market Intelligence Report 2020   Water: Market Intelligence Report 2020                                                                       1
WATER 2020 MARKET INTELLIGENCE REPORT - GREENCAPE
Summary of market opportunities

    Opportunity                      Drivers                              Barriers                          Key market segments

                                                  Industrial market: agri-processing sector

                                     ■   Water security                   ■   Currently poor business
                                     ■   Increasing water &                   case in some municipalities
                                         sanitation tariffs               ■   Public perception &           ■   Total realisable investment
    Water efficiency                 ■   Policies, regulations &              health risks                      of ~R6 bn in water
    &                                    strategies                       ■   Access to information on          technologies in key
    wastewater reuse                 ■   Corporate social                     best practice & locally           agri-processing
    (Section 4.1)                        responsibility                       validated technologies            sub-sectors over the next
                                     ■   Water resource pollution         ■   Access to capital                 four to six years in SA

                                                                                                                                                                           What’s new?
                                     ■   Local availability of water      ■   Licensing & permitting
                                         efficient technology             ■   Operational complexity

                                               Municipal market: wastewater treatment works

                                     ■   Increasing water demand          ■   Policies & regulations        ■   Projects currently in
                                         & decreasing surface             ■   Public perception &               development in SA amount
                                         water supply                         health risks                      to ~ R5.8 bn
    Wastewater reuse                 ■   National & provincial water      ■   Financing (not all            ■   R2.6 bn projects planned in
    (Section 4.2)                        strategies                           off-takers are bankable)          WC in next 10 years
                                     ■   Availability of technology       ■   Poor quality of source        ■   Total of R50 bn worth of
                                     ■   Cost competitiveness                 water (also potential             projects at WWTWs larger
                                                                                                                                              Readers of last year’s MIR are encouraged to
                                                                                                                                              read this year’s report in full, as the market
                                                                              driver)                           than 1 MLD in SA                                                                       The report focuses on
                                                                                                                                              intelligence has been updated substantially.
                                     ■   Energy intensive                 ■   Lack of technical capacity    ■   Three large-scale biogas /                                                             opportunities for water efficiency,
                                         wastewater treatment             ■   Financing (not all                CHP projects currently in
                                                                                                                                              The 2019 report focused on the various                   water reuse and resource recovery
                                         services/processes                   off-takers bankable)              planning in Cape Town
                                     ■   High electricity bills           ■   Poor business case for            (over the next 10 years)      investment opportunities for water-saving                in these key urban water markets
    Biogas                           ■   Energy intensive                     some projects                 ■   Total of R1.1 bn in viable    technologies in different markets, and emerging          by applying sustainable
    &                                    wastewater treatment                 Operational complexity            CHP projects at WWTWs         long-term investment opportunities linked to             development and circular economy
                                                                          ■

    energy efficiency                    processes/operations & the                                             in SA1
                                                                                                                                              water scarcity in South Africa. This year’s report
    (Section 4.2)                        related high electricity bills                                     ■   Total of R1.1 bn in energy                                                             principles to the water sector.
                                                                                                                efficiency and optimisation
                                                                                                                                              emphasises the need for long-term water
                                                                                                                retrofits at waterworks in    security and its associated investment
                                                                                                                the eight metropolitan        opportunities by providing a more detailed
                                                                                                                municipalities                analysis of two key urban markets: industrial
                                                                                                                                              companies and municipalities. The report             key urban water markets by applying sustainable
                                                                                                                                              focuses on opportunities for water efficiency,       development and circular economy principles
                                                                                                                                              water reuse and resource recovery in these           to the water sector.

1
    Only includes costing of CHPs at WWWTs with existing ADs that require minor refurbishment.

2                                                                                               Water: Market Intelligence Report 2020        Water: Market Intelligence Report 2020                                                             3
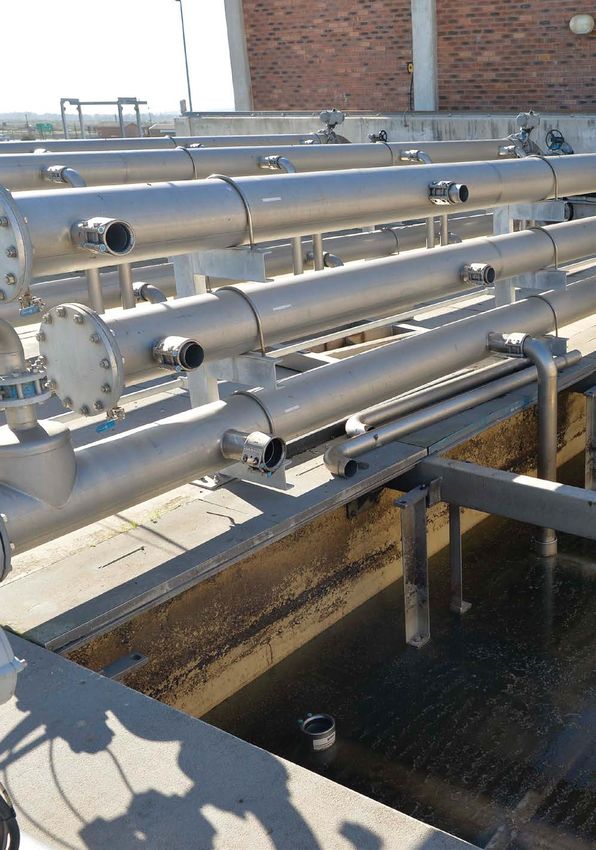
WATER 2020 MARKET INTELLIGENCE REPORT - GREENCAPE
1
                                             Introduction and purpose
                                                 This market intelligence report (MIR) has been compiled by GreenCape’s Water
                                                 Sector Desk. It is aimed at investors interested in the South African urban water
                                                    sector, with particular emphasis on opportunities in metropolitan areas.

                                             The key drivers of growth and long-term              (Section 5), gives an overview of the Western
                                             investment in the water sector in the Western Cape   Cape as Africa’s growing greentech hub
                                             and more broadly in South Africa are two-fold:       (Section 6), and explain GreenCape’s work
                                             increasing resilience to extreme climate events,     within the green economy (Section 7).
                                             and ensuring that water is not a constraint to
                                             economic growth and development. This year’s         While this report focuses on urban water markets,
                                             report focuses on investment opportunities within    there are inherent links between agricultural
                                             key markets: the agri-processing sector in the       and urban water use. Similarly, there are links
                                             industrial market and bulk water and wastewater      between organic waste valorisation and energy
                                             infrastructure in municipalities.                    production related to treating wastewater,
                                                                                                  as well as energy efficiency opportunities
                                             The report provides a sector overview (Section 2),   throughout the water value chain. We have
                                             which outlines water scarcity in both the South      included these opportunities where they fall within
                                             African and Western Cape context. This is followed   the water value chain, however please consult the
                                             by an overview of policies and regulations           2020 Sustainable Agriculture Market Intelligence
                                             (Section 3) that are relevant to water technology    Report, Waste Market Intelligence Report and two
                                             investment opportunities and barriers (Section 4).   Energy Market Intelligence Reports2 for
                                             The final sections focus on finance and incentives   opportunities specific to those sectors.

                                                                                                                               © Bruce Sutherland
                                                                                                                               (City of Cape Town)

                                             2
                          © GreenCape            www.greencape.co.za/market-intelligence/

4   Water: Market Intelligence Report 2020   Water: Market Intelligence Report 2020                                                                  5
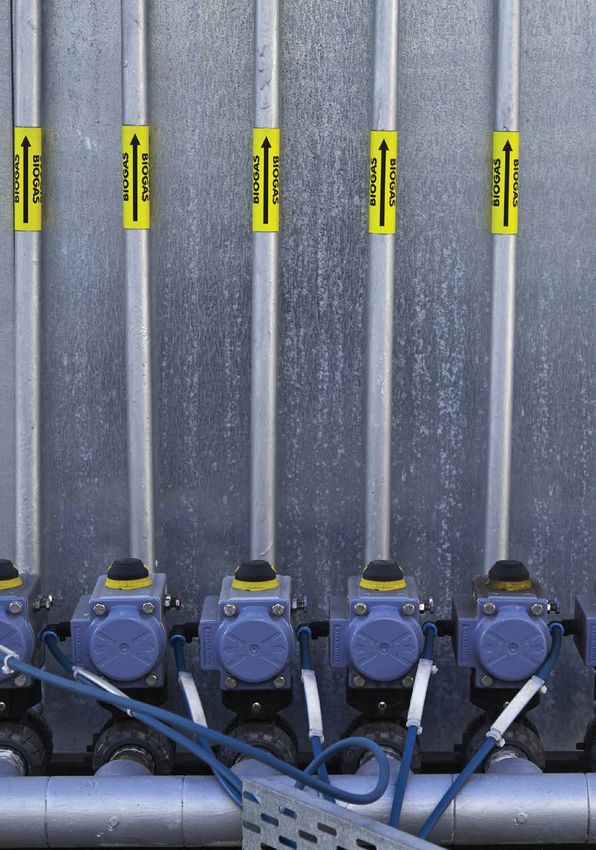
WATER 2020 MARKET INTELLIGENCE REPORT - GREENCAPE
2
                                                                      Sector overview
                                                     Water scarcity is a major challenge in South Africa. Water conservation
                                                    and demand management measures represent a substantial opportunity
                                                                for investors and businesses in the water sector.

                                             2.1. South African context                                           (at 98% assurance of supply – or 2% annual
                                             South Africa (SA) is ranked as the 30th driest                       probability of supply failure), of which the majority
                                             country in the world. In 2019, behind unemployment                   is from surface water (68%) and return flows that
                                             which is currently at a rate of 29% (WEF 2019), the                  support surface water (13%), as shown in Figure 1
                                             country’s water crisis was ranked as the second                      (DWS 2017a). Agriculture is the largest water-use
                                             highest risk for doing business in SA. SA is a                       sector (62%), followed by municipalities (27%),
                                             water-scarce country characterised by uneven                         which include residential, commercial and
                                             rainfall distribution, and extreme climate and                       industrial water users (DWS 2017a). The relative
                                             evaporation rates that often exceed precipitation.                   proportion of municipal and agricultural use differs
                                             The country has a reliable yield (i.e. supply from                   between provinces and municipalities, depending
                                             current infrastructure) of around 15 billion kl/year                 on settlement patterns and local economy.

                                             68+13+6 62+27+32
                                                                                  68%       SURFACE WATER                                                62%      AGRICULTURE
                                                                                   13%      RETURN FLOWS                                                 27%      MUNICIPAL
                                                                                   13%      GROUNDWATER                                                           (3% rural,
                                                                                    6%      OTHERS                                                                24% urban)
                                                                                            (seawater/                                                    3%      MINING
                                                                                            brackish water                                                3%      INDUSTRY
                                                                                            desalination)                                                 3%      AFFORESTATION
                                                                                                                                                          2%      ENERGY

                                             Figure 1: Water sources in South Africa                              Figure 2: Water use in South Africa

                                             Despite being a water-scarce country,                                expected to be the greatest, which is partly
                                             consumption is around 237 litres/capita/day                          driven by urbanisation but also by increased
                                             (l/c/d), much higher than the international                          industrial production and growth. The Industrial
                                             benchmark of 173 l/c/d (NWRS2)3. Forecasts                           Policy Action Plan (IPAP) sets out the intentions of
                                             indicate that water demand will exceed supply by                     expanding the manufacturing sector, with
                                             17% by 2030 (McKinsey and Company 2010), and                         agri-processing earmarked for national growth
                                             that this will be driven by increased water                          and development (DWS 2017a; NWSMP 2019). Thus
                                             demand in the municipal, industrial and                              agri-processing is expected to be a significant
                                             agricultural sectors (Donnenfeld et al. 2018). The                   contributor to economic growth and
                                             growth in demand by the municipal sector is                          opportunities for water technologies.

                                             3
                                               These figures are based on the system input volume divided by the population served. The system input volume includes commercial and
                          © GreenCape        industrial demand, and water losses through infrastructure leaks.

6   Water: Market Intelligence Report 2020   Water: Market Intelligence Report 2020                                                                                              7
WATER 2020 MARKET INTELLIGENCE REPORT - GREENCAPE
A more recent model of future water balance for
South Africa indicates that if planned additional                                                                           Groundwater, wastewater reuse
water supply is taken into account, and if realistic
                                                                                                                            and desalination should
water efficiency is achieved (constrained
scenario4), the gap between supply and demand                                                                               increasingly contribute to the
can be narrowed significantly by 2035 (Figure 3;                                                                            national water supply mix.
Donnenfeld et al. 2018). These new supply sources
are mainly groundwater, desalinated seawater in
coastal areas and wastewater reuse (see Figure 10
for distribution of new supply between regions).                                                                     Towards the end of 2019, the Eastern Cape and
                                                                                                                     Northern Cape were declared disaster areas
While total demand is projected to increase                                                                          by the national government due to the ongoing
despite higher efficiency, and planned                                                                               droughts in these provinces. These events
augmentation schemes can narrow the supply                                                                           highlight the need to reduce reliance on rainfall.
gap, it is important to note that the augmentation                                                                   The National Water and Sanitation Masterplan:
sources are diversified. Climate change models                                                                       Vol 2 (2018) specifies that groundwater,
predict that SA will receive less rainfall, but also                                                                 wastewater reuse and desalination should
that the incidence of extreme climate events                                                                         increasingly contribute to the national water
will increase. The ongoing drought in the                                                                            supply mix.
Western Cape has been well documented (see
2019 Water MIR), and this was preceded in 2015                                                                       The supply risks based on changing rainfall
by the lowest total rainfall in recorded history                                                                     patterns and population growth will vary
(since 1904) for the whole country.                                                                                  by region.                                                            Figure 4: Predicted water supply vulnerability in 2050, under medium population growth and
                                                                                                                                                                                           climate change exposure scenarios (Green Book 2019)5

                                                 19.5                                                                                                                                      By 2050, many parts of South Africa (including                            It is estimated that ~R90 billion per year of
                                                                                                                                                                                           major industrial zones) are expected to be                                investment is needed in water and sanitation
    Water supply and demand (1 000 million m3)

                                                 19.0                                                                                                                                      vulnerable to water supply risks (Figure 4).                              infrastructure over the next 10 years (DWS 2017a;
                                                                                                                                                                                                                                                                     NWSMP 2019) in order to ensure reliable water
                                                 18.5                                                                                                                                      An estimated 40% of South Africa’s wastewater is                          supply and wastewater treatment. This includes
                                                                                                                                                                                           untreated (Donnenfeld et al. 2018). Furthermore, of                       refurbishing and upgrading existing
                                                 18.0                                                                                                                                      the 824 wastewater treatment works (WWTWs) in                             infrastructure, and new infrastructure to support
                                                                                                                                                                                           South Africa, ~30% are in a ‘critical’ state, and a                       population and economic growth. Budgeted
                                                 17.5
                                                                                                                                                                                           further ~20% were in a ‘poor’ state (Toxopeüs 5                           funding of R50.1 billion in 2018/19 falls well short of
                                                                                                                                                                                           2019), according to the 2013 GreenDrop reports.6                          what is required, but estimated medium-term
                                                                                                                                                                                           The resulting raw water pollution presents a                              budgets indicate that the national government
                                                 17.0
                                                                                                                                                                                           significant environmental challenge, as well                              has plans in place to reduce the shortfall (Table 1).
                                                                                                                                                                                           as a health and socio-economic risk to poor                               Public funding gaps provide an opportunity for
                                                 16.5
                                                                                                                                                                                           communities that access water directly from rivers.                       private sector financing of water and sanitation
                                                                                                                                                                                                                                                                     projects, as outlined in Section 4.
                                                 16.0

                                                 15.5
                                                                                                                                                   30
                                                      17

                                                                            20

                                                                                   20

                                                                                                 23

                                                                                                        24

                                                                                                               25

                                                                                                                      26

                                                                                                                                    28

                                                                                                                                           29

                                                                                                                                                                 32

                                                                                                                                                                        33

                                                                                                                                                                               34

                                                                                                                                                                                      35
                                                             18

                                                                    19

                                                                                          22

                                                                                                                             27

                                                                                                                                                          31
                                                    20

                                                           20

                                                                                                                                                        20
                                                                  20

                                                                                                                           20
                                                                                                             20
                                                                                        20

                                                                                                                                  20
                                                                                               20

                                                                                                                                                               20
                                                                                                      20

                                                                                                                    20

                                                                                                                                         20

                                                                                                                                                                                    20
                                                                          20

                                                                                 20

                                                                                                                                                                      20
                                                                                                                                                 20

                                                                                                                                                                             20

                                                           Total supply                   Constrained Scenario               Unconstrained Scenario

Figure 3: The gap between water supply and projected water demand under two scenarios by
2035 in South Africa (Donnenfeld et al. 2018)

                                                                                                                                                                                           5
                                                                                                                                                                                            Cullis, J. & Phillips, M. 2019. Green Book. Surface Water Supply. Water supply climate risk narrative for South Africa. Pretoria: Aurecon &
4
  The constrained scenario assumes that per capita water consumption decreases by 7.5% from 2015 to 2035. During the drought, the City                                                     CSIR. Available at: https://pta-gis-2-web1.csir.co.za/portal/apps/GBCascade/index.html?appid=74fc5a7337f34460b7a09242d0770229.
of Cape Town achieved a far greater (~50%) per capita reduction in water consumption over a period of 4 years, which suggests that the                                                     6
                                                                                                                                                                                             The last time GreenDrop reports were made public. Anecdotal evidence indicates that the condition of WWTWs may since have
constrained scenario is highly achievable.
                                                                                                                                                                                           deteriorated further.

8                                                                                                                                               Water: Market Intelligence Report 2020     Water: Market Intelligence Report 2020                                                                                                         9
Table 1: Required, budgeted and projected public sector funding for water & sanitation                                                                         2.2.1 Western Cape Water                                               The total water allocation for the system is 590
services & infrastructure
                                                                                                                                                               Supply System                                                          million m3 per year, which is allocated to various
                                                                                                                                                               The Western Cape water supply system (WCWSS),                          end users (Figure 6). Approximately two-thirds of
    Funding (R bn)                      Required7         Budgeted          Budgeted            Medium-          Medium-              Medium-
                                                                                                                                                               which supplies water to several municipalities                         the allocation is for urban use (including
                                                          2017/188          2018/199            term             term                 term
                                                                                                                                                               within the Berg-Olifants WMA, is one of the most                       residential, commercial, and industrial use), and
                                                                                                estimates        estimates            estimates
                                                                                                                                                               important supply systems in the country. It                            the remainder is allocated for agriculture, which is
                                                                                                2019/20          2020/21              2021/22
                                                                                                                                                               supplies water to a region that produces 84% of                        predominantly used in the summer months (DWS
    Municipal infrastructure            –                 –                 15.3                14.8             15.6                 16.8                     the province’s gross domestic product (GDP) and                        2015). Even without making provision for the
    grant                                                                                                                                                      approximately 14% of national GDP (Quantec                             ecological reserve, the total allocations exceed the
                                                                                                                                                               2017). The WCWSS is a complex, interlinked                             revised system yield of 545 million m3 per year
    Regional & local water &            –                 –                 10.7                10.6             11.2                 12.1
                                                                                                                                                               system of dams, pipelines, and distribution                            (DWS 2018). There are no further opportunities to
    sanitation services
                                                                                                                                                               networks that supplies water to the City of Cape                       build additional large dams to augment the supply
    Water resource & bulk               –                 –                 24.1                27.1             29.7                 33.6                     Town (CCT), West Coast District Municipality                           (DWS 2015). Consequently, even prior to the
    infrastructure                                                                                                                                             (which supplies water to Swartland, Saldanha                           drought, the system was already constrained. The
                                                                                                                                                               Bay, and Bergrivier local municipalities),                             estimated average combined urban and
    Total water & sanitation                                                                                                                                   Stellenbosch, Drakenstein, and Witzenberg local                        agricultural water demand for 2009/10 to 2015/6
                                        89.9              56.6              50.1                52.5             56.6                 62.5
    services & infrastructure                                                                                                                                  municipality, and certain agricultural users (see                      was 556 million m3 (DWS 2018). However, in 2016/1710
                                                                                                                                                               2019 Water MIR for map with details).                                  the demand was 16% lower at 469 million m3 due
    Funding shortfall                   –                 33.3              38.9                36.4             32.4                 26.5
                                                                                                                                                                                                                                      to the drought and associated water restrictions.
789

2.2. Western Cape context
The Western Cape Province in the south-west corner of South Africa falls predominantly within two
water management areas (WMAs), the Breede-Gouritz and the Berg-Olifants (Figure 5). Irrigation to
support agriculture constitutes the main water use in these two WMAs, followed by urban water use.

                                                                                                                                                                                                                                     59.4%   URBAN: CITY OF CAPE TOWN

             Western Cape Province                                                                                                                                                                                                   32.0%   AGRICULTURAL (CAPPED)

                                                                                                            Limpopo                                                                                                                   5.3%   URBAN: WEST COAST DISTRICT
                                                                                                                           Olifants                                                                                                   1.8%   URBAN: STELLENBOSCH
                                                                                                                                                                                                                                      0.7%   URBAN: OVERBERG WATER
                                                                                                                                      Inkomathi
                                                                                                                                        Usuthu                                                                                       0.4%    URBAN: DRAKENSTEIN

                                                                                                                 Johannesburg                              !                                                                          0.1%   URBAN: PIKETBERG
                                                                                                                                                                                                                                      0.1%   URBAN: OTHER
                                                                                     Vaal

                                                                                                                               Pongolo
                                                                                                                               Mzimkulu
                                                                                                                                                               Figure 6: Overview of WCWSS allocations by type (DWS 2018)
                                                                                                                                             eThekwini                !
                                                                 Orange
                                                                                                                                             (Durban)

                                                                                        Mzimvubu-
                                      Berg                                             Tsitsikamma
                                     Olifants

                                                     Breede                                                                                          N
                                                                                                                        0 30 60 120 180 240
                         Cape Town                   Gouritz                                !                                                 Kilometers

Figure 5: Water Management Areas in South Africa (Western Cape outlined in black)

7
    According to DWS 2017 planning document.
8
    Due to changes in line items from 2017/18 to subsequent years, only the total is given. See previous MIR for details of this year.
9                                                                                                                                                              10
    Budget Review 2019 (http://www.treasury.gov.za/documents/national%20budget/2019/review/FullBR.pdf)                                                              This is the most recent data for total water use in the WCWSS.

10                                                                                                     Water: Market Intelligence Report 2020                  Water: Market Intelligence Report 2020                                                                                   11
1400
  The drought, which is linked to below-average                                         to ~75% and ~84% (Figure 7), respectively. Water
  rainfall, particularly in 2016 and 2017, placed                                       restrictions for the CCT were raised to 650 MLD
  additional strain on the WCWSS. In March 2017                                         at the end of the 2018 hydrological year
                                                                                                                                                                                                    1200
  and April 2018 respectively (Figure 7), the WCWSS                                     (previously 500 MLD), and demand has remained                                                                                 Long-term
                                                                                                                                                                                                                       Average
  dams reached their lowest levels in recorded                                          well below this level for most of the year.
  history (~20% of capacity), and narrowly avoided                                      Restriction levels are usually adjusted at the end
                                                                                                                                                                                                    1000
  the need for extreme water rationing. By the end                                      of the hydrological year, but at the time of

                                                                                                                                                                 Annual Inflows (Million m3/year)
  of the 2018 and 2019 hydrological years (31                                           publishing, new restriction levels had not been
                                                                                                                                                                                                           1920/30s                 1970s                                                      Current
  October), the WCWSS dam levels had recovered                                          announced yet.                                                                                                     drought                                                                             drought
                                                                                                                                                                                                                                   drought
                                                                                                                                                                                                    800

                           1 000
                                   “maximum storage” (100%)
                                                                                                                                                                                                    600
Dam storage (million m3)

                            750
                                                                                                                                                                                                    400

                            500
                                                                                                                                                                                                    200

                            250                                                                                                                                                                       0

                                                                                                                                                                                                             1928
                                                                                                                                                                                                            1930
                                                                                                                                                                                                             1932
                                                                                                                                                                                                            1934
                                                                                                                                                                                                            1936
                                                                                                                                                                                                            1938
                                                                                                                                                                                                            1940
                                                                                                                                                                                                            1942
                                                                                                                                                                                                            1944
                                                                                                                                                                                                            1946
                                                                                                                                                                                                            1948
                                                                                                                                                                                                            1950
                                                                                                                                                                                                             1952
                                                                                                                                                                                                            1954
                                                                                                                                                                                                            1956
                                                                                                                                                                                                            1958
                                                                                                                                                                                                            1960
                                                                                                                                                                                                            1962
                                                                                                                                                                                                            1964
                                                                                                                                                                                                            1966
                                                                                                                                                                                                            1968
                                                                                                                                                                                                            1970
                                                                                                                                                                                                             1972
                                                                                                                                                                                                             1974
                                                                                                                                                                                                             1976
                                                                                                                                                                                                             1978
                                                                                                                                                                                                            1980
                                                                                                                                                                                                             1982
                                                                                                                                                                                                            1984
                                                                                                                                                                                                            1986
                                                                                                                                                                                                            1988
                                                                                                                                                                                                            1990
                                                                                                                                                                                                            1992
                                                                                                                                                                                                            1994
                                                                                                                                                                                                            1996
                                                                                                                                                                                                            1998
                                                                                                                                                                                                           2000
                                                                                                                                                                                                           2002
                                                                                                                                                                                                           2004
                                                                                                                                                                                                           2006
                                                                                                                                                                                                           2008
                                                                                                                                                                                                            2010
                                                                                                                                                                                                             2012
                                                                                                                                                                                                            2014
                                                                                                                                                                                                            2016
                                                                                                                                                                                                            2018
                                   “unavailable storage” (10% of total)                                                                                                                                                           Hydrological Year
                              0
                               2008                   2010                2012   2014           2016             2018                 2020                  Figure 8: WCWSS annual runoff from 1928 to 2018 hydrological years (updated end of October
                                                                                    Year                                                                    2019; City of Cape Town 2019)

  Most recent value on: 31 Oct 2019                                                                     Data: City of Cape Town, Figure: © Climate System
                                                                                                                  Analysis Group, University of Cape Town   2.2.2. Long-term planning                                                  To address future water constraints, reconciliation
                                                                                                                                                            The climate projections for the Western Cape                               studies are conducted to reconcile the gap
  Figure 7: Historical water stored (thin line) and projected future storage (thick line) in the six                                                        indicate a warming trend as well as projected                              between future demand and supply. The WCWSS
  largest dams in the WCWSS, assuming pre-2015 demand and 2016/17 rainfall (CSAG11)                                                                         drying in many areas, with longer periods                                  reconciliation strategy study was completed in
  11                                                                                                                                                        between increasingly intense rainfall events                               2007, and annual status updates are produced by
                                                                                                                                                            (DEADP 2014). It also remains to be seen whether                           the Department of Human Settlements, Water
  The ongoing effective demand-side management                                                                                                              the drought represents a ‘step-change’ in the                              and Sanitation (DHSWS, formerly the Department
  and resultant lower water use has been the key                                                                                                            rainfall patterns (such as was experienced by                              of Water Affairs and Forestry, DWAF and later the
  driver in the recovery of dam levels. While the
                                                                                            While the total rainfall has                                    Perth in the 1970s), or whether the decrease in                            Department of Water and Sanitation, DWS). The
  total rainfall has increased somewhat in the last                                         increased somewhat in the last two                              average annual rainfall will occur gradually.                              annual update for 2018 compares several future
  two years, it is still well below the historical                                          years, it is still well below the                               Additionally, population and economic growth will                          water balance assessment scenarios. Figure 9
  long-term average, and indications are that the                                           historical long-term average, and                               place an additional burden on water supply                                 presents the scenario considered to be the most
  drought is not over (Figure 8). This highlights the                                       indications are that the drought is                             systems. In turn it will have a negative impact on                         realistic base scenario without additional water
  importance and effectiveness of effective                                                                                                                 the province and consequently the country’s                                conservation and demand management
                                                                                            not over (Figure 8). This highlights
  demand-side management and water efficiency                                                                                                               economy, and particularly the contribution of the                          interventions. It assumes a projected 2% p.a.
  interventions, and the key role it plays in                                               the importance and effectiveness                                agri-processing sector12. Water security will                              growth rate in water demand (DWS 2018). Dashed
  managing water resources. Projections using pre-                                          of effective demand-side                                        continue to be a focus for the Western Cape. It                            lines show water demand projections under
  2015 demand and long-term average rainfall                                                management and water efficiency                                 presents a platform on which government,                                   different scenarios (scenario 1 being applicable to
  indicate that dam levels will recover to 100% in                                          interventions, and the key role it                              business, investors and citizens can collectively                          the graph). Solid fills show the planned water
  the next rainfall season, but the lower than                                                                                                              implement water efficiency and resource                                    supply interventions, along with their height (or
                                                                                            plays in managing water resources.
  average rainfall will necessitate ongoing                                                                                                                 recovery (water, energy and/or materials)                                  stacked thickness) indicating the estimated
  demand-side reduction to avoid dam levels                                                                                                                 initiatives, particularly in agri-processing, to                           yields for the different interventions. These
  approaching the 10% level (Figure 7).                                                                                                                     increase resilience.                                                       interventions include potable water reuse (from

                                                                                                                                                            12
                                                                                                                                                               The gross value add (GVA) of agriculture in the Western Cape is ~R19 billion (22% of South Africa’s agricultural GVA) and export revenues
  11
    Historical dam storage levels up to 31 October 2019. To model various future scenarios, visit the Climate System Analysis Group (CSAG)                  exceed R40 billion per year. Around 216 000 people are employed in primary agriculture and 250 000 in agri-processing in the province
  website: http://cip.csag.uct.ac.za/monitoring/bigsix.html                                                                                                 (Jacobs 2017).

  12                                                                                                    Water: Market Intelligence Report 2020              Water: Market Intelligence Report 2020                                                                                                    13
WWTWs), groundwater development (new              Similar reconciliation strategies for other
resources and artificial recharge), and large-    catchments in South Africa indicate the plans

                                                                                                          Water Requirements (million m3/year)
scale permanent seawater desalination. In         for additional supply sources to meet increasing
this regard, long-term plans have been in place   demand. A summary of the large-scale
for several years, and many of the planned        reconciliation strategies indicates that existing
projects were brought forward and re-assessed     water sources will decline, and that future
considering the drought and need of economic      additional water supply sources are spread
water resilience. Section 4.2.2 outlines in       throughout the country, and between different
more detail some of the planned projects for      catchments (Figure 10). The largest new water
the WCWSS.                                        sources are planned in the Orange River and Vaal
                                                  River catchments, followed by the Western Cape
                                                  and Richard’s Bay (Donnenfeld et al. 2018).

                                                                                                                Figure 9: WCWSS planning scenario reconciliation of supply and demand (DWS 2018)
                                                                                                                (A larger version of this figure is available on request)

                                                                                                                                                             18.5

                                                                                                                                                             18.0

                                                                                                                                                             17.5

                                                                                                                                   Yield (1000 million m3)
                                                                                                                                                             17.0

                                                                                                                                                             16.5

                                                                                                                                                             16.0

                                                                                                                                                             15.5

                                                                                                                                                             15.0

                                                                                                                                                             14.5

                                                                                                                                                                 24
                                                                                                                                                                 10

                                                                                                                                                                 12

                                                                                                                                                                 13

                                                                                                                                                                 14

                                                                                                                                                                 15

                                                                                                                                                                 16

                                                                                                                                                                 17

                                                                                                                                                                 18

                                                                                                                                                                 19

                                                                                                                                                                20

                                                                                                                                                                 22

                                                                                                                                                                23

                                                                                                                                                                26

                                                                                                                                                                 27

                                                                                                                                                                28

                                                                                                                                                                29

                                                                                                                                                                 31

                                                                                                                                                                32

                                                                                                                                                                33

                                                                                                                                                                34

                                                                                                                                                                35
                                                                                                                                                                06

                                                                                                                                                                08

                                                                                                                                                                09

                                                                                                                                                                30
                                                                                                                                                                  11

                                                                                                                                                                 21
                                                                                                                                                                07

                                                                                                                                                                25
                                                                                                                                                               20

                                                                                                                                                              20
                                                                                                                                                              20

                                                                                                                                                              20

                                                                                                                                                              20
                                                                                                                                                              20
                                                                                                                                                              20

                                                                                                                                                              20
                                                                                                                                                              20

                                                                                                                                                              20
                                                                                                                                                              20

                                                                                                                                                              20
                                                                                                                                                              20

                                                                                                                                                              20

                                                                                                                                                             20

                                                                                                                                                             20
                                                                                                                                                             20

                                                                                                                                                             20
                                                                                                                                                             20

                                                                                                                                                             20

                                                                                                                                                             20
                                                                                                                                                             20
                                                                                                                                                             20

                                                                                                                                                             20

                                                                                                                                                             20
                                                                                                                                                             20

                                                                                                                                                             20

                                                                                                                                                             20
                                                                                                                                                             20

                                                                                                                                                             20
                                                                                                                                                                                                         Year

                                                                                                                                                 Algoa              Amatole   KZN coastal metropolitan     Luvuvhu and Letaba   Manguang       Mbombela

                                                                                                                                                 Oliphants          Orange    Richards Bay                 Vaal                 Western Cape   Existing yield

                                                                               © Bruce Sutherland
                                                                                                                 Figure 10: Planned increases in yield extracted from all published large-scale
                                                                               (City of Cape Town)
                                                                                                                 reconciliation strategies

14                                                               Water: Market Intelligence Report 2020         Water: Market Intelligence Report 2020                                                                                                    15
2.2.3 State of Municipalities                                             access finance. WASH-FIN14 has recently assessed
in South Africa                                                           the credit-rating of 21 select intermediary
Municipalities play an important role in providing                        (secondary) municipalities, with 18 of them
water and sanitation services, and as such they                           resulting in an investment grading. This indicates
constitute a key market in the water sector.                              that there is greater potential for external
However, there are a number of barriers within                            financing for intermediate municipalities than is
the market, one of which can generally be                                 currently realised. There may be several reasons
described as capacity. An analysis of                                     for this, which could vary among municipalities,
municipalities in South Africa that captures                              but could include low appetite for debt, the
various aspects of ‘capacity’ as they relate to                           long-term nature of infrastructure financing vs
water projects, indicates that only about 23% of                          shorter term political cycles, or technical and
municipalities have a ‘good’ score related to                             managerial staff turnover.
capacity13 to implement water projects (Figure 11).
                                                                          The municipalities with ‘intermediate scores’ on
Similarly, the National Business Initiative                               the Municipal Grading Index in most cases need
(NBI) found that only ~20% of municipalities in                           select interventions to assist them in accessing
South Africa were suitable for public-private                             credit for infrastructure projects. In addition, they
partnerships (PPPs) (NBI 2019). One further                               are well suited to projects that do not necessarily
barrier is that smaller municipalities do not have                        require debts, such as bulk water and wastewater                                                                                                                                                                              B
credit ratings to compete in credit markets to                            treatment efficiency and optimisation retrofits.                                                                                                                                                140

                                                                                                                                                                                                                                               Number of municipalities
                                                                                                                                                                                                                                                                                           57%
                                                                                                                                                                                                                                                                          120
                                                                                                                                                                                                                                                                          100
                                                                                                                                                                                                                                                                          80
                                                                                                                                                                                                                                                                          60                          23%
                                                                                                                                                                                                                                                                                20%
                                                                                                                                                                                                                                                                          40
                                                                                                                                                                                                                                                                          20
                                                                                                                                                                                                                                                                           0
                                                                                                                                                       A                                                                                                                        Poor   Intermediate   Good

                                                                                                                                                Figure 11: Geographical distribution (A) and number of municipalities (B) in South Africa
                                                                                                                                                according to the Municipal Grading Index (UNIDO 2019, GreenCape analysis), indicating Good
                                                                                                                                                (green), Intermediate (yellow) and Poor (red) scores based on capacity criteria (see text and
                                                                                                                                                footnotes for details)15

                                                                                                                         © GreenCape

13
   The criteria used included skills / capacity of senior/executive municipal staff to manage municipal finances effectively and manage
infrastructure projects; financial standing of the municipality to access commercial or development finance institution (DFI) finance; skills
/ capacity among water department staff to successfully motivate for and implement water infrastructure projects.
14                                                                                                                                              15
     https://www.globalwaters.org/WASH-FIN                                                                                                           An interactive version of this map can be found at https://www.greencape.co.za/content/map-mg/.

16                                                                                             Water: Market Intelligence Report 2020           Water: Market Intelligence Report 2020                                                                                                                       17
3
                                                     Policies and regulations
                                                                This section provides an overview of the regulatory environment
                                                                                   in the urban water sector.16

                                              3.1. National legislation                                                     Schedule 1: Generally applies to low volume
                                                                                                                            (reasonable) water use with low impact activities,
                                              3.1.1. The National Water Act16                                               consistent with domestic use (non-commercial
                                              The National Water Act (36 of 1998) (NWA)                                     uses), recreational use, livestock watering, and
                                              provides the legal framework for the effective                                for emergencies. This water use is permissible
                                              and sustainable management of water resources                                 and does not require licensing or registration.17
                                              (including surface water and groundwater) by the                              Residents may use groundwater on their
                                              Department of Human Settlement, Water and                                     properties for reasonable domestic use without a
                                              Sanitation (DHSWS) on behalf of the national                                  licence.18 However, water use entitlement under
                                              government. The NWA gives DHSWS the overall                                   Schedule 1 does not supersede, and is subject to,
                                              responsibility and authority to manage the use of                             any limitation by any other law, ordinance, by-law,
                                              water; protect water quality; allocate water; and                             or regulation set by the responsible authority in
                                              promote inclusive water management.                                           that area.

                                              The NWA, under Section 21, describes 11 different                             Existing lawful use: Legal water use obtained
                                              ‘water use’ activities, which include taking and                              under the Water Act (54 of 1956) two years prior
                                              storing water, reduction of stream flow, waste                                to the commencement of NWA is considered as
                                              discharges and disposals, altering of                                         existing lawful use (ELU), and is subject to terms
                                              watercourses, abstraction of groundwater,                                     and registration under the NWA. However, such
                                              recreation, and any controlled activities that                                users must prove with relevant records that their
                                              detrimentally affect water resources. Section 26                              water use existed before 1998. This must be
                                              regulates water use activities, design, construction                          verified and validated by the DHSWS.
                                              and operation of any waterworks, including the
                                              registration of respective personnel. This is                                 General authorisation: GA replaces the need for
                                              particularly relevant to alternative water supply                             a licence in terms of Section 21 of the NWA as
                                              projects, including water reuse. Generally, a water                           outlined in Government Notice (GN), and is site
                                              use must be licensed, unless it is listed in Schedule                         specific. There is a GN for each water use activity
                                              I, is an existing lawful use (ELU), is permissible                            that sets the limits and circumstances suitable
                                              under a general authorisation (GA), or if the need                            for the issuance of a GA19. Businesses involved in
                                              for a water use licence (WUL) is waived.                                      water use activities that are neither registrable
                                                                                                                            under Schedule 1, nor under ELU, must register
                                              3.1.2. Categories of legal water use                                          the use(s) under a GA or apply for a WUL. The free
                                              The NWA classifies any lawful water use under                                 registration of a GA through DHSWS typically
                                              four categories:                                                              takes a few weeks.

                                              16
                                                   The section does not comprehensively cover all relevant legislation; it highlights key information that may be useful to potential investors.
                                              17
                                                   Although in some cases the local municipality may require registration.
                                              18
                     © Bruce Sutherland            Municipalities may still require registration of boreholes or well points – see Section 3.2.3.
                                              19
                     (City of Cape Town)           https://cer.org.za/virtual-library/legislation/national/water/national-water-act-1998

18   Water: Market Intelligence Report 2020   Water: Market Intelligence Report 2020                                                                                                               19
3.1.5. Other key national legislation                 It should be noted that during emergency
                                                                                                                                    and standards                                         situations (e.g. disasters due to drought) certain
                                                                                                                                    Other key national laws and regulations that may      authorisations can be fast-tracked or are no
                                                                                                                                    be relevant to projects in the water sector include   longer required.
                                                                                                                                    the following:
                                                                                                                                                                                          Further information can be obtained from the
                                                                                                                                    ■   The National Water and Sanitation                 responsible authorities.
                                                                                                                                        Masterplan (2019), while it is not an act or
                                                                                                                                        legislation, is an important guiding document     3.2. Municipal by-laws and tariffs
                                                                                                                                        to inform the development of the water sector     Municipalities have the constitutional
                                                                                                                                        according to national priorities.                 competence to enact laws (known as by-laws) in
                                                                                                                                    ■   The Water Services Act (108 of 1997), is          respect of water and sanitation services. The
                                                                                                                                        relevant to the regulation of water and           Department of Water Affairs and Forestry
                                                                                                                                        sanitation services provided by municipalities.   (DWAF), as it was known at the time, developed
                                                                                                                                    ■   The National Environmental Management             model water services by-laws for municipalities in
                                                                                                                                        Act (107 of 1998) is relevant to environmental    the early 2000s. The model by-laws included
                                                                                                                                        authorisations.                                   provisions to empower municipalities to prevent
                                                                                                                                    ■   The National Environmental Management:            wasteful use of water, impose water restrictions,
                                                                                                                                        Integrated Coastal Management Act (24             require large users to submit annual water audits,
                                                                                                                                        of 2008) regulates the discharge of brine         and specify standards relating to the quality of
                                                                                                                                        to the ocean.                                     fittings. The by-laws contained general clauses
                                                                                                                                    ■   The National Environmental Management:            relating to water efficiency, but left the specifics
                                                                                                                                        Air Quality Act (39 of 2004).                     to the municipality to decide. Several
                                                                                                                                    ■   The Industrial Policy Action Plan (IPAP)          municipalities have developed water by-laws
                                                                                                                                        highlights water and sanitation as a key          based on these model by-laws.
                                                                                                                                        sectoral focus area.
                                                                                                                © GreenCape
                                                                                                                                    ■   The South African National Standard for           Municipal by-laws also include provisions
                                                                                                                                        Drinking Water (SANS 241: 2015).                  relating to the discharge of wastewater and
                                                                                                                                    ■   The Preferential Procurement Policy               industrial effluent to sewer. Such provisions
Water use licence: Applies if the water use                                the Department of Trade and Industry (dti) has               Framework Act (.5 of 2000) provides for           may include the maximum discharge limits for
activities cannot be covered under Schedule 1,                             initiated the process to include these aspects. It is        the Department of Trade, Industry and             various water quality parameters, and the
ELU or GA in accordance with Section 21 of the                             unclear how long this process will take, but draft           Competition (dtic) to designate certain           requirement for an industrial discharge permit.
NWA. A WUL application may take up to 300                                  water efficiency standards are being written.                areas for local production and content. Local     Wastewater that exceeds the water quality limits
working days. The government has committed to                                                                                           content designation is assessed according to      may incur surcharges, or denial of a permit to
ensuring that for the following sectors, a WUL is                          3.1.4. National Environmental                                the South African Bureau of Standards (SABS)      discharge to sewer.
issued within a shorter timeframe: 60 days for                             Management: Waste Act (59 of 2008)                           through the technical specification numbers
agriculture, 80 to 95 days for infrastructure                              The national norms and standards under the Act               SATS 1286:2011 and SANS 1286:2017.
projects from state-owned enterprises and                                  prohibit landfill disposal of:
municipalities, and 120 days for mining.                                   ■ liquid waste with a moisture content >40%,

                                                                              angle of repose 5%)

In terms of design and construction, water                                    and a leachable concentration for total
systems must be consistent with the National                                  dissolved solids of >100 000 mg/l, (ban
Building Regulations (NBRs) under the National                                effective from 2021).
Building Regulations and Building Standards Act,
Act 103 of 1977, which governs all building and                            The Act targets organic waste20 diversion from
construction work in South Africa. At present, the                         landfill of 50% by 2022, and 100% by 2027 (only
NBRs do not include provisions relating to water                           applicable to Western Cape Province)21.
efficiency or alternative water supply; however,

20
     Relevant to sludge produced at agri-processing and municipal WWTWs.
21
     For more details, please refer to the Waste Market Intelligence Report 2020.

20                                                                                         Water: Market Intelligence Report 2020   Water: Market Intelligence Report 2020                                                                     21
3.2.1. Water restrictions                                                   the higher the restriction level, the greater the          3.2.2. Water tariffs                                                    operating revenue (DWS 2017a). Each municipality
 The national Department of Human Settlements,                               limitations imposed. At the time of writing, water         Municipalities either purchase untreated raw                            is responsible for setting its own tariffs, which may
 Water and Sanitation (DHSWS) is responsible for                             restrictions were still in place in most of the            water from DWS, taken directly from dams,                               differentiate between users. Most municipalities
 imposing restrictions on different user categories                          municipalities in the Western Cape. The CCT has            springs, rivers and boreholes, or purchase bulk                         have separate tariffs for residential, commercial,
 in catchments facing water supply constraints.                              recently simplified its restriction levels (and            water from bulk water providers, e.g. Water                             and industrial water users, and provide a free basic
 Municipalities then pass these restrictions on to                           associated water tariffs), so that it effectively has      Boards, which is then treated to a potable                              allowance of water (6kl/month) to indigent
 their water users. Restriction levels impose                                four restriction levels (previously nine levels). The      standard. The CCT owns some dams, and                                   households. In South Africa, around 56% of
 volume limits, time limitations, and bans on                                levels will be pre-determined based on the dam             together with other municipalities in the WCWSS                         households do not pay for water and sanitation
 certain types of water use in order to decrease                             levels in the WCWSS at the end of the                      also purchase raw water from DHSWS-owned                                services (in 2015), because they are either unable
 demand during periods of water insecurity.                                  hydrological year (see Figure 12), and adjusted            dams. The water is then treated in municipal-                           (indigent) or unwilling to do so (StatsSA 2016a).
 Restriction levels and their requirements vary                              annually at that time. Previously this was done on         owned facilities. The 2019/20 consumptive raw
 from municipality to municipality. Most                                     an ad hoc basis. Refer to the CCT website22 for an         water charges (which include water management                           Municipalities generally use a rising block
 municipalities have up to five restriction levels –                         overview of new water restrictions in the CCT.             and infrastructure charges, and a water research                        (stepped) tariff structure, where R/kl tariffs
                                                                                                                                        fund levy) ranged between R0.05/kl and R21.04/kl                        increase as usage increases (see Figure 13).
                                                                                                                                        nationally (DWS 2019). The 2018/19 bulk water                           However, in some cases a fixed volumetric rate
            100%                                                                                                                        tariffs averaged R9.27/kl, varying from R5.04/kl to                     (R/kl) applies, e.g. CCT and eThekwini’s water and
                                                                                                                                        R17.52/kl. The tariff would depend on various                           sanitation tariffs for commercial and industrial
             90%                                                                                                                        factors, such as the availability of water, water                       water users. In addition, the tariffs are linked to
                                                                                                                       Waterwise
             80%
                                                                                                                                        quality, distance of distribution, and cost of                          restriction levels, with tariffs increasing as
                                                                                                                             Level 1    infrastructure finance (DWS 2017a).                                     restrictions increase. Water (Table 2) and
             70%                                                                                                                                                                                                sanitation (Table 3) tariffs (excluding fixed
                                                                                                                             Level 2
                                                                                                                                        Municipalities distribute potable water to their                        charges and surcharges), and tariff structures
Dam Level

             60%
                                                                                                                                        consumers and charge a retail tariff. Revenue from                      vary between metros23, which have an impact on
             50%                                                                                                             Level 3    water sales accounts for around 13% of municipal                        the business case for water technologies.

             40%

             30%
                                                                                                                      Emergency
             20%                                                                                                       Response

             10%

              0%
                   r

                              r

                                        y

                                                  ry

                                                          ch

                                                                 ril

                                                                        ay

                                                                                 ne

                                                                                         ly

                                                                                                  st

                                                                                                               r

                                                                                                                        er

                                                                                                                                    r
                 be

                            be

                                                                                                             be

                                                                                                                                  be
                                      ar

                                                                                       Ju

                                                                                                gu
                                                               Ap
                                                ua

                                                                                                                      ob
                                                        ar

                                                                       M

                                                                               Ju
                                    nu
               em

                          em

                                                                                                           em

                                                                                                                                em
                                                                                              Au

                                                                                                                    ct
                                              br

                                                       M
                                  Ja
             ov

                                                                                                         pt

                                                                                                                              ov
                        ec

                                                                                                                   O
                                            Fe

                                                                                                       Se
            N

                                                                                                                             N
                       D

                                                                       Month

Figure 12: Determination of water restriction levels based on dam levels at end of hydrological year
for the City of Cape Town

                                                                                                                                                                                                                                                      © Bruce Sutherland
                                                                                                                                                                                                                                                      (City of Cape Town)

                                                                                                                                        23
                                                                                                                                           Minimum restriction level tariffs. Residential tariffs are for non-indigent, single dwelling houses (post-paid) at minimum (synonymous
 22                                                                                                                                     with no restriction level; we have used this convention since the exact terminology varies between municipalities). The sanitation charges
    https://www.capetown.gov.za/Family%20and%20home/residential-utility-services/residential-water-and-sanitation-services/Residen-     exclude any industrial effluent surcharges if effluent exceeds discharge limits. Sanitation charges apply to an assumed sewage discharge
 tial-water-restrictions-explained                                                                                                      volume that is linked to water consumption, as shown in Table 3 of the 2019 Water MIR.

22                                                                                            Water: Market Intelligence Report 2020    Water: Market Intelligence Report 2020                                                                                                  23
1400

Table 2: Water tariffs for selected metros (minimum restriction levels in place) for FY 2019/20

                                                                                                                                                  Cost of water per month (R; ex VAT)
                                                                                                                                                                                             1200
                               Cape Town             eThekwini             Tshwane              Ekurhuleni             Johannesburg

                               Monthly     R/kl      Monthly     R/kl      Monthly    R/kl      Monthly      R/kl      Monthly     R/kl                                                      1000
                               use (kl)              use (kl)              use (kl)             use (kl)               use (kl)
                      Step 1   0-6         14.45     0-6         21.39     0-6        11.61     0-6          11.74     0-6         9.10                                                      800
                      Step 2   6-10.5      19.86     6-25        25.30     7-12       16.56     7-15         19.34     6-10        9.66
                      Step 3   10.5-35     26.99     25-30       33.70     13-18      21.75     16-30        23.69     10-15       16.49                                                     600
        Residential

                      Step 4   >35         49.80     30-45       51.98     19-24      25.16     31-45        29.47     15-20       23.99
                      Step 5   –           –         >45         57.15     25-30      28.76     >45          36.35     20-30       32.96                                                     400
                      Step 6   –           –         –           –         31-42      31.08     –            –         30-40       36.51
                      Step 7   –           –         –           –         43-72      33.26     –            –         40-50       46.62                                                     200
                      Step 8   –           –         –           –         >72        35.61     –            –         >50         49.66
                                                                           0-                                                                                                                  0
                      Step 1                                                          24.51     0-5 000      25.37     0-200       42.19
     Commercial &

                                                                           100 000                                                                                                                     Cape Town L1           eThekwini                   Tshwane                 Ekurhuleni             Johannesburg
       Industrial

                               Not                   Not
                                           25.88                 33.35     10 001-              5 001
                      Step 2   stepped               stepped                          23.26                  25.77     >200        44.50
                                                                           100 000              -25 000
                                                                                                                                                                                                                           6 kl           12 kl          25 kl       40 kl
                      Step 3                                               >100 000   21.68     >25 000      26.89     –           –
                                                                                                                                             Figure 13: Comparison of water tariffs for commercial and industrial businesses
                                                                                                                                             across various metros24

                                                                                                                                             The National Water and Sanitation Masterplan                                                                 supply will lead to increased tariffs. Tariffs have
Table 3: Sanitation tariffs for selected metros (minimum restriction levels in place) FY 2019/20                                             developed by the then Department of Water and                                                                been increasing across selected metros at an
                                                                                                                                             Sanitation (now DHSWS), states that water and                                                                annual average of approximately 7% (Figure 14),
                               Cape Town L1          eThekwini             Tshwane              Ekurhuleni             Johannesburg
                                                                                                                                             sanitation tariffs should be determined on the                                                               although future tariff increases are expected to
                               Monthly     R/kl of   Monthly     R/kl of   Monthly    R/kl of   Monthly      R/kl of   Property    R (Res)
                               water       sewage    water       sewage    water      sewage    water        sewage    size (m2)   or R/kl   principle of cost recovery, although historically                                                            be higher. The DHSWS has proposed raw-water
                               use (kl)              use (kl)              use (kl)             use (kl)                           (C&I)     this has not been the case. As the raw water                                                                 price increases of at least 16.5%, effective from
                      Step 1   0-6         12.7      0-6         3.57      0-6        8.21      0-6          16.29     0-300       213.94
                                                                                                                                             quality and quantities decline, the cost of more                                                             March 2020 (SAGNA 2019).
                      Step 2   6-10.5      17.45     6-25        5.95      7-12       11.08     7-15         13.03     301-1000    416.47
                                                                                                                                             expensive alternative water sources to increase
                                                                                                                       1 001
        Residential

                      Step 3   10.5-35     24.51     25-30       11.37     13-18      14.27     16-30        5.54                  630.05
                                                                                                                       -2 000
                      Step 4   >35         38.55     30-45       17.67     19-24      14.27     31-45        5.09      >2 000      907.80
                      Step 5   –           –         >45         19.72     25-30      14.27     >45          3.47      –           –                                                          45
                      Step 6   –           –         –           –         31-42      14.27     –            –         –           –

                                                                                                                                                  Consumptive water tariffs (R/kl; ex VAT)
                      Step 7   –           –         –           –         >42        14.27     –            –         –           –                                                          40
                      Step 1                                                                    0-5 000      10.22
     Commercial
     & Industrial

                                                                                                5 001-                                                                                         35
                      Step 2   Not                   Not                   Not                               5.45      Not
                                           23.25                 9.02                 9.14      25 000                             31.54
                               stepped               stepped               stepped                                     stepped
                                                                                                                                                                                              30
                      Step 3                                                                    >25 000      3.54

                                                                                                                                                                                               25

                                                                                                                                                                                              20

                                                                                                                                                                                               15

                                                                                                                                                                                               10
                                                                                                                                                                                                    Jul-12        Jul-13     Jul-14          Jul-15         Jul-16       Jul-17          Jul-18          Jul-19     Jul-20

                                                                                                                                                                                                             Cape Town                                eThekwini                                Tshwane
                                                                                                                                                                                                             Ekurhuleni                               Johannesburg

                                                                                                                                             Figure 14: Commercial and industrial water tariffs when minimum restrictions (no restrictions)
                                                                                                                                             are in place, for selected metros 2012-2020 (GreenCape analysis)25

                                                                                                                                             24
                                                                                                                                                The figure reflects the consumptive water charges only (excluding any fixed charges or sanitation charges) at minimum or no
                                                                                                                                             restrictions..
                                                                                                                                             25
                                                                                                                                                The figure reflects the consumptive water tariffs only (excluding any fixed charges or sanitation charges) at minimum or no restrictions.
                                                                                                                                             The tariffs are for the first tariff step only.

24                                                                                              Water: Market Intelligence Report 2020       Water: Market Intelligence Report 2020                                                                                                                                          25
3.2.3. Alternative water use                                              3.3. Municipal procurement                                           3.3.1. City of Cape Town procurement                                  For more information on the procurement
The CCT Water Amendment By-law (2018)                                     Municipal procurement is regulated by the                            Companies wishing to do business with CCT must                        processes, please visit the CCT website36. The list
requires that all new developments (C&I or                                Municipal Finance Management Act (56 of 2003)                        first register with the City’s supplier database31,                   of tenders received by the City, and their prices,
residential) install water-saving measures or                             and its regulations, including the Municipal Supply                  the national Central Supplier Database (CSD)32,                       can be viewed here37.
alternative water systems, as well as sub-                                Chain Management Regulations (2005). These                           and then register on the procurement portal33
metering of multi-unit properties (by October                             regulations specify the minimum requirements,                        and/or tender portal34.                                               New Technology Platform
2020 for existing properties). The By-law stipulates                      but municipalities are allowed to apply stricter                                                                                           The CCT has set up a New Technology Platform
that only municipal potable water can be used for                         standards. The Municipal Finance Management                          The CCT publishes Requests for Quotations                             to gain an understanding of innovative water
domestic purposes (drinking, ablution and culinary,                       Act (MFMA) outlines the competitive procurement                      (RFQs) on its portal for goods and services                           technologies in the market. It gives companies
excluding toilets and urinals). However, businesses                       processes, and unsolicited bids are not                              worth less than R200 000, while those exceeding                       the opportunity to present their products and
and residential developments can use alternative                          encouraged. National Treasury also sets further                      R200 000 (VAT included) require a formal bidding                      services to government in a fair manner.
water for domestic purposes if they enter into a                          requirements such as local content under                             (tender) process. Tenders are also advertised in                      For information on how to submit information
contract with CCT to become a Water Services                              designated sectors through the Preferential                          local newspapers and on the national tender                           to the committee, please contact
Intermediary (WSI)26. The contract outlines various                       Procurement Framework Act (5 of 2000).                               portal35. The bidding process for tenders valued                      Water.NewTechnology@capetown.gov.za.
conditions that must be adhered to, including                                                                                                  at more than R10 million is more extensive and
water quality monitoring and compliance.                                  As stipulated by National Treasury (2017), for                       requires additional documentation.
                                                                          projects worth more than R30 000 but less than
                                                                          R50 million (incl. VAT), the price contributes 80
                                                                          points of the total score, and the Broad-based
The CCT Water Amendment By-law                                            Black Economic Empowerment (B-BBEE)28 status
requires that all new developments                                        contributes 20 points. For projects above R50
install water-saving measures or                                          million, the price contributes 90 points and
alternative water systems mainly for                                      B-BBEE status 10 points.
non-domestic purposes. However,
                                                                          Municipalities can also specify prequalification
businesses and residential                                                criteria to limit the competition to certain groups.
developments may use alternative                                          These groups include companies with higher
water for domestic purposes if they                                       B-BBEE scores, exempted micro enterprises
enter into a contract with CCT to                                         (EMEs)29 and qualifying small business
become a Water Services                                                   enterprises (QSEs)30. Municipalities are also
                                                                          allowed to issue directives on emergency
Intermediary (WSI).
                                                                          procurement procedures when a state of disaster
                                                                          has been declared under Section 55(2) of the
                                                                          Disaster Management Act (2002).

To address the absence of national standards for
the installation of alternative water systems (such
as greywater, rainwater, groundwater, and treated
effluent), CCT has developed summary installation
guidelines27. The guidelines outline the required
measures to protect the municipal supply and the
water users within the property, in line with the
CCT’s Water Amendment By-law 2018. Approvals
are required from the CCT for all plumbing
installations for alternative water systems, and a
Certificate of Compliance is required once the
installation has been completed.                                                                                                                                                                                                                            © GreenCape

                                                                                                                                               31
                                                                                                                                                    https://www.capetown.gov.za/City-Connect/Register/Business-and-trade/Register-as-a-supplier
                                                                                                                                               32
26
     http://cct.gov.za/bC2nV                                                                                                                        https://secure.csd.gov.za/
                                                                                                                                               33
27
   http://resource.capetown.gov.za/documentcentre/Documents/Procedures,%20guidelines%20and%20regulations/Guidelines%20for%20                        http://web1.capetown.gov.za/web1/procurementportal
Alternative%20Water%20Installations.pdf                                                                                                        34
                                                                                                                                                    http://web1.capetown.gov.za/web1/TenderPortal
28                                                                                                                                             35
     More information can be found here: www.greencape.co.za/assets/Uploads/Wesgro-B-BBEE-Info-Sheet-2018.pdf                                       https://etenders.treasury.gov.za/
29                                                                                                                                             36
   Enterprises with an annual turnover of less than R10 million, or recently formed or incorporated entities that have been in operation for        http://www.capetown.gov.za/Work%20and%20business/Doing-business-in-the-City
less than one year.                                                                                                                            37
                                                                                                                                                    http://www.capetown.gov.za/Work%20and%20business/Doing-business-with-the-city/Tenders-RFQs-and-supply/Tenders-received
30
     A business with an annual turnover of more than R10 million but less than R50 million.

26                                                                                             Water: Market Intelligence Report 2020          Water: Market Intelligence Report 2020                                                                                        27
You can also read